 Lijuan Dan1†
 Xiuyan Li2†
 Shuanglan Chen1
 Xiaojie You2Dong Wang2Tianyuan Wang3Jia Li4Wenping Liu2*Jie Mu2*Quansheng Feng1,2*
- 1School of Clinical Medicine, Chengdu University of Traditional Chinese Medicine, Chengdu, China
- 2School of Basic Medical Sciences, Chengdu University of Traditional Chinese Medicine, Chengdu, China
- 3Traditional Chinese Medicine Department, 363 Hospital of Chengdu, Chengdu, China
- 4TCM Regulating Metabolic Diseases Key Laboratory of Sichuan Province, Hospital of Chengdu University of Traditional Chinese Medicine, Chengdu, China
Background: The pathological progression from liver injury to fibrosis is a hallmark of liver disease, with no effective strategies to halt this transition. Ginsenoside Rg1 has demonstrated a range of hepatoprotective properties; however, systematic preclinical evidence supporting its therapeutic potential for liver injury and fibrosis remains limited. Purpose. This study evaluated the efficacy and underlying mechanisms of ginsenoside Rg1 in animal models of liver injury and fibrosis, and providing a basis for future clinical investigation.
Methods: A systematic review was conducted on preclinical studies published in PubMed, Web of Science, and Embase databases up to 1 August 2024, adhereing to rigorous quality standards. The methodological quality was assessed using SYRCLE’s risk of bias tool. Meta-analysis and subgroup analysis were performed using Revman 5.4 software, while publication bias was evaluated through funnel plots and Egger’s test in STATA 15.0 software. Additionally, a time-dose interval curve was utilized to assess the dose-response relationship and identify the effective dose of ginsenoside Rg1 for treating liver injury and fibrosis.
Results: Twenty-four trials involving 423 animals were included. The findings indicated that ginsenoside Rg1 significantly improved liver function markers (ALT and AST), reduced pathological indicators associated with liver injury and fibrosis, and lowered liver fibrosis-related markers (α-SMA, HYP, and PCIII). Furthermore, it exhibited beneficial effects on mechanistic indicators of inflammation, oxidative stress, and apoptosis, compared to the control group (P < 0.05). Time-dose interval analysis revealed that the effective dose range of ginsenoside Rg1 was between 4 and 800 mg/kg/d.
Conclusion: Rg1 at a dose of 4–800 mg/kg/d mitigates the progression of liver injury to fibrosis via anti-inflammatory, antioxidative, and anti-apoptotic pathways.
Systematic Review Registration: https://www.crd.york.ac.uk/PROSPERO/, identifier CRD 42024557878.
1 Introduction
Chronic liver disease (CLD) represents a significant global public health concern, resulting from prolonged liver injury (LI) caused by a range of factors, including infections, trauma, drugs, toxins, and physical and chemical agents (Cools et al., 2024; Guo et al., 2022; Parola and Pinzani, 2019). Although the liver possesses regenerative capabilities, chronic injury often leads to scarring and, if not appropriately managed, may progress to liver fibrosis (LF) (Diehl and Chute, 2013; Ruart et al., 2019). LF is a pathological repair response to persistent LI, characterized by excessive accumulation of extracellular matrix (ECM) proteins and structural degradation of liver tissue (Taru et al., 2024; Zhang et al., 2021). Its incidence is rising globally, and if untreated, it can advance to cirrhosis, hepatocellular carcinoma and liver failure (Zhu et al., 2021) (Yu et al., 2021; Zhang et al., 2022). Hepatic stellate cells (HSCs) play a central role in the development of LF (Wan et al., 2024), with their activation being a critical factor in triggering the fibrotic process (Lu et al., 2021). Inflammation, oxidative stress, and apoptosis are pivotal in driving the dynamic progression from LI to LF (Guicciardi and Gores, 2005; Sharma et al., 2024). These factors activate HSCs, inducing their transformation into myofibroblasts and promoting collagen synthesis, which leads to ECM accumulation and the destruction of hepatic architecture. Prolonged injury, results in ECM replacement of parenchymal cells, forming scar tissue, and exacerbating LF (Bataller and Brenner, 2005; Pydyn et al., 2024; Guan et al., 2016).
In recent years, the effectiveness of natural products in halting and reversing the progression of liver disease through various signaling pathways has gained significant attention. Panax ginseng C.A.Meyer (ginseng), a perennial herb from the family Wujiaceae and the genus Ginseng, has been used in China for over 2,000 years (Li J. et al., 2022). This traditional and highly valued Chinese herbal medicine is considered the “king of all herbs.” According to The Divine Husbandman’s Classic of the Hundred Herbs, ginseng is classified as a superior product that promotes longevity, replenishes vital energy, and can be consumed over extended periods for health benefits. Ginsenosides, the primary bioactive compounds in ginseng, are chiefly responsible for its pharmacological effects. To date, over 100 ginsenosides have been isolated from Ginseng species, with Rb1, Rb2, Rc, Rd, Rf, and Rg1 accounting for more than 90% of the total ginsenoside content (Alsamman et al., 2018). Among these, Rg1 is one of the most abundant and potent steroidal saponins (Gao et al., 2017a). Ginsenoside Rg1 (C42H72O14, Rg1, Figure 1) plays a key therapeutic role in the progression of LI to LF, including mitigating inflammatory responses and oxidative damage in the early stages and reducing aberrant ECM accumulation following repeated injury (Zhou et al., 2024). Rg1 has also been shown to possess broad therapeutic and prophylactic effects in the central nervous system (Yang et al., 2023), endocrine system (Alolga et al., 2020), and various liver diseases. Its mechanisms of action are believed to involve anti-inflammatory, anti-apoptotic, and antioxidant properties. Despite several preclinical studies highlighting the pharmacological benefits of Rg1 in LI and LF, its comprehensive effects and mechanisms in the dynamic progression from LI to LF remain insufficiently explored. Therefore, the present study aims to investigate the therapeutic effects and underlying mechanisms of Rg1 in the progression from LI to LF, providing essential evidence and preliminary insights for future clinical investigation.
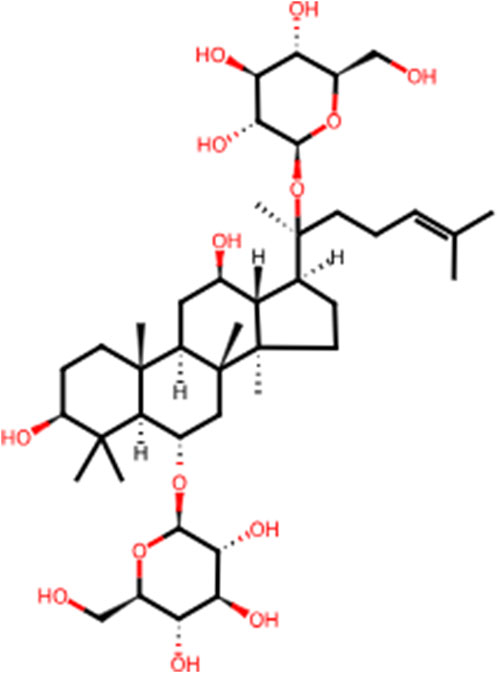
Figure 1. The chemical structure of Rg1.
2 Materials and methods
This meta-analysis adhere to the PROSPERO protocol (CRD 42024557878) and was conducted in strict compliance with PRISMA guidelines.
2.1 Search strategy
A comprehensive search of three databases (PubMed, Embase, and Web of Science) was performed to identify eligible studies investigating the use of Rg1 in LI and LF up to 1 August 2024. The search utilized a combination of subject specific and free text terms. The detailed search strategies for PubMed database are outlined in Supplementary Table S1.
2.2 Eligibility criteria
The inclusion criteria were as follows: 1) use of LI or LF as the experimental model; 2) establishment of LI or LF by any method; 3) treatment group receiving any dose of Rg1; 4) if multiple dose groups were included, only the highest dose was selected; 5) primary outcome indicators for LI are: histological score, alanine aminotransferase (ALT) and aminotransferase (AST); secondary outcome indicators for LI are: malondialdehyde (MDA), superoxide dismutase (SOD), glutathione (GSH), kelch-like ECH-associated protein 1 (Keap1), nuclear factor erythroid 2-related factor 2 (Nrf2), glutamate-cysteine ligase modifier subunit (GCLM), glutamate-cysteine ligase catalytic subunit (GCLC), NADH quinone oxidoreductase 1 (NQO1), tumor necrosis factor-α (TNF-α), interleukin 6 (IL-6), interleukin-1β (IL-1β), B-cell lymphoma-2 (Bcl-2), and BCL2-associated X (BAX); 6) primary outcome indicators for LF are: fibrosis score; secondary outcome indicators of LF are hydroxyproline (HYP), α-smooth muscle actin (α-SMA), procollagen type III (PCIII), ALT, and AST.
Exclusion criteria were as follows: 1) non-in vivo studies; 2) non-LI or non-LF models; 3) duplicate publications; 4) non-rodent animal models; 5) studies without Rg1 treatment or lacking a control group; 6) reviews, abstracts, comments, and letters.
2.3 Data extraction
Two reviewers (Xiuyan Li and Xiaojie You) independently cconducted the literature search, screened studies, and extracted data based on the inclusion and exclusion criteria, with cross-validation of the data. In cases of disagreement, a third reviewer was involved in the resolution through joint discussion. Data extraction was performed using an Excel sheet that captured the following: 1) basic article details, including the title, first author, and publication year; 2) characteristics of the experimental animals: species (mice or rats), sex (male or female), sample size, weight, and group distribution; 3) modeling methods; 4) intervention details, including drug nature, administration, dosage, and duration; 5) outcome indicators and group differences. The extracted data were compiled and presented in Table 1. For studies with multiple time points, only data from the final time point were included. In cases where different doses of Rg1 were used, only the highest dose was considered. For studies where data were presented graphically, numerical values were extracted using digital ruler software. When data were missing or unclear, the authors were contacted via email for clarification.
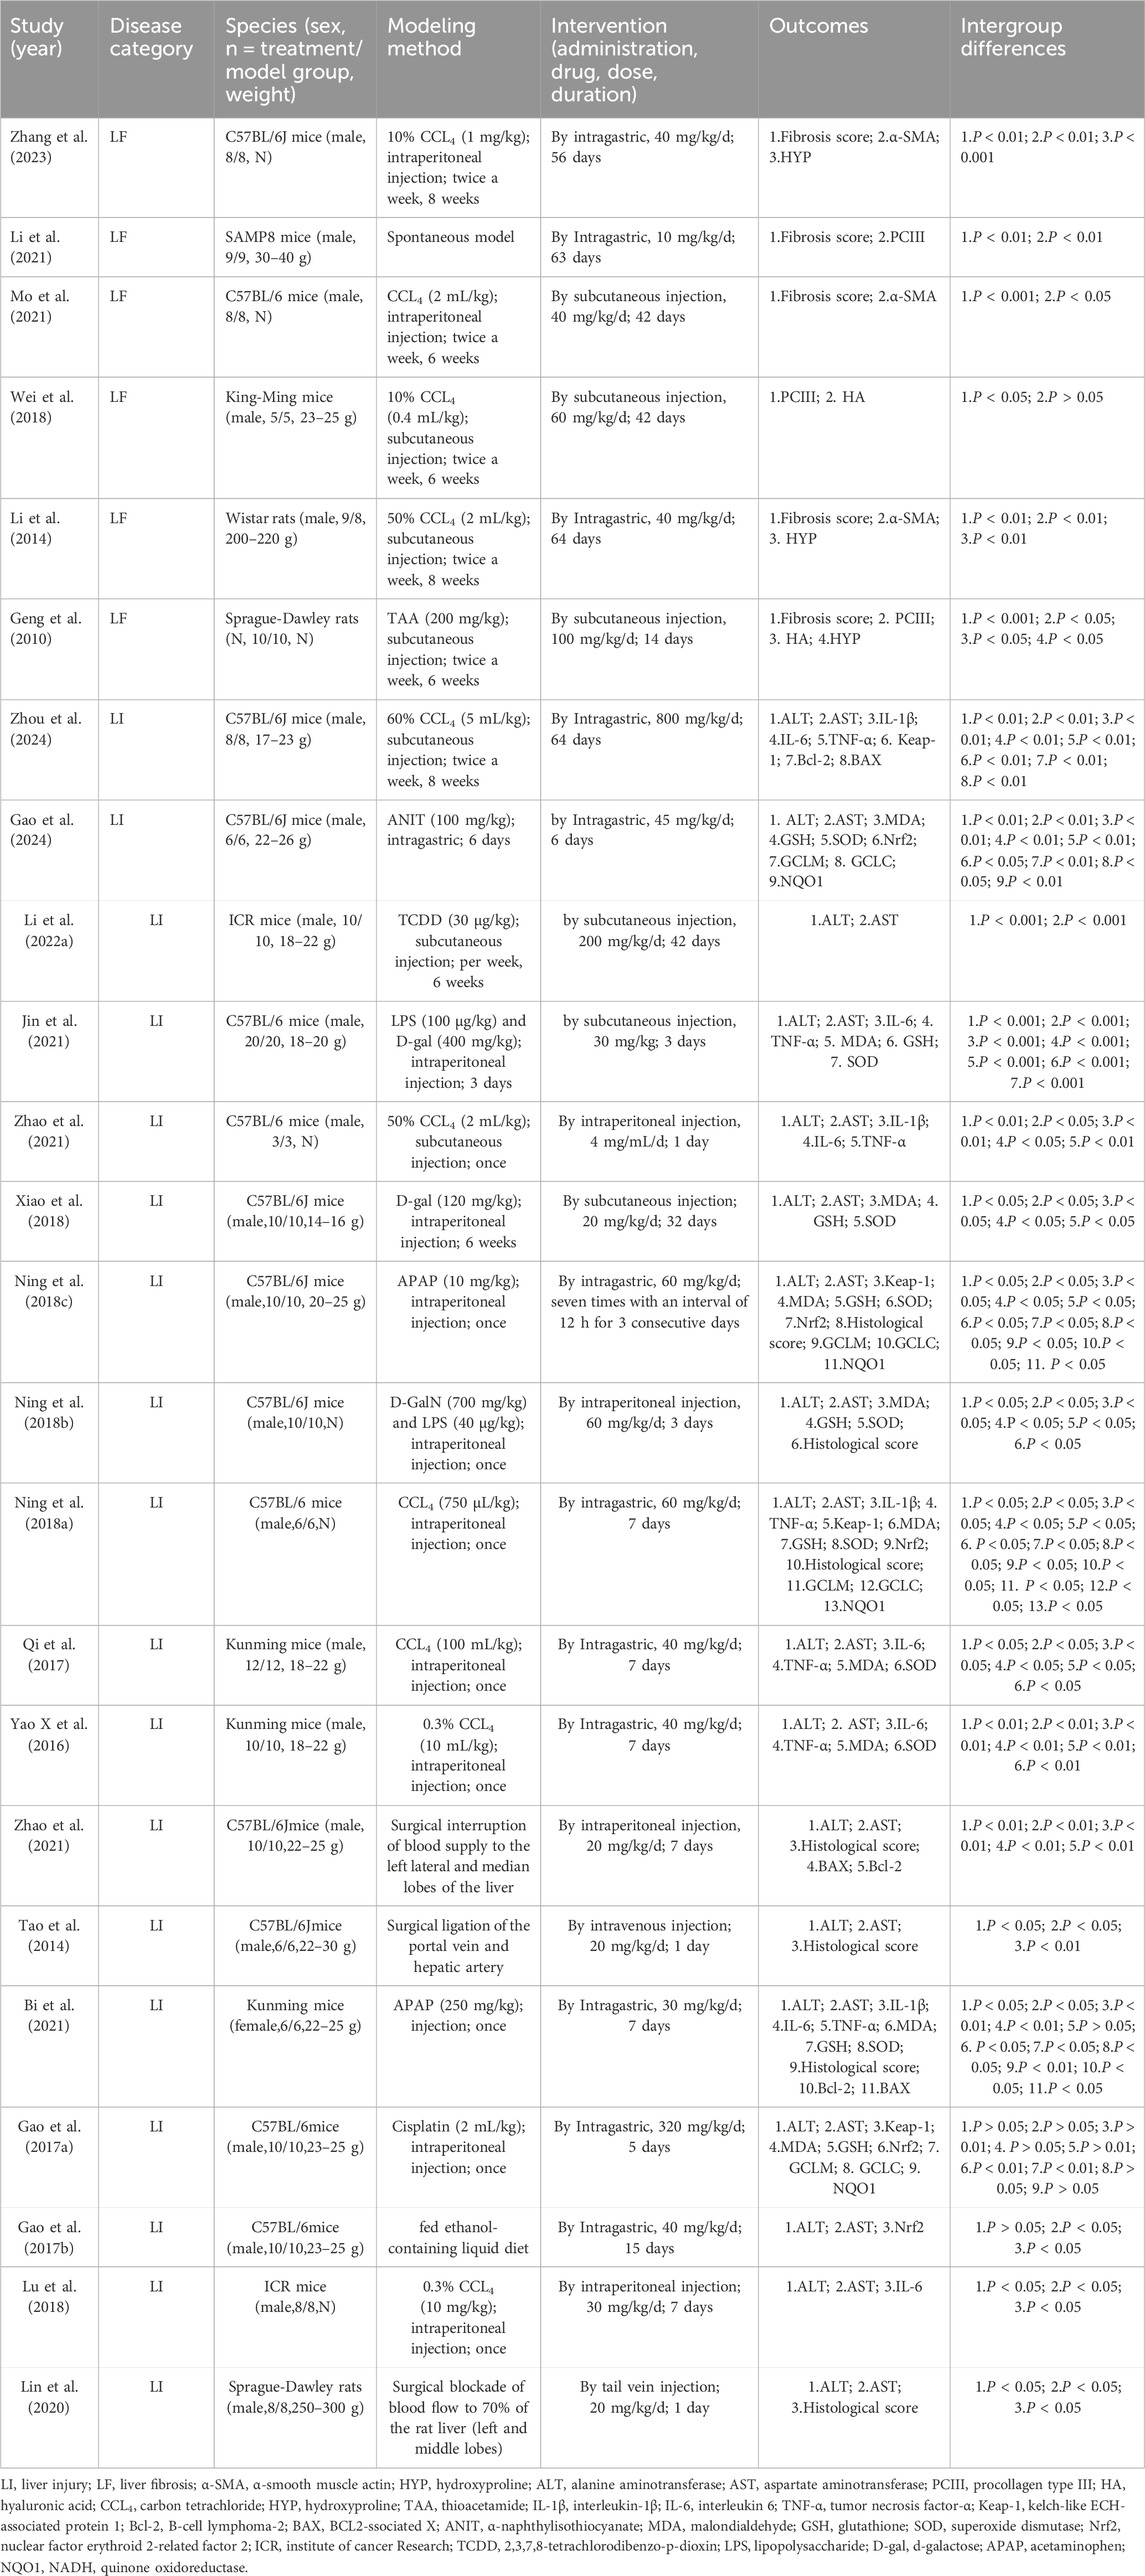
Table 1. Basic characteristics of the 24 included studies.
2.4 Risk-of-bias assessment
Risk assessment of the included studies was conducted using the risk assessment tool developed by the Systematic Review Center for Laboratory Animal Experiments (SYRCLE) to evaluate the methodological quality of studies on Rg1 for the treatment of liver injury (LI) and liver fibrosis (LF). The evaluation was based on ten assessment items: (1) sequence generation, (2) baseline characterization, (3) allocation concealment, (4) randomization of animal placement, (5) blinding (animal keepers and investigators), (6) randomization of outcome assessment, (7) blinding (outcome evaluators), (8) reporting of incomplete data, (9) reporting of selective outcomes, and (10) other sources of bias. Each study was independently evaluated by two trained individuals, and disagreements were resolved through discussion with the authors of the article.
2.5 Statistical analysis
Meta-analysis of the data from the included studies was performed using R 5.4.1 software. Pooled statistics for outcomes were calculated using standardized mean differences (SMDs) and corresponding 95% confidence intervals (95% CI). Heterogeneity was accessed quantitatively using I2. If no statistical heterogeneity was observed (I2 ≤ 50%), a fixed-effects model was used. In the presence of statistical heterogeneity (I2 > 50%), a random-effects model was employed. A subsequent subgroup analysis was performed to identify potential sources of heterogeneity categorized by: publication year (before and after 2019), rodent species (rats and mice), drug dosage (<40 mg and ≥40 mg), modeling methods (toxic, surgical, and nutritional), mode of administration (intragastric and injection), and duration of treatment (<7 days and ≥7 days). Time-dose interval analysis was carried out using Origin 2021 software. P < 0.05 was considered statistically significant.
2.6 Sensitivity analysis
For results exhibiting high heterogeneity, sensitivity analysis was conducted to assess the robustness of the results and to potentially identify the sources of heterogeneity.
2.7 Publication bias
Possible publication bias was evaluated using funnel plots and Egger’s test. Publication bias was visually assessed by using the funnel plot and quantitatively analyzed using Egger’s test.
3 Results
3.1 Identified and eligible studies
A total of 260 articles were retrieved from three databases via keyword searches: 20 from PubMed, 126 from Web of Science, and 114 from Embase. After automatic weight removal in EndNote, 184 documents remained. Title and abstract screening excluded 32 studies, leaving 152 for further review. Full-text evaluation led to the exclusion of an additional 128 articles, resulting in 24 studies that met the inclusion criteria. The detailed selection process is depicted in Figure 2.
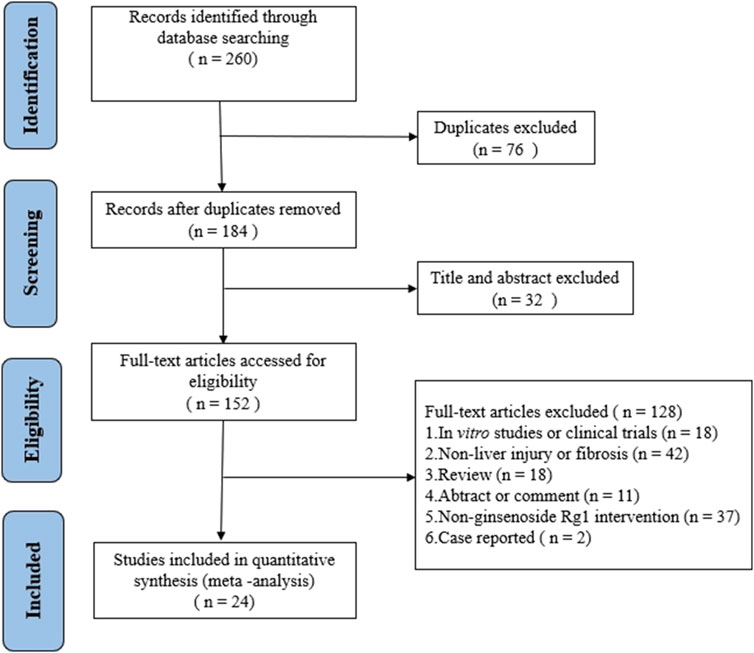
Figure 2. Flow chart of the meta-analysis selection process.
3.2 Characteristics of included studies
Twenty-four animal studies (Bi et al., 2021; Gao et al., 2024; Gao et al., 2016; Gao et al., 2017b; Geng et al., 2010; Jin et al., 2021; Li J. et al., 2022; Li et al., 2014; Li et al., 2021; Lin et al., 2020; Lu et al., 2018; Mo et al., 2021; Ning et al., 2018a; Ning et al., 2018b; Ning et al., 2018c; Qi et al., 2017; Tao et al., 2014; Wei et al., 2018; Xiao et al., 2018; Xin et al., 2016; Zhang et al., 2023; Zhang et al., 2015; Zhao et al., 2021; Zhou et al., 2024) conducted between 2010 and 2024 were included. A total of 423 animals from LI and LF models were enrolled, with 212 in the experimental group and 211 in the model group. All studies involved rats or mice, including 14 studies (Gao et al., 2024; Gao et al., 2016; Gao et al., 2017a; Jin et al., 2021; Mo et al., 2021; Ning et al., 2018a; Ning et al., 2018b; Ning et al., 2018c; Tao et al., 2014; Xiao et al., 2018; Zhang et al., 2023; Zhang et al., 2015; Zhao et al., 2021; Zhou et al., 2024) using C57BL/6J mice (250/423,59.1%); 1 study (Li et al., 2021) using SAMP8 mice (18/423, 4.2%); 4 studies (Bi et al., 2021; Qi et al., 2017; Wei et al., 2018; Xin et al., 2016) using Kunming mice (66/423, 15.6%); 1 study (Li et al., 2014) using Wistar rats (17/423, 4%); 2 studies (Geng et al., 2010; Lin et al., 2020) using Sprague-Dawley rats (36/423, 8.5%); 2 studies (Li et al., 2022a; Lu et al., 2018) using ICR mice (36/423, 8.5%). 23 studies (Gao et al., 2017a; Geng et al., 2010; Jin et al., 2021; Li et al., 2022a; Li et al., 2014; Li et al., 2021; Lin et al., 2020; Lu et al., 2018; Mo et al., 2021; Ning et al., 2018a; Ning et al., 2018b; Ning et al., 2018c; Qi et al., 2017; Tao et al., 2014; Wei et al., 2018; Xiao et al., 2018; Xin et al., 2016; Zhang et al., 2023; Zhang et al., 2015; Zhao et al., 2021; Zhou et al., 2024) used male animals, while 1 study (Bi et al., 2021) utilized female animals. 17 studies (Bi et al., 2021; Gao et al., 2024; Gao et al., 2016; Gao et al., 2017b; Jin et al., 2021; Li et al., 2022a; Li et al., 2014; Li et al., 2021; Lin et al., 2020; Ning et al., 2018a; Qi et al., 2017; Tao et al., 2014; Wei et al., 2018; Xiao et al., 2018; Xin et al., 2016; Zhang et al., 2015; Zhou et al., 2024) provided animal weight data. In constructing LI and LF models, 19 studies (Mo et al., 2021; Wei et al., 2018; Zhang et al., 2023) (Bi et al., 2021; Gao et al., 2024; Gao et al., 2017a; Geng et al., 2010; Jin et al., 2021; Li et al., 2022a; Li et al., 2014; Lu et al., 2018; Ning et al., 2018a; Ning et al., 2018b; Ning et al., 2018a; Qi et al., 2017; Xiao et al., 2018; Xin et al., 2016; Zhao et al., 2021; Zhou et al., 2024) used toxic agents, including carbon tetrachloride (CCL4), thioacetamide (TAA), α-naphthylisothiocyanate (ANIT), 2,3,7,8-tetrachlorodibenzo-p-dioxin (TCDD), d-galactose (D-gal), cisplatin, and acetaminophen (APAP), three studies (Lin et al., 2020; Tao et al., 2014; Zhang et al., 2015) employed surgical methods, 1 study (Li et al., 2021) used genetic induction, and 1 study (Gao et al., 2016) utilized nutritional factors. The dosing duration ranged from 1 day to 64 days, with Rg1 dose ranging from 4 mg/kg/d to 800 mg/kg/d. For primary outcome indicators of LI and LF, 18 studies (Zhou et al., 2024) (Gao et al., 2024; Li J. et al., 2022) (Bi et al., 2021; Gao et al., 2016; Gao et al., 2017a; Jin et al., 2021; Lin et al., 2020; Lu et al., 2018; Ning et al., 2018a; Ning et al., 2018b; Ning et al., 2018c; Qi et al., 2017; Tao et al., 2014; Xiao et al., 2018; Xin et al., 2016; Zhang et al., 2015; Zhao et al., 2021) reported ALT levels, 18 studies (Zhou et al., 2024) (Gao et al., 2024; Li et al., 2022a) (Bi et al., 2021; Gao et al., 2016; Gao et al., 2017a; Jin et al., 2021; Lin et al., 2020; Lu et al., 2018; Ning et al., 2018a; Ning et al., 2018b; Ning et al., 2018c; Qi et al., 2017; Tao et al., 2014; Xiao et al., 2018; Xin et al., 2016; Zhang et al., 2015; Zhao et al., 2021) reported AST levels, 7 studies (Bi et al., 2021; Lin et al., 2020; Ning et al., 2018b; Ning et al., 2018c; Tao et al., 2014; Zhang et al., 2015; Ning et al., 2018a) documented histological score, and 5 studies (Geng et al., 2010; Li et al., 2014; Li et al., 2021; Mo et al., 2021; Zhang et al., 2023) included fibrosis score. Several studies also reported fibrosis-related markers such as PCIII, HYP, and α-SMA. Inflammatory markers, including IL-6 (Bi et al., 2021; Jin et al., 2021; Lu et al., 2018; Qi et al., 2017; Xin et al., 2016; Zhao et al., 2021; Zhou et al., 2024), IL-1β (Bi et al., 2021; Ning et al., 2018b; Zhao et al., 2021; Zhou et al., 2024), and TNF-α (Bi et al., 2021; Jin et al., 2021; Ning et al., 2018b; Qi et al., 2017; Xin et al., 2016; Zhao et al., 2021; Zhou et al., 2024) were noted in some studies. Additionally, oxidative stress related indicators including MDA (Bi et al., 2021; Gao et al., 2024; Gao et al., 2017a; Jin et al., 2021; Ning et al., 2018a; Ning et al., 2018b; Ning et al., 2018c; Qi et al., 2017; Xiao et al., 2018; Xin et al., 2016), SOD (Bi et al., 2021; Gao et al., 2024; Jin et al., 2021; Ning et al., 2018a; Ning et al., 2018b; Ning et al., 2018c; Qi et al., 2017; Xiao et al., 2018; Xin et al., 2016), and GSH (Bi et al., 2021; Gao et al., 2024; Gao et al., 2017b; Jin et al., 2021; Ning et al., 2018a; Ning et al., 2018b; Ning et al., 2018c; Xiao et al., 2018), were also reported in several studies. Additionally, oxidative stress mechanisms related indicators, including Keap1 (Gao et al., 2017b; Ning et al., 2018a; Ning et al., 2018b; Zhou et al., 2024), Nrf2 (Gao et al., 2024; Gao et al., 2016; Gao et al., 2017a; Ning et al., 2018a; Ning et al., 2018b), GCLC (Q. Gao et al., 2024; Gao et al., 2017a; Ning et al., 2018a; Ning et al., 2018b), GCLM (Gao et al., 2024; Gao et al., 2017a; Ning et al., 2018a; Ning et al., 2018b), and NQO1 (Gao et al., 2024; Gao et al., 2016; Ning et al., 2018a; Ning et al., 2018b) were documented. Apoptosis markers such as Bcl-2 (Bi et al., 2021; Zhang et al., 2015; Zhou et al., 2024) and BAX (Bi et al., 2021; Zhang et al., 2015; Zhou et al., 2024) were included in some studies. Detailed study characteristics are summarized in Table 1.
3.3 Research quality
The 24 included articles were rigorously accessed for quality, with all studies scoring moderately or higher. One study (Zhang et al., 2023) received a score of 5, seven studies (Gao et al., 2024; Gao et al., 2017a; Geng et al., 2010; Mo et al., 2021; Ning et al., 2018b; Zhang et al., 2015; Zhao et al., 2021) scored 6, and sixteen studies (Bi et al., 2021; Gao et al., 2016; Jin et al., 2021; Li et al., 2022a; Li et al., 2014; Li et al., 2021; Lin et al., 2020; Lu et al., 2018; Ning et al., 2018a; Ning et al., 2018b; Qi et al., 2017; Tao et al., 2014; Wei et al., 2018; Xiao et al., 2018; Xin et al., 2016; Zhou et al., 2024) scored 7, for a mean quality score of 66.25%. Notably, seven studies (Gao et al., 2024; Gao et al., 2017b; Geng et al., 2010; Ning et al., 2018b; Zhang et al., 2023; Zhang et al., 2015; Zhao et al., 2021) did not report randomization, and two studies (Mo et al., 2021; Zhang et al., 2023) failed to datail the housing conditions of the experimental animals. All studies reported baseline characteristics and conducted randomized outcome analyses, with no instance of incomplete or selectively reported data, and no other sources of bias were identified. However, certain limitation were noted, including the absence of details on allocation concealment, blinding of animal caretakers and investigators, and blinding of outcome assessors. Overall, after quality assessment, the literature was deemed suitable for meta-analysis (Supplementary Table S2).
3.4 Effects of Rg1 on LI
3.4.1 Primary outcomes
3.4.1.1 Effect of Rg1 on LI histological score
Analysis of seven studies (Bi et al., 2021; Lin et al., 2020; Ning et al., 2018b; Ning et al., 2018c; Tao et al., 2014; Zhang et al., 2015; Ning et al., 2018b) involving 100 animals, which reported histological scores, demonstrated that the Rg1 group significantly reduced histological scores compared to the control group [SMD: −6.98 (95% CI: −9.49, −4.47), P < 0.00001, I2 = 77%, Figure 3].
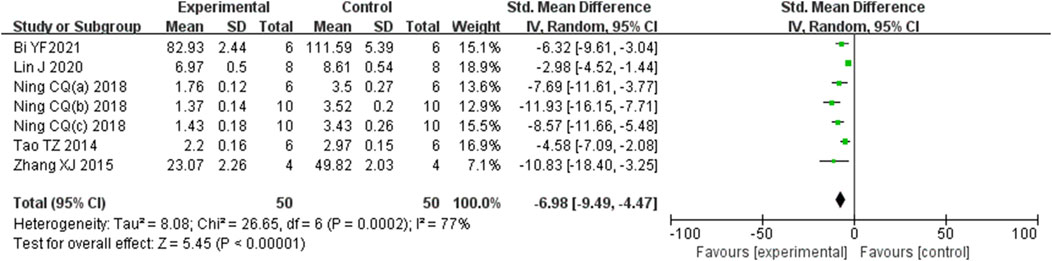
Figure 3. Forest plot: effect of Rg1 on histological score.
3.4.1.2 Effect of Rg1 on LI ALT level
Analysis of eighteen studies (Zhou et al., 2024) (Gao et al., 2024; Li J. et al., 2022) (Bi et al., 2021; Gao et al., 2016; Gao et al., 2017a; Jin et al., 2021; Lin et al., 2020; Lu et al., 2018; Ning et al., 2018a; Ning et al., 2018b; Ning et al., 2018c; Qi et al., 2017; Tao et al., 2014; Xiao et al., 2018; Xin et al., 2016; Zhang et al., 2015; Zhao et al., 2021) involving 298 animals, reporting ALT levels, indicated that the Rg1 group significantly reduced ALT compared to the control group [SMD: −3.49 (95% CI: −4.54, −2.43), P < 0.00001, I2 = 86%, Figure 4].
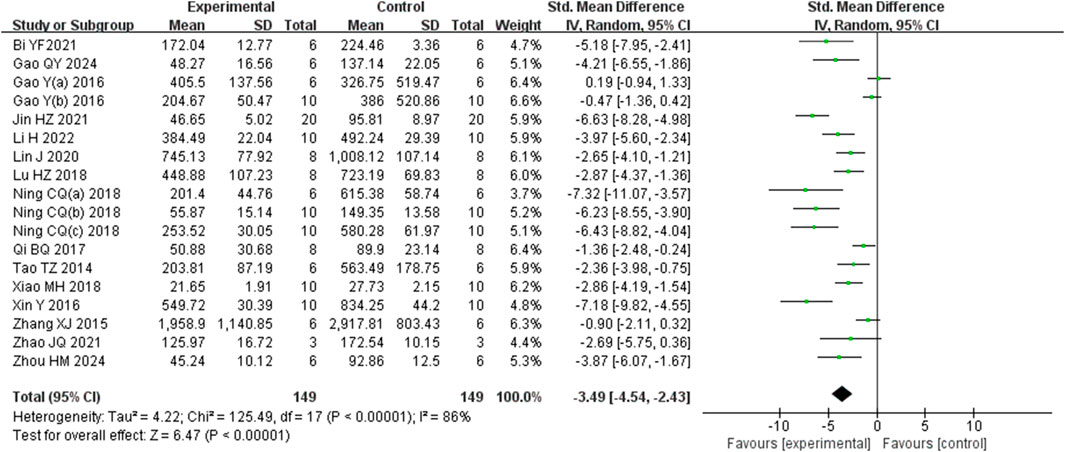
Figure 4. Forest plot: effect of Rg1 on ALT.
3.4.1.3 Effect of Rg1 on LI AST level
Analysis of eighteen studies (Zhou et al., 2024) (Gao et al., 2024; Li et al., 2022a) (Bi et al., 2021; Gao et al., 2016; Gao et al., 2017b; Jin et al., 2021; Lin et al., 2020; Lu et al., 2018; Ning et al., 2018a; Ning et al., 2018b; Ning et al., 2018c; Qi et al., 2017; Tao et al., 2014; Xiao et al., 2018; Xin et al., 2016; Zhang et al., 2015; Zhao et al., 2021) involving 286 animals reporting AST levels, indicted that the Rg1 group significantly reduced AST compared to the control group (SMD: −4.86 [95% CI: −6.17, −3.56], P < 0.00001, I2 = 85%, Figure 5).
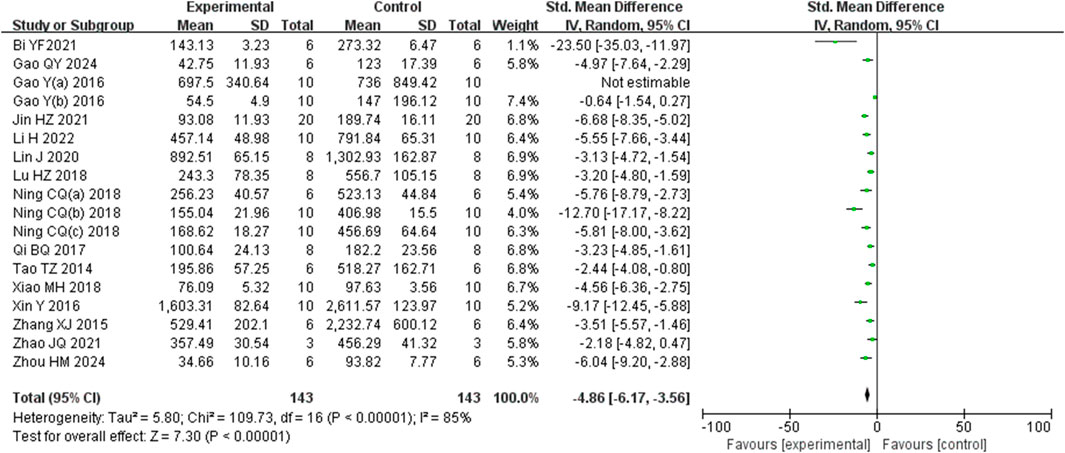
Figure 5. Forest plot: effect of Rg1 on AST.
3.4.2 Secondary outcomes
3.4.2.1 Inflammation levels
Analysis of seven studies (Bi et al., 2021; Jin et al., 2021; Lu et al., 2018; Qi et al., 2017; Xin et al., 2016; Zhao et al., 2021; Zhou et al., 2024) involving 146 animals reporting IL-6 levels revealed that the Rg1 group significantly reduced IL-6 compared to the control group [SMD: −5.98 (95% CI: −9.03, −2.93), P = 0.0001, I2 = 93%, Figure 6A]. Analysis of four studies (Bi et al., 2021; Ning et al., 2018b; Zhao et al., 2021; Zhou et al., 2024) involving 42 animals reporting IL-1β levels showed that the Rg1 group significantly reduced IL-1β compared to the control group [SMD: −4.31 (95% CI: −5.68, −2.94), P < 0.00001, I2 = 39%, Figure 6B]. Analysis of seven studies (Bi et al., 2021; Jin et al., 2021; Ning et al., 2018b; Qi et al., 2017; Xin et al., 2016; Zhao et al., 2021; Zhou et al., 2024) involving 118 animals reporting TNF-α levels indicated that the Rg1 group significantly reduced TNF-α compared to the control group [SMD: −11.39 (95% CI: −16.60, −6.18), P < 0.0001, I2 = 92%, Figure 6C].
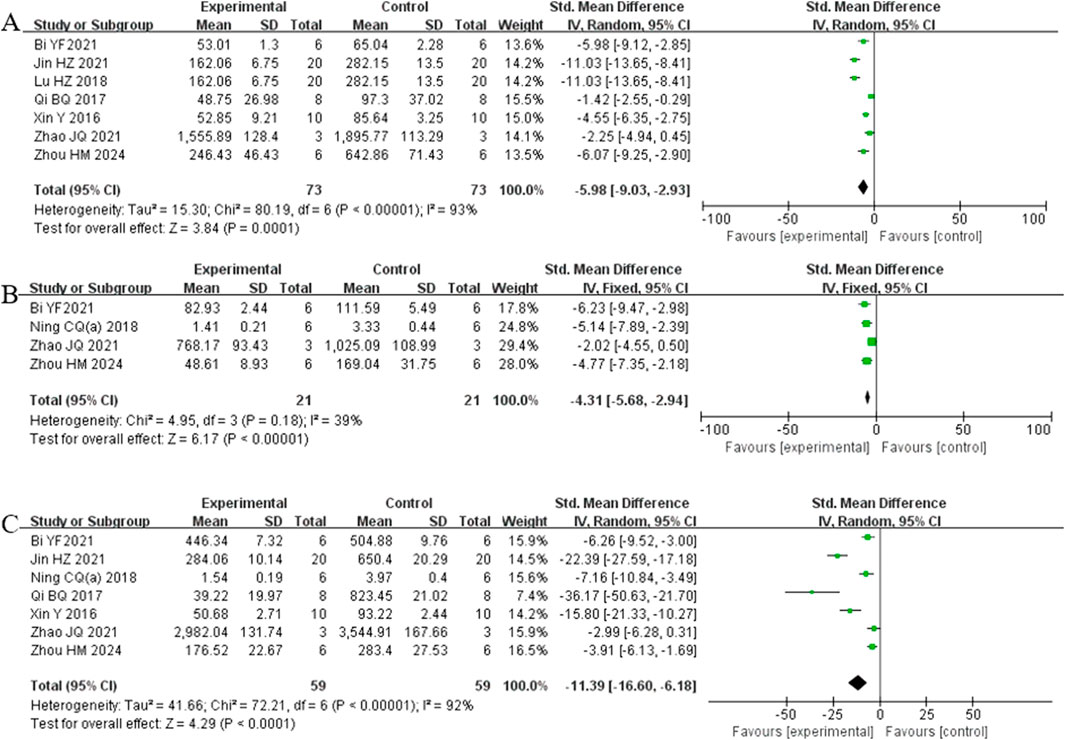
Figure 6. Forest plot: effect of Rg1 on (A) IL-6, (B) IL-1β, and (C) TNF-α.
3.4.2.2 Oxidative stress index
Analysis of ten studies (Bi et al., 2021; Gao et al., 2024; Gao et al., 2017b; Jin et al., 2021; Ning et al., 2018a; Ning et al., 2018b; Ning et al., 2018c; Qi et al., 2017; Xiao et al., 2018; Xin et al., 2016) involving 192 animals reporting MDA levels demonstrated that the Rg1 group significantly reduced MDA compare to the control group [SMD: −4.17 (95% CI: −5.75, −2.58), P < 0.00001, I2 = 89%, Figure 7A]. Analysis of nine studies (Y. Bi et al., 2021; Gao et al., 2024; Jin et al., 2021; Ning et al., 2018a; Ning et al., 2018b; Ning et al., 2018c; Qi et al., 2017; Xiao et al., 2018; Xin et al., 2016) involving 192 animals reporting SOD levels revealed that the Rg1 group significantly increased SOD compared to the control group [SMD: 4.29 (95% CI: 2.73, 5.85), P < 0.00001, I2 = 87%, Figure 7B]. Analysis of eight studies (Bi et al., 2021; Gao et al., 2024; Gao et al., 2017a; Jin et al., 2021; Ning et al., 2018a; Ning et al., 2018b; Ning et al., 2018c; Xiao et al., 2018) involving 156 animals reporting GSH levels showed that Rg1 group significantly increased GSH compared to the control group [SMD: 5.97 (95% CI: 3.33, 8.60), P < 0.00001, I2 = 94%, Figure 7C].
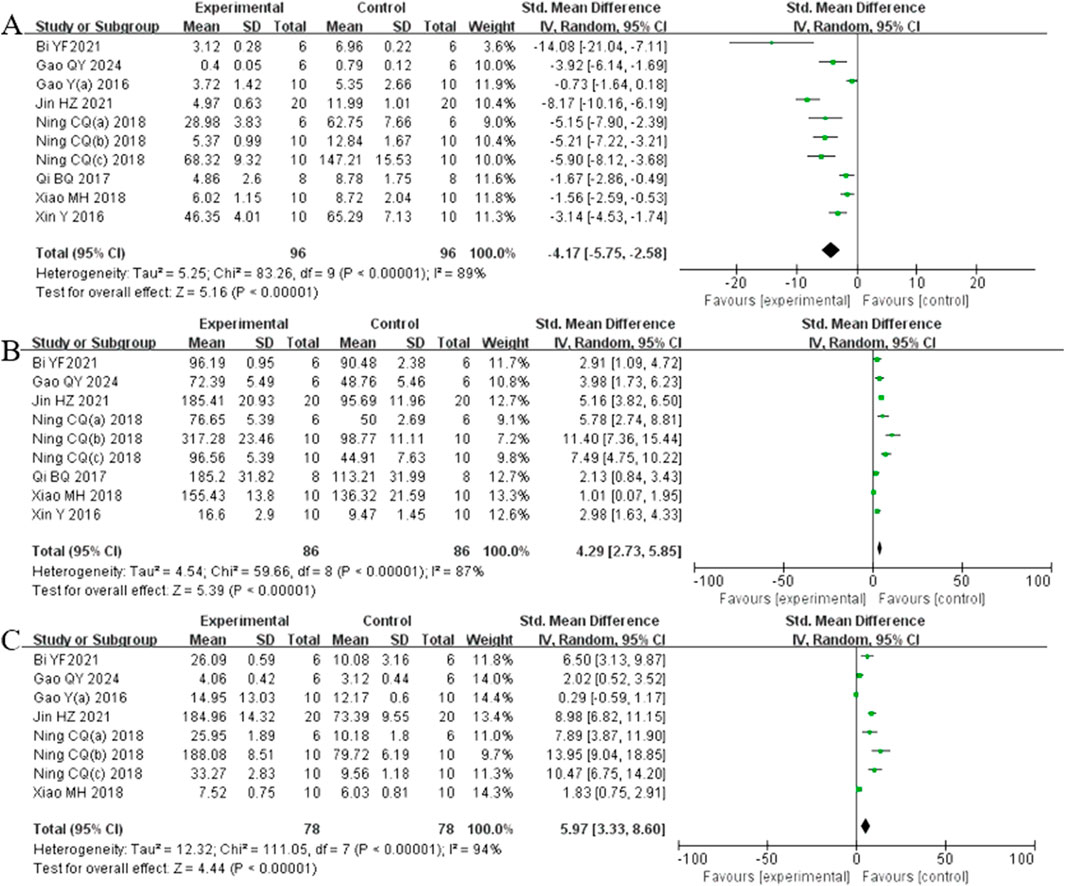
Figure 7. Forest plot: effect of Rg1 on (A) MDA, (B) SOD, and (C) GSH.
3.4.2.3 Indicators related to oxidative stress mechanisms
Analysis of four studies (Gao et al., 2017a; Ning et al., 2018a; Ning et al., 2018b; Zhou et al., 2024) involving 60 animals reporting Keap1 levels demonstrated that the Rg1 group significantly reduced Keap1 compared to the control group [SMD: −3.27 (95% CI: −5.95, −0.59), P = 0.02, I2 = 88%, Figure 8A]. Analysis of five studies (Gao et al., 2024; Gao et al., 2016; Gao et al., 2017a; Ning et al., 2018a; Ning et al., 2018b) involving 84 animals reporting Nrf2 levels showed that the Rg1 group significantly increased Nrf2 compared to the control group [SMD: 3.20 (95% CI: 1.06, 5.35), P = 0.003, I2 = 89%, Figure 8B]. Analysis of four studies (Gao et al., 2024; Gao et al., 2017b; Ning et al., 2018a; Ning et al., 2018b) involving 64 animals reporting GCLM levels revealed that the Rg1 group significantly increased GCLM compared to the control group [SMD: 4.54 (95% CI: 1.52, 7.55), P = 0.003, I2 = 89%, Figure 8C]. Analysis of four studies (Q. Gao et al., 2024; Gao et al., 2017a; Ning et al., 2018a; Ning et al., 2018b) involving 64 animals reporting GCLC levels indicated that the Rg1 group significantly increased GCLC compared to the control group [SMD: 5.69 (95% CI: 1.97, 9.41), P = 0.003, I2 = 92%, Figure 8D]. Analysis of four studies (Q. Gao et al., 2024; Gao et al., 2016; Ning et al., 2018a; Ning et al., 2018b) involving 64 animals reporting NQO1 levels showed that the Rg1 group significantly increased NQO1 compared to the control group [SMD: 4.12 (95% CI: 1.31, 6.93), P = 0.004, I2 = 88%, Figure 8E].

Figure 8. Forest plot: effect of Rg1 on (A) Keap1, (B) Nrf2, (C) GCLM, (D) GCLC, and (E) NQO1.
3.4.2.4 Apoptosis index
Analysis of three studies (Bi et al., 2021; Zhang et al., 2015; Zhou et al., 2024) involving 32 animals reporting Bcl-2 levels revealed that the Rg1 group significantly increased Bcl-2 compared to the control group [SMD: 3.71 (95% CI: 0.77, 6.65), P = 0.01, I2 = 75%, Figure 9A]. Analysis of three studies (Bi et al., 2021; Zhang et al., 2015; Zhou et al., 2024) involving 32 animals reporting BAX levels indicated that Rg1 group significantly decreased BAX compared to the control group [SMD: −4.65 (95% CI: −8.03, −1.27), P = 0.007, I2 = 76%, Figure 9B].

Figure 9. Forest plot: effect of Rg1 on (A) Bcl-2 and (B) BAX.
3.5 Effects of Rg1 on LF
3.5.1 Primary outcomes
3.5.1.1 Effect of Rg1 on liver fibrosis score in LF
Analysis of five studies (Geng et al., 2010; Li et al., 2014; Li et al., 2021; Mo et al., 2021; Zhang et al., 2023) involving 75 animals reporting the fibrosis score levels revealed that the Rg1 group significantly decreased the fibrosis score compared to the control group [SMD: −3.63 (95% CI: −5.06, - 2.20), P < 0.00001, I2 = 61%, Figure 10].
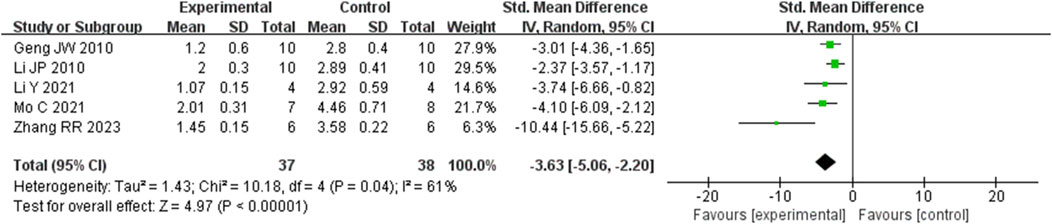
Figure 10. Forest plot: effect of Rg1 on fibrosis score.
3.5.2 Secondary outcomes
3.5.2.1 Liver fibrosis related indicators
Analysis of three studies (Zhang et al., 2023) (Li et al., 2014; Mo et al., 2021) involving 43 animals reporting α-SMA levels showed that the Rg1 group significantly reduced α-SMA compared to the control group [SMD: −4.42 (95% CI: −6.65, - 2.19), P = 0.0001, I2 = 67%, Figure 11A]. Analysis of three studies (Geng et al., 2010; Li et al., 2021; Wei et al., 2018) involving 38 animals reporting PCIII levels indicated that the Rg1 group significantly reduced PCIII compared to the control group [SMD: - 3.91 (95% CI: −6.25, - 1.57), P = 0.001, I2 = 67%, Figure 11B]. Analysis of three studies (Geng et al., 2010; Li et al., 2014; Zhang et al., 2023) involving 48 animals reporting HYP levels demonstrated that the Rg1 group significantly reduced HYP compared to the control group [SMD: - 8.11 (95% CI: −11.83, - 4.39), P < 0.0001, I2 = 68%, Figure 11C].
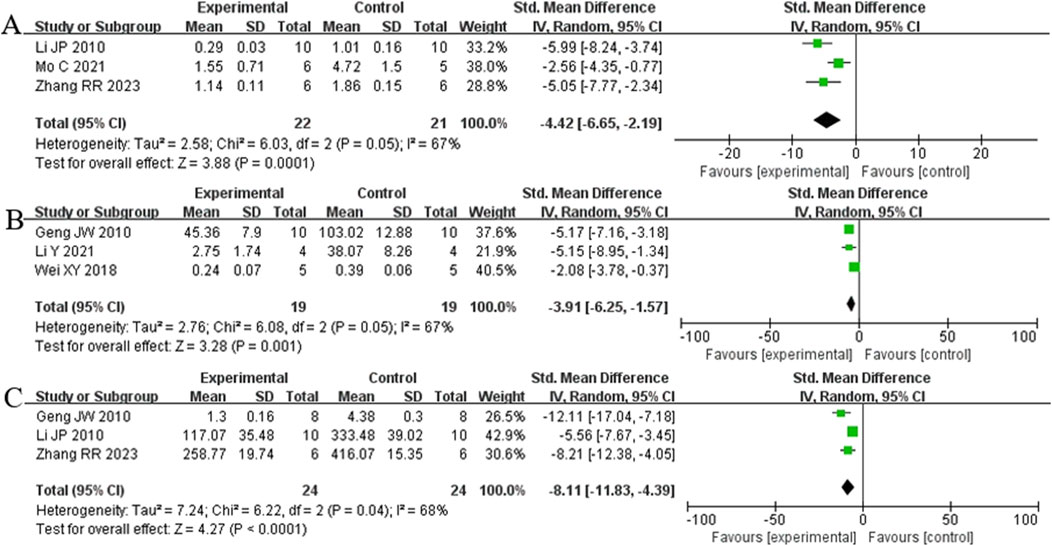
Figure 11. Forest plot: effect of Rg1 on (A) α-SMA, (B) PCIII, and (C) HYP.
3.6 Subgroup analysis
Given the significant heterogeneity among the included studies, subgroup analysis was performed for histological score, ALT, AST, and fibrosis score based on various factors such as the year of publication, animal species, dosage, modeling method, treatment duration, and administration method. The analysis suggested that modeling method could be the source of heterogeneity for ALT and AST; dosage, modeling method, duration of treatment, and administration method may contribute to the heterogeneity in histological score. Year of publication and dosage were found to be potential source of heterogeneity in fibrosis score. The results are summarized in Supplementary Table S3.
3.7 Sensitivity analysis
Additionally, a sensitivity analysis was conducted using the exclusion-by-exclusion method. Sequential exclusion of each study revealed no significant change in the combined results, indicating the robustness and high stability of the findings in this study.
3.8 Publication bias
As presented in Figures 12A, B, the funnel plot indicated asymmetry in the comparison of ALT and AST levels. The Egger’s test results shown in Figures 13A, B revealed significant publication bias for both ALT (P < 0.05) and AST (P < 0.05). This bias may be attributed to the non-reporting of negative results and the relatively low quality of the included literature.
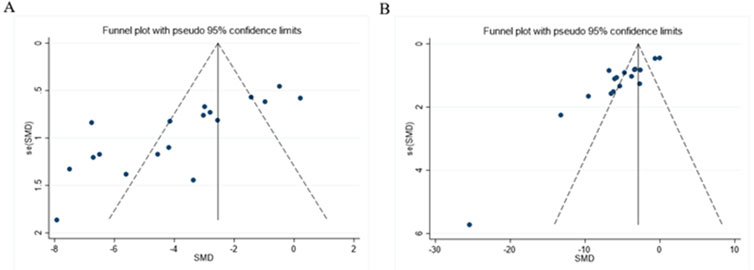
Figure 12. Funnel plot: effect of Rg1 on (A) ALT and (B) AST.
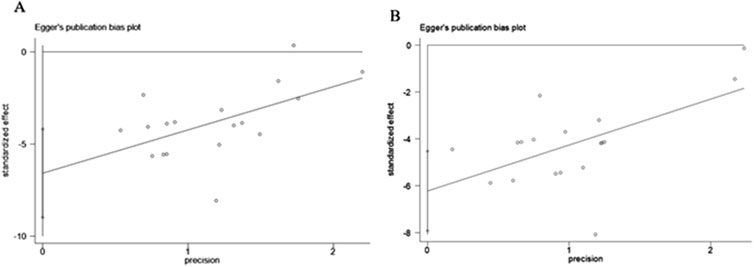
Figure 13. Egger’s publication bias plot for (A) ALT, (B) AST.
3.9 Time-dose analysis
To identify the most effective dose of preclinical Rg1 intervention for LI and LF, a time-dose analysis was performed, considering data on histological score, ALT, AST, and fibrosis score. The analysis indicated that treatment with Rg1 at doses ranging from 4 to 800 mg/kg/d for 1–64 days had a significant positive effect on ALT levels compared to the model group (P < 0.05). Similarly, Rg1 treatment at doses of 4–800 mg/kg/d for 1–64 days significantly reduced AST levels compared to the model group (P < 0.05). Further analysis showed that Rg1 treatment at doses of 20–60 mg/kg/d for 1–7 days had a better effect on histological score compared to the model group (P < 0.05). Additionally, treatment with Rg1 at doses ranging from 10 to 100 mg/kg/d for 14–63 days significantly improved the fibrosis score compared to the model group (P < 0.05). The results of the time-dose interval analysis suggested that the effective dose range for ginsenoside Rg1 is between 4 and 800 mg/kg/d, with treatment durations spanning 1–64 days (Figure 14).
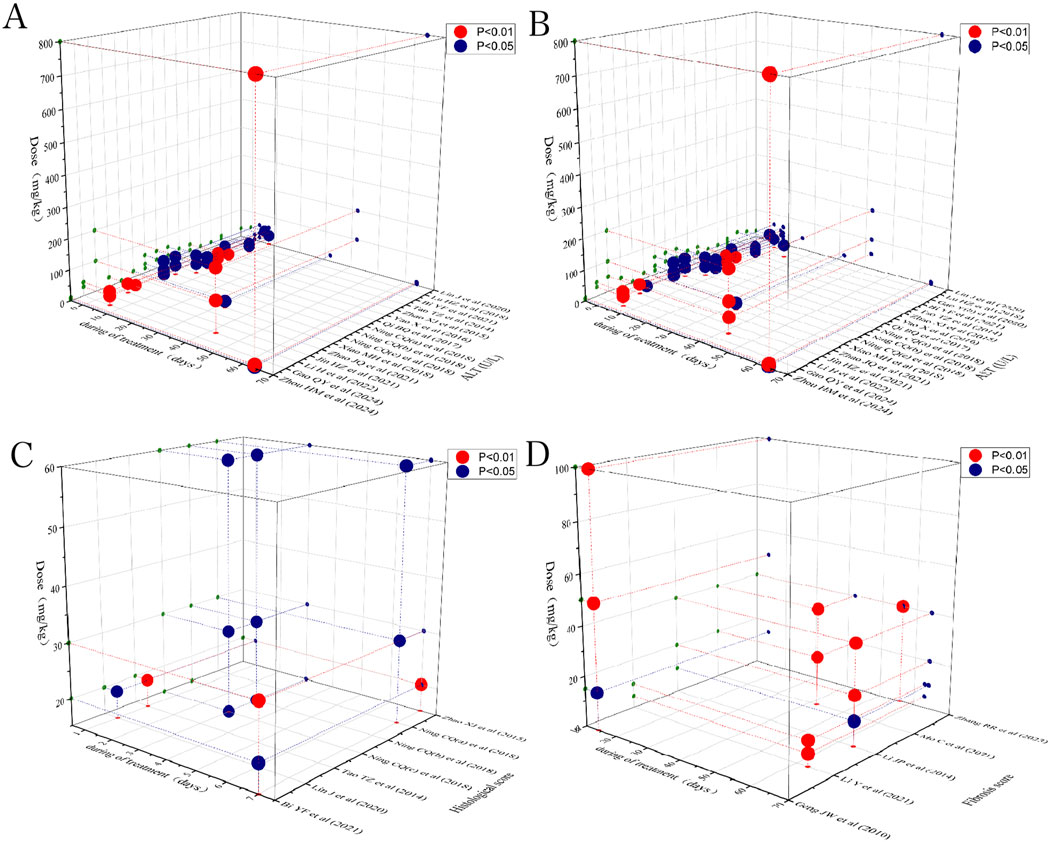
Figure 14. Scatter plot of the time-dose interval analysis on (A) ALT, (B) AST, (C) Histological, and (D) Fibrosis score.
4 Discussion
4.1 Effectiveness and summary of evidence
Traditional Chinese medicine (TCM) has a long history and is highly regarded for its mild and far-reaching curative effects, along with fewer side effects, making it a promising approach for disease management (Gan et al., 2023). Despite a large number of preclinical studies demonstrating that Rg1 exhibits a variety of biological activities, such as anti-inflammatory, anti-apoptotic, and antioxidant effects, as well as hepatoprotective action including mitigating the progression of nonalcoholic fatty liver disease, inhibiting viral hepatitis, countering LF, ameliorating LI from diverse etiologies, and reducing hepatocellular carcinoma, its reliability as a therapeutic agent for LI progressing to LF.
Remains inconsistent and insufficiently supported by evidence. This systematic review and meta-analysis integrates, for the first time, the preclinical evidence for the use of Rg1 in the treatment of LI and LF, confirming its potential therapeutic role in these conditions through a comprehensive meta-analysis. In this review, 24 preclinical studies involving a total of 423 animals were assessing with the primary objective of evaluating the therapeutic effects of Rg1 on LI and LF and elucidating the specific mechanisms by which LI progresses to LF in animal models. The overall methodological quality of the included studies was moderate. By summarizing and analyzing the various indicators, our meta-analysis found that Rg1 improved liver function indicators, such as ALT and AST; inflammation markers, such as TNF-α, IL-6, and IL-1β; apoptosis indicators, including BAX and Bcl-2; and oxidative stress indicators, such as SOD, MDA, GSH, Keap1, Nrf2, GCLM, GCLC, NQO1. However, significant heterogeneity was observed in the primary outcome indicators, including histological score, ALT, AST and LF score. According to the subgroup analysis, the heterogeneity may be attributed to differences in drug dosage, modeling method, duration of treatment, year of publication, and mode of administration.
4.2 Mechanism of action of Rg1 in the treatment of LI progressing to LF
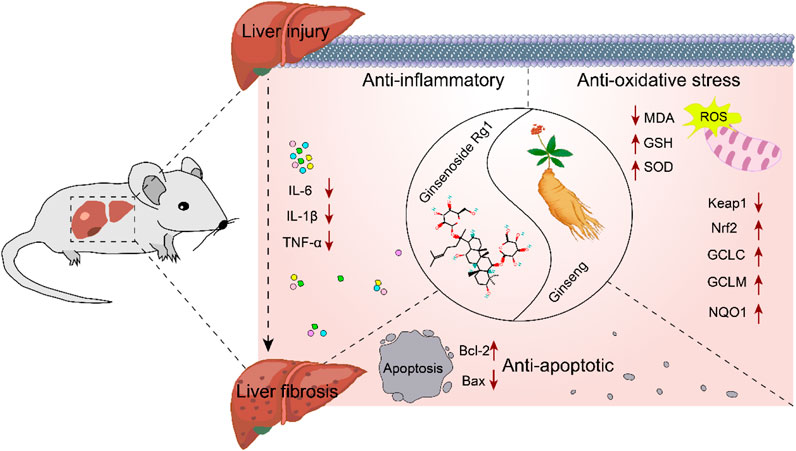
Elucidating the molecular mechanisms underlying the role of Rg1 in the treatment of LI and LF is essential for advancing its clinical application. Therefore, the potential molecular mechanisms of Rg1 were comprehensively reviewed. Rg1 exerts hepatoprotective effects by inhibiting the Toll-like receptor 4 (TLR4) and NOD-like receptor thermal protein domain associated protein 3 (NLRP3)/nuclear factor kappa-B (NF-κB) signaling pathways. It also increases Nrf2 expression and translocation, enhances Bcl-2, and decreases BAX. These mechanisms are primarily reflected in Rg1’s anti-inflammatory, antioxidative stress, and anti-apoptotic properties (Figure 15).
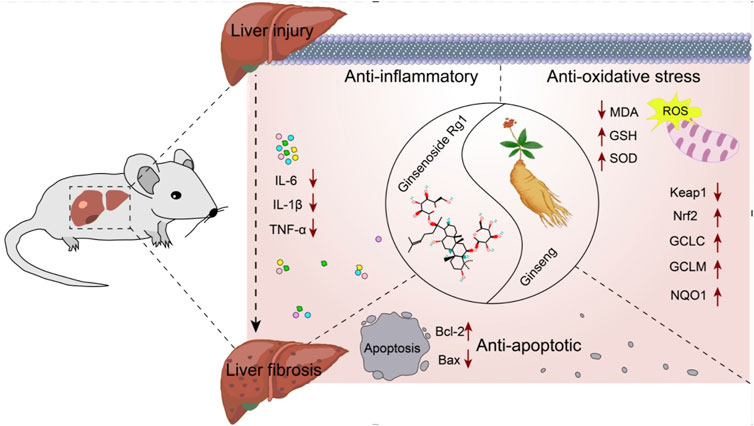
Figure 15. Possible mechanism of Rg1 on LI to LF.
4.2.1 Anti-inflammatory effect
LI promotes inflammation and LF, with the initial stages involving hepatocyte damage, followed by the activation of paracrine secretion of inflammatory cells, and the autocrine activation of HSCs (Machado and Diehl, 2016). The progression from LI to LF is a complex pathophysiological process where inflammation and oxidative stress persist, playing critical roles (Feng et al., 2024; Sharma et al., 2024). Inflammation is closely associated with both acute and chronic liver diseases, acting in a dual capacity in the liver: it is essential for maintaining the health of the organism, but when uncontrolled, it becomes a major driver of liver pathology (Li et al., 2016). External or internal injury can trigger an inflammatory response, stimulating immune cells, which invade the liver and release various factors, advancing inflammation (Hu et al., 2016). In liver diseases, signaling pathways such as TLR4 and NF-κB activate endogenous cellular inflammatory vesicles, releasing pro-inflammatory cytokines like IL-1β, IL-6, and TNF-α. These cytokines promote a shift toward a type 2 inflammatory response, which, as liver disease progress, leads to tissue repair and the formation of LF (Taru et al., 2024). HSCs are the principal cells responsible for the production of extracellular matrix components, and their activation is central to both the progression and potential reversal of LF. Inflammation triggers the activation of HSCs through the secretion of pro-fibrotic factors like TGF-β1, which further amplifies LF in a positive feedback loop (Kisseleva and Brenner, 2021; Wang et al., 2024). Our results suggest that Rg1 inhibits the expression of TLR4 and downregulates NLRP3 inflammasome activity, along with pro-inflammatory cytokines TNF-α, IL-1β and IL-6 (Jin et al., 2021; Li et al., 2021; Ning et al., 2018c; Xin et al., 2016; Zhou et al., 2024).
4.2.2 Anti-oxidative stress effect
Oxidative stress is a key factor in both LI and the development of LF (Crosas-Molist and Fabregat, 2015). It enhance the expression of collagen fibers and fibroblastogenic cytokines by activating HSCs. Activated HSCs produce large amounts of reactive oxygen species (ROS), and excessive ROS accumulation can trigger hepatocellular death, worsening inflammatory responses. This, in turn, activates NF-κB, which controls the transcription of pro-inflammatory cytokine genes, further aggravating liver inflammation and injury (Allameh et al., 2023; Kitsugi et al., 2023; Louvet and Mathurin, 2015). Nrf2, a key antioxidant transcription factor, plays a significant role in inflammation and chronic liver disease. During cellular oxidative stress, Nrf2 is activated and translocates to the nucleus, where it enhances cellular defense mechanisms by activating the expression of antioxidant genes, thereby mitigating oxidative damage (Chen et al., 2024). The Keap1/Nrf2 pathway is the most crucial antioxidant pathway. Under normal conditions, Nrf2 forms a stable dimer with its molecular chaperone Keap1 in the cytoplasm, remaining in a non-activated state. However, during oxidative stress, Nrf2 is activated, dissociates from Keap1 and translocates to the nucleus. There, it binds to antioxidant response elements and triggers the expression of key antioxidant genes, including NQO1, GCLM, GCLC, GSH, and SOD. This activation counteracts ROS-induced inflammation and oxidative stress, thereby safeguarding hepatocytes from further damage and preventing progression to LF (Chen et al., 2024). MDA, a major product of lipid peroxidation, is an indicator of increased lipid peroxidation in the liver (Gong et al., 2023). Our findings show that Rg1 significantly decreased MDA levels and increased the expression of SOD, GSH and Nrf2-regulated antioxidant genes like GCLC, GCLM and NQO1 (Gao et al., 2017a; Li et al., 2014; Ning et al., 2018a; Wei et al., 2018; Xiao et al., 2018).
4.2.3 Anti-apoptosis effect
LI represents a complex pathological process frequently characterized by extensive hepatocyte apoptosis, which drives the progression to LF (Takehara et al., 2004; Brenner et al., 2013). Mitochondria, as central executors of apoptosis, primarily regulate this process through the Bcl-2 family of proteins, including Bcl-2 and BAX, which govern the permeability of the outer mitochondrial membrane (Hsu and Youle, 1997). Bcl-2 functions as an anti-apoptotic protein by inhibiting the release of apoptotic factors from mitochondria, whereas BAX overexpression accelerates apoptosis relative to Bcl-2 (Novo et al., 2006; Li et al., 2021). Therefore, modulation of Bcl-2/BAX signaling can effectively block hepatocyte apoptosis, thereby mitigating the transition from LI to LF. Rg1 was found to suppress BAX expression while enhancing Bcl-2 levels (Bi et al., 2021).
4.3 Limitations
Several limitations should be considered before interpreting the results of this study. First, the inclusion of only three high-quality English databases may introduce language bias; future studies should consider incorporating databases in multiple languages to mitigate this potential bias. Additionally, the quality of the animal studies included was generally moderate, with scores ranging from 5 to 7. Several studies mentioned randomization but did not provide details on blinding or allocation concealment. Third, significant heterogeneity was observed in some studies, and subgroup analysis suggested that variations in dosage, administration timing, mode of administration, and modeling methods may contribute to this.Therefore, larger preclinical studies are recommended to address these currently inconclusive aspects. Fourth, the complex pathogenic mechanisms underlying both LI and LF were only partially explored in this study, focusing primarily on the key mechanisms of Rg1 in treating these conditions. Moreover, some studies (Supplementary Table S4) did not report whether they underwent ethical review, complicating the assessment of the appropriateness of their animal experiment protocols. Finally, the evidence supporting Rg1 for treating LF is less robust than for LI, with only six animal studies reporting on Rg1’s effects on LF. Despite these limitations, the findings still suggest that Rg1 plays a beneficial role in the progression of LI to LF and holds promise as a therapeutic agent for both conditions.
5 Conclusion
Rg1 plays a beneficial role in the dynamic progression from LI to LF, exerting hepatoprotective effects through inhibition of the TLR4 and NLRP3/NF-κB signaling pathways, upregulation and translocation of Nrf2, as well as enhancing Bcl-2 expression and decreasing BAX levels. This study provides strong evidence supporting the beneficial effects of Rg1, which is well-documented for significantly reducing pathological scores, improving liver function, lowering pro-inflammatory markers, inhibiting oxidative stress, and preventing apoptosis in rodent models of LI and LF. Thus, Rg1 emerges as a promising drug candidate for treating both LI and LF, offering an evidence-based foundation for its potential development and clinical application. However, due to the observed heterogeneity and publication bias in the included studies, the results should be interpreted with caution. Further high-quality preclinical and clinical studies are essential to fully evaluate the therapeutic efficacy of Rg1.
Author contributions
LD: Data curation, Formal Analysis, Writing–original draft. XL: Conceptualization, Methodology, Writing–review and editing. SC: Data curation, Resources, Software, Writing–review and editing. XY: Data curation, Resources, Software, Writing–review and editing. DW: Resources, Software, Writing–review and editing. TW: Data curation, Writing–review and editing. JL: Data curation, Writing–review and editing. WL: Supervision, Methodology, Visualization, Writing–review and editing. JM: Validation, Methodology, Visualization, Writing–review and editing. QF: Conceptualization, Writing–review and editing.
Funding
The author(s) declare that financial support was received for the research, authorship, and/or publication of this article. This research was funded by the Sichuan Provincial Natural Science Foundation (2024NSFSC0692).
Acknowledgments
We sincerely thank the reviewers for their valuable comments and the authors of all the references. We thank Bullet Edits Limited for the linguistic editing and proofreading of the manuscript.
Conflict of interest
The authors declare that the research was conducted in the absence of any commercial or financial relationships that could be construed as a potential conflict of interest.
Generative AI statement
The author(s) declare that no Generative AI was used in the creation of this manuscript.
Publisher’s note
All claims expressed in this article are solely those of the authors and do not necessarily represent those of their affiliated organizations, or those of the publisher, the editors and the reviewers. Any product that may be evaluated in this article, or claim that may be made by its manufacturer, is not guaranteed or endorsed by the publisher.
Supplementary material
The Supplementary Material for this article can be found online at: https://www.frontiersin.org/articles/10.3389/fphar.2025.1512184/full#supplementary-material
References
Allameh, A., Niayesh-Mehr, R., Aliarab, A., Sebastiani, G., and Pantopoulos, K. (2023). Oxidative stress in liver pathophysiology and disease. Antioxidants (Basel) 12 (9), 1653. doi:10.3390/antiox12091653
Alolga, R. N., Nuer-Allornuvor, G. F., Kuugbee, E. D., Yin, X., and Ma, G. (2020). Ginsenoside Rg1 and the control of inflammation implications for the therapy of type 2 diabetes: a review of scientific findings and call for further research. Pharmacol. Res. 152, 104630. doi:10.1016/j.phrs.2020.104630
Alsamman, M., Sterzer, V., Meurer, S. K., Sahin, H., Schaeper, U., Kuscuoglu, D., et al. (2018). Endoglin in human liver disease and murine models of liver fibrosis-A protective factor against liver fibrosis. Liver Int. 38 (5), 858–867. doi:10.1111/liv.13595
Bataller, R., and Brenner, D. A. (2005). Liver fibrosis. J. Clin. Invest 115 (2), 209–218. doi:10.1172/JCI24282
Bi, Y., Li, Q., Tao, W., Tang, J., You, G., and Yu, L. (2021). Ginsenoside Rg1 and ginsenoside Rh1 prevent liver injury induced by acetaminophen in mice. J. Food Biochem. 45, e13816. doi:10.1111/jfbc.13816
Brenner, C., Galluzzi, L., Kepp, O., and Kroemer, G. (2013). Decoding cell death signals in liver inflammation. J. Hepatol. 59 (3), 583–594. doi:10.1016/j.jhep.2013.03.033
Chen, J. Y., Yang, Y. J., Meng, X. Y., Lin, R. H., Tian, X. Y., Zhang, Y., et al. (2024). Oxysophoridine inhibits oxidative stress and inflammation in hepatic fibrosis via regulating Nrf2 and NF-κB pathways. Phytomedicine 132, 155585. doi:10.1016/j.phymed.2024.155585
Cools, L., Dastjerd, M. K., Smout, A., Merens, V., Yang, Y., Reynaert, H., et al. (2024). Human iPSC-derived liver co-culture spheroids to model liver fibrosis. Biofabrication 16 (3), 035032. doi:10.1088/1758-5090/ad5766
Crosas-Molist, E., and Fabregat, I. (2015). Role of NADPH oxidases in the redox biology of liver fibrosis. Redox Biol. 6, 106–111. doi:10.1016/j.redox.2015.07.005
Diehl, A. M., and Chute, J. (2013). Underlying potential: cellular and molecular determinants of adult liver repair. J. Clin. Invest 123 (5), 1858–1860. doi:10.1172/JCI69966
Feng, X., Liu, H., Sheng, Y., Li, J., Guo, J., Song, W., et al. (2024). Yinchen gongying decoction mitigates CCl4-induced chronic liver injury and fibrosis in mice implicated in inhibition of the FoxO1/TGF-β1/Smad2/3 and YAP signaling pathways. J. Ethnopharmacol. 327, 117975. doi:10.1016/j.jep.2024.117975
Gan, X., Shu, Z., Wang, X., Yan, D., Li, J., Ofaim, S., et al. (2023). Network medicine framework reveals generic herb-symptom effectiveness of traditional Chinese medicine. Sci. Adv. 9 (43), eadh0215. doi:10.1126/sciadv.adh0215
Gao, Q., Li, G., Zu, Y., Xu, Y., Wang, C., Xiang, D., et al. (2024). Ginsenoside Rg1 alleviates ANIT-induced cholestatic liver injury by inhibiting hepatic inflammation and oxidative stress via SIRT1 activation. J. Ethnopharmacol. 319 (Pt 1), 117089. doi:10.1016/j.jep.2023.117089
Gao, Y., Chu, S., Shao, Q., Zhang, M., Xia, C., Wang, Y., et al. (2017a). Antioxidant activities of ginsenoside Rg1 against cisplatin-induced hepatic injury through Nrf2 signaling pathway in mice. Free Radic. Res. 51 (1), 1–13. doi:10.1080/10715762.2016.1234710
Gao, Y., Chu, S., Zhang, Z., and Chen, N. (2017b). Hepataprotective effects of ginsenoside Rg1 - a review. J. Ethnopharmacol. 206, 178–183. doi:10.1016/j.jep.2017.04.012
Gao, Y., Chu, S. F., Xia, C. Y., Zhang, Z., Zhang, S., and Chen, N. H. (2016). Rg1 Attenuates alcoholic hepatic damage through regulating AMP-activated protein kinase and nuclear factor erythroid 2-related factor 2 signal pathways. J. Asian Nat. Prod. Res. 18 (8), 765–778. doi:10.1080/10286020.2016.1162787
Geng, J., Peng, W., Huang, Y., Fan, H., and Li, S. (2010). Ginsenoside-Rg1 from Panax notoginseng prevents hepatic fibrosis induced by thioacetamide in rats. Eur. J. Pharmacol. 634 (1-3), 162–169. doi:10.1016/j.ejphar.2010.02.022
Gong, X., Zhang, F., Li, Y., and Peng, C. (2023). Study on the mechanism of acute liver injury protection in Rhubarb anthraquinone by metabolomics based on UPLC-Q-TOF-MS. Front. Pharmacol. 14, 1141147. doi:10.3389/fphar.2023.1141147
Guan, Y., Xu, D., and Peltz, G. (2016). Treating liver fibrosis: (Re)programmed to succeed. Cell Stem Cell 18 (6), 683–684. doi:10.1016/j.stem.2016.05.007
Guicciardi, M. E., and Gores, G. J. (2005). Apoptosis: a mechanism of acute and chronic liver injury. Gut 54 (7), 1024–1033. doi:10.1136/gut.2004.053850
Guo, Q., Furuta, K., Islam, S., Caporarello, N., Kostallari, E., Dielis, K., et al. (2022). Liver sinusoidal endothelial cell expressed vascular cell adhesion molecule 1 promotes liver fibrosis. Front. Immunol. 13, 983255. doi:10.3389/fimmu.2022.983255
Hsu, Y. T., and Youle, R. J. (1997). Nonionic detergents induce dimerization among members of the Bcl-2 family. J. Biol. Chem. 272 (21), 13829–13834. doi:10.1074/jbc.272.21.13829
Hu, W., Ma, Z., Jiang, S., Fan, C., Deng, C., Yan, X., et al. (2016). Melatonin: the dawning of a treatment for fibrosis? J. Pineal Res. 60 (2), 121–131. doi:10.1111/jpi.12302
Jin, H., Jiang, Y., Lv, W., Chen, L., Zheng, Y., and Lin, Y. (2021). Gensenoside Rg1 protects against lipopolysaccharide- and d-galactose-induced acute liver failure via suppressing HMGB1-mediated TLR4-NF-κB pathway. Mol. Cell Probes 56, 101706. doi:10.1016/j.mcp.2021.101706
Kisseleva, T., and Brenner, D. (2021). Molecular and cellular mechanisms of liver fibrosis and its regression. Nat. Rev. Gastroenterol. Hepatol. 18 (3), 151–166. doi:10.1038/s41575-020-00372-7
Kitsugi, K., Noritake, H., Matsumoto, M., Hanaoka, T., Umemura, M., Yamashita, M., et al. (2023). Simvastatin inhibits hepatic stellate cells activation by regulating the ferroptosis signaling pathway. Biochim. Biophys. Acta Mol. Basis Dis. 1869 (7), 166750. doi:10.1016/j.bbadis.2023.166750
Li, H., Gao, Y. H., Song, L., Chen, T. F., Zhang, G. P., Ye, Z. G., et al. (2022a). Ginsenoside Rg1 protects mice against 2,3,7,8-tetrachlorodibenzo-p-dioxin-induced liver injury by inhibiting CYP1A1 through the aryl hydrocarbon receptor. J. Ethnopharmacol. 294, 115394. doi:10.1016/j.jep.2022.115394
Li, J., Gao, W., Zhao, Z., Li, Y., Yang, L., Wei, W., et al. (2022b). Ginsenoside Rg1 reduced microglial activation and mitochondrial dysfunction to alleviate depression-like behaviour via the GAS5/EZH2/SOCS3/NRF2 Axis. Mol. Neurobiol. 59 (5), 2855–2873. doi:10.1007/s12035-022-02740-7
Li, J. P., Gao, Y., Chu, S. F., Zhang, Z., Xia, C. y., Mou, Z., et al. (2014). Nrf2 pathway activation contributes to anti-fibrosis effects of ginsenoside Rg1 in a rat model of alcohol- and CCl4-induced hepatic fibrosis. Acta Pharmacol. Sin. 35 (8), 1031–1044. doi:10.1038/aps.2014.41
Li, S., Hong, M., Tan, H. Y., Wang, N., and Feng, Y. (2016). Insights into the role and interdependence of oxidative stress and inflammation in liver diseases. Oxid. Med. Cell Longev. 2016, 4234061. doi:10.1155/2016/4234061
Li, Y., Zhang, D., Li, L., Han, Y., Dong, X., Yang, L., et al. (2021). Ginsenoside Rg1 ameliorates aging-induced liver fibrosis by inhibiting the NOX4/NLRP3 inflammasome in SAMP8 mice. Mol. Med. Rep. 24 (5), 801. doi:10.3892/mmr.2021.12441
Lin, J., Huang, H. F., Yang, S. K., Duan, J., Qu, S. M., Yuan, B., et al. (2020). The effect of Ginsenoside Rg1 in hepatic ischemia reperfusion (I/R) injury ameliorates ischemia-reperfusion-induced liver injury by inhibiting apoptosis. Biomed. Pharmacother. 129, 110398. doi:10.1016/j.biopha.2020.110398
Louvet, A., and Mathurin, P. (2015). Alcoholic liver disease: mechanisms of injury and targeted treatment. Nat. Rev. Gastroenterol. Hepatol. 12 (4), 231–242. doi:10.1038/nrgastro.2015.35
Lu, H., Tan, Y., Yang, L., Dong, H., Liao, Y., Cao, S., et al. (2018). Hepatoprotective effects of ginseng saponins in a mouse model of carbon tetrachloride-induced liver injury. Trop. J. Pharm. Res. 17, 2381–2385. doi:10.4314/tjpr.v17i12.10
Lu, W., Li, X., Liu, N., Zhang, Y., Li, Y., Pan, Y., et al. (2021). Vitamin D alleviates liver fibrosis by inhibiting histidine-rich calcium binding protein (HRC). Chem. Biol. Interact. 334, 109355. doi:10.1016/j.cbi.2020.109355
Machado, M. V., and Diehl, A. M. (2016). Pathogenesis of nonalcoholic steatohepatitis. Gastroenterology 150 (8), 1769–1777. doi:10.1053/j.gastro.2016.02.066
Mo, C., Xie, S., Zeng, T., Lai, Y., Huang, S., Zhou, C., et al. (2021). Ginsenoside-Rg1 acts as an Ido1 inhibitor, protects against liver fibrosis via alleviating Ido1-mediated the inhibition of DCs maturation. Phytomedicine 84, 153524. doi:10.1016/j.phymed.2021.153524
Ning, C., Gao, X., Wang, C., Huo, X., Liu, Z., Sun, H., et al. (2018b). Hepatoprotective effect of ginsenoside Rg1 from Panax ginseng on carbon tetrachloride-induced acute liver injury by activating Nrf2 signaling pathway in mice. Environ. Toxicol. 33 (10), 1050–1060. doi:10.1002/tox.22616
Ning, C., Gao, X., Wang, C., Huo, X., Liu, Z., Sun, H., et al. (2018c). Protective effects of ginsenoside Rg1 against lipopolysaccharide/d-galactosamine-induced acute liver injury in mice through inhibiting toll-like receptor 4 signaling pathway. Int. Immunopharmacol. 61, 266–276. doi:10.1016/j.intimp.2018.06.008
Ning, C., Gao, X., Wang, C., Kong, Y., Liu, Z., Sun, H., et al. (2018a). Ginsenoside Rg1 protects against acetaminophen-induced liver injury via activating Nrf2 signaling pathway in vivo and in vitro. Regul. Toxicol. Pharmacol. 98, 58–68. doi:10.1016/j.yrtph.2018.07.012
Novo, E., Marra, F., Zamara, E., Valfrè di Bonzo, L., Monitillo, L., Cannito, S., et al. (2006). Overexpression of Bcl-2 by activated human hepatic stellate cells: resistance to apoptosis as a mechanism of progressive hepatic fibrogenesis in humans. Gut 55 (8), 1174–1182. doi:10.1136/gut.2005.082701
Parola, M., and Pinzani, M. (2019). Liver fibrosis: pathophysiology, pathogenetic targets and clinical issues. Mol. Asp. Med. 65, 37–55. doi:10.1016/j.mam.2018.09.002
Pydyn, N., Ferenc, A., Trzos, K., Pospiech, E., Wilamowski, M., Mucha, O., et al. (2024). MCPIP1 inhibits hepatic stellate cell activation in autocrine and paracrine manners, preventing liver fibrosis. Cell Mol. Gastroenterol. Hepatol. 17 (6), 887–906. doi:10.1016/j.jcmgh.2024.01.021
Qi, B., Zhang, S., Guo, D., Jiang, X., and Zhu, X. (2017). Protective effect and mechanism of ginsenoside Rg1 on carbon tetrachloride-induced acute liver injury. Mol. Med. Rep. 16 (3), 2814–2822. doi:10.3892/mmr.2017.6920
Ruart, M., Chavarria, L., Camprecios, G., Suárez-Herrera, N., Montironi, C., Guixé-Muntet, S., et al. (2019). Impaired endothelial autophagy promotes liver fibrosis by aggravating the oxidative stress response during acute liver injury. J. Hepatol. 70 (3), 458–469. doi:10.1016/j.jhep.2018.10.015
Sharma, N., Sistla, R., and Andugulapati, S. B. (2024). Yohimbine ameliorates liver inflammation and fibrosis by regulating oxidative stress and Wnt/β-catenin pathway. Phytomedicine 123, 155182. doi:10.1016/j.phymed.2023.155182
Takehara, T., Tatsumi, T., Suzuki, T., Rucker, E. B., Hennighausen, L., Jinushi, M., et al. (2004). Hepatocyte-specific disruption of Bcl-xL leads to continuous hepatocyte apoptosis and liver fibrotic responses. Gastroenterology 127 (4), 1189–1197. doi:10.1053/j.gastro.2004.07.019
Tao, T., Chen, F., Bo, L., Xie, Q., Yi, W., Zou, Y., et al. (2014). Ginsenoside Rg1 protects mouse liver against ischemia-reperfusion injury through anti-inflammatory and anti-apoptosis properties. J. Surg. Res. 191 (1), 231–238. doi:10.1016/j.jss.2014.03.067
Taru, V., Szabo, G., Mehal, W., and Reiberger, T. (2024). Inflammasomes in chronic liver disease: hepatic injury, fibrosis progression and systemic inflammation. J. Hepatol. 81, 895–910. doi:10.1016/j.jhep.2024.06.016
Wan, S., Liu, X., Sun, R., Liu, H., Jiang, J., and Wu, B. (2024). Activated hepatic stellate cell-derived Bmp-1 induces liver fibrosis via mediating hepatocyte epithelial-mesenchymal transition. Cell Death Dis. 15 (1), 41. doi:10.1038/s41419-024-06437-8
Wang, Q., Lu, T., Song, P., Dong, Y., Dai, C., Zhang, W., et al. (2024). Glycyrrhizic acid ameliorates hepatic fibrosis by inhibiting oxidative stress via AKR7A2. Phytomedicine 133, 155878. doi:10.1016/j.phymed.2024.155878
Wei, X., Chen, Y., and Huang, W. (2018). Ginsenoside Rg1 ameliorates liver fibrosis via suppressing epithelial to mesenchymal transition and reactive oxygen species production in vitro and in vivo. Biofactors 44, 327–335. doi:10.1002/biof.1432
Xiao, M. H., Xia, J. Y., Wang, Z. L., Hu, W. X., Fan, Y. L., Jia, D. Y., et al. (2018). Ginsenoside Rg1 attenuates liver injury induced by D-galactose in mice. Exp. Ther. Med. 16 (5), 4100–4106. doi:10.3892/etm.2018.6727
Xin, Y., Wei, J., Chunhua, M., Danhong, Y., Jianguo, Z., Zongqi, C., et al. (2016). Protective effects of Ginsenoside Rg1 against carbon tetrachloride-induced liver injury in mice through suppression of inflammation. Phytomedicine 23 (6), 583–588. doi:10.1016/j.phymed.2016.02.026
Yang, S. J., Wang, J. J., Cheng, P., Chen, L. X., Hu, J. M., and Zhu, G. Q. (2023). Ginsenoside Rg1 in neurological diseases: from bench to bedside. Acta Pharmacol. Sin. 44 (5), 913–930. doi:10.1038/s41401-022-01022-1
Yu, H. H., Qiu, Y. X., Li, B., Peng, C. Y., Zeng, R., and Wang, W. (2021). Kadsura heteroclita stem ethanol extract protects against carbon tetrachloride-induced liver injury in mice via suppression of oxidative stress, inflammation, and apoptosis. J. Ethnopharmacol. 267, 113496. doi:10.1016/j.jep.2020.113496
Zhang, J., Li, Y., Liu, Q., Huang, Y., Li, R., Wu, T., et al. (2021). Sirt6 alleviated liver fibrosis by deacetylating conserved lysine 54 on Smad2 in hepatic stellate cells. Hepatology 73 (3), 1140–1157. doi:10.1002/hep.31418
Zhang, R., Li, X., Gao, Y., Tao, Q., Lang, Z., Zhan, Y., et al. (2023). Ginsenoside Rg1 epigenetically modulates Smad7 expression in liver fibrosis via MicroRNA-152. J. Ginseng Res. 47 (4), 534–542. doi:10.1016/j.jgr.2022.12.005
Zhang, W. S., Zhang, R., Ge, Y., Wang, D., Hu, Y., Qin, X., et al. (2022). S100a16 deficiency prevents hepatic stellate cells activation and liver fibrosis via inhibiting CXCR4 expression. Metabolism 135, 155271. doi:10.1016/j.metabol.2022.155271
Zhang, X.-J., He, C., Li, P., Su, H., and Wan, J. B. (2015). Ginsenoside Rg1, a potential JNK inhibitor, protects against ischemia/reperfusion-induced liver damage. J. Funct. Foods 15, 580–592. doi:10.1016/j.jff.2015.04.010
Zhao, J., He, B., Zhang, S., Huang, W., and Li, X. (2021). Ginsenoside Rg1 alleviates acute liver injury through the induction of autophagy and suppressing NF-κB/NLRP3 inflammasome signaling pathway. Int. J. Med. Sci. 18 (6), 1382–1389. doi:10.7150/ijms.50919
Zhou, H., Liu, Y., Su, Y., Ji, P., Kong, L., Sun, R., et al. (2024). Ginsenoside Rg1 attenuates lipopolysaccharide-induced chronic liver damage by activating Nrf2 signaling and inhibiting inflammasomes in hepatic cells. J. Ethnopharmacol. 324, 117794. doi:10.1016/j.jep.2024.117794
Zhu, X., Ye, S., Yu, D., Al, Et., Li, J., Zhang, M., et al. (2021). Physalin B attenuates liver fibrosis via suppressing LAP2α-HDAC1-mediated deacetylation of the transcription factor GLI1 and hepatic stellate cell activation. Br. J. Pharmacol. 178 (17), 3428–3447. doi:10.1111/bph.15490
Glossary
LI liver injury
LF liver fibrosis
HSCs hepatic stellate cells
ECM extracellular matrix
Rg1 ginsenoside Rg1
Keap1 kelch-like ECH-associated protein 1
Nrf2 nuclear factor erythroid 2-related factor 2
HO-1 heme oxygenase-1
ALT alanine aminotransferase
AST aminotransferase
MDA malondialdehyde
SOD superoxide dismutase
GSH glutathione
Nrf2 nuclear factor erythroid 2-related factor 2
GCLM glutamate-cysteine ligase modifier subunit
GCLC glutamate-cysteine ligase catalytic subunit
NQO1 NADH quinone xidoreductase 1
TNF-α tumor necrosis factor-α
IL-6 interleukin 6
IL-1β interleukin-1β
Bcl-2 B-cell lymphoma-2
BAX BCL2-Associated X
HYP hydroxyproline
α-SMA α-smooth muscle actin
PCIII procollagen typeIII
SMDs standardized mean differences
95% CI 95% confidence intervals
CCL4 carbon tetrachloride
TAA thioacetamide
ANIT naphthylisothiocyanate
TCDD 2,3,7,8-tetrachlorodibenzo-p-dioxin
D-gal d-galactose
APAP acetaminophen
TCM Traditional Chinese medicine
TLR4 Toll-like receptor 4
NLRP3 NOD-like receptor thermal protein domain associated protein 3; NF-κB;
ROS reactive oxygen species.
Keywords: ginsenoside Rg1, liver injury, liver fibrosis, preclinical evidence, meta-analysis
Citation: Dan L, Li X, Chen S, You X, Wang D, Wang T, Li J, Liu W, Mu J and Feng Q (2025) Protective role of ginsenoside Rg1 in the dynamic progression of liver injury to fibrosis: a preclinical meta-analysis. Front. Pharmacol. 16:1512184. doi: 10.3389/fphar.2025.1512184
Received: 16 October 2024; Accepted: 02 January 2025;
Published: 28 January 2025.
Edited by:
Rajeev K. Singla, Sichuan University, ChinaReviewed by:
Liang Shan, Anhui Medical University, ChinaNaihua Hu, Deyang Intergrated Traditional Chinese And Western Medicine Hospital, China
Copyright © 2025 Dan, Li, Chen, You, Wang, Wang, Li, Liu, Mu and Feng. This is an open-access article distributed under the terms of the Creative Commons Attribution License (CC BY). The use, distribution or reproduction in other forums is permitted, provided the original author(s) and the copyright owner(s) are credited and that the original publication in this journal is cited, in accordance with accepted academic practice. No use, distribution or reproduction is permitted which does not comply with these terms.
*Correspondence: Wenping Liu, d2VucGluZ0BjZHV0Y20uZWR1LmNu; Jie Mu, bXVqaWVyNjg5NTZAc2luYS5jb20=; Quansheng Feng, ZmVuZ3FzMTE4QDE2My5jb20=
†These authors have contributed equally to this work