 Erik Hakopian1
 Argishti E. Stepanian1
 Shan Zhong1,2
 Kofi A. Agyeman2,3
 Nancy Zepeda4
 Kevin Wu4
 Charles Liu2,4,5,6
 Darrin J. Lee2,4,5,6
 Vassilios Christopoulos2,3,4,5*
- 1Department of Neuroscience, University of California Riverside, Riverside, CA, United States
- 2Department of Biomedical Engineering, University of Southern California, Los Angeles, CA, United States
- 3Department of Bioengineering, University of California Riverside, Riverside, CA, United States
- 4Department of Neurological Surgery, Keck School of Medicine, University of Southern California, Los Angeles, CA, United States
- 5Neurorestoration Center, Keck School of Medicine, University of Southern California, Los Angeles, CA, United States
- 6Rancho Los Amigos National Rehabilitation Center, Downey, CA, United States
Background: Disruption of N-methyl-D-aspartate receptor (NMDAR) activity within the septohippocampal network - a critical circuit that includes the hippocampus, medial prefrontal cortex (mPFC) and other nuclei - is believed to contribute to learning and memory impairments. Although animal models using the NMDAR antagonist Dizocilpine (MK-801) replicate cognitive deficits associated with memory and learning disorders, the direct effects of MK-801 on brain network connectivity have not been well characterized.
Objective: This study aims to explore the effects of MK-801 on brain network connectivity using functional ultrasound imaging (fUSI) and apply time series analysis methods to mitigate potential statistical confounds in functional connectivity assessments.
Methods: fUSI was employed to assess changes in cerebral blood volume (CBV) and network connectivity in MK-801-treated mice. To account for the nonstationarity and autocorrelation inherent in fUSI time series, an AutoRegressive Integrated Moving Average (ARIMA) model was applied to stabilize the mean and remove autocorrelation, ensuring more reliable signal analysis.
Results: Our analysis revealed that MK-801 significantly disrupts functional connectivity (FC) across key brain regions, including the hippocampus, mPFC, and striatum. We also demonstrated that removing autocorrelation from the fUSI time series mitigates the risk of spurious associations, enhancing the reliability of network analysis.
Conclusion: This study demonstrates the importance of accounting for nonstationarity in fUSI time series to improve the accuracy of brain network connectivity analysis. Our findings indicate that MK-801-induced NMDAR inhibition disrupts connectivity both within and outside the septohippocampal circuit, offering new insights into the neural mechanisms underlying cognitive deficits in disorders affecting memory and learning.
1 Introduction
Cognitive deficits in learning and memory are common features of various neuropsychiatric and neurological disorders. One prominent hypothesis links these impairments to reduced activity of the N-methyl-D-aspartate receptor (NMDAR) (Lee and Zhou, 2019; Krystal et al., 1994; Newcomer et al., 1999; Clayton et al., 2002; Liu et al., 2019). Dizocilpine (MK-801), a potent non-competitive NMDAR antagonist, is widely used in animal studies to investigate memory and learning disorders and cognitive dysfunction (McLamb et al., 1990; Pitkänen et al., 1995; van der Staay et al., 2011; Wiescholleck and Manahan-Vaughan, 2012). By binding within the NMDAR channel and inhibiting calcium ion influx, MK-801 disrupts NMDA receptor-mediated neurotransmission, leading to transient deficits in learning, memory, and other cognitive processes.
The effects of MK-801 extend to specific neural circuits, particularly the septohippocampal network (Crown et al., 2024). This network, which includes the hippocampus, medial prefrontal cortex (mPFC), septum, cholinergic and GABAergic projections from the septal area to the hippocampus, plays an important role in learning and memory processes (Khakpai et al., 2013a). By blocking NMDAR activity, MK-801 disrupts normal synaptic transmission between the medial septum and hippocampus, impairing theta oscillations that are essential for hippocampal function (Abad-Perez et al., 2023). Additionally, NMDAR inhibition alters inhibition alters neurotransmitter levels, including acetylcholine and GABA, further exacerbating deficits in spatial learning and memory (Gonzalez et al., 1994). Perturbations in NMDAR function within the septohippocampal network have been implicated in cognitive dysfunctions associated with various neuropsychiatric disorders (Jodo, 2013).
Given the critical role of the septohippocampal network in cognitive functions and its sensitivity to NMDAR modulation, this network provides an ideal model for exploring the neural mechanisms underlying cognitive impairments linked to NMDAR dysfunction (Khakpai et al., 2013b). Recently, we showed that intraperitoneal (i.p.) injection of MK-801 in mice significantly reduces hemodynamic signals of areas within (i.e., hippocampus and mPFC) and outside the septohippocampal network (Crown et al., 2024). These findings align with clinical studies showing reduced neural activity in the hippocampus and prefrontal cortex of patients with schizophrenia (MacDonald et al., 2006; Gur and Gur, 2010; Bedford et al., 2012).
Building on our previous study, we examined the effects of MK-801 on functional connectivity (FC) between brain regions within and outside the septohippocampal network using functional ultrasound imaging (fUSI) technology (Tanter and Fink, 2014; Macé et al., 2011). fUSI visualizes neural activity by mapping local changes in cerebral blood volume (CBV), which are indirectly linked to neuronal activity through neurovascular coupling. This modality offers high resolution, broad spatial coverage, and exceptional sensitivity, enabling the capture of dynamic brain processes with precision. In this study, we made two key contributions: (1) we demonstrated that MK-801 disrupts dynamic FC among key brain regions, including the mPFC, hippocampus, and striatum, which are critical for memory, learning, and higher-order cognitive functions and (2) we introduced the pre-whitening analysis on fUSI data–an approach that removes autocorrelation and temporal dependencies from time series to ensure statistical validity–illustrating the importance of rendering data stationary before assessing FC. We demonstrated that, without prewhitening, fUSI time series of recorded regions of interest (ROIs) exhibit strong autocorrelation and non-stationarity, violating fundamental assumptions of correlation analysis and potentially misrepresenting the true associations between the ROIs. Overall, the results showed that MK-801 not only reduces the activity of brain regions within and outside the septohippocampal network, but also disrupts the FC between them as a function of time.
2 Materials and methods
2.1 Animal acquisition and surgical procedures
Sixteen male C57BL/6 mice, aged between 8 and 12 weeks, were procured from Charles River Laboratories (Hollister, CA) and stratified into two principal experimental cohorts: a vehicle control group receiving saline administration (n = 8), and a treatment group receiving MK-801 (n = 8; 1.5 mg/kg). Prior to experimental procedures, the mice were anesthetized with 5% isoflurane, delivered in a carrier gas mixture comprised of oxygen and nitrous oxide in a 1:2 ratio and then maintained at a constant rate (1.5%–2%) through surgery and data acquisition. Body temperature was regulated throughout recordings by placing animals on an electric heating pad. Hair on the cranial region of each mouse was removed using a commercially available depilatory cream (Nair, Pharmapacks). All procedures were approved by the University of Southern California, Institutional Animal Care and Use Committee (IACUC #21006).
2.2 Data acquisition
Power Doppler (pD) images were obtained using the Iconeus One scanner (Iconeus, Paris, France). Image acquisition was performed using a linear ultrasound transducer array (fUSI probe) with 128 channels, operating at a center frequency of 15.6 MHz and a pitch of 0.1 mm. This methodology enables a large field of view (12.8 mm width, 10 mm depth and 400 µm plane thickness) with a spatial resolution of 100 µm

Figure 1. Experimental setup for investigating the effects of MK-801 on functional connectivity in the mouse brain using fUSI. (A) Top-down view of the mouse brain illustration with the yellow line indicating the sagittal imaging plane used for data acquisition. The diagram includes a schematic of the ultrasound probe placement on the mouse skull and the experimental setup, featuring an anesthetized mouse secured in a stereotaxic frame under the Iconeus One motorized system. (B) Timeline of the experimental protocol. Following a 5-minute baseline recording, mice received an i.p. injection of either saline (control) or MK-801 (1.5 mg/kg). fUSI data were continuously acquired for an additional 40 minutes post-injection.
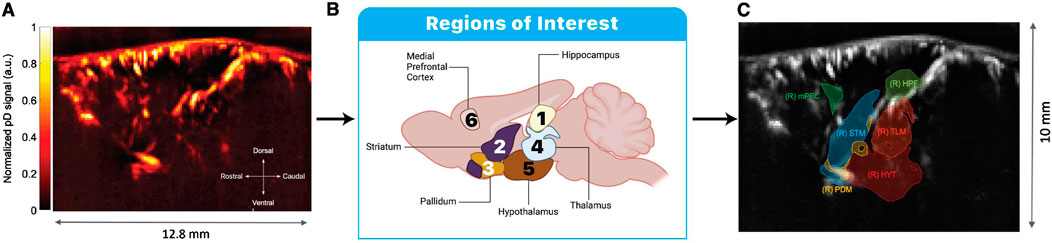
Figure 2. Plane selection and ROI extraction for fUSI analysis. (A) Representative power Doppler (pD) image showing the normalized signal intensity across the sagittal imaging plane. (B) Schematic illustration of the six ROIs analyzed in this study: hippocampus (1), striatum (2), pallidum (3), thalamus (4), hypothalamus (5), and medial prefrontal cortex (mPFC) (6). (C) ROI masks overlaid on the pD image as defined through the Iconeus One system’s automatic region selection tool. Acronyms in the image represent: (R) HPF: right hippocampal formation; (R) mPFC: right medial prefrontal cortex; (R) STR: right striatum; (R) TLM: right thalamus; (R) HYT: right hypothalamus; and (R) PDM: right pallidum. The different colors of the ROI masks are randomly assigned by the software solely to visually distinguish between adjacent brain regions and have no functional significance. Scale bar indicates 10 mm in the dorsal-ventral axis.
2.3 Plane selection and imaging
The target image plane was determined by co-registering a 3D fUSI whole-brain image of each mouse to a standard Allen Mouse Brain Common Coordinate Framework brain atlas utilizing dedicated software available with the Iconeus One scanner. This enabled the identification and extraction of the 6 ROIs (Figure 2C). The probe was fixed steadily throughout experiments on a motorized system with the field of view transverse and intersecting the co-registered sagittal plane. The imaging data were acquired through the compounding of 200 frames, captured at a frame rate of 500 Hz. This process employed 11 tilted plane waves, incrementally separated by 2°, spanning from −10° to +10°. The acquisition sequence was executed at a pulse repetition frequency (PRF) of 5.5 kHz, employing real-time continuous acquisition of successive blocks. Each block consisted of 400 ms of compounded plane wave images, followed by a 600 ms pause between pulses.
2.4 Data pre-processing
The Iconeus One acquisition system generated pD images pre-processed with built-in phase-correlation based sub-pixel motion registration and singular-value-decomposition (SVD) based clutter filtering algorithms Ledoux et al. (1997). These algorithms were used to separate tissue signal from blood signal to obtain pD images. Potential physiological and motion artifacts were addressed through the adoption of rigid motion correction techniques, which have proven effective in fUSI and other neuroimaging modalities Stringer and Pachitariu (2019). These motion correction techniques were integrated with high-frequency filtering algorithms to suppress noise-related artifacts. Specifically, a low-pass filter with a normalized passband frequency of 0.02 Hz and a stopband attenuation of 60 dB was implemented. This filter incorporated a delay compensation mechanism to mitigate any temporal distortions introduced by the filtering process itself, thereby facilitating the effective removal of high-frequency fluctuations from the pD signal data.
2.5 Statistical analysis tools
All analysis was performed using MATLAB 9.12.0.1927505 (R2022a) to 24.1.0.2537033 (R2024). We first calculated the normalized percent change in CBV (
To further elucidate the magnitude of the drug effects between different ROIs, we performed a post hoc pairwise t-test analysis comparing baseline (0–5 min) and final period (40–45 min) of recordings for each ROI in both treatment groups. Statistical significance was assessed using paired t-tests (two-tailed,
Where
Subsequently, we performed a dynamic FC analysis between the six recorded ROIs for the two groups of animals. To characterize the temporal evolution of FC patterns, we implemented a two-stage analytical approach. First, we divided the 45-min recording period into nine non-overlapping 5-min windows to visualize the progressive changes in network FC [i.e., rolling functional connectivity (RFC)] over time (Figure 5). For each window, we computed the Pearson correlation matrices between all ROI pairs for each animal, providing a snapshot of the network dynamics at different time intervals. Prior to averaging across animals, we applied the Fisher r-to-Z transformation -
In addition to the 5-min window analysis, we implemented an RFC approach with finer temporal resolution to quantitatively assess temporal changes in functional connectivity. This approach used 60-s non-overlapping windows to calculate the Pearson correlation coefficient
Where
•
•
•
•
Following the previous analytical approach, we applied the Fisher r-to-Z transformation to normalize the distribution of correlation coefficients. To characterize the trends in correlation changes over time, we fitted a linear regression model to the Z-transformed correlation values, allowing us to identify and quantify any significant patterns or progressive shifts in connectivity throughout the experiment. We chose non-overlapping windows to ensure statistical independence between observations, which is crucial for the validity of subsequent regression analyses.
This analysis provided eight slopes per ROI pair (corresponding to the eight animals) in each experimental group. We then conducted two-sample independent t-tests directly comparing the distributions of these slopes (MK-801 slopes versus saline slopes) for each ROI pair. This approach specifically tested whether the rate of connectivity change over time differed significantly between treatment groups for each pair of ROIs. The resulting t-scores provided a standardized measure of the differential effects of MK-801 versus saline on the trajectory of functional connectivity dynamics. Negative t-scores indicated a greater connectivity decrease in the MK-801 group compared to the saline group. To control for multiple comparisons across all ROI pairs, we applied BH procedure for FDR correction.
2.6 Prewhitening the pD time series
Initial inspection of the motion-corrected pD time series from the six ROIs revealed pronounced nonstationarity in the mean and strong autocorrelation. This was demonstrated by plotting the CBV changes alongside the AutoCorrelation Function (ACF) and Partial AutoCorrelation Function (PACF) histograms for a representative ROI (i.e., hippocampus) from a typical animal (Figure 3A). To calculate the Pearson correlation coefficient
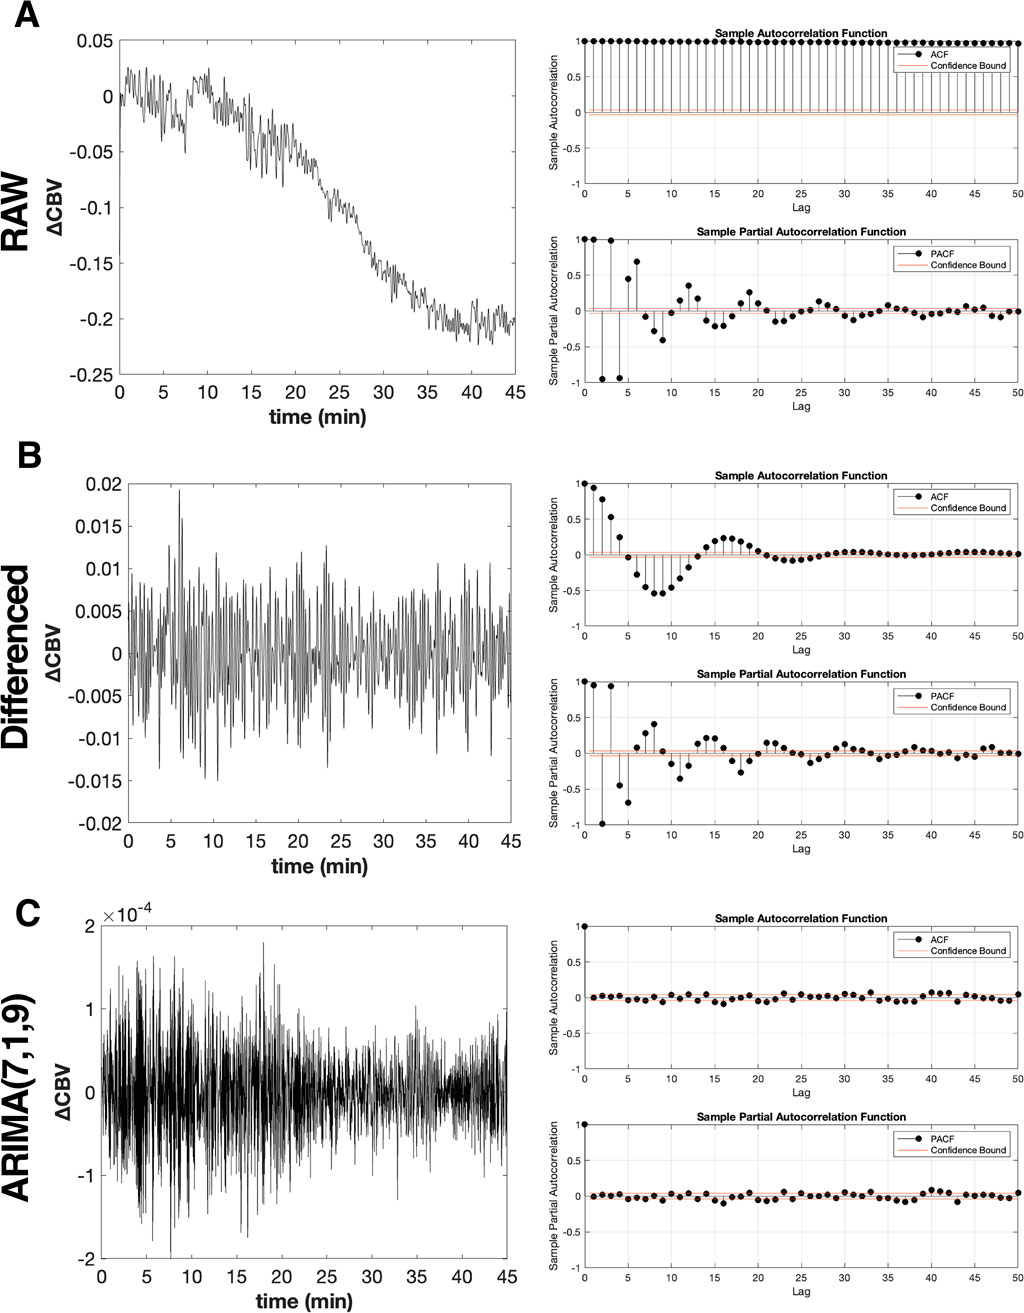
Figure 3. Transformation of non-stationary hippocampal CBV time series into stationary time series using ARIMA model. (A) Raw hippocampal CBV time series data from a representative MK-801-treated mouse (left panel), exhibiting non-stationary with respect to mean and variance pattern with an overall decreasing trend. The corresponding autocorrelation function (ACF) and partial auto-correlation function (PACF) plots (right panel) demonstrate significant autocorrelation across multiple lags, indicating strong temporal dependencies in the non-prewhitened data. (B) First-order differenced, ARIMA(0,1,0), hippocampal CBV time series data (left panel), showing improved stationarity with a more consistent mean and variance across the series. The ACF and PACF plots (right panel) reveal a reduction in autocorrelation compared to the raw data, but significant correlations still persist at certain lags. (C) ARIMA(7,1,9) prewhitened hippocampal CBV time series data (left panel), demonstrating a stationary process with constant mean (μ ≈ 0) and variance across the series. The corresponding ACF and PACF plots (right panel) show a dramatic reduction in autocorrelation, with the majority of lags falling within the confidence interval (red lines). This indicates that the ARIMA(7,1,9) model successfully captures and removes the temporal dependencies present in the raw hippocampal CBV time series data, resulting in a more stationary and uncorrelated process suitable for subsequent analyses.
The solution to this issue, pioneered by researchers such as Box, Priestley, and Granger (Box et al., 1978; Priestley, 1971; Granger and Newbold, 1974), involves transforming each univariate time series into a stationary and non-autocorrelated form by appropriately modeling the series and extracting the residuals, also known as “innovations”. The correlation between the innovations represents the true relationship between two time series, free from spurious effects caused by nonstationarity and autocorrelation (Box et al., 1978; Jenkins and Watts, 1968; Granger and Newbold, 1974). This preprocessing step, known as “prewhitening”, typically involves fitting an AutoRegressive Integrated Moving Average (ARIMA) model Box et al. (2015). The ARIMA model combines three key components: AutoRegressive (AR), Integrated (I), and Moving Average (MA), represented by the parameters
1. The AR
2. The I
3. The MA
By fine-tuning these parameters, we can forecast future time points
2.6.1 Integration (I)
Forecasting models, including ARIMA, rely on the fundamental assumption of statistical consistency in the input data, meaning that these models require the time series to exhibit constant mean and variance over time. To meet these criteria and stabilize a time series, we employ differencing, which involves calculating the changes between consecutive observations to remove trend and seasonality.
Notably, the “integrated” component
Figure 3B (left panel) shows the hippocampal
2.6.2 Autoregressive (AR) component
The AR component of the ARIMA model captures the dependency of the current observation on its past values. In an AR process, each data point is predicted as a linear combination of its previous observations, plus a random error term. The general form of an AR
Here,
Selection of the appropriate order
By identifying the lag at which PACF values become insignificant, we can estimate the appropriate order
2.6.3 Moving averages (MA) component
The moving average component is mathematically very similar to the AR model (Equation 3) such that:
Where
2.6.4 ARIMA model
After determining the appropriate integration, AR and MA processes, we combine Equation 3 and Equation 4 to construct the general ARIMA model. The comprehensive equation for the ARIMA model is expressed as:
The ARIMA model encapsulates the autocorrelation structure inherent in the time series data (Equation 5). Consequently, we obtain the stationary and nonautocorrelated residuals (i.e., “innovations”) by subtracting the ARIMA model’s predictions from the original time series. This process can be expressed as a rearrangement of Equation 5:
where
2.6.5 Model selection
The identification of an appropriate ARIMA
For each time series, we first identified multiple candidate ARIMA models by calculating the Bayesian Information Criterion (BIC) for various combinations of autoregressive (p) and moving average (q) orders. Having observed that a differencing order of d = 1 successfully achieved statistical consistency (explained in section 2.6.1) across all time series, we maintained this integration order throughout the model selection process. The range of
These candidate models were then systematically evaluated across all time series to identify a single specification that could effectively remove autocorrelation throughout the entire dataset. The effectiveness of autocorrelation removal was assessed using critical bounds defined by Equation 7.
where
Through this comprehensive evaluation process, we identified ARIMA(7,1,9) as the specification that consistently reduced autocorrelation across all time series while maintaining uniform transformation properties. Using this model, we computed the residuals for each time series according to Equation 6. The effectiveness of this model is demonstrated in Figure 3C, using the representative hippocampal CBV time series, which shows both stationary behavior in the transformed time series (left panel) and successful removal of autocorrelation as evidenced by the ACF and PACF plots (right panel). This unified approach ensured that subsequent correlation analyses would be conducted on comparably transformed data, maintaining the validity of our FC assessments.
3 Results
3.1 MK-801 reduces cerebral blood volume across multiple brain regions
Consistent with our previous findings Crown et al. (2024), MK-801 administration significantly reduced CBV across multiple ROIs within 40 min after injection compared to saline-treated controls, with the hippocampus showing the most pronounced decrease (Figure 4). To quantify these observations, we conducted a three-way mixed ANOVA with treatment (MK-801 vs. saline) as between-subjects factor, and time (first 5 min vs. last 5 min) and ROIs as the within-subjects factors. The analysis revealed significant main effects for all factors: treatment (
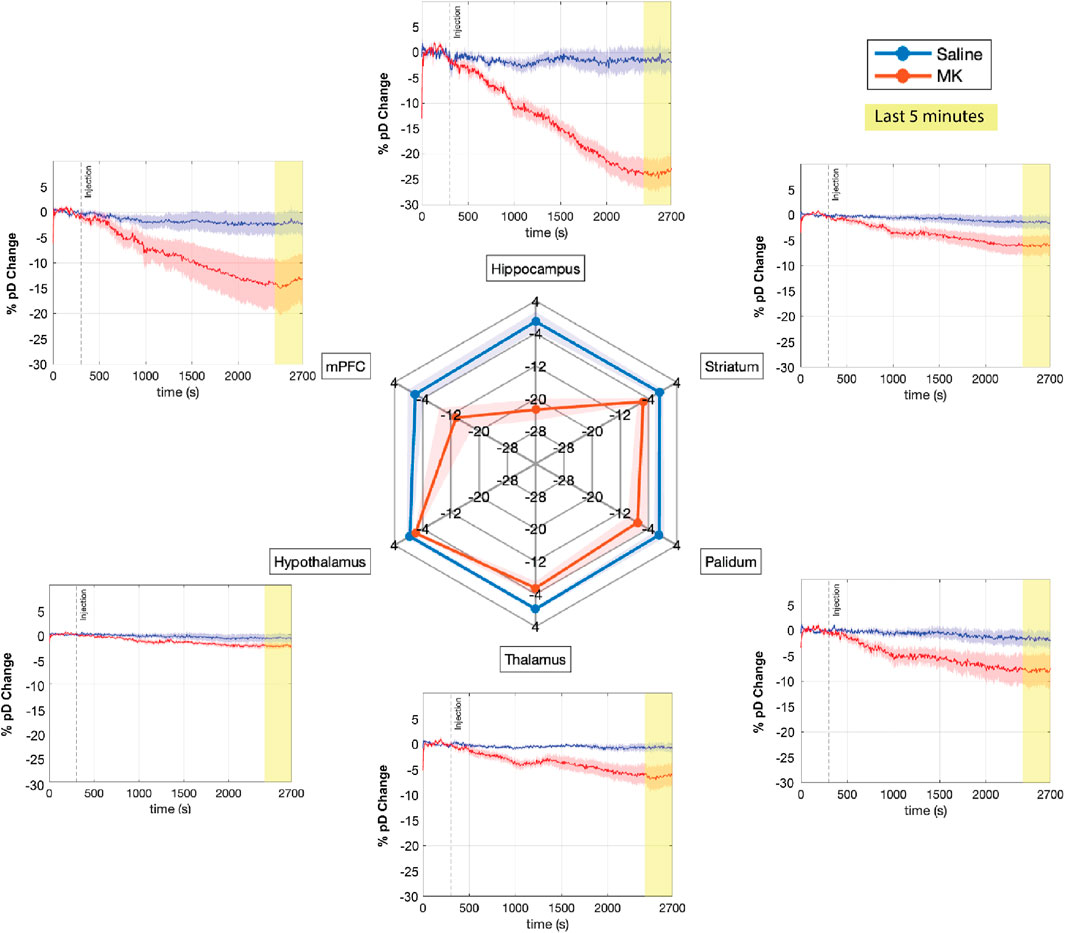
Figure 4. Effects of saline and MK-801 administration on percent CBV changes (% pD change) across multiple brain regions. The time courses of mean percent CBV changes across six ROIs are shown for saline (blue) and MK-801 (red) groups (n = 8 mice per group). The shaded areas represent the standard error of the mean. Time is displayed in seconds, with the injection (saline or MK-801) occurring at t = 300s (dashed vertical line). The last 5 minutes of recording, highlighted in yellow, were used for the spider plot analysis. The spider plot summarizes the mean % pD change during the final 5 minutes for each ROI in both groups.
To further elucidate the magnitude of the drug effects across different ROIs, we performed pairwise t-tests comparing pre-injection (initial 5 min) and post-injection (final 5 min) periods for each ROI in both treatment groups. This analysis revealed that MK-801 administration led to significant decreases in
3.2 Functional connectivity analysis reveals differential effects of MK-801 on brain network dynamics
Following the prewhitening procedure, we examined the temporal evolution of FC by segmenting the 45-min recording period into distinct temporal epochs. The recordings were partitioned into nine consecutive 5-min windows, with the first window representing baseline activity and windows 2-9 capturing post-injection dynamics (Figure 5). This analysis revealed striking differences in network reorganization between saline and MK-801 groups. In the saline group, we observed relatively stable connectivity patterns across the recordings characterized by moderate to strong connections between most ROI pairs (indicated by red edges). Although some fluctuations were observed, the overall network architecture was largely maintained throughout the recording period. In contrast, the MK-801 group exhibited a markedly different temporal progression. During the baseline period (Window 1), the connectivity patterns exhibited strengths comparable to those observed in the saline group. However, a progressive and systematic degradation of network connectivity became apparent following MK-801 administration. The deterioration was most pronounced at Windows 5-6 (25–30 min post-injection), characterized by a strong reduction in both the number and strength of connections between ROIs. By Windows 7-8 (35–40 min post-injection), the network underwent a dramatic transformation, with most connections substantially weakened and only sparse, isolated connections remaining between particular pairs of ROIs. The divergence between groups became most striking in the final temporal window (40–45 min post-injection). While the saline group maintained a relatively robust and interconnected network structure, the MK-801 group displayed a disrupted connectivity landscape, with minimal interactions between ROIs. This progressive desynchronization of the network suggests that the impact of MK-801 on brain connectivity is not an immediate event but rather a time-dependent process. The gradual nature of this connectivity breakdown potentially reflects the progressive disruption of NMDA receptor-dependent synaptic processes across neural networks, illustrating the complex and temporally nuanced effects of NMDAR antagonism on brain functional architecture.

Figure 5. Rolling functional connectivity (RFC) in saline and MK-801 groups of animals. The recorded period is divided into nine non-overlapping 5-minute windows, showing baseline (Window 1, pre-injection) and post-injection dynamics (Windows 2-9). Network diagrams display nodes representing six brain regions: hippocampus (1), striatum (2), pallidum (3), thalamus (4), hypothalamus (5), and medial prefrontal cortex (mPFC) (6). Edges indicate average FC strength across mice using Fisher-transformed Pearson correlation coefficient values. In the saline group (top row), network connectivity remains relatively stable with consistent inter-regional connections throughout the recordings. In contrast, the MK-801 group (bottom row) shows progressive degradation of network connectivity post-injection, resulting in sparse connectivity in later windows. All connectivity values are derived from prewhitened time series data.
To systematically assess the differential effects of MK-801 on network organization compared to the saline control, we examined the temporal dynamics of functional connectivity across treatment groups. For each ROI pair and each animal (N = 8 per group), we quantified the rate of change of the functional connectivity by computing the slope of RFC using linear regression. We then compared the resulting slope distributions between the MK-801 and saline groups using two-sample independent t-tests to evaluate whether the rate of connectivity change over time differed significantly between the two groups. The t-score provides a standardized measure of the differences in connectivity trajectories between the two groups. Based on previous findings (Figure 5), we anticipated a reduction in functional connectivity following MK-801 administration. Therefore, we compared the MK-801 group to the saline group, interpreting negative t-scores as indicating a greater connectivity decrease in the MK-801 group (Figure 6).
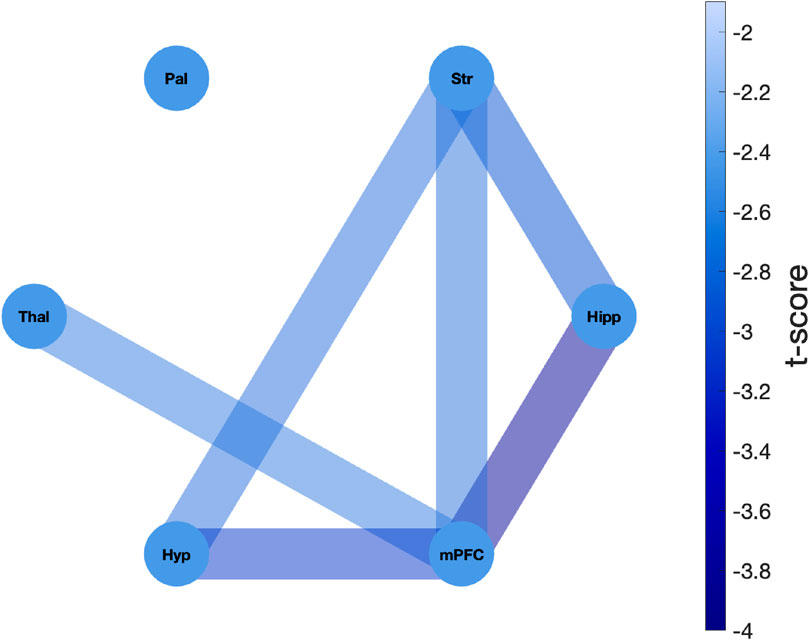
Figure 6. Network representation of differential functional connectivity changes between MK-801 and saline treatments. The network depicts the t-values derived from two-sample independent t-tests directly comparing the distributions of connectivity change slopes between MK-801 and saline groups. For each ROI pair, the t-test evaluated whether the rate of connectivity degradation over time differed significantly between treatment groups (8 slopes per group, one per animal). The network consists of six nodes, each representing an ROI: hippocampus (Hipp), striatum (Str), pallidum (Pal), thalamus (Thal), hypothalamus (Hyp), and medial prefrontal cortex (mPFC). Edges represent the t-statistics, with darker blue edge colors indicating more negative t-values and thus stronger reduction of functional connectivity across time in the MK-801 group compared to the saline group. All observed t-scores were negative, with significant differences observed in hippocampus-mPFC (t = -3.86), mPFC-hypothalamus (t = -3.12), hippocampus-striatum (t = -2.95), striatum-hypothalamus (t = -2.73), striatum-mPFC (t = -2.70), and thalamus-mPFC (t = -2.64) connections.
The analysis revealed profound differences in network connectivity dynamics between the MK-801 and saline groups. All t-scores were negative, indicating a greater reduction in functional connectivity over time in the MK-801 group compared to the saline group. The most pronounced treatment-induced differences in connectivity degradation were observed in pathways involving the hippocampus, mPFC, and striatum. Specifically, the strongest differential effects were detected in connections between the hippocampus and mPFC (t-score = −3.86), hypothalamus and mPFC (t-score = −3.12), and hippocampus and striatum (t-score = −2.95).
Notably, the mPFC exhibited consistently strong decoupling across all circuits in the MK-801 group, except for the pallidum. The most pronounced treatment-related differences (i.e., MK-801 vs. saline) were observed in the reduction of connectivity with the hippocampus (t-score = −3.86). Similarly, the striatum showed a significantly steeper decline in connectivity following MK-801 administration compared to saline group across multiple pathways, including those involving the hippocampus (t-score = −2.95), hypothalamus (t-score = −2.73) and mPFC (t-score = −2.70). These findings provide direct statistical evidence that MK-801 administration induces a significantly greater and progressive disruption of functional connectivity compared to saline, with particularly pronounced effects on limbic-cortical circuits involved in cognitive processing.
On the other hand, some interactions showed less pronounced differences between the two groups, suggesting a relative resilience to the influence of MK-801. In particular, the pallidum exhibited notable stability, with its connections to other brain regions showing no statistically significant differences between the two animal groups. Similarly, the thalamus showed relative resistance to MK-801, with only its connection to the mPFC exhibiting significant changes following MK-801 administration (t = −2.64). This pattern of selective vulnerability offers key insights into the circuit-specific effects of NMDAR antagonism, notably disrupting connectivity in hippocampal and prefrontal regions essential for learning, memory, and executive function, while largely preserving pallidal- and thalamic-based circuit.
4 Discussion
The current study offers significant insights into the effects of MK-801 on brain functional connectivity using fUSI technology. By recording high-resolution functional images from anesthetized mice and applying a prewhitening technique to eliminate spurious correlations, we investigated the time-dependent reorganization of neural networks following MK-801 administration. The results indicated that MK-801 disrupts functional connectivity across multiple brain regions, primarily affecting a network involving the mPFC, hippocampus, and striatum. These findings enhance our understanding of how NMDAR hypofunction alters brain-wide connectivity, particularly within circuits associated with cognitive disorders that affect memory and learning.
4.1 MK-801 causes reduction of CBV signal
Our results showed that MK-801 administration caused a significant reduction in CBV across multiple regions, with the hippocampus and mPFC showing the most pronounced effects. These findings align with previous studies that have reported hippocampus and mPFC as particularly sensitive to NMDAR antagonism, given their reliance on NMDA receptor-mediated synaptic transmission for proper functioning (Li et al., 2016; Neuhäusel and Gerevich, 2024; Crown et al., 2024). The pronounced impact on the hippocampus may reflect its high density of NMDAR expression, which are crucial for synaptic plasticity and memory formation Yang et al. (2022). This contrasts with regions like the thalamus and pallidum, where differences in receptor density and synaptic architecture may lead to more subtle responses to NMDAR antagonists. Additionally, the significant CBV reduction observed in mPFC is also indicative of its critical role in integrating information across cortical and subcortical regions, processes that rely heavily on NMDAR activity Wang et al. (2013).
4.2 MK-801 induces time-dependent network disruption
In addition to regional brain activity reduction, the main finding in our study is that MK-801 administration disrupted the functional connectivity across brain regions. Statistical comparison between treatment groups revealed that MK-801 administration consistently induced significantly greater degradation of functional connectivity over time compared to saline, with the most pronounced effects observed among pathways involving the hippocampus, mPFC, and striatum. The hippocampus-mPFC pathway, which showed the strongest treatment-induced disruption, plays a crucial role in integrating memory with executive control, facilitating top-down regulation and cognitive flexibility (Preston and Eichenbaum, 2013; Friedman and Robbins, 2022; Malik et al., 2022). Studies have shown that the mPFC interacts with hippocampus for rapid learning and memory consolidation, supporting decision-making processes that require recalling appropriate actions or emotional responses in specific contexts Euston et al. (2012). The significant differential disruption of the hippocampus-mPFC pathway can therefore explain memory and learning impairments commonly observed in NMDAR dysfunction models.
Additionally, the striatum, which has a key role in reward processing Cox and Witten (2019), habit formation Yin and Knowlton (2006) and action selection Markowitz et al. (2018), interacts with the mPFC Howland et al. (2022); Wilhelm et al. (2023) and hippocampus Ross et al. (2011). The hippocampus-striatum pathway supports the integration of spatial and contextual memory with reward-based behavior Ross et al. (2011), while the mPFC-striatum connection enables the regulation of goal-directed versus habitual actions (Corbit, 2018; Balleine and O’Doherty, 2010). The disruption in striatum connectivity, particularly with the hippocampus and mPFC can impair goal-directed behavior, memory, decision-making process, and cognitive flexibility, leading to maladaptive behaviors often observed in neuropsychiatric disorders such as addiction, schizophrenia, and obsessive-compulsive disorder (Saxena et al., 1998; Graybiel and Rauch, 2000; Sigurdsson and Duvarci, 2016; Meyer-Lindenberg et al., 2002; Benetti et al., 2009; Henseler et al., 2010).
Interestingly, pallidum-based circuits exhibited remarkable resilience to MK-801 administration, showing no significant differences in functional connectivity changes compared to saline administration. This pattern of selective resilience aligns with previous research indicating that the globus pallidus exhibits a minimal metabolic response to NMDAR antagonists compared to other brain regions Miyamoto et al. (2000). Such regional specificity may be attributed to differences in NMDAR subunit composition, receptor density, or the unique architecture of pallidal circuitry, suggesting that NMDAR antagonism impacts neural networks in a heterogeneous manner.
While our study predominantly identified time dependent MK-801-induced decreases in functional connectivity between key regions such as the hippocampus, mPFC, and striatum, other studies reported diverse findings regarding circuit-specific connectivity alterations in schizophrenia models. Recent multi-modal analysis of NMDAR dysfunction in schizophrenia has reported increased connectivity between striato-pallido-thalamic and cortical regions of the auditory-sensory-motor network Gaebler et al. (2023). Furthermore, other NMDAR antagonist agents such as Traxoprodil, have been found to increase hippocampal-prefrontal coupling Becker et al. (2019), while ketamine has been shown to enhance functional connectivity of the ventral striatum/nucleus accumbens and ventromedial prefrontal cortex Dandash et al. (2015). Conversely, other studies, along with ours, have observed impairements in the network, including reduced hippocampal functional connectivity and decoupling of the medial temporal, sensorimotor, frontoparietal and lateral-temporal networks (Samudra et al., 2015; Peer et al., 2017).
These apparent discrepancies may reflect important differences in species-specific network organization, the effects of acute versus chronic NMDAR hypofunction, variations in the dose and type of agents used, or differences in methodological approaches to connectivity analysis. Importantly, the high dose of MK-801 employed in our study, along with pharmacological differences between the various NMDAR antagonists and modulators used in other studies, may be particularly influential factors. Notably, the implementation of prewhitening techniques to address non-stationarity may reveal functional relationships obscured in traditional correlation analyses. Furthermore, the opposite directionality of connectivity changes may be network-specific, wherein NMDAR antagonism disrupts the excitatory/inhibitory balance differently across distinct neural circuits. These complementary findings suggest that NMDAR hypofunction does not produce uniform effects across brain networks but instead triggers a complex interplay of hyper- and hypo-connectivity, collectively contributing to the cognitive impairments observed in neuropsychiatric disorders.
4.3 Genetic insights into NMDAR dysfunction in neurological and psychiatric disorders
Recent advances have significantly enhanced our understanding of the NMDAR hypothesis in a range of neurological and psychiatric disorders Mota Vieira et al. (2020). This hypothesis has gained considerable support through the identification of both common and rare genetic variants associated with the NMDAR signaling pathway. Notably, an increasing number of variants in the GRIN genes, which encode subunits of the NMDAR, have been identified in patients with diverse neurological and psychiatric conditions, including autism spectrum disorder, epilepsy, intellectual disability, attention-deficit/hyperactivity disorder, and schizophrenia (Platzer and Lemke, 2018; Myers et al., 2019). Among these, the GRIN2A gene, encoding the GluN2A subunit of the NMDAR, has emerged as a significant contributor to disorders such as schizophrenia (Singh et al., 2022; Trubetskoy et al., 2022) and the epilepsy spectrum (Lemke et al., 2013; Samanta, 2023). The Allen Mouse Brain Atlas reveals pronounced GRIN2A expression in both the hippocampal formation and isocortex, particularly in medial prefrontal regions. This can explain the increased sensitivity of these regions to NMDAR antagonism observed in our study, where the hippocampus and mPFC exhibited the most substantial CBV and functional connectivity reduction. These genetic findings complement and extend pharmacological models such as the one employed in our study, providing converging evidence for NMDAR dysfunction as a central mechanism in a broad range of neurological and psychiatric disorders.
4.4 The importance for prewhitening the power doppler time series
Functional connectivity studies often rely on correlating time series data that have undergone various preprocessing steps, such as filtering, adjustment, smoothing, and averaging. However, an important aspect of time series data, such as their internal structure - specifically nonstationarity and autocorrelation - has not always been fully considered. When correlations are calculated without accounting for these factors, there is a risk that the resulting values may reflect a mix of unrelated influences, such as the intrinsic properties of the time series, external factors, and the true relationship between the two series, rather than providing an accurate representation of their actual association Haugh (1976). It is worth quoting from Granger and Newbold’s study Granger and Newbold (1974) in 1974: “We find it very curious that whereas virtually every textbook on econometric methodology contains explicit warnings of the dangers of autocorrelated errors, this phenomenon crops up so frequently in well-respected applied work” (Granger and Newbold, 1974, p. 111). This observation points out the persistent importance of properly addressing autocorrelation in time series analysis.
A key contribution of the current study is the introduction of a prewhitening approach to fUSI data analysis, which transforms the recorded pD signal into a stationary process by removing time-dependent trends and periodicities. We show that the raw pD time series exhibit non-stationarities that, if unaddressed, can lead to spurious correlations. By implementing prewhitening, we mitigate these issues, ensuring a more accurate assessment of pairwise FC analysis. This is particularly important for studying dynamic brain connectivity, where temporal fluctuations can confound results. Our analysis shows that prewhitening improves the reliability of FC metrics, with a significant reduction in spurious correlations compared to non-prewhitened data. This methodological advance demonstrates the necessity of preprocessing steps like prewhitening when investigating FC in both experimental and clinical settings, offering a robust solution to the challenges posed by non-stationary pD signals.
4.5 Limitations of the current study and future directions
One potential limitation of our study is the use of isoflurane anesthesia, which is a known vasodilator that can impact cerebral blood volume (CBV) and flow (CBF) (Masamoto and Kanno, 2012; Franceschini et al., 2010). Isoflurane also modulates NMDA and GABA receptors McAuliffe et al. (2009), potentially interacting with the effects of MK-801 on NMDAR function. Previous studies have shown that isoflurane can alter functional connectivity patterns, particularly in thalamocortical and cortico-cortical connections, with these effects varying based on anesthesia depth (Grandjean et al., 2014; Bukhari et al., 2017). However, since both control and MK-801-treated groups underwent identical anesthesia protocols, the between-group differences in our study can primarily be attributed to MK-801 administration. Additionally, since our study was conducted in anesthetized animals, we were unable to observe the behavioral effects of MK-801 and directly link them to changes in brain activity and connectivity. Given that MK-801 affects regions involved in memory and learning, future studies should involve awake, behaving animals performing memory- and learning-associated tasks, such as novel object recognition and the Barnes Maze. These studies should incorporate fUSI recordings to correlate behavioral changes with brain activity and connectivity alterations. Additionally, a future awake-behaving experiment would also be valuable in isolating the specific effects of MK-801 from those potentially influenced by anesthesia. Furthermore, while we explored connectivity changes in key brain regions, such as the hippocampus and mPFC, we were unable to assess the potential effects of MK-801 administration on other regions within the septohippocampal network, including the nucleus accumbens (NAc), amygdala, and medial septal nucleus (MSN), as these areas were not accessible in the selected sagittal 2-dimensional imaging plane. Future studies will involve the newly developed 3-dimensional ultrasonic probes, such as matrix arrays and raw column arrays (RCA) (Rabut et al., 2019; Sauvage et al., 2020; Bertolo et al., 2021) to generate volumetric images of the mouse brain providing access to all areas of the septohippocampal network. Furthermore, the current study implements only a single-dose protocol of MK-801, which may not fully capture the dose-dependent effects of the agent. Given the established dose-dependent effects of MK-801 on hippocampal theta and gamma oscillations Saunders et al. (2012), it is important for future studies to evaluate how different doses affect CBV and functional connectivity in the recorded brain areas. Overall, despite the limitations, our study provides direct evidence that MK-801 disrupts connectivity between key brain regions involved in learning, memory and other higher-order cognitive functions. These findings offer valuable insights into the neural basis of cognitive impairments associated with various neuropsychiatric disorders and open new avenues for future research into targeted interventions.
Data availability statement
The original contributions presented in the study are included in the article/supplementary material, further inquiries can be directed to the corresponding author.
Ethics statement
The animal study was approved by University of Southern California, Institutional Animal Care and Use Committee (IACUC $\#$ 21006). The study was conducted in accordance with the local legislation and institutional requirements.
Author contributions
EH: Conceptualization, Data curation, Formal Analysis, Investigation, Visualization, Writing – original draft, Writing – review and editing. AS: Writing – original draft, Writing – review and editing. SZ: Writing – original draft, Writing – review and editing. KA: Writing – original draft, Writing – review and editing. NZ: Writing – original draft, Writing – review and editing, Data curation. KW: Data curation, Writing – original draft, Writing – review and editing. CL: Funding acquisition Writing – original draft, Writing – review and editing, Conceptualization. DL: Conceptualization, Writing – original draft, Writing – review and editing, Funding acquisition, Project administration, Resources, Supervision. VC: Conceptualization, Funding acquisition, Resources, Supervision, Writing – original draft, Writing – review and editing, Data curation, Formal Analysis, Investigation, Methodology, Validation, Visualization.
Funding
The author(s) declare that financial support was received for the research and/or publication of this article. Keck School of Medicine Dean’s Pilot Funding Program (DL). NIMH: 1K08MH121757-01A1 Mentored Clinician Scientist development award (DL). Neurorestoration Center at the University of Southern California (CL). The Marlan and Rosemary Bourns College of Engineering at the University of California Riverside through start-up funding (VC). The University of California Leadership Excellence through Advanced Degrees (UC LEADS) Program at the University of California, Riverside (EH).
Conflict of interest
The authors declare that the research was conducted in the absence of any commercial or financial relationships that could be construed as a potential conflict of interest.
Generative AI statement
The author(s) declare that no Generative AI was used in the creation of this manuscript.
Publisher’s note
All claims expressed in this article are solely those of the authors and do not necessarily represent those of their affiliated organizations, or those of the publisher, the editors and the reviewers. Any product that may be evaluated in this article, or claim that may be made by its manufacturer, is not guaranteed or endorsed by the publisher.
References
Abad-Perez, P., Molina-Payá, F. J., Martínez-Otero, L., Borrell, V., Redondo, R. L., and Brotons-Mas, J. R. (2023). Theta/gamma co-modulation disruption after nmdar blockade by mk-801 is associated with spatial working memory deficits in mice. Neuroscience 519, 162–176. doi:10.1016/j.neuroscience.2023.03.022
Balleine, B., and O’Doherty, J. (2010). Human and rodent homologies in action control: corticostriatal determinants of goal-directed and habitual action. Neuropsychopharmacology 35, 48–69. doi:10.1038/npp.2009.131
Becker, R., Gass, N., Kußmaul, L., Schmid, B., Scheuerer, S., Schnell, D., et al. (2019). NMDA receptor antagonists traxoprodil and lanicemine improve hippocampal-prefrontal coupling and reward-related networks in rats. Psychopharmacology 236, 3451–3463. doi:10.1007/s00213-019-05310-3
Bedford, N. J., Surguladze, S., Giampietro, V., Brammer, M. J., and David, A. S. (2012). Self-evaluation in schizophrenia: an fmri study with implications for the understanding of insight. BMC Psychiatry 12, 106. doi:10.1186/1471-244X-12-106
Benetti, S., Mechelli, A., Picchioni, M., Broome, M., Williams, S., and McGuire, P. (2009). Functional integration between the posterior hippocampus and prefrontal cortex is impaired in both first episode schizophrenia and the at risk mental state. Brain 132, 2426–2436. doi:10.1093/brain/awp098
Bertolo, A., Nouhoum, M., Cazzanelli, S., Ferrier, J., Mariani, J. C., Kliewer, A., et al. (2021). Whole-brain 3d activation and functional connectivity mapping in mice using transcranial functional ultrasound imaging. J. Vis. Exp. 168, e62267. doi:10.3791/62267
Box, G. E. P., Hunter, W. G., and Hunter, J. S. (1978). Statistics for experimenters. New York: Wiley.
Box, G. E. P., Jenkins, G. M., Reinsel, G. C., and Ljung, G. M. (2015). Time series analysis: forecasting and control. John Wiley and Sons.
Box, G. E. P., and Newbold, P. (1971). Some comments on a paper of coen, gomme and kendall. J. R. Stat. Soc. Ser. A General. 134, 229–240. doi:10.2307/2343873
Bukhari, Q., Schroeter, A., Cole, D. M., and Rudin, M. (2017). Resting state fmri in mice reveals anesthesia specific signatures of brain functional networks and their interactions. Front. neural circuits 11 (5), 5. doi:10.3389/fncir.2017.00005
Christopoulos, V. N., Boeff, D. V., Evans, C. D., Crowe, D. A., Amirikian, B., Georgopoulos, A., et al. (2012a). A network analysis of developing brain cultures. J. Neural Eng. 9, 046008. doi:10.1088/1741-2560/9/4/046008
Christopoulos, V. N., Leuthold, A. C., and Georgopoulos, A. P. (2012b). Spatiotemporal neural interactions underlying continuous drawing movements as revealed by magnetoencephalography. Exp. Brain Res. 222, 159–171. doi:10.1007/s00221-012-3208-3
Christova, P., Lewis, S. M., Jerde, T. A., Lynch, J. K., and Georgopoulos, A. P. (2011). True associations between resting fmri time series based on innovations. J. neural Eng. 8, 046025. doi:10.1088/1741-2560/8/4/046025
Clayton, D. A., Grosshans, D. R., and Browning, M. D. (2002). Aging and surface expression of hippocampal nmda receptors. J. Biol. Chem. 277, 14367–14369. doi:10.1074/jbc.C200074200
Coen, P. J., Gomme, E. D., and Kendall, M. G. (1969). Lagged relationships in economic forecasting. J. R. Stat. Soc. Ser. A General. 132, 133–163. doi:10.2307/2343782
Corbit, L. H. (2018). Understanding the balance between goal-directed and habitual behavioral control. Curr. Opin. Behav. Sci. 20, 161–168. doi:10.1016/j.cobeha.2018.01.010
Cordes, D., Haughton, V. M., Arfanakis, K., Carew, J. D., Turski, P. A., Moritz, C. H., et al. (2001). Frequencies contributing to functional connectivity in the cerebral cortex in “resting-state” data. AJNR Am. J. Neuroradiol. 22, 1326–1333.
Cox, J., and Witten, I. B. (2019). Striatal circuits for reward learning and decision-making. Nat. Rev. Neurosci. 20, 482–494. doi:10.1038/s41583-019-0189-2
Crown, L. M., Agyeman, K. A., Choi, W., Zepeda, N., Iseri, E., Pahlavan, P., et al. (2024). Theta-frequency medial septal nucleus deep brain stimulation increases neurovascular activity in mk-801-treated mice. Front. Neurosci. 18, 1372315. doi:10.3389/fnins.2024.1372315
Dandash, O., Harrison, B. J., Adapa, R., Gaillard, R., Giorlando, F., Wood, S. J., et al. (2015). Selective augmentation of striatal functional connectivity following NMDA receptor antagonism: implications for psychosis. Neuropsychopharmacology 40, 622–631. doi:10.1038/npp.2014.210
Euston, D. R., Gruber, A. J., and McNaughton, B. L. (2012). The role of medial prefrontal cortex in memory and decision making. Neuron 76, 1057–1070. doi:10.1016/j.neuron.2012.12.002
Franceschini, M. A., Radhakrishnan, H., Thakur, K., Wu, W., Ruvinskaya, S., Carp, S., et al. (2010). The effect of different anesthetics on neurovascular coupling. Neuroimage 51, 1367–1377. doi:10.1016/j.neuroimage.2010.03.060
Friedman, N. P., and Robbins, T. W. (2022). The role of prefrontal cortex in cognitive control and executive function. Neuropsychopharmacology 47, 72–89. doi:10.1038/s41386-021-01132-0
Gaebler, A. J., Fakour, N., Stöhr, F., Zweerings, J., Taebi, A., Suslova, M., et al. (2023). Functional connectivity signatures of NMDAR dysfunction in schizophrenia-integrating findings from imaging genetics and pharmaco-fmri. Transl. Psychiatry 13, 59. doi:10.1038/s41398-023-02344-2
Gonzalez, M. I., Sinha, A., Burchfield, S. R., Moore, K. E., and Pepeu, G. (1994). NMDA receptor antagonists decrease gaba outflow from the septum and increase acetylcholine outflow from the hippocampus: a microdialysis study. J. Neurosci. 14, 1358–1365. doi:10.1523/JNEUROSCI.14-03-01358.1994
Grandjean, J., Schroeter, A., Batata, I., and Rudin, M. (2014). Optimization of anesthesia protocol for resting-state fmri in mice based on differential effects of anesthetics on functional connectivity patterns. Neuroimage 102, 838–847. doi:10.1016/j.neuroimage.2014.08.043
Granger, C. W. J., and Newbold, P. (1974). Spurious regressions in econometrics. J. Econ. 2, 111–120. doi:10.1016/0304-4076(74)90034-7
Graybiel, A. M., and Rauch, S. L. (2000). Toward a neurobiology of obsessive-compulsive disorder. Neuron 28, 343–347. doi:10.1016/s0896-6273(00)00113-6
Gur, R. E., and Gur, R. C. (2010). Functional magnetic resonance imaging in schizophrenia. Dialogues Clin. Neurosci. 12, 333–343. doi:10.31887/DCNS.2010.12.3/rgur
Haugh, L. D. (1976). Checking the independence of two covariance-stationary time series: a univariate residual cross-correlation approach. J. Am. Stat. Assoc. 71, 378–385. doi:10.2307/2285318
Henseler, I., Falkai, P., and Gruber, O. (2010). Disturbed functional connectivity within brain networks subserving domain-specific subcomponents of working memory in schizophrenia: relation to performance and clinical symptoms. J. Psychiatric Res. 44, 364–372. doi:10.1016/j.jpsychires.2009.09.003
Howland, J. G., Ito, R., Lapish, C. C., and Villaruel, F. R. (2022). The rodent medial prefrontal cortex and associated circuits in orchestrating adaptive behavior under variable demands. Neurosci. Biobehav. Rev. 135, 104569. doi:10.1016/j.neubiorev.2022.104569
Jenkins, G. M., and Watts, D. G. (1968). Spectral analysis and its applications. Oakland, CA: Holden Day.
Jodo, E. (2013). The role of the hippocampo-prefrontal cortex system in phencyclidine-induced psychosis: a model for schizophrenia. J. Physiology-Paris 107, 434–440. doi:10.1016/j.jphysparis.2013.06.002
Khakpai, F., Nasehi, M., Haeri-Rohani, A., Eidi, A., and Zarrindast, M. R. (2013a). Septo-hippocampo-septal loop and memory formation. Basic Clin. Neurosci. 4 (5), 5–23.
Khakpai, F., Zarrindast, M. R., Nasehi, M., Haeri-Rohani, A., and Eidi, A. (2013b). The role of glutamatergic pathway between septum and hippocampus in the memory formation. EXCLI J. 12, 41–51.
Krystal, J. H., Karper, L. P., Seibyl, J. P., Freeman, G. K., Delaney, R., Bremner, J. D., et al. (1994). Subanesthetic effects of the noncompetitive NMDA antagonist, ketamine, in humans: psychotomimetic, perceptual, cognitive, and neuroendocrine responses. Archives general psychiatry 51, 199–214. doi:10.1001/archpsyc.1994.03950030035004
Ledoux, L. A. F., Brands, P. J., and Hoeks, A. P. G. (1997). Reduction of the clutter component in Doppler ultrasound signals based on singular value decomposition: a simulation study. Ultrason. imaging 19, 1–18. doi:10.1177/016173469701900101
Lee, G., and Zhou, Y. (2019). NMDAR hypofunction animal models of schizophrenia. Front. Mol. Neurosci. 12, 185. doi:10.3389/fnmol.2019.00185
Lemke, J. R., Lal, D., Reinthaler, E. M., Steiner, I., Nothnagel, M., Alber, M., et al. (2013). Mutations in grin2a cause idiopathic focal epilepsy with rolandic spikes. Nat. Genet. 45, 1067–1072. doi:10.1038/ng.2728
Li, J. T., Su, Y. A., Wang, H. L., Zhao, Y. Y., Liao, X. M., Wang, X. D., et al. (2016). Repeated blockade of NMDA receptors during adolescence impairs reversal learning and disrupts gabaergic interneurons in rat medial prefrontal cortex. Front. Mol. Neurosci. 9, 17. doi:10.3389/fnmol.2016.00017
Liu, J., Chang, L., Song, Y., Li, H., and Wu, Y. (2019). The role of nmda receptors in alzheimer’s disease. Front. Neurosci. 13, 43. doi:10.3389/fnins.2019.00043
MacDonald, S. W., Nyberg, L., and Bäckman, L. (2006). Intra-individual variability in behavior: links to brain structure, neurotransmission and neuronal activity. Trends Neurosci. 29, 474–480. doi:10.1016/j.tins.2006.06.011
Macé, E., Montaldo, G., Cohen, I., Baulac, M., Fink, M., and Tanter, M. (2011). Functional ultrasound imaging of the brain. Nat. Methods 8, 662–664. doi:10.1038/nmeth.1641
Malik, R., Li, Y., Schamiloglu, S., and Sohal, V. S. (2022). Top-down control of hippocampal signal-to-noise by prefrontal long-range inhibition. Cell 185, 1602–1617.e17. doi:10.1016/j.cell.2022.04.001
Markowitz, J. E., Gillis, W. F., Beron, C. C., Neufeld, S. Q., Robertson, K., Bhagat, N. D., et al. (2018). The striatum organizes 3d behavior via moment-to-moment action selection. Cell 174, 44–58.e17. doi:10.1016/j.cell.2018.04.019
Masamoto, K., and Kanno, I. (2012). Anesthesia and the quantitative evaluation of neurovascular coupling. J. Cereb. Blood Flow and Metabolism 32, 1233–1247. doi:10.1038/jcbfm.2012.50
McAuliffe, J. J., Loepke, A. W., Miles, L., Joseph, B., Hughes, E., and Vorhees, C. V. (2009). Desflurane, isoflurane, and sevoflurane provide limited neuroprotection against neonatal hypoxia-ischemia in a delayed preconditioning paradigm. Anesthesiology 111, 533–546. doi:10.1097/ALN.0b013e3181b060d3
McLamb, R. L., Williams, L. R., Nanry, K. P., Wilson, W. A., and Tilson, H. A. (1990). Mk-801 impedes the acquisition of a spatial memory task in rats. Pharmacol. Biochem. Behav. 37, 41–45. doi:10.1016/0091-3057(90)90038-j
Meyer-Lindenberg, A., Miletich, R. S., Kohn, P. D., Esposito, G., Carson, R. E., Quarantelli, M., et al. (2002). Reduced prefrontal activity predicts exaggerated striatal dopaminergic function in schizophrenia. Nat. Neurosci. 5, 267–271. doi:10.1038/nn804
Miyamoto, S., Leipzig, J. N., Lieberman, J. A., and Duncan, G. E. (2000). Effects of ketamine, mk-801, and amphetamine on regional brain 2-deoxyglucose uptake in freely moving mice. Neuropsychopharmacology 22, 400–412. doi:10.1016/S0893-133X(99)00127-X
Mota Vieira, M., Nguyen, T. A., Wu, K., Badger, J. D. n., Collins, B. M., Anggono, V., et al. (2020). An epilepsy-associated grin2a rare variant disrupts camkii phosphorylation of glun2a and nmda receptor trafficking. Cell Rep. 32, 108104. doi:10.1016/j.celrep.2020.108104
Myers, S. J., Yuan, H., Kang, J. Q., Tan, F. C. K., Traynelis, S. F., and Low, C. M. (2019). Distinct roles of grin2a and grin2b variants in neurological conditions. F1000Research 8, F1000 Faculty Rev-1940–1940. doi:10.12688/f1000research.18949.1
Neuhäusel, T. S., and Gerevich, Z. (2024). Sex-specific effects of subchronic NMDA receptor antagonist mk-801 treatment on hippocampal gamma oscillations. Front. Neurosci. 18, 1425323. doi:10.3389/fnins.2024.1425323
Newcomer, J. W., Farber, N. B., Jevtovic-Todorovic, V., Selke, G., Melson, A. K., Hershey, T., et al. (1999). Ketamine-induced NMDA receptor hypofunction as a model of memory impairment and psychosis. Neuropsychopharmacology 20, 106–118. doi:10.1016/S0893-133X(98)00067-0
Peer, M., Prüss, H., Ben-Dayan, I., Paul, F., Arzy, S., and Finke, C. (2017). Functional connectivity of large-scale brain networks in patients with anti-NMDA receptor encephalitis: an observational study. Lancet Psychiatry 4, 768–774. doi:10.1016/S2215-0366(17)30330-9
Pitkänen, M., Sirviö, J., MacDonald, E., Niemi, S., Ekonsalo, T., and Riekkinen Sr, P. (1995). The effects of d-cycloserine and mk-801 on the performance of rats in two spatial learning and memory tasks. Eur. Neuropsychopharmacol. 5, 457–463. doi:10.1016/0924-977x(95)80004-l
Platzer, K., and Lemke, J. R. (2018). “Grin2b-related neurodevelopmental disorder. Updated 2021 Mar 25,” in GeneReviews®. M. P. Adam, J. Feldman, and G. M. Mirzaa (Seattle (WA): University of Washington, Seattle), 1993–2025.
Preston, A. R., and Eichenbaum, H. (2013). Interplay of hippocampus and prefrontal cortex in memory. Curr. Biol. 23, R764–R773. doi:10.1016/j.cub.2013.05.041
Priestley, M. B. (1971). Fitting relationships between time series. Bull. Inst. Int. Statistics 38, 1–27.
Rabut, C., Correia, M., Finel, V., Pezet, S., Pernot, M., Deffieux, T., et al. (2019). 4d functional ultrasound imaging of whole-brain activity in rodents. Nat. Methods 16, 994–997. doi:10.1038/s41592-019-0572-y
Ross, R. S., Sherrill, K. R., and Stern, C. E. (2011). The hippocampus is functionally connected to the striatum and orbitofrontal cortex during context dependent decision making. Brain Res. 1423, 53–66. doi:10.1016/j.brainres.2011.09.038
Sakellaridi, S., Christova, P., Christopoulos, V., Leuthold, A. C., Peponis, J., and Georgopoulos, A. P. (2015). Neural mechanisms underlying the exploration of small city maps using magnetoencephalography. Exp. Brain Res. 233, 3187–3200. doi:10.1007/s00221-015-4387-5
Samanta, D. (2023). Grin2a-related epilepsy and speech disorders: a comprehensive overview with a focus on the role of precision therapeutics. Epilepsy Res. 189, 107065. doi:10.1016/j.eplepsyres.2022.107065
Samudra, N., Ivleva, E. I., Hubbard, N. A., Rypma, B., Sweeney, J. A., Clementz, B. A., et al. (2015). Alterations in hippocampal connectivity across the psychosis dimension. Psychiatry Res. 233, 148–157. doi:10.1016/j.pscychresns.2015.06.004
Saunders, J. A., Gandal, M. J., and Siegel, S. J. (2012). NMDA antagonists recreate signal-to-noise ratio and timing perturbations present in schizophrenia. Neurobiol. Dis. 46, 93–100. doi:10.1016/j.nbd.2011.12.049
Sauvage, J., Porée, J., Rabut, C., Férin, G., Flesch, M., Rosinski, B., et al. (2020). 4d functional imaging of the rat brain using a large aperture row-column array. IEEE Trans. Med. Imaging 39, 1884–1893. doi:10.1109/TMI.2019.2959833
Saxena, S., Brody, A. L., Schwartz, J. M., and Baxter, L. R. (1998). Neuroimaging and frontal-subcortical circuitry in obsessive-compulsive disorder. Br. J. Psychiatry Suppl. 35, 26–37. doi:10.1192/s0007125000297870
Sigurdsson, T., and Duvarci, S. (2016). Hippocampal-prefrontal interactions in cognition, behavior and psychiatric disease. Front. Syst. Neurosci. 9, 190. doi:10.3389/fnsys.2015.00190
Singh, T., Poterba, T., Curtis, D., Akil, H., Al Eissa, M., Barchas, J. D., et al. (2022). Rare coding variants in ten genes confer substantial risk for schizophrenia. Nature 604, 509–516. doi:10.1038/s41586-022-04556-w
Stringer, C., and Pachitariu, M. (2019). Computational processing of neural recordings from calcium imaging data. Curr. Opin. Neurobiol. 55, 22–31. doi:10.1016/j.conb.2018.11.005
Tanter, M., and Fink, M. (2014). Ultrafast imaging in biomedical ultrasound. IEEE Trans. ultrasonics, Ferroelectr. Freq. control 61, 102–119. doi:10.1109/TUFFC.2014.6689779
Trubetskoy, V., Pardiñas, A. F., Qi, T., Panagiotaropoulou, G., Awasthi, S., Bigdeli, T. B., et al. (2022). Mapping genomic loci implicates genes and synaptic biology in schizophrenia. Nature 604, 502–508. doi:10.1038/s41586-022-04434-5
van der Staay, F. J., Rutten, K., Erb, C., and Blokland, A. (2011). Effects of the cognition impairer mk-801 on learning and memory in mice and rats. Behav. Brain Res. 220, 215–229. doi:10.1016/j.bbr.2011.01.052
Wang, M., Yang, Y., Wang, C. J., Gamo, N. J., Jin, L. E., Mazer, J. A., et al. (2013). NMDA receptors subserve persistent neuronal firing during working memory in dorsolateral prefrontal cortex. Neuron 77, 736–749. doi:10.1016/j.neuron.2012.12.032
Wegener, N., Nagel, J., Gross, R., Chambon, C., Greco, S., Pietraszek, M., et al. (2011). Evaluation of brain pharmacokinetics of (+) mk-801 in relation to behaviour. Neurosci. Lett. 503, 68–72. doi:10.1016/j.neulet.2011.08.012
Wiescholleck, V., and Manahan-Vaughan, D. (2012). Pde4 inhibition enhances hippocampal synaptic plasticity in vivo and rescues mk801-induced impairment of long-term potentiation and object recognition memory in an animal model of psychosis. Transl. Psychiatry 2, e89. doi:10.1038/tp.2012.17
Wilhelm, M., Sych, Y., Fomins, A., Alatorre Warren, J. L., Lewis, C., Serratosa Capdevila, L., et al. (2023). Striatum-projecting prefrontal cortex neurons support working memory maintenance. Nat. Commun. 14, 7016. doi:10.1038/s41467-023-42777-3
Yang, X., Gong, R., Qin, L., Bao, Y., Fu, Y., Gao, S., et al. (2022). Trafficking of NMDA receptors is essential for hippocampal synaptic plasticity and memory consolidation. Cell Rep. 40, 111217. doi:10.1016/j.celrep.2022.111217
Yin, H. H., and Knowlton, B. J. (2006). The role of the basal ganglia in habit formation. Nat. Rev. Neurosci. 7, 464–476. doi:10.1038/nrn1919
Keywords: functional ultrasound imaging (fUSI), brain network connectivity, prewhitening analysis, MK-801, NMDAR inhibition, memory, learning, neuropsychiatric disorders
Citation: Hakopian E, Stepanian AE, Zhong S, Agyeman KA, Zepeda N, Wu K, Liu C, Lee DJ and Christopoulos V (2025) Functional ultrasound imaging and prewhitening analysis reveal MK-801-induced disruption of brain network connectivity. Front. Pharmacol. 16:1562102. doi: 10.3389/fphar.2025.1562102
Received: 16 January 2025; Accepted: 02 April 2025;
Published: 03 June 2025.
Edited by:
Francisco Lopez-Munoz, Camilo José Cela University, SpainReviewed by:
Arnim Johannes Gaebler, University Hospital RWTH Aachen, GermanyAsmaa ShamsEldeen, Cairo University, Egypt
Copyright © 2025 Hakopian, Stepanian, Zhong, Agyeman, Zepeda, Wu, Liu, Lee and Christopoulos. This is an open-access article distributed under the terms of the Creative Commons Attribution License (CC BY). The use, distribution or reproduction in other forums is permitted, provided the original author(s) and the copyright owner(s) are credited and that the original publication in this journal is cited, in accordance with accepted academic practice. No use, distribution or reproduction is permitted which does not comply with these terms.
*Correspondence: Vassilios Christopoulos, dmNocmlzdG9AdXNjLmVkdQ==