 Dongling Cai1,2,3
 Ying Chan
 Baosheng Zhu
- 1Department of Medical Genetics, NHC Key Laboratory of Healthy Birth and Birth Defect Prevention in Western China, The First People’s Hospital of Yunnan Province, Kunming, China
- 2School of Medicine, Kunming University of Science and Technology, Kunming, China
- 3School of Life Sciences, Kunming University of Science and Technology, Kunming, Yunnan, China
Introduction: β-thalassemia is a genetic hemoglobinopathy characterized by defective β-globin synthesis and ineffective erythropoiesis. Pharmacological induction of fetal hemoglobin (HbF) via γ-globin gene activation represents a promising therapeutic strategy. Total ginsenosides (TG), the principal active constituents of Panax ginseng, have shown epigenetic and transcriptional modulatory properties, yet their role in HbF induction remains unexplored.
Methods: We evaluated the HbF-inducing potential of TG using human erythroleukemia cell line (K562), primary erythroid precursor cells (ErPCs) derived from CD34+ umbilical cord blood, and Townes transgenic mice. TG was administered at varying concentrations in vitro (25–400 μg/mL) and in vivo (50–800 mg/kg/day for 14 days). HbF and γ-globin expression were quantified by flow cytometry, immunofluorescence, and RT-qPCR. Hemoglobin content, cell viability, and hepatic histology were also assessed.
Results: TG significantly induced HbF production and γ-globin gene expression in both cellular models in a dose-dependent manner. In K562 cells, 200 μg/mL TG elevated γ-globin mRNA by 4.29-fold; in ErPCs, the increase was 1.46-fold. HbF-positive cell populations rose markedly without impairing cell viability or morphology. In vivo, TG treatment at 200 and 400 mg/kg led to 2.8- and 3.1-fold increases in F-cell proportions, respectively, surpassing hydroxyurea controls. No hepatotoxicity was observed upon histopathological examination.
Discussion: These findings establish TG as a potent, well-tolerated inducer of HbF through transcriptional activation of the γ-globin gene. Its efficacy across erythroid cell lines, primary progenitor cells, and transgenic mouse models underscores its translational potential as a natural therapeutic agent for β-thalassemia.
1 Introduction
β-thalassemia is an autosomal recessive hemoglobinopathy characterized by diminished or absent β-globin production (Origa, 2017), leading to chronic hemolytic anemia and cellular hypoxia (Kattamis et al., 2022). Mutations in the β-globin gene result in impaired synthesis of the β-globin peptide, which causes excessive α-globin peptide aggregation within red blood cells (Keith et al., 2023). This aggregation compromises the stability of the erythrocyte membrane and reduces the lifespan of the cells (Mohandas and Gallagher, 2008). Clinical manifestations of β-thalassemia encompass chronic anemia, iron overload, hepatosplenomegaly, cardiac insufficiency, and heart failure (Rachmilewitz and Giardina, 2011; Taher et al., 2018). The severity of symptoms correlates with the extent of α- and β-globin peptide chain imbalance (Mettananda et al., 2017). Phenotypes span from asymptomatic thalassemia traits to severe transfusion-dependent thalassemia that requires regular blood transfusions for survival (Thompson et al., 2018).
Fetal hemoglobin (HbF) plays a crucial role in reducing the severity of β-thalassemia by forming tetramers composed of 2 α-globin peptides and 2 γ-globin peptides (Bauer et al., 2012; Pavan et al., 2022). This prevents the aggregation of excessive α-globin peptide chains into harmful oligomers (Natta et al., 1974; Iftikhar et al., 2022). By carrying and delivering oxygen, HbF relieves the symptoms of β-thalassemia (Wu et al., 2019). However, currently available HbF inducers, such as 5-azacytidine (Clegg et al., 1983), decitabine (Olivieri et al., 2011), hydroxyurea (HU) (Algiraigri et al., 2017), butyrates (Rund and Rachmilewitz, 2000), and short-chain fatty acids (Pace et al., 2002), exhibit variable response magnitudes and are associated with side effects (Costa et al., 2022). Consequently, researchers are investigating new HbF inducers with improved safety and efficacy profiles. These include pharmacological agents and bioactive compounds derived from natural sources, such as camptothecin (Wang et al., 2015), resveratrol (Franco et al., 2014), curcumin (Koonyosying et al., 2020; Eghbali et al., 2023), cucurbitacin D (Liu et al., 2010) and angelicin (Viola et al., 2008), for the effective management of β-thalassemia.
Ginseng (Panax ginseng), a perennial herbaceous plant in the Araliaceae family (Guo et al., 2021), is highly valued in Asia for its medicinal properties, with a history spanning centuries (Fan et al., 2023). It is known for its various health benefits (Xu et al., 2017), such as relieving cold symptoms (Alsayari et al., 2021), providing energy (Bach et al., 2016), and promoting overall vitality (Wee et al., 2011). The primary active constituents of ginseng are the total ginsenosides (TG), which consist of a diverse range of steroidal saponins (Yu et al., 2021; Liu et al., 2024). Although TG’s positive effects on ischemia/reperfusion injury are well-established (Chen et al., 2023), their potential to stimulate γ-globin chain synthesis and their therapeutic implications have not been thoroughly explored. Recent findings suggest that ginsenosides have the ability to upregulate HBG gene expression and activate relevant pathways involved in γ-globin chain biosynthesis (Das et al., 2019). This insight is supported by microRNA and gene expression analysis, opening up new possibilities for research in this field.
In this study, we utilize human erythroleukemia cell line (K562) (Khan et al., 2020) and erythroid precursor cells (ErPCs) (Zeuner et al., 2003; Zuccato et al., 2021) as in vitro models, and Townes model mice as in vivo models (Woodard et al., 2022), to investigate the potential of TG to induce γ-globin gene expression and HbF production. Our objective is to validate TG as a promising therapeutic agent for the treatment of β-thalassemia.
2 Materials and methods
2.1 High-performance liquid chromatography analysis of TG
Ginsenoside standards, including ginsenosides Rg1, Re, Rf, Rg2, Rb1, Rc, Rb2, and Rd, were obtained from Yuanye Bio-Technology (Shanghai, China) and were dissolved in methanol for analysis. High-performance liquid chromatography (HPLC) evaluation was performed using a Waters Acquity UPLC H-Class system equipped with a Waters BEH C18 1.7 μm 2.1 × 100 mm column. The elution was carried out using a mobile phase composed of acetonitrile (A) and water with 1 mL of 85% phosphoric acid per liter (B). The gradient program of elution consisted of the following steps at a flow rate of 0.4 mL/min: starting with 19.0% A and gradually increasing to 21.0% at 7.31 min, 28.0% at 10.31 min, 31.0% at 16.31 min, and 38.5% at 21.31 min, reaching a peak of 90.0% at 22.00 min, and then decreasing to 19.0% at 25.50 min and maintaining that level until 27.50 min. Throughout the analysis, the column temperature was held constant at 45°C, and the absorbance was continuously monitored at 203 nm.
2.2 Culture and treatment of K562 cells
The K562 human chronic myelogenous leukemia cell line (Kunming Cell Bank, Kunming, China, ID: KCB90029YJ) was cultured in RPMI-1640 medium supplemented with 10% fetal bovine serum (FBS), 100 U/mL penicillin, and 100 mg/mL streptomycin, all obtained from Gibco (Grand Island, NY, United States) (Fathi et al., 2019). Cells were plated at an initial density of 3 × 10⁴ cells/mL and subsequently exposed to a range of TG concentrations (25, 50, 100, 200, and 400 μg/mL) (Yuanye Bio-Technology, Shanghai, China). A negative control group without any drug treatment was included, while a positive control group was treated with 200 μM HU (Sigma, United States). HU has been demonstrated to increase HbF levels (Steinberg, 2020) in both K562 cells and adult ErPCs (Zhu et al., 2014), and it is utilized in the treatment of β-thalassemia patients (Sales et al., 2021; Gambari et al., 2024). It is noted that 200 μM HU is considered the optimal concentration for inducing HbF production. The cells were incubated at 37°C in a humidified environment with 5% CO2 for 1–5 days.
2.3 CD34+ cell isolation and culture
CD34+ cells were isolated from umbilical cord blood samples collected from three voluntary donors at the Department of Medical Genetics, First People’s Hospital of Yunnan Province. All participants provided informed consent, and the study protocol was approved by the hospital’s Ethics Committee. Fresh cord blood was obtained using sodium heparin collection bags (Nigale, China) to ensure proper anticoagulation. Following the manufacturer’s guidelines, the blood was diluted with phosphate-buffered saline (PBS) at a 1:1 ratio. The mononuclear cell fraction was isolated using Lymphoprep™ (STEMCELL Technologies, Canada), and subsequent purification of CD34+ cells was performed using the CD34 MultiSort Kit for humans (Miltenyi Biotec, Germany) for monocyte sorting (Eghbali et al., 2023).
The cultivation of CD34+ cells was performed according to established protocols (Zuccato et al., 2021). In the initial phase (days 1–6), cells were cultured in Iscove’s Modified Dulbecco’s Medium (IMDM) supplemented with 100 ng/mL Stem Cell Factor (SCF; Proteintech, United States), 100 ng/mL Fms-like Tyrosine Kinase-3 (Flt-3; Proteintech, United States), 20 ng/mL Interleukin-3 (IL-3; Proteintech, United States), as well as 100 U/mL penicillin and 100 mg/mL streptomycin (Gibco, United States). In the subsequent phase (days 7–14), the cells were maintained in IMDM containing 2 U/mL Erythropoietin (Proteintech, United States), 50 ng/mL SCF (Proteintech, United States), 100 U/mL penicillin, and 100 mg/mL streptomycin (Gibco, United States). On the 7th day of culture, varying concentrations of TG (25 μg/mL, 50 μg/mL, 100 μg/mL, 200 μg/mL, and 400 μg/mL) were added to the culture medium, with 200 μM HU was used as a positive control (Ali et al., 2021), and no drug added as a negative control. At predetermined time points, samples were collected for phenotypic characterization, viability evaluation, and gene expression analysis.
2.4 In vivo study using townes model mice and ethical approval
Townes model mice, purchased from The Jackson Laboratory, were used to further validate the in vivo capability of TG to induce γ-globin gene expression and HbF production. The genetic background of these Townes model mice is B6; 129-Hbbtm2(HBG1,HBB*)Tow/Hbbtm3(HBG1,HBB)TowHbatm1(HBA)Tow/J (The Jackson Laboratory, United States, RRID:IMSR_JAX:013071), which harbor multiple human hemoglobin knock-in genes replacing endogenous mouse genes. All animal studies were approved by the Animal Use and Care Ethics Committee of the Laboratory Animal Center at Kunming University of Science and Technology. The mice were housed under a semi-natural light cycle (12:12 h light) in an environment maintained at 20°C–25°C and 55%–65% relative humidity (Steel et al., 2024). They were kept in cages with sawdust bedding and had ad libitum access to standard mouse chow and water.
2.5 In vivo analysis of treatment protocols
To evaluate the in vivo induction potential of TG, 6–8 week-old adult Townes model mice (18–24 g) were divided into seven groups (n = 3 per group). The groups received different doses of TG (50, 100, 200, 400, and 800 mg/kg/day). The in vivo TG dose range (50-800 mg/kg/day) was established based on previously published acute toxicity and safety data on Panax ginseng extracts and ginsenoside constituents (Carabin et al., 2000). HU at 200 mg/kg/day served as the po`sitive control, whereas 0.1% DMSO in saline was used as the negative control. Treatments were administered intraperitoneally for 2 weeks. Fifteen days post-treatment, all mice were euthanized by cervical dislocation under anesthesia (ketamine at 70 mg/kg and xylazine at 10 mg/kg) (Qiu et al., 2014). Blood samples were obtained via cardiac puncture into EDTA-coated tubes for flow cytometric analysis, and bone marrow was harvested from the hind limbs for total RNA extraction.
2.6 Cell viability and toxicity assessment
Cell viability and cytotoxicity were assessed utilizing CCK-8 assays, commonly employed to evaluate cell proliferation and cytotoxic effects by measuring color changes in the WST-8 reagent (Xia et al., 2017). In this study, the test culture was mixed with a 10% CCK-8 solution (Meilunbio, China) and incubated at 37°C for 45 min. The absorbance was measured at 450 nm utilizing an ELISA plate reader (Bio-Rad, iMark, United States). Cell viability was determined by calculating the percentage using the following formula: [(experimental well absorbance - blank well absorbance)/(control well absorbance - blank well absorbance)] × 100%. The inhibition rate was determined by: [(control well absorbance - experimental well absorbance)/(control well absorbance - blank well absorbance)] × 100%.
2.7 Hemoglobin (Hb) assessment
2.7.1 Benzidine-peroxide hemoglobin staining
The erythroid differentiation of K562 cells can be assessed by utilizing the hemoglobin-binding affinity of a benzidine-peroxide solution (Lampronti et al., 2009). In brief, cells were combined with a freshly prepared benzidine-peroxide solution containing 0.2% benzidine (Merck, Germany) in 0.5 M acetic acid (Sigma, United States) along with 10 µL of 30% H2O2 (Sigma, United States) (Salvatori et al., 2009). Subsequently, the cells were incubated in the dark for 5 min. Following the incubation, the cells were examined under an optical microscope (Nikon, Japan), and the benzidine-positive cells were quantified.
2.7.2 Total Hb determination
To quantitatively analyze cellular Hb levels, the Hemoglobin Assay Kit was employed (Sigma, United States). On the fourth day of treatment, an equal number of cells were collected and then washed twice with cold PBS. Subsequently, Hb was converted to a colorimetric product, which was measured at 400 nm. Optical density (OD) values were obtained using an ELISA plate reader (Bio-Rad, iMark, United States) with 400 nm excitation. Hb levels were calculated as [(sample well OD - blank well OD)/(standard well OD - blank well OD)] × 100 mg/dL × dilution factor.
2.8 HbF analysis by flow cytometry
On day 4 of treatment, the cells were harvested, washed twice with ice-cold PBS, fixed with 4% paraformaldehyde (PFA; Servicebio Wuhan, China), and permeabilized with 0.1% Triton X-100 (Sigma, United States) for 4 min. Subsequently, the cells were resuspended in 100 µL PBS and incubated in the dark for 20 min with 5 µL of MHFH04 PE-conjugated monoclonal anti-HbF antibody (Life Technologies, United States). Following three washes with PBS and centrifugation at 300 × g for 5 min, the stained cells were resuspended in 0.5 mL PBS and analyzed using a BD FACSCII flow cytometer (Becton Dickinson, United States) with FlowJo version 10.7.2.
2.9 Immunocytochemistry staining
On day 4 of treatment, cells were collected, washed twice in ice-cold PBS, fixed with 4% PFA, and permeabilized using 0.1% Triton X-100 for 4 min. The cells were then resuspended in 100 µL PBS and incubated in the dark for 20 min with 5 µL of MHFH04 PE-conjugated monoclonal anti-HbF antibody (Life Technologies, United States) (Fathi et al., 2022). After three PBS washes and centrifugation at 300 × g for 5 min, the cells were resuspended in 300 µL PBS and imaged using a confocal laser scanning microscope (Zeiss, Germany). The resulting images were processed with ZEN software (Zeiss, Germany), and the average fluorescence intensity per cell was quantified using ImageJ software.
2.10 RNA isolation and quantitative real-time PCR (qRT-PCR) analysis
Total RNA was isolated from cells on day 4 using the RNAprep FastPure Animal Tissue/Cell Total RNA Isolation Kit (Tsingke, China). The RNA concentration was measured with a Nanodrop 8000 (Thermo Scientific, United States), and its integrity was confirmed via agarose gel electrophoresis. Next, 1 μg of total RNA was reverse transcribed into first-strand cDNA using the HiScript III RT SuperMix for qPCR (+gDNA wiper) kit (Tsingke, China). The β-actin primers were 5′-CCTGAACCCCAAGGCCAACC-3′ and 5′-CAGGGATAGCACAGCCTGGA-3'. The human γ-globin gene primers were 5′-GGGGCAAGGTGAATGTGGAAGA-3′ and 5′-CATGATGGCAGAGGCAGAGGAC-3'.
To prepare a 20 μL reaction system, the 2×TSINGKE® Master qPCR Mix (SYBR) (Tsingke, China) was utilized. The system included 10 μL of 2× ChamQ Universal SYBR qPCR Master Mix, 0.4 nM of each gene-specific forward and reverse primer, and 100 ng of cDNA template. PCR amplification was carried out using an ABI 7300 qPCR instrument (Thermo Fisher, United States). The qPCR protocol began with an initial denaturation at 95°C for 60 s, followed by 40 cycles consisting of 95°C for 10 s (denaturation) and 60°C for 30 s (annealing) with fluorescence signal collection at 60°C. The specificity of the PCR products was verified by analyzing the melting curves.
2.11 H&E staining of mouse liver tissue
Mouse liver tissues were fixed in 4% paraformaldehyde (Servicebio, China) and subsequently dehydrated through a graded ethanol series. The tissues were then cleared in xylene (Shanghai, China) and embedded in paraffin (Sigma-Aldrich, United States). Once the paraffin blocks had solidified, they were trimmed and sectioned into 5 μm thick slices. The sections were deparaffinized in xylene, rehydrated through a graded ethanol series, and stained with hematoxylin and eosin (Servicebio, China). Finally, the slides were mounted with neutral resin (Servicebio, China). Tissue morphology was examined under a microscope, and images were captured using a slide scanner.
2.12 Statistical analysis
Statistical analyses were performed using GraphPad Prism 6 (GraphPad Software, United States). Data are presented as mean ± standard deviation (SD). Group differences were evaluated by one-way ANOVA followed by the Student–Newman–Keuls test. Statistical significance was denoted as follows: *P < 0.05, **P < 0.01, and ***P < 0.001.
3 Results
3.1 Analysis of the major components of TG
HPLC analysis of TG confirmed the presence of key ginsenosides. Chromatographic peaks corresponded to known standards, specifically ginsenosides Rg1, Re, Rf, Rg2, Rb1, Rc, Rb2, and Rd, as shown in Figure 1A. The relative abundances of these ginsenosides in TG were quantified, with concentrations presented in Figure 1B and tabulated in Table 1. The respective ginsenoside contents were as follows: Rg1 constituted 3.567%, Re 10.307%, Rf 1.840%, Rg2 1.690%, Rb1 23.925%, Rc 12.377%, Rb2 11.391%, and Rd 10.450%. Additionally, smaller amounts of other ginsenosides and phytochemical components were identified in TG.
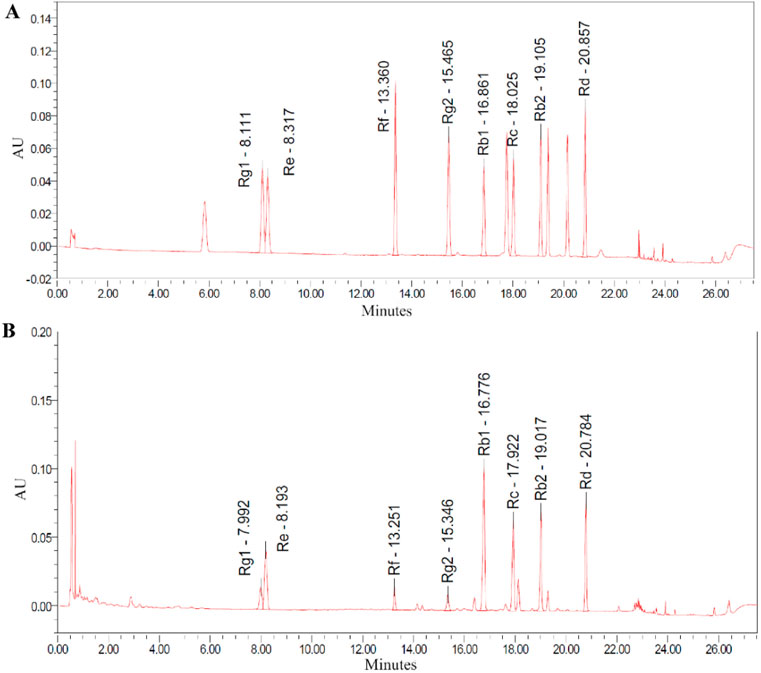
Figure 1. HPLC chromatograms recorded at 203 nm. (A) Standard ginsenosides. (B) TG.
Table 1. Analysis of ginsenoside content in TG.
3.2 Accumulation of total hemoglobin mediated by TG in K562 cells
Following a 4-day TG treatment on K562 cells, hemoglobin (Hb) levels were quantitatively assessed. As shown in Figure 2A, TG significantly enhanced Hb synthesis: cells exposed to 50, 100, and 200 μg/mL TG exhibited substantial increases in Hb levels to 14.71 ± 0.22, 14.86 ± 0.66, and 16.44 ± 0.92 mg/dL, respectively, all p < 0.0001, compared to the control’s 6.55 ± 0.35 mg/dL. The Hb concentration in cells treated with the optimal erythroid induction dose of 200 µM HU was 10.07 ± 0.50 mg/dL (p < 0.0001). Hb fold changes under various treatments are depicted in Figure 2B, demonstrating a dose-dependent rise in TG-induced Hb levels.
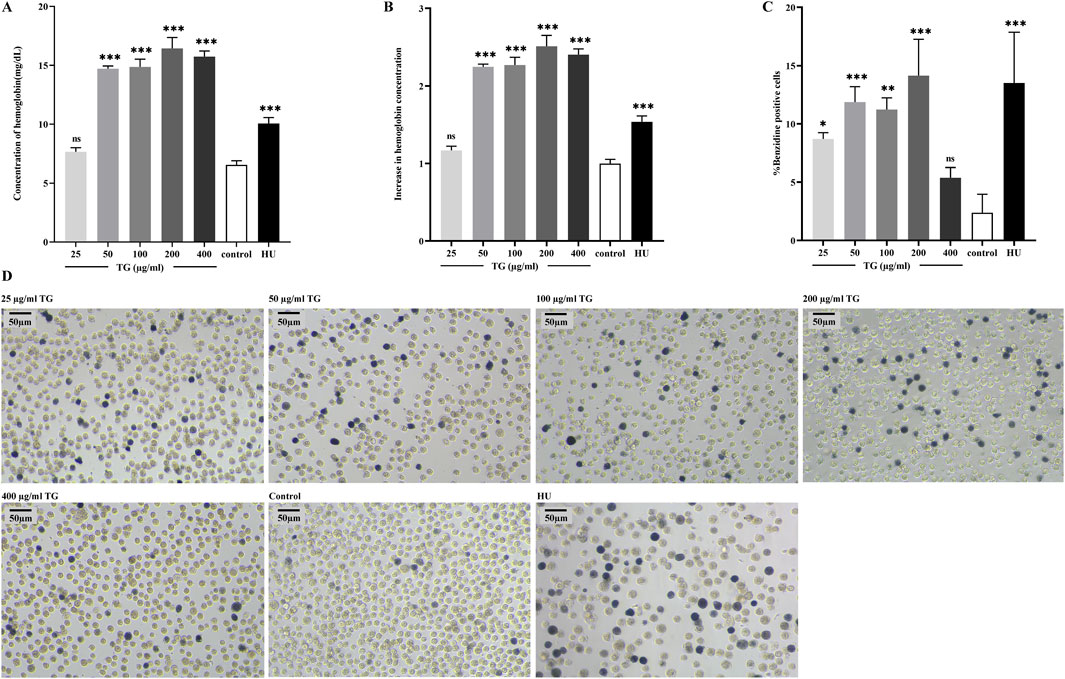
Figure 2. TG-induced total hemoglobin synthesis in K562 cells. (A) Total hemoglobin content was quantified in K562 cells following TG treatment. (B) A fold increase in total hemoglobin levels was observed in TG-treated cells compared to the untreated control. (C) Proportion of benzidine-positive cells. (D) Representative photomicrographs (×20 objective) illustrate hemoglobinization in K562 cells. Cells were treated with various concentrations of TG, 200 μM HU, or left untreated; benzidine staining was used to highlight hemoglobin-positive cells.
Benzidine-H2O2 staining—a technique utilizing the peroxidase activity intrinsic to the heme component of Hb—further substantiated red cell differentiation by identifying hemoglobinized cells (Mischiati et al., 2004). This staining showed a substantial increase in benzidine-positive cells upon treatment with 50, 100, and 200 μg/mL TG, detailed in Figures 2C,D. Specifically, the proportions of benzidine-positive cells surged to 11.88% ± 1.31%, 11.25% ± 1.00%, and 14.14% ± 3.12%, respectively, each significantly higher than the control’s 2.38% ± 1.59%. In the group treated with 200 μM HU, benzidine-positive cells comprised 13.51% ± 4.36% of the total population.
Additionally, as shown in Figure 2D, K562 cells exposed to 200 µM HU exhibited a significant increase in cell size (Iftikhar et al., 2019), a phenomenon not observed in TG-treated cells, where no significant morphological or size alterations were noted. Collectively, these findings underscore that TG can selectively boost Hb levels in K562 cells without adversely affecting cell morphology. Results are presented as mean ± SD for a sample size of three.
3.3 TG increased the production of HbF in K562 cells
Figures 3A–C illustrate a significant increase in the proportion of F cells, which are defined by their expression of HbF, following treatment of K562 cell cultures with various concentrations of TG. At doses of 50, 100, and 200 μg/mL TG, the proportions of F-cells were 44.57% ± 1.29%, 45.63% ± 0.38%, and 42.80% ± 1.57%, respectively. These values represent fold increases of 2.07 ± 0.05, 2.12 ± 0.43, and 1.99 ± 0.09 compared to the untreated control group’s baseline F-cell proportion of 21.57% ± 0.55%. Under the influence of 200 μM HU, the F-cell percentage increased to 39.93% ± 1.72%, reflecting a 1.85 ± 0.04-fold enhancement.
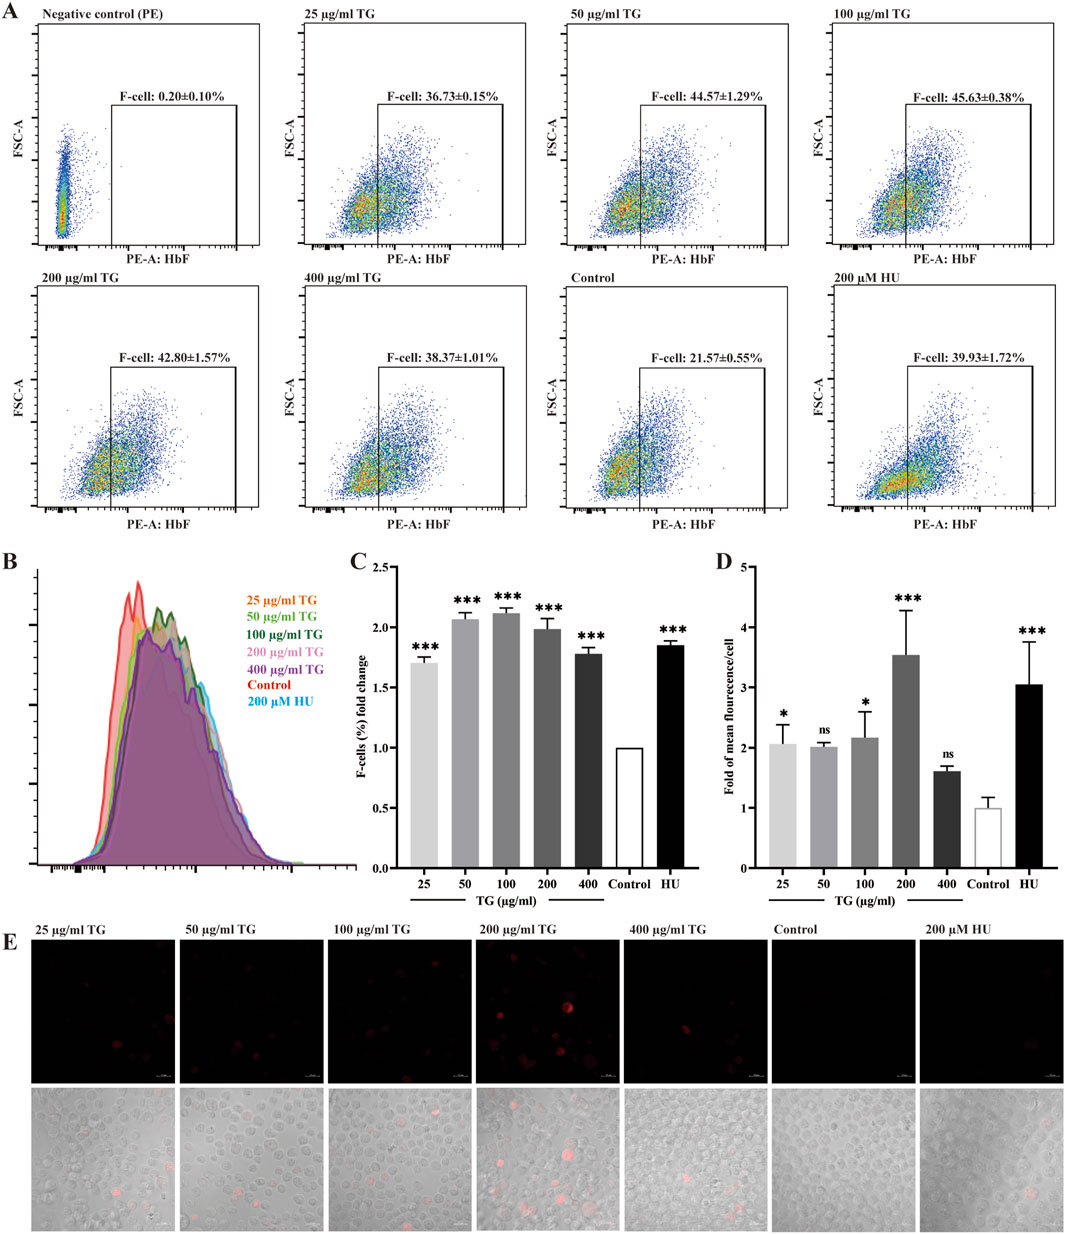
Figure 3. Assessment of HbF expression in K562 cells treated with TG. (A) Flow cytometry analysis shows the F-cell population after TG treatment. (B) An overlay histogram illustrates the distribution of cells positively stained with the anti-HbF antibody. (C) The proportional changes in F cells relative to the negative control group. (D) Histograms display the MFI of HbF-PE for each treatment group. (E) Immunofluorescent images (×40 magnification) demonstrate HbF labeling in TG-treated cells.
Using human anti-HbF monoclonal antibodies for immunocytochemical staining, Figures 3C,D demonstrate a marked upregulation of HbF expression in K562 cells treated with 100 and 200 μg/mL TG, as indicated by the presence of red fluorescence. The fluorescence intensity per cell, measured in arbitrary units (AU), was quantitatively analyzed. TG treatment at 100 and 200 μg/mL significantly increased the mean fluorescence intensity (MFI) intensity of HbF to 20.37 ± 2.92 AU and 19.70 ± 4.17 AU, respectively, compared to 4.07 ± 2.49 AU in the untreated control group. Notably, the positive control group treated with 200 µM HU exhibited a higher average HbF fluorescence intensity of 28.37 ± 3.33 AU.
Furthermore, Figure 3D confirms that while 200 µM HU caused a significant increase in K562 cell size, TG treatment did not materially alter cell dimensions or morphology. Overall, a TG concentration range of 50–100 μg/mL was effective in elevating HbF levels in K562 cells. These observations are rigorously documented, with data expressed as mean ± standard deviation, based on triplicate assays.
3.4 TG upregulated γ-globin gene expression in K562 cells
The transcriptional activity of the γ-globin gene in response to TG was evaluated using RT-qPCR. As shown in Figure 4, K562 cells treated with TG at concentrations of 50–200 μg/mL exhibited a significant induction of HBG transcription. Specifically, HBG expression increased by 3.87 ± 0.50-fold at 50 μg/mL, 4.23 ± 0.30-fold at 100 μg/mL, and 4.29 ± 0.57-fold at 200 μg/mL, with all increases being statistically significant (p < 0.001 and p < 0.01) compared to untreated controls. In contrast, cells treated with 100 µM HU showed a more pronounced 6.14 ± 0.84-fold increase in HBG mRNA levels (p < 0.001).
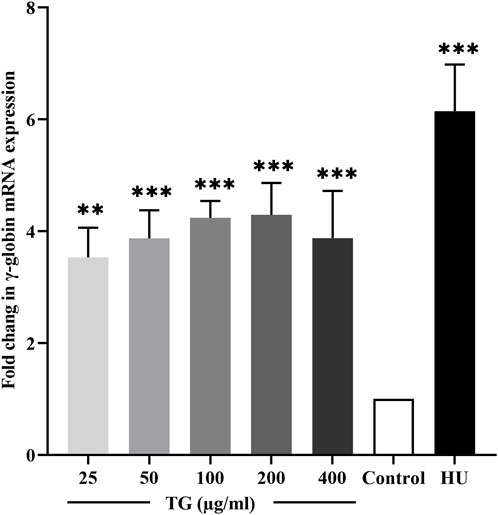
Figure 4. Quantitative RT-PCR analysis showing the fold change in γ-globin mRNA expression in TG-treated K562 cells compared to the untreated control. Data represent mean ± SD from triplicate experiments (n = 3).
3.5 The effect of TG on the growth of K562 cells
Figure 5 illustrates the impact of varying TG concentrations (25–400 μg/mL) on the proliferation dynamics of K562 cells. Panels 5A-C present the results of cell viability and growth inhibition rates as determined by the CCK-8 assay, conducted following TG administration across a range of doses for incubation periods extending from 1 to 5 days. The data reveal a clear dose- and time-dependent cytostatic effect of TG on K562 cells, with higher concentrations and prolonged exposure leading to greater inhibition of cell proliferation. Notably, compared to the response after treatment with the standard erythroid differentiation inducer, 200 μM HU, TG shows a slight reduction in K562 cell proliferation rates at various dosages. However, overall cell viability was not significantly compromised, suggesting a cytostatic rather than cytotoxic effect of TG on these cells.
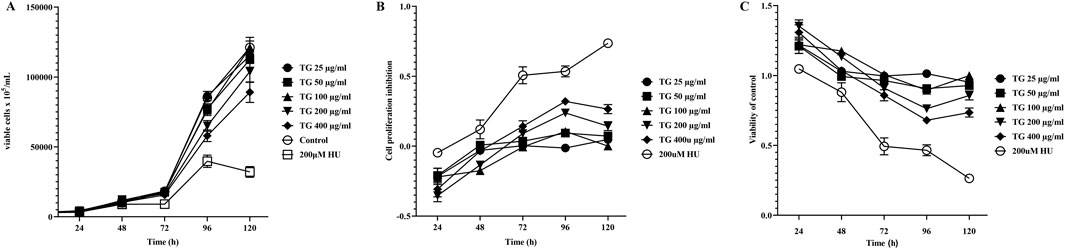
Figure 5. Influence of TG on K562 cell proliferation and viability. (A) Growth curve showing the proliferation of K562 cells over time under TG treatment. (B) Inhibition rates of K562 cell proliferation in response to TG and HU treatments compared to the negative control. (C) Cell viability of K562 cells treated with TG, assessed relative to the negative control group. Data represent mean ± SD from triplicate experiments (n = 3).
3.6 Accumulation of total hemoglobin mediated by TG in ErPCs
In this study, written informed consent was obtained from three individuals at the Department of Medical Genetics, First People’s Hospital of Yunnan Province. CD34+ progenitor cells were isolated from the umbilical cord blood of healthy newborns and cultured along the erythroid lineage to differentiate into ErPCs. During differentiation, the cells were treated with TG at concentrations ranging from 25 to 400 μg/mL. After the culture period, the cells were harvested for quantitative assessment of Hb levels.
The quantitative analysis of Hb levels, illustrated in Figures 6A,B, indicates that treatment with TG increases Hb content in ErPCs. The data show that ErPCs subjected to 50, 100, and 200 μg/mL of TG exhibited significant elevations in Hb concentrations, measuring 9.78 ± 0.73, 10.75 ± 1.85, and 10.75 ± 1.85 mg/dL, respectively. These values contrast sharply with the control group’s 6.25 ± 0.41 mg/dL, with all TG treatment groups reaching statistical significance (p < 0.0001). Additionally, Hb levels in cells treated with 200 µM HU were higher at 11.09 ± 0.98 mg/dL (p < 0.0001). Figure 6B presents the fold increase in Hb across different treatment conditions, clearly demonstrating a TG dose-dependent enhancement in Hb levels.
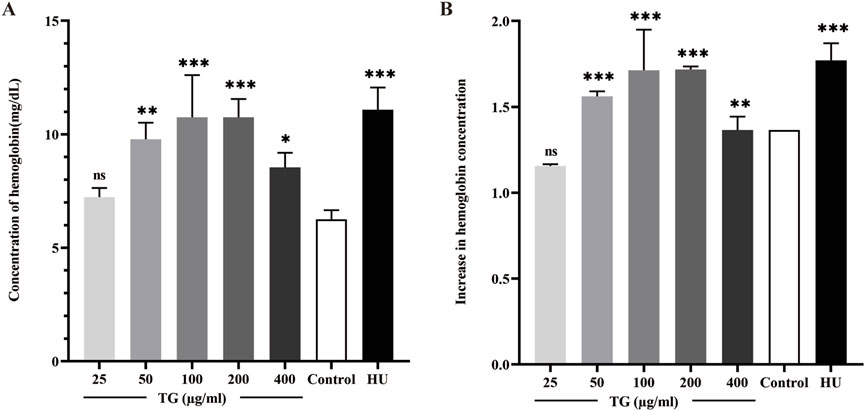
Figure 6. Analysis of Hb expression in ErPCs treated with TG. (A) Hemoglobin concentration in ErPCs after TG treatment, expressed in mg/dL. (B) Fold change in hemoglobin levels relative to the negative control. Data represent mean ± SD from three independent experiments (n = 3).
3.7 TG upregulates HbF expression in ErPCs
ErPCs were exposed to TG at concentrations ranging from 25 to 400 μg/mL to evaluate its impact on intracellular HbF expression. After culture, flow cytometry and immunofluorescence analyses were performed to quantify HbF levels, as shown in Figures 7A–C. Treatment with TG significantly increased the proportion of HbF-positive ErPCs compared to the negative control. Specifically, ErPCs treated with 50–200 μg/mL TG showed the most significant increases in HbF percentage, reaching 45.90% ± 11.70%, 53.80% ± 14.77%, and 44.33% ± 7.90%, corresponding to 1.26 ± 0.05-fold, 1.47 ± 0.03-fold, and 1.24 ± 0.14-fold increases, respectively. In parallel, ErPCs treated with 200 μM HU exhibited a 1.65 ± 0.47-fold enhancement in HbF expression, with a percentage of 58.13% ± 11.65%.
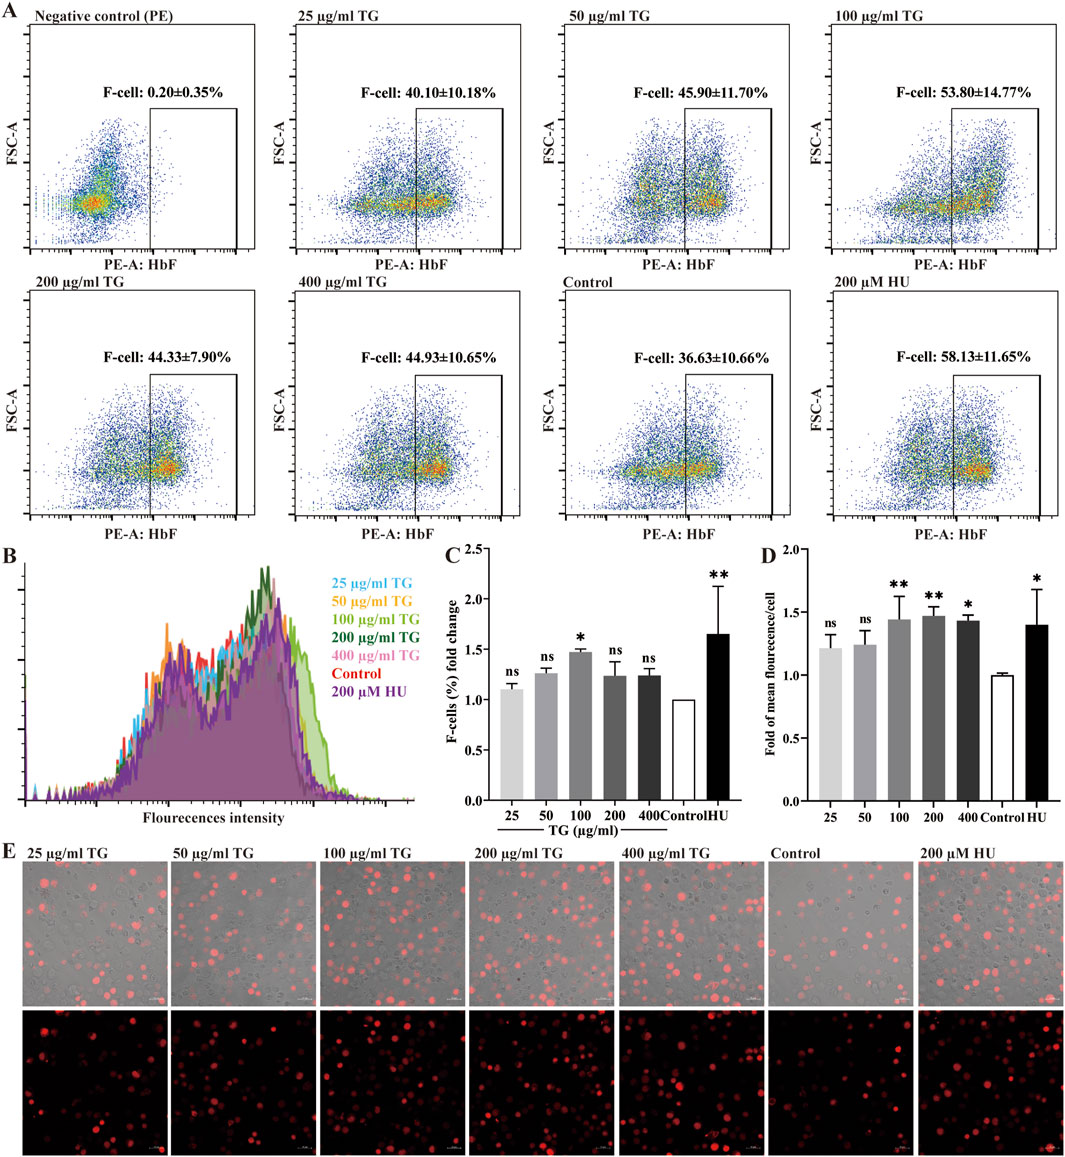
Figure 7. Assessment of HbF expression in ErPCs treated with TG. (A) Flow cytometry analysis illustrating the F-cell population following TG treatment. (B) Overlay histogram displaying the distribution of cells positively stained with the anti-HbF antibody. (C) Proportional changes in the F-cell population relative to the negative control group. (D) Histograms presenting the MFI of HbF-PE across different treatment groups. (E) Immunofluorescent images (×40 magnification) highlighting HbF labeling in TG-treated cells.
Immunofluorescence analysis (Figures 7D,E) further supports these findings, revealing enhanced HbF expression in ErPCs treated with TG. The MFI for the 100 and 200 μg/mL TG groups were notably increased, registering at 17.64 ± 2.24 and 17.98 ± 0.89, respectively, compared to an MFI of 12.24 ± 0.19 in the negative control. In contrast, the 200 μM HU treatment group displayed an MFI of 17.12 ± 3.44. In summary, the experimental data strongly indicate that TG treatments across the tested concentrations significantly increases both the proportion of HbF-positive cells and the overall fluorescence intensity in ErPCs, with the 100–200 μg/mL dosage range exhibiting the greatest efficacy.
3.8 TG upregulated γ-globin gene expression in normal human ErPCs
The effect of TG on γ-globin gene transcription in ErPCs was quantitatively evaluated using RT-qPCR. As shown in Figure 8, treatment with 100 and 200 μg/mL TG resulted in significant increases in γ-globin mRNA expression, with fold changes of 1.69 ± 0.29 (p < 0.05) and 1.46 ± 0.27 (p < 0.01), respectively, relative to the negative control. Moreover, cells treated with 200 μM HU exhibited a 1.55 ± 0.10 (p < 0.01)-fold increase in γ-globin expression.
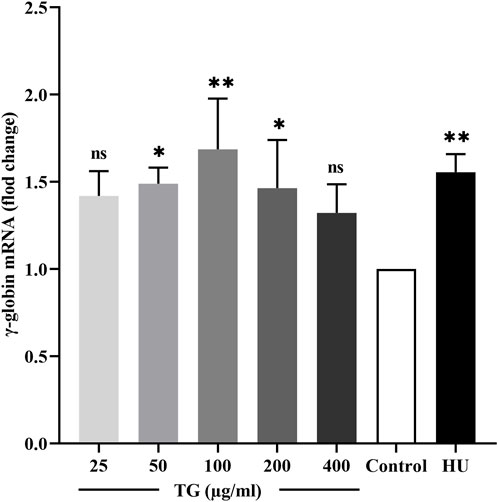
Figure 8. Impact of TG on γ-globin gene expression in ErPCs. Data are presented as mean ± SD (n = 3). Relative expression levels of γ-globin mRNA were normalized against β-actin RNA, are shown.
These results underscore the significant role of TG in elevating HbF levels in ErPCs. The observed enhancement in HbF aligns with the upregulation of γ-globin mRNA, suggesting a potential mechanism wherein TG may potentiate HbF synthesis. This mechanism likely involves the coordinated upregulation of fetal globin gene transcription, proposing a promising therapeutic avenue for conditions ameliorated by increased HbF production.
3.9 TG induces in vivo HbF expression
To further investigate the regulatory effect of TG on HbF expression in vivo, Townes model mice were used as the animal model. The mice received intraperitoneal injections of TG for 14 consecutive days. At the end of the treatment period, blood samples were collected via cardiac puncture and analyzed by flow cytometry to determine the proportion of HbF-positive cells.
As shown in Figure 9, TG effectively promoted HbF production in vivo. Specifically, at doses of 200 and 400 mg/kg, the proportions of F cells reached 31.75% ± 0.92% and 34.90% ± 1.70%, respectively, compared to 11.33% ± 4.91% in the negative control group. These represent 2.80 ± 0.08- and 3.08 ± 0.15-fold increases over the control. In contrast, the positive control group treated with 200 mg/kg HU exhibited an F-cell proportion of 21.60% ± 7.64%, corresponding to a 1.91 ± 0.67-fold increase relative to the negative control group.
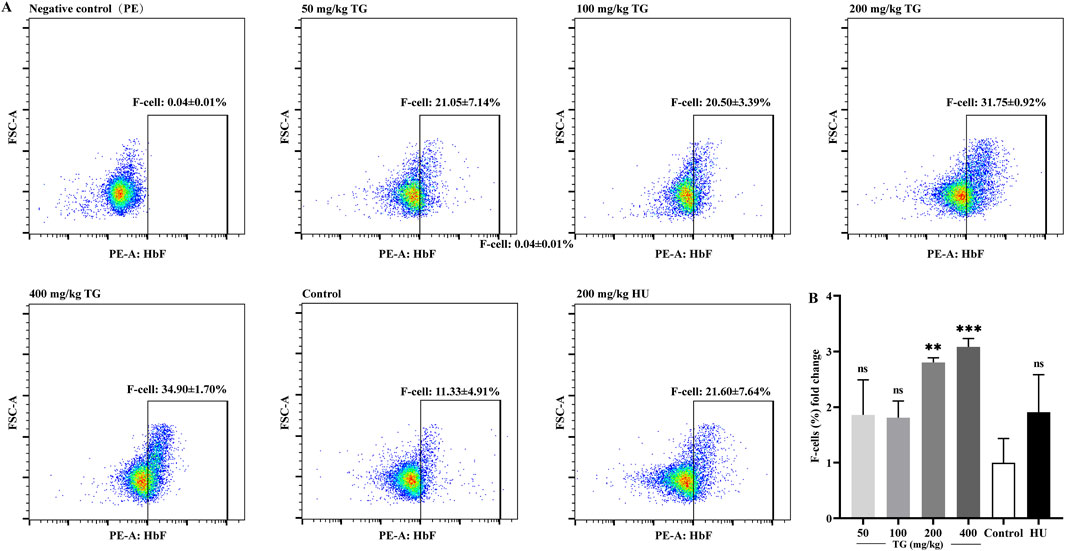
Figure 9. FACS analysis of the impact of TG on HbF expression in mice. (A) Proportion of F-cells in each treatment group. (B) Fold change in the proportion of F cells relative to the negative control group.
3.10 TG upregulated γ-globin gene expression in vivo
As shown in Figure 10, RT-qPCR results demonstrate that TG significantly enhances γ-globin gene expression in mice. Specifically, treatment with TG at doses of 200 mg/kg and 400 mg/kg increased γ-globin mRNA levels by 2.57 ± 0.63-fold and 2.86 ± 0.55-fold, respectively, compared to the negative control. In contrast, the HU treatment group exhibited a 2.01 ± 0.53-fold increase in γ-globin mRNA expression relative to the negative control.
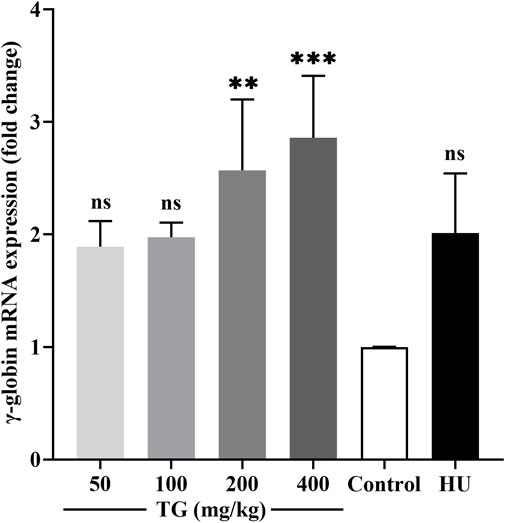
Figure 10. Impact of TG on γ-globin gene expression in vivo. Relative expression levels of γ-globin mRNA in mouse bone marrow, normalized to β-actin mRNA, as determined by RT-qPCR. Data are presented as mean ± SD (n = 3).
3.11 Histopathological analysis of mouse liver to assess TG toxicity
To investigate the potential hepatotoxicity of TG, we conducted histopathological examinations on liver sections from Townes model mice following 14 days of intraperitoneal injections with varying doses of TG, saline (control), and HU as a positive control. As shown in Figure 11, in the control group, many hepatocytes exhibited edema and cytoplasmic swelling, with loose, pale staining cytoplasm, compressed sinusoidal spaces, and unclear hepatic cord structures. No significant inflammatory cell infiltration was observed. Similar changes were noted in TG-treated groups, with hepatocyte edema, swelling, and mild congestion observed at doses of 50, 100, 200, and 400 mg/kg TG. The 200 mg/kg dose showed widespread ballooning of hepatocytes with sparse or finely reticulated cytoplasm. In the HU-treated group, hepatocyte edema and swelling were also observed, but no significant inflammatory infiltration was noted in any group.
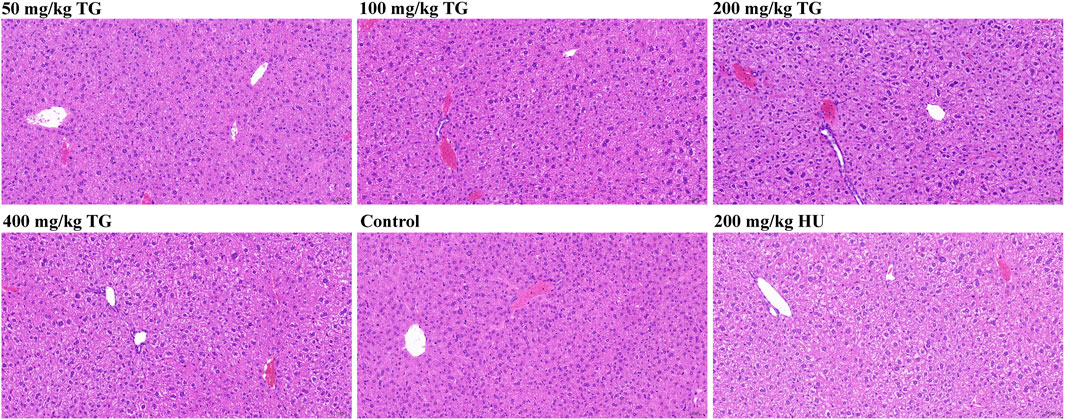
Figure 11. Histopathological analysis of mouse liver following TG treatment.
Histopathological changes were mild and consistent across TG-treated, control, and HU-treated groups. Hepatocyte edema and swelling were present, but no severe damage or significant inflammation was detected, indicating that TG has a relatively low hepatotoxicity profile at the studied doses. This suggests that TG could be a safer alternative to HU for inducing HbF expression.
4 Discussion
This study demonstrates that TG significantly induce γ-globin expression and HbF production in both in vitro and in vivo models. In K562 cells and cord blood-derived erythroid progenitors, TG treatment elevated γ-globin mRNA levels and HbF-positive cells without adversely affecting erythroid differentiation. Importantly, in vivo administration of TG in Townes mice—a model expressing human globin genes including γ-globin—resulted in a marked increase in circulating F-cells. After 14 days of treatment, TG at 200–400 mg/kg nearly tripled F-cell percentages compared to controls, supporting its therapeutic potential as an HbF inducer.
Although the exact molecular mechanism of TG-induced γ-globin expression remains to be elucidated, existing studies provide some plausible insights. For instance, natural products with antioxidant properties (Feng et al., 2022; Mayuranathan et al., 2023)—including components of ginseng—have been associated with activation of NRF2, a transcription factor implicated in globin gene regulation through chromatin remodeling and oxidative stress responses (Zhu et al., 2017). Additionally, HbF induction by other agents has been linked to the downregulation of repressors such as BCL11A and ZBTB7A (Martyn et al., 2024). Whether TG affects these pathways directly remains unknown, but its bioactivity profile suggests possible modulation of erythroid-specific transcriptional networks. Further mechanistic studies will be essential to define the molecular underpinnings of its HbF-inducing effect.
Compared with HU, the only FDA-approved HbF inducer (Steinberg et al., 2014), TG showed comparable or even superior effects on γ-globin expression without observable cytotoxicity or adverse organ effects within the study duration. HU exerts its action partly through cytostatic effects and nitric oxide-mediated signaling, but also carries risks of bone marrow suppression, gastrointestinal symptoms, and potential long-term toxicity (Antonioli et al., 2012). In contrast, TG did not produce morphological abnormalities in bone marrow-derived cells, and liver histology revealed no significant damage. While these preliminary findings suggest a favorable safety profile, comprehensive toxicological assessment is required to confirm systemic tolerability.
Despite these encouraging results, several limitations must be acknowledged. First, our toxicity evaluation focused only on the liver. Other organs commonly affected in systemic toxicity—such as the kidney and spleen—were not assessed. Second, the mechanism underlying TG-induced HbF expression was not experimentally investigated; transcriptional repressors, epigenetic marks, or relevant signaling pathways were not measured. Third, while cord blood-derived progenitors were used, validation in erythroid cells from β-thalassemia patients remains essential to confirm clinical relevance. Lastly, although Townes mice carry human γ-globin genes, they do not recapitulate the ineffective erythropoiesis or anemia characteristic of β-thalassemia. Transgenic models with β-thalassemia mutations should be employed in future studies to more accurately evaluate therapeutic efficacy.
Future investigations should prioritize mechanistic studies to determine how TG modulates γ-globin expression. Particular attention should be given to its potential effects on epigenetic regulators or transcriptional repressors known to control the fetal-to-adult globin switch. Comprehensive toxicological assessments—including histological evaluation of the kidney, spleen, and bone marrow—are necessary to establish TG’s systemic safety profile. Additionally, validation using erythroid cells derived from β-thalassemia patients will help confirm translational relevance. Testing TG in genetically engineered mouse models of β-thalassemia will be critical to assess its effects on ineffective erythropoiesis and anemia. Together, these efforts will provide essential preclinical data to support future clinical development of TG as a novel therapy for β-hemoglobinopathies.
5 Conclusion
Our study demonstrates that TG is a promising inducer of HbF expression, with significant potential for treating β-thalassemia. Using both in vitro and in vivo models, we showed that TG effectively enhances Hb, HbF, and γ-globin gene expression. In K562 cells and ErPCs, TG treatment significantly upregulated these genes without affecting cell proliferation or morphology, positioning TG as a favorable alternative to HU. In vivo validation using Townes model mice further confirmed TG’s efficacy. Intraperitoneal administration of TG significantly increased the proportion of HbF-positive cells, supporting its potential clinical applicability.
In conclusion, TG is a potent inducer of HbF and represents a promising new therapeutic strategy for β-thalassemia. Our findings lay a strong foundation for future studies aimed at developing TG into a safer and more effective treatment option for patients with β-thalassemia.
Data availability statement
The original contributions presented in the study are included in the article/supplementary material, further inquiries can be directed to the corresponding author.
Ethics statement
The studies involving humans were approved by First People’s Hospital of Yunnan Province’s Ethics Committee. The studies were conducted in accordance with the local legislation and institutional requirements. The human samples used in this study were acquired from primarily isolated as part of your previous study for which ethical approval was obtained. Written informed consent for participation was not required from the participants or the participants’ legal guardians/next of kin in accordance with the national legislation and institutional requirements. The animal study was approved by Animal Use and Care Ethics Committee of the Laboratory Animal Center at Kunming University of Science and Technology. The study was conducted in accordance with the local legislation and institutional requirements.
Author contributions
DC: Conceptualization, Formal Analysis, Investigation, Methodology, Writing – original draft. YC: Formal Analysis, Investigation, Methodology, Writing – original draft. GH: Formal Analysis, Investigation, Methodology, Writing – original draft. YK: Formal Analysis, Investigation, Methodology, Writing – original draft. AC: Data curation, Validation, Writing – review and editing. YG: Data curation, Validation, Writing – review and editing. BZ: Funding acquisition, Project administration, Resources, Supervision, Writing – review and editing.
Funding
The author(s) declare that financial support was received for the research and/or publication of this article. This work was supported by National Natural Science Foundation of China (81760037), Yunling Scholar Project of Yunnan Province (YNWR-YLXZ-2019-0005), NHC Key Laboratory of Healthy Birth and Birth Defect Prevention in Western China, Yunnan Provincial Key Laboratory For Birth Defects and Inherited Diseases, and the Yunnan Province Science and Technology Department, Science and Technology Program, under project number 202101AS070005.
Acknowledgments
The authors express their sincere appreciation to these funding agencies for their generous financial support, which made this study possible. We would like to thank the Core Technology Facility of Kunming Institute of Zoology (KIZ), Chinese Academy of Sciences (CAS) for providing us with flow cytometry analysis. We are grateful to Shuangjuan Yang for her technical support.
Conflict of interest
The authors declare that the research was conducted in the absence of any commercial or financial relationships that could be construed as a potential conflict of interest.
Generative AI statement
The author(s) declare that no Generative AI was used in the creation of this manuscript.
Publisher’s note
All claims expressed in this article are solely those of the authors and do not necessarily represent those of their affiliated organizations, or those of the publisher, the editors and the reviewers. Any product that may be evaluated in this article, or claim that may be made by its manufacturer, is not guaranteed or endorsed by the publisher.
References
Algiraigri, A. H., Wright, N. a.M., Paolucci, E. O., and Kassam, A. (2017). Hydroxyurea for lifelong transfusion-dependent β-thalassemia: a meta-analysis. Pediatr. Hematol. Oncol. 34, 435–448. doi:10.1080/08880018.2017.1354948
Ali, H., Khan, F., and Musharraf, S. G. (2021). Cilostazol-mediated reversion of γ-globin silencing is associated with a high level of HbF production: a potential therapeutic candidate for β-globin disorders. Biomed. Pharmacother. 142, 112058. doi:10.1016/j.biopha.2021.112058
Alsayari, A., Muhsinah, A. B., Almaghaslah, D., Annadurai, S., and Wahab, S. (2021). Pharmacological efficacy of ginseng against respiratory tract infections. Molecules 26, 4095. doi:10.3390/molecules26134095
Antonioli, E., Guglielmelli, P., Pieri, L., Finazzi, M., Rumi, E., Martinelli, V., et al. (2012). Hydroxyurea-related toxicity in 3,411 patients with Ph’-negative MPN. Am. J. Hematol. 87, 552–544. doi:10.1002/ajh.23160
Bach, H. V., Kim, J., Myung, S. K., and Cho, Y. A. (2016). Efficacy of ginseng supplements on fatigue and physical performance: a meta-analysis. J. Korean Med. Sci. 31, 1879–1886. doi:10.3346/jkms.2016.31.12.1879
Bauer, D. E., Kamran, S. C., and Orkin, S. H. (2012). Reawakening fetal hemoglobin: prospects for new therapies for the β-globin disorders. Blood 120, 2945–2953. doi:10.1182/blood-2012-06-292078
Carabin, I. G., Burdock, G. A., and Chatzidakis, C. (2000). Safety Assessment of Panax Ginseng. Int. J. Toxicol. 19, 203–301. doi:10.1080/10915810050202105
Chen, J., Huang, Q., Li, J., Yao, Y., Sun, W., Zhang, Z., et al. (2023). Panax ginseng against myocardial ischemia/reperfusion injury: a review of preclinical evidence and potential mechanisms. J. Ethnopharmacol. 300, 115715. doi:10.1016/j.jep.2022.115715
Clegg, J. B., Weatherall, D. J., and Bodmer, W. F. (1983). 5-azacytidine for beta-thalassemia? Lancet 1, 536. doi:10.1016/s0140-6736(83)92227-4
Costa, E., Cappellini, M. D., Rivella, S., Chilin, A., Alessi, E., Riccaboni, M., et al. (2022). Emergent treatments for β-thalassemia and orphan drug legislations. Drug Discov. Today 27, 103342. doi:10.1016/j.drudis.2022.103342
Das, S. S., Sinha, R., and Chakravorty, N. (2019). Integrative microRNA and gene expression analysis identifies new drug repurposing candidates for fetal hemoglobin induction in β-hemoglobinopathies. Gene 706, 77–83. doi:10.1016/j.gene.2019.04.077
Eghbali, A., Nourigheimasi, S., Ghasemi, A., Afzal, R. R., Ashayeri, N., Eghbali, A., et al. (2023). The effects of curcumin on hepatic T2*MRI and liver enzymes in patients with β-thalassemia major: a double-blind randomized controlled clinical trial. Front. Pharmacol. 14, 1284326. doi:10.3389/fphar.2023.1284326
Fan, J. W., Xu, X. T., Cheng, H., Sang, Z., and Shi, Y. H. (2023). Standardization of panax ginseng: current status of global trade, demands, and development. Am. J. Chin. Med. 51, 909–927. doi:10.1142/s0192415x23500428
Fathi, E., Azarbad, S., Farahzadi, R., Javanmardi, S., and Vietor, I. (2022). Effect of rat bone marrow derived-mesenchymal stem cells on granulocyte differentiation of mononuclear cells as preclinical agent in cellbased therapy. Curr. Gene Ther. 22, 152–161. doi:10.2174/1566523221666210519111933
Fathi, E., Farahzadi, R., Valipour, B., and Sanaat, Z. (2019). Cytokines secreted from bone marrow derived mesenchymal stem cells promote apoptosis and change cell cycle distribution of K562 cell line as clinical agent in cell transplantation. PLoS One 14, e0215678. doi:10.1371/journal.pone.0215678
Feng, R., Mayuranathan, T., Huang, P., Doerfler, P. A., Li, Y., Yao, Y., et al. (2022). Activation of γ-globin expression by hypoxia-inducible factor 1α. Nature 610, 783–790. doi:10.1038/s41586-022-05312-w
Franco, S. S., De Falco, L., Ghaffari, S., Brugnara, C., Sinclair, D. A., Matte, A., et al. (2014). Resveratrol accelerates erythroid maturation by activation of FoxO3 and ameliorates anemia in beta-thalassemic mice. Haematologica 99, 267–275. doi:10.3324/haematol.2013.090076
Gambari, R., Waziri, A. D., Goonasekera, H., and Peprah, E. (2024). Pharmacogenomics of drugs used in β-thalassemia and sickle-cell disease: from basic research to clinical applications. Int. J. Mol. Sci. 25, 4263. doi:10.3390/ijms25084263
Guo, M., Shao, S., Wang, D., Zhao, D., and Wang, M. (2021). Recent progress in polysaccharides from Panax ginseng C. A. Meyer. Food Funct. 12, 494–518. doi:10.1039/d0fo01896a
Iftikhar, F., Ali, H., and Musharraf, S. G. (2019). Cinchona alkaloids as natural fetal hemoglobin inducing agents in human erythroleukemia cells. RSC Adv. 9, 17551–17559. doi:10.1039/c9ra01744e
Iftikhar, F., Rahman, S., Khan, M. B. N., Khan, K., Khan, M. N., Uddin, R., et al. (2022). In vitro and in vivo studies for the investigation of γ-globin gene induction by adhatoda vasica: a pre-clinical study of HbF inducers for β-thalassemia. Front. Pharmacol. 13, 797853. doi:10.3389/fphar.2022.797853
Kattamis, A., Kwiatkowski, J. L., and Aydinok, Y. (2022). Thalassaemia. Lancet 399, 2310–2324. doi:10.1016/s0140-6736(22)00536-0
Keith, J., Christakopoulos, G. E., Fernandez, A. G., Yao, Y., Zhang, J., Mayberry, K., et al. (2023). Loss of miR-144/451 alleviates β-thalassemia by stimulating ULK1-mediated autophagy of free α-globin. Blood 142, 918–932. doi:10.1182/blood.2022017265
Khan, F., Ali, H., and Musharraf, S. G. (2020). Tenofovir disoproxil fumarate induces fetal hemoglobin production in K562 cells and β-YAC transgenic mice: a therapeutic approach for γ-globin induction. Exp. Cell Res. 394, 112168. doi:10.1016/j.yexcr.2020.112168
Koonyosying, P., Tantiworawit, A., Hantrakool, S., Utama-Ang, N., Cresswell, M., Fucharoen, S., et al. (2020). Consumption of a green tea extract-curcumin drink decreases blood urea nitrogen and redox iron in β-thalassemia patients. Food Funct. 11, 932–943. doi:10.1039/c9fo02424g
Lampronti, I., Bianchi, N., Zuccato, C., Dall'acqua, F., Vedaldi, D., Viola, G., et al. (2009). Increase in gamma-globin mRNA content in human erythroid cells treated with angelicin analogs. Int. J. Hematol. 90, 318–327. doi:10.1007/s12185-009-0422-2
Liu, K., Xing, H., Zhang, S., Liu, S., and Fung, M. (2010). Cucurbitacin D induces fetal hemoglobin synthesis in K562 cells and human hematopoietic progenitors through activation of p38 pathway and stabilization of the γ-globin mRNA. Blood Cells Mol. Dis. 45, 269–275. doi:10.1016/j.bcmd.2010.09.004
Liu, R., Xu, L. X., Tong, L. J., Wu, H. Y., Guo, Q., Sun, Z. M., et al. (2024). Therapeutic effects of ginsenosides on osteoporosis for novel drug applications. Eur. J. Pharmacol. 974, 176604. doi:10.1016/j.ejphar.2024.176604
Martyn, G.E., Doerfler, P.A., Yao, Y., Quinlan, K. G. R., Weiss, M. J., Crossley, M., et al. (2024). Hydroxyurea reduces the levels of the fetal globin gene repressors ZBTB7A/LRF and BCL11A in erythroid cells in vitro. J. Sick. Cell. Dis. 1, yoae008. doi:10.1093/jscdis/yoae008
Mayuranathan, T., Newby, G. A., Feng, R., Yao, Y., Mayberry, K. D., Lazzarotto, C. R., et al. (2023). Potent and uniform fetal hemoglobin induction via base editing. Nat. Genet. 55, 1210–1220. doi:10.1038/s41588-023-01434-7
Mettananda, S., Fisher, C. A., Hay, D., Badat, M., Quek, L., Clark, K., et al. (2017). Editing an α-globin enhancer in primary human hematopoietic stem cells as a treatment for β-thalassemia. Nat. Commun. 8, 424. doi:10.1038/s41467-017-00479-7
Mischiati, C., Sereni, A., Lampronti, I., Bianchi, N., Borgatti, M., Prus, E., et al. (2004). Rapamycin-mediated induction of gamma-globin mRNA accumulation in human erythroid cells. Br. J. Haematol. 126, 612–621. doi:10.1111/j.1365-2141.2004.05083.x
Mohandas, N., and Gallagher, P. G. (2008). Red cell membrane: past, present, and future. Blood 112, 3939–3948. doi:10.1182/blood-2008-07-161166
Natta, C. L., Niazi, G. A., Ford, S., and Bank, A. (1974). Balanced globin chain synthesis in hereditary persistence of fetal hemoglobin. J. Clin. Invest 54, 433–438. doi:10.1172/jci107779
Olivieri, N. F., Saunthararajah, Y., Thayalasuthan, V., Kwiatkowski, J., Ware, R. E., Kuypers, F. A., et al. (2011). A pilot study of subcutaneous decitabine in β-thalassemia intermedia. Blood 118, 2708–2711. doi:10.1182/blood-2011-03-341909
Pace, B. S., White, G. L., Dover, G. J., Boosalis, M. S., Faller, D. V., and Perrine, S. P. (2002). Short-chain fatty acid derivatives induce fetal globin expression and erythropoiesis in vivo. Blood 100, 4640–4648. doi:10.1182/blood-2002-02-0353
Pavan, A. R., Lopes, J. R., and Dos Santos, J. L. (2022). The state of the art of fetal hemoglobin-inducing agents. Expert Opin. Drug Discov. 17, 1279–1293. doi:10.1080/17460441.2022.2141708
Qiu, Y., Yang, H., and Lei, B. (2014). Effects of three commonly used anesthetics on intraocular pressure in mouse. Curr. Eye Res. 39, 365–369. doi:10.3109/02713683.2013.845224
Rachmilewitz, E. A., and Giardina, P. J. (2011). How I treat thalassemia. Blood 118, 3479–3488. doi:10.1182/blood-2010-08-300335
Rund, D., and Rachmilewitz, E. (2000). New trends in the treatment of beta-thalassemia. Crit. Rev. Oncol. Hematol. 33, 105–118. doi:10.1016/s1040-8428(99)00058-x
Sales, R. R., Nogueira, B. L., Tosatti, J. a.G., Gomes, K. B., and Luizon, M. R. (2021). Do genetic polymorphisms affect fetal hemoglobin (HbF) levels in patients with sickle cell anemia treated with hydroxyurea? A systematic review and pathway analysis. Front. Pharmacol. 12, 779497. doi:10.3389/fphar.2021.779497
Salvatori, F., Breveglieri, G., Zuccato, C., Finotti, A., Bianchi, N., Borgatti, M., et al. (2009). Production of beta-globin and adult hemoglobin following G418 treatment of erythroid precursor cells from homozygous beta(0)39 thalassemia patients. Am. J. Hematol. 84, 720–728. doi:10.1002/ajh.21539
Steel, L. C. E., Tam, S. K. E., Brown, L. A., Foster, R. G., and Peirson, S. N. (2024). Light sampling behaviour regulates circadian entrainment in mice. BMC Biol. 22, 208. doi:10.1186/s12915-024-01995-x
Steinberg, M. H. (2020). Fetal hemoglobin in sickle cell anemia. Blood 136, 2392–2400. doi:10.1182/blood.2020007645
Steinberg, M. H., Chui, D. H., Dover, G. J., Sebastiani, P., Alsultan, A., et al. (2014). Fetal hemoglobin in sickle cell anemia: a glass half full? Blood 123, 481–485. doi:10.1182/blood-2013-09-528067
Taher, A. T., Weatherall, D. J., and Cappellini, M. D. (2018). Thalassaemia. Lancet 391, 155–167. doi:10.1016/s0140-6736(17)31822-6
Thompson, A. A., Walters, M. C., Kwiatkowski, J., Rasko, J. E. J., Ribeil, J. A., Hongeng, S., et al. (2018). Gene therapy in patients with transfusion-dependent β-thalassemia. N. Engl. J. Med. 378, 1479–1493. doi:10.1056/NEJMoa1705342
Viola, G., Vedaldi, D., Dall'acqua, F., Fortunato, E., Basso, G., Bianchi, N., et al. (2008). Induction of gamma-globin mRNA, erythroid differentiation and apoptosis in UVA-irradiated human erythroid cells in the presence of furocumarin derivatives. Biochem. Pharmacol. 75, 810–825. doi:10.1016/j.bcp.2007.10.007
Wang, J., Shi, Z. Q., Zhang, M., Xin, G. Z., Pang, T., Zhou, P., et al. (2015). Camptothecin and its analogs reduce amyloid-β production and amyloid-β42-induced IL-1β production. J. Alzheimers Dis. 43, 465–477. doi:10.3233/jad-140078
Wee, J. J., Mee Park, K., and Chung, A. S. (2011). “Biological activities of ginseng and its application to human health,” in Herbal medicine: biomolecular and clinical aspects (Boca Raton (FL): CRC Press/Taylor & Francis).
Woodard, K. J., Doerfler, P. A., Mayberry, K. D., Sharma, A., Levine, R., Yen, J., et al. (2022). Limitations of mouse models for sickle cell disease conferred by their human globin transgene configurations. Dis. Model Mech. 15. doi:10.1242/dmm.049463
Wu, Y., Zeng, J., Roscoe, B. P., Liu, P., Yao, Q., Lazzarotto, C. R., et al. (2019). Highly efficient therapeutic gene editing of human hematopoietic stem cells. Nat. Med. 25, 776–783. doi:10.1038/s41591-019-0401-y
Xia, S., Zhu, P., Pi, F., Zhang, Y., Li, Y., Wang, J., et al. (2017). Development of a simple and convenient cell-based electrochemical biosensor for evaluating the individual and combined toxicity of DON, ZEN, and AFB(1). Biosens. Bioelectron. 97, 345–351. doi:10.1016/j.bios.2017.06.002
Xu, W., Choi, H. K., and Huang, L. (2017). State of Panax ginseng research: a global analysis. Molecules 22, 1518. doi:10.3390/molecules22091518
Yu, X., Li, H., Lin, D., Guo, W., Xu, Z., Wang, L., et al. (2021). Ginsenoside prolongs the lifespan of C. elegans via lipid metabolism and activating the stress response signaling pathway. Int. J. Mol. Sci. 22, 9668. doi:10.3390/ijms22189668
Zeuner, A., Pedini, F., Signore, M., Testa, U., Pelosi, E., Peschle, C., et al. (2003). Stem cell factor protects erythroid precursor cells from chemotherapeutic agents via up-regulation of BCL-2 family proteins. Blood 102, 87–93. doi:10.1182/blood-2002-08-2369
Zhu, J., Chin, K., Aerbajinai, W., Kumkhaek, C., Li, H., and Rodgers, G. P. (2014). Hydroxyurea-inducible SAR1 gene acts through the Giα/JNK/Jun pathway to regulate γ-globin expression. Blood 124, 1146–1156. doi:10.1182/blood-2013-10-534842
Zhu, X., Li, B., and Pace, B. S. (2017). NRF2 mediates γ-globin gene regulation and fetal hemoglobin induction in human erythroid progenitors. Haematologica 102, e285–e288. doi:10.3324/haematol.2016.160788
Keywords: β-thalassemia, fetal hemoglobin, reactivation, γ-globin gene, total ginsenosides
Citation: Cai D, Chan Y, He G, Kong Y, Cai A, Guo Y and Zhu B (2025) Total ginsenosides enhance γ-globin expression and fetal hemoglobin production in β-thalassemia models. Front. Pharmacol. 16:1578237. doi: 10.3389/fphar.2025.1578237
Received: 17 February 2025; Accepted: 24 July 2025;
Published: 21 August 2025.
Edited by:
Claudio Ferrante, University of Studies G. d'Annunzio Chieti and Pescara, ItalyReviewed by:
Michael P. Okoh, Sichuan University, ChinaLucia Carmela Cosenza, University of Ferrara, Italy
Fizza Iftikhar, Emory University, United States
Copyright © 2025 Cai, Chan, He, Kong, Cai, Guo and Zhu. This is an open-access article distributed under the terms of the Creative Commons Attribution License (CC BY). The use, distribution or reproduction in other forums is permitted, provided the original author(s) and the copyright owner(s) are credited and that the original publication in this journal is cited, in accordance with accepted academic practice. No use, distribution or reproduction is permitted which does not comply with these terms.
*Correspondence: Baosheng Zhu, YmFvc2hlbmd6aHVAa3VzdC5lZHUuY24=