 Cong Hu
 Yuheng Wang
 Yu Liu1
 Hong Ma
 Ling Yang
- 1Key Laboratory of Basic Pharmacology of Ministry of Education and Joint International Research Laboratory of Ethnomedicine of Ministry of Education, Zunyi Medical University, Zunyi, China
- 2Institute of Interdisciplinary Integrative Medicine Research, Shanghai University of Traditional Chinese Medicine, Shanghai, China
- 3Department of Neurology, The First Affiliated Hospital, Dalian Medical University, Dalian, China
Introduction:: Ginsenoside Rh3 (GRh3), a rare ginsenoside, demonstrates diverse pharmacological activities in vitro; however, the lack of pharmacokinetic and tissue distribution data has limited its translation to in vivo applications. This study aimed to develop and validate a novel liquid chromatography-tandem mass spectrometry (LC-MS/MS) method for quantifying GRh3 in rat biological matrices and to characterize its pharmacokinetic profile and tissue distribution following oral administration.
Methods:: A validated LC-MS/MS method was established for the quantification of GRh3 in rat plasma and tissues. Male Sprague-Dawley rats received an oral dose of GRh3 (100 mg/kg), and plasma samples were collected up to 72 h post-dose for pharmacokinetic analysis. Tissue samples (intestine, stomach, liver, brain, etc.) were collected at the time corresponding to the maximum plasma concentration for distribution analysis.
Results:: The LC-MS/MS method showed excellent precision, accuracy, and extraction recovery (≥ 85%), with minimal matrix effects. GRh3 exhibited a prolonged elimination half-life (14.7 ± 1.7 h), a low clearance rate (13.0 ± 3.8 L/h/kg), and a high volume of distribution (280.4 ± 109.3 L/kg). Tissue distribution analysis revealed the highest GRh3 concentrations in the intestine (15445.2 ng/g), followed by the stomach (2906.7 ng/g) and liver (1930.8 ng/g). Notably, GRh3 was able to cross the blood-brain barrier, with significant accumulation observed in the hippocampus (520.0 ng/g).
Discussion:: The prolonged elimination and extensive tissue distribution of GRh3, particularly its ability to penetrate the brain, indicate potential therapeutic benefits or neurotoxic risks involving the central nervous system. The mechanism underlying its blood-brain barrier permeability warrants further investigation, potentially involving transporter-mediated uptake or modulation of barrier integrity. These findings provide a foundation for optimizing GRh3 dosing regimens and guiding future preclinical studies.
1 Introduction
Ginseng (Panax ginseng C. A. Meyer) is a quintessential traditional medicinal plant. It has held pivotal roles in both the traditional Chinese medicine theory of “invigorating qi for relieving desertion” and modern medical systems, owing to its multifaceted therapeutic properties (Yun, 2001). As one of the most commercially valuable herbs globally, ginseng is also widely utilized in dietary supplements, functional foods, and alternative medicine (Baeg and So, 2013; Eom et al., 2017). Ginsenosides, characterized by their extensive pharmacological activities, are deemed the key bioactive compounds in ginseng (Hao et al., 2025). These can be classified into two major categories, prototype ginsenosides and rare ginsenosides, based on their natural abundance and the number of glycosyl substitutions (Gan et al., 2024). Among these, rare ginsenosides, which undergo structural modifications such as deglycosylation or hydroxylation, exhibit enhanced multi-target activity. These modifications contribute to their significant advantages in antitumor effects, neuroprotective effects, metabolic regulation, and organ-protective functions (Shah et al., 2023; Shan et al., 2023; Shang et al., 2025; Zare-Zardini et al., 2024).
Ginsenoside Rh3 (GRh3), as a secondary metabolite of ginsenoside Rg5, is an important member of the rare ginsenoside family (Lee et al., 2015). Recent studies have progressively revealed its multifaceted pharmacological effects. Experimental evidence demonstrates that GRh3 protects endometrial cells against oxygen-glucose deprivation-reperfusion (OGDR)-induced oxidative damage by activating the Nrf2 signaling pathway, and attenuating reactive oxygen species (ROS) generation and lipid peroxidation while preserving mitochondrial membrane potential stability (Wang et al., 2020). In metabolic regulation, GRh3 exerts systemic protective effects on hepatic function by modulating critical targets including epidermal growth factor receptor (EGFR), steroid receptor coactivator (SRC) and mitogen activated protein kinase (MAPK) 1 to ameliorate hepatic insulin resistance, while concurrently influencing forkhead box O (FOXO), peroxisome proliferator activated receptor (PPAR), and interleukin-17 (IL-17) signaling pathways (Wang et al., 2024). In the neuroprotective domain, GRh3 significantly alleviates memory dysfunction by upregulating hippocampal brain-derived neurotrophic factor (BDNF) expression and enhancing cAMP response element-binding protein (CREB) phosphorylation (Wu et al., 2023). Besides, GRh3 exhibits substantial anticancer potential through induction of pyroptosis and ferroptosis in colorectal cancer cells via the Stat3/p53/NRF2 axis (Kim et al., 2013).
Although numerous in vitro studies have confirmed the multifaceted pharmacological effects of GRh3, the absence of comprehensive data on its pharmacokinetics (PK) and tissue distribution has hindered the effective translation of these pharmacological findings into in vivo efficacy research. To date, only one study has reported the plasma PK profile of GRh3 in rats (Yang et al., 2022). However, the extraction recovery rate of the analytical method used in that study failed to meet bioanalytical regulatory standards (EMA, 2011; FDA, 2018), and the short sampling duration (with the last time-point blood concentration exceeding 10% of Cmax) in PK analysis compromised the accuracy of PK parameters (CDE, 2005). These limitations necessitate the redevelopment of a validated analytical method and subsequent reinvestigation of GRh3’s PK characteristics. Furthermore, the tissue distribution of GRh3 has not been investigated, resulting a significant gap in our understanding. Both PK and tissue distribution data are essential for advancing GRh3 development in pharmacodynamic exposure correlation analysis, toxicity risk assessment, and optimization of dosing strategies.
To address these challenges, this study successfully developed and validated a liquid chromatography-tandem mass spectrometry (LC-MS/MS) method for detecting GRh3 concentration in rat plasma and tissues. Using this method, a comprehensive investigation was conducted on the PK and tissue distribution of GRh3 following oral administration in rats. This work provides a critical foundation for the in vivo research and pharmaceutical development of GRh3.
2 Materials and methods
2.1 Chemicals and reagents
GRh3 and GRh4 (internal standard, IS) were obtained from Alfa Biotechnology Co., Ltd. (Chengdu, China). Both compounds had a purity greater than 98% and were of analytical grade. Acetonitrile and formic acid (HPLC grade) were obtained from Merck (Darmstadt, Germany). Ultrapure water was generated using a Millipore water purification system (Billerica, United States). Isoflurane was obtained from RWD Life Science Co., Ltd. (Shenzhen, China).
2.2 Animals
Male Sprague-Dawley rats (SPF grade, 200 ± 20 g) were procured from Charles River Laboratories (Zhejiang, China). The rats were acclimatized for 1 week under a 12 h light-dark cycle and were fasted for 12 h prior to GRh3 administration while being allowed free access to water. The study was approved by the Animal Experimentation Committee of Zunyi Medical University (Approval No. ZMU21-2403-453).
2.3 Pharmacokinetics experiment
Seven male Sprague-Dawley rats were orally administered GRh3 (100 mg/kg) suspended in 0.5% carboxymethyl cellulose sodium (CMC-Na). Blood samples were collected from the orbital sinus at the following time points: 0, 0.083, 0.249, 0.498, 0.747, 1, 2, 4, 6, 8, 12, 24, 36, 48, 60, and 72 h post-dose into polypropylene tubes containing K2EDTA. The samples were subsequently centrifuged at 3000 × g for 20 min at 4°C, and the supernatant (plasma) was collected for PK analysis.
2.4 Tissue distribution experiment
Seven male Sprague-Dawley rats were orally administered GRh3 (100 mg/kg) suspended in 0.5% CMC-Na. At Tmax (the time corresponding to maximum plasma GRh3 concentration), the rats were euthanized and perfused with physiological saline via cardiac perfusion to minimize blood contamination in tissue samples. Subsequently, various tissues, including the liver, intestine, stomach, kidney, lung, heart, spleen, hippocampus, cerebral cortex, and brainstem were excised. Among these, the brain tissue sampling protocol followed previously published methods (Aboghazleh et al., 2024): target regions, including the cortex, hippocampus, and brainstem, were precisely dissected according to standard anatomical landmarks on a low-temperature dissection platform. To avoid cross-contamination between different brain regions, independent surgical instruments were used for each region, and all tools were disinfected and cleaned before and after sampling. The excised tissues were weighed and homogenized in PBS (0.1 M, pH 7.4) at 4°C using an automated tissue homogenizer (Shanghai Jingxin Industrial Development Co., Ltd., Shanghai, China). Tissue homogenates were prepared at a final concentration of 0.2 g/mL.
2.5 Preparation of calibration and quality control samples
Stock solutions of GRh3 and IS were prepared at 2.0 mg/mL in acetonitrile. The GRh3 stock solution was serially diluted with acetonitrile to produce standard calibration and quality control (QC) working solutions. 200 ng/mL IS working solution was obtained by diluting the IS stock solution with acetonitrile. 190 μL of blank rat plasma or blank liver homogenate was spiked with 10.0 μL GRh3 working solution to acquire 25 ng/mL (LLOQ), 50 ng/mL, 125 ng/mL, 250 ng/mL, 500 ng/mL, 2,000 ng/mL, 4,000 ng/mL, and 5000 ng/mL (ULOQ) for standard calibration samples, and 25 ng/mL (LLOQ QC), 100 ng/mL (LQC), 400 ng/mL (MQC), and 3000 ng/mL (HQC) for the QC samples.
2.6 Sample processing
40 μL of calibration samples, QC samples, or test samples were mixed with 160 μL of the IS working solution (200 ng/mL) and vortexed. The mixture was then centrifuged at 12,000 × g for 10 min at 4°C. Subsequently, 100 μL of the supernatant was collected and mixed with an equal volume of purified water. A 10 μL aliquot of this mixture was then injected into the LC-MS/MS system for analysis.
2.7 LC-MS/MS analysis
Sample analysis was conducted using an LC-MS/MS system, which consisted of a Shimadzu LC 20A liquid chromatograph (Kyoto, Japan) coupled with an Applied Biosystems Sciex Qtrap 4500 mass spectrometer (Massachusetts, United States). Chromatographic separation was performed on a Shimadzu Shim-pack GIST-HP C18 column (2.1 mm × 50 mm, 3 μm). The mobile phase consisted of (A) 0.1% formic acid in water and (B) acetonitrile. The gradient elution program was as follows: 0.0–1.0 min, 30%–98% B; 1.0–3.5 min, 98% B; 3.5–3.6 min, 98%–30% B; 3.6–5.0 min, 30% B, with a flow rate of 0.4 mL/min.
Mass spectrometric analysis was conducted in negative ion mode using multiple reaction monitoring (MRM). The ion source temperature was set to 550°C, with an ion spray voltage of −4500 V. Nebulizer gas (GAS1) and auxiliary heating gas (GAS2) were both set to 60 psi, while the curtain gas was set to 20 psi, all using nitrogen. Quantification was performed using the following ion transitions: m/z 649.6 > 603.1 for GRh3, with a declustering potential (DP) of −50.0 V and collision energy (CE) of −26.0 eV. For the IS, the ion transition was 665.4 > 619.4, with DP at −50.0 V and CE at −30.0 eV.
2.8 Method validation
The LC-MS/MS method for quantifying GRh3 in rat plasma and tissues was validated according to the guidelines for Bioanalytical Method Validation issued by the FDA and the European Medicines Agency (EMEA) (EMA, 2011; FDA, 2018). Considering the liver’s prominent metabolic activity and pronounced matrix effects, it was selected as the representative tissue for methodological validation in this study. The validation parameters encompassed selectivity, carryover, linearity, precision, accuracy, matrix effects, extraction recovery, and sample stability.
2.8.1 Selectivity
Selectivity was assessed based on matrix selectivity (endogenous interference), interference of the GRh3 with the IS, and interference of the IS with GRh3.
2.8.1.1 Matrix selectivity
This was evaluated using double blank samples (without GRh3 and IS) and LLOQ samples prepared from blank matrices of six individual rats. The peak areas for GRh3 and IS at their respective retention times in the double blank samples should not exceed 20.0% and 5.0%, respectively, of the corresponding peak areas in the LLOQ samples.
2.8.1.2 Interference of GRh3 with IS
Six samples containing only GRh3 (ULOQ without IS) were prepared. The average peak area at the IS retention time in these samples should not exceed 5.0% of the average peak area of the IS in standard calibration and QC samples from the same analytical batch.
2.8.1.3 Interference of IS with GRh3
Six samples containing only the IS (QC0) were prepared. The average peak area at GRh3 retention time in these samples should not exceed 20.0% of the average peak area of GRh3 in LLOQ samples from the same analytical batch.
2.8.2 Carryover
Carryover was evaluated by injecting double blank samples after ULOQ samples (carryover samples). The peak area of GRh3 in carryover samples should not exceed 20.0% of the mean peak area in LLOQ samples. Similarly, the peak area of IS in carryover samples should not exceed 5.0% of the mean peak area in standard calibration and QC samples.
2.8.3 Linearity
The calibration curve was constructed by performing linear regression of the GRh3-to IS peak area ratios (y) against the nominal concentrations of GRh3 (x), using a 1/x2 weighting factor. The measured concentrations at each calibration samples should deviate from the theoretical values by ± 15.0% (±20.0% for LLOQ), and the correlation coefficient (r) should be ≥ 0.99. A minimum of six concentration points, including LLOQ and ULOQ, were used to construct the calibration curve.
2.8.4 Precision and accuracy
Precision and accuracy were assessed at four levels (LLOQ QC, LQC, MQC, and HQC), with six replicates per level, prepared independently over three consecutive days. Precision was evaluated by calculating the relative standard deviation (R.S.D%) of the measured concentrations for the replicate samples. Accuracy was assessed by comparing the ratio of the measured to the theoretical concentrations (%). The ratio should fall within 85.0%–115.0% (80.0%–120.0% for LLOQ QC), and the R.S.D% should not exceed 15.0% (20.0% for LLOQ QC).
2.8.5 Extraction recovery and matrix effect
Extraction recovery and matrix effect were evaluated at three levels (LQC, MQC, and HQC), with six replicates. For extraction recovery evaluating, the QC samples prepared for precision and accuracy assessments were used as test samples, while blank plasma and blank tissue homogenate extracts spiked with GRh3 and IS served as the basic samples. For matrix effect assessment, basic samples for extraction recovery were used as test samples, and PBS (as a surrogate matrix) spiked with GRh3 and IS post-extraction served as the basic samples. The absolute extraction recovery and absolute matrix effect for GRh3 and IS should have an R.S.D% not exceeding 15.0%. The IS-normalized extraction recovery and IS-normalized matrix effect should be within 85%–115%, with an R.S.D% not exceeding 15.0%.
2.8.6 Sample stability
Sample stability was assessed under the following conditions: 3 h at room temperature under white light, 30 days at −80°C, and three freeze-thaw cycles (from −80°C to room temperature). This assessment was performed at three concentration levels (LQC, MQC, and HQC), with six replicates. The acceptance criteria are that the relative error (R.E%) between the measured and nominal concentrations should be within ± 15.0%, and the R.S.D% should not exceed 15.0%.
2.8.7 Post-preparation sample stability
Post-preparation stability was assessed at three levels (LQC, MQC, and HQC), with six replicates, under the following conditions: 3 h at room temperature under white light, 12 h in an autosampler at 8°C, and 2 days in a refrigerator at −20°C. The acceptance criteria for this evaluation are consistent with those applied in the sample stability assessments.
2.8.8 Statistical analysis
LC-MS/MS data acquisition and peak integration were performed using Analyst™ software (AB Sciex, version 1.6.3). The concentrations of GRh3 in plasma and tissues were calculated based on the calibration curve. PK parameters, including the area under the concentration-time curve (AUC), mean residence times (MRT), elimination half-life (T1/2), peak plasma concentration (Cmax), volume of distribution (Vd), Tmax, and clearance rate (CL) were calculated using Phoenix WinNonlin 8.1 (Certara, New Jersey, United States). Data were presented as mean ± standard deviation (SD) and visualized using GraphPad Prism software (version 9.5.1, San Diego, CA, United States).
3 Results and discussion
3.1 Selectivity
Double-blank plasma and liver samples were analyzed, showing no detectable GRh3 or IS in either matrix. In Figure 1, MRM chromatograms at the LLOQ level for both matrices display well-defined peaks for GRh3 and IS, with no evidence of matrix interference. Figure 2 shows MRM chromatograms of ULOQ without IS samples in plasma and liver homogenate, where no IS peaks were detected. Figure 3 presents QC0 samples in the same matrices, confirming the absence of GRh3. These findings collectively illustrate that the analytical method is no matrix interference, and mutual non-interference between GRh3 and IS. Overall, this method demonstrates excellent selectivity.
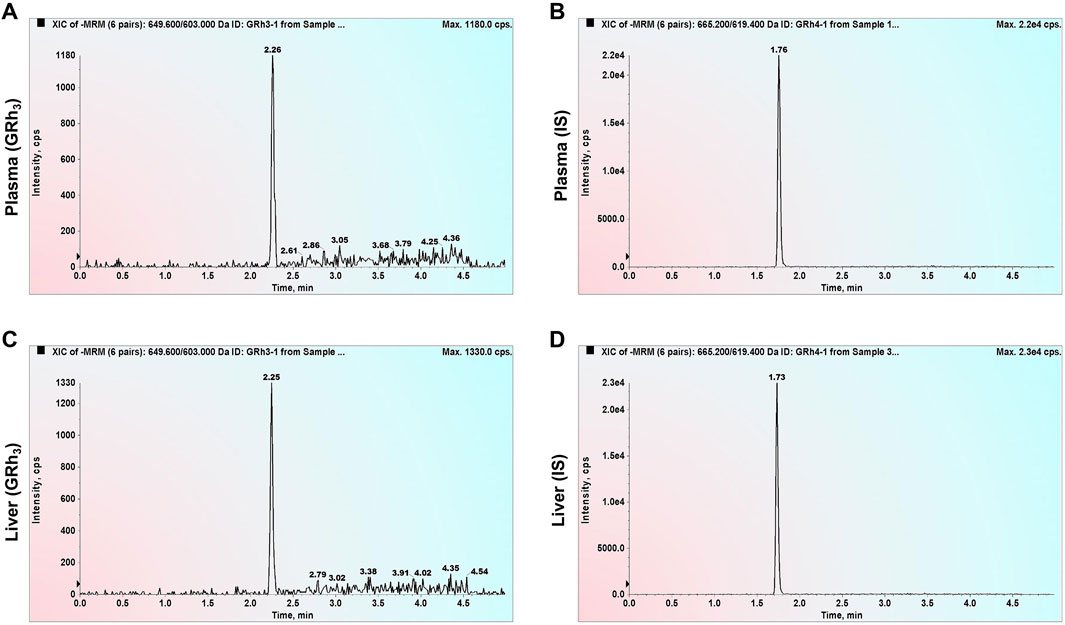
Figure 1. MRM chromatograms of LLOQ samples. (A) GRh3 in plasma. (B) IS in plasma. (C) GRh3 in liver. (D) IS in liver.
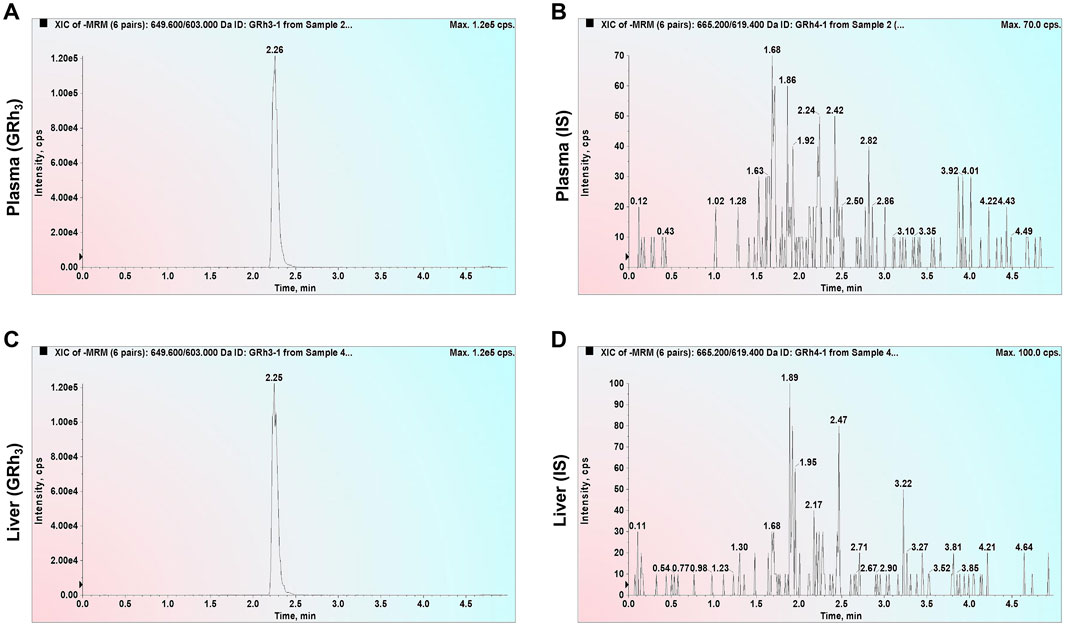
Figure 2. MRM chromatograms of ULOQ without IS samples. (A) GRh3 in plasma. (B) IS in plasma. (C) GRh3 in liver. (D) IS in liver.
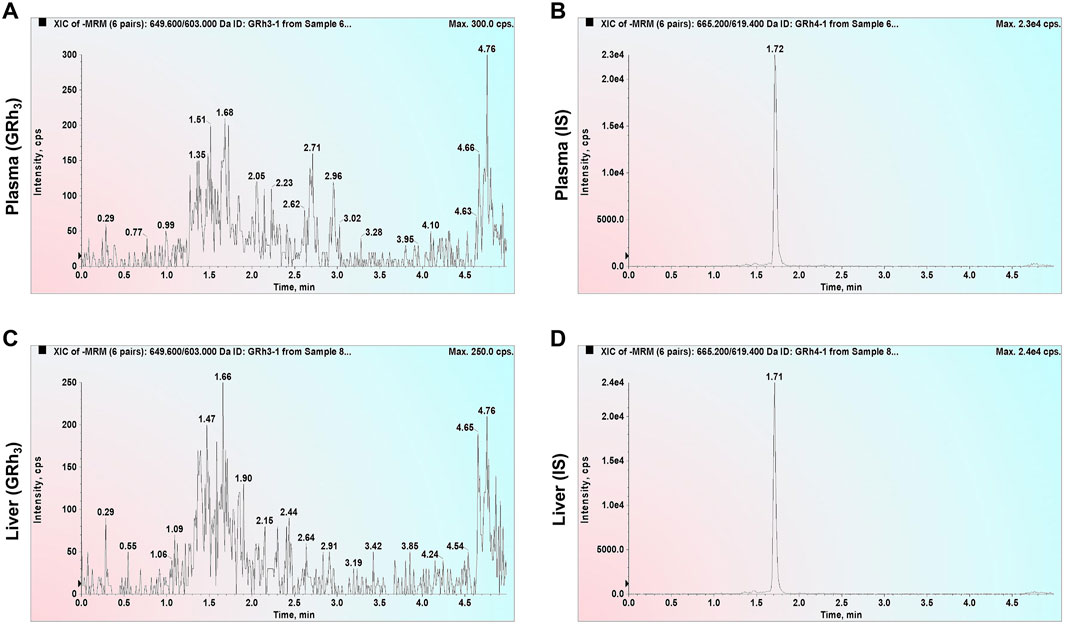
Figure 3. MRM chromatograms of QC0 samples. (A) GRh3 in plasma. (B) IS in plasma. (C) GRh3 in liver. (D) IS in liver.
3.2 Carryover
Carryover samples from plasma and liver were analyzed. Neither GRh3 nor GRh4 were detected, indicating no carryover interference in this analytical method.
3.3 Linearity
The deviation between calculated and nominal concentrations of standard calibration samples was within ± 15.0% (±20.0% for LLOQ). Figure 4 presents representative calibration curves for plasma and tissue, while Table 1 summarizes linearity assessment results from three analytical batches for precision and accuracy evaluations. GRh3 showed excellent linearity within the concentration range of 25.0–5000 ng/mL, with correlation coefficients (r) exceeding 0.99.
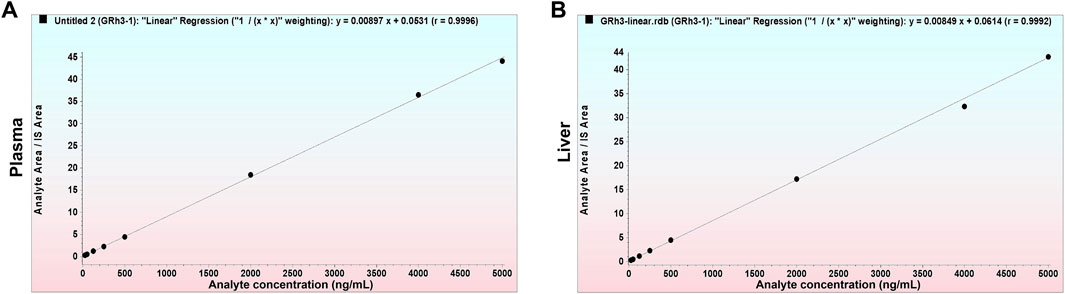
Figure 4. Representative calibration curves. (A) GRh3 in plasma. (B) GRh3 in liver.
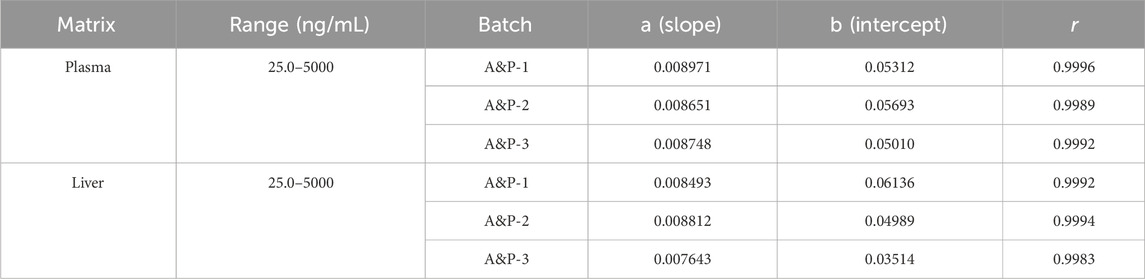
Table 1. Linear parameters for precision and accuracy evaluation batches.
3.4 Precision and accuracy
The intra-day and inter-day precision and accuracy results are detailed in Table 2. At four QC levels, the intra-day accuracies for plasma and liver were within 89.3%–112.3% and 85.9%–112.5%, respectively, with intra-day precisions (R.S.D%) being less than 10.7% and 12.8%, respectively. The inter-day accuracies for plasma and liver were within 90.2%–102.0% and 89.3%–105.9%, respectively, with inter-day precisions (R.S.D%) being less than 10.6% and 12.2%, respectively. These results indicate that the method provides excellent precision and accuracy for the quantification of GRh3 in plasma and tissue samples.
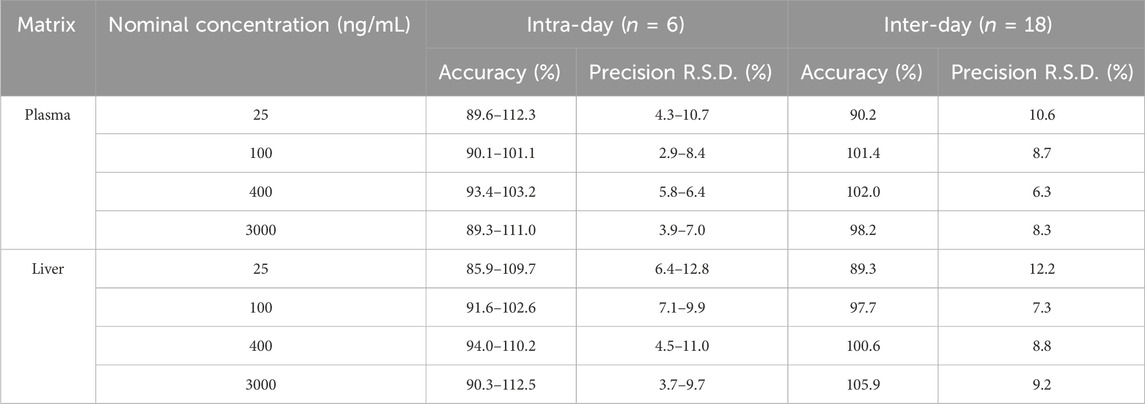
Table 2. Intra-day and inter-day accuracy and precision of GRh3.
3.5 Extraction recovery and matrix effect
The extraction recovery and matrix effect were assessed using three QC concentrations, as detailed in Table 3. For plasma, GRh3 demonstrated an extraction recovery ranging from 93.2% to 97.1% (R.S.D% < 10.0%), whereas the IS exhibited an extraction recovery of 96.7% (R.S.D% = 9.6%). Following IS normalization, the corrected extraction recoveries for GRh3 were between 96.4% and 100.4%. In liver tissue, GRh3 showed an extraction recovery range of 92.4%–98.7% (R.S.D% < 9.5%), with the IS displaying an extraction recovery of 94.2% (R.S.D% = 11.3%). Post-IS correction, the adjusted extraction recoveries for GRh3 were between 98.1% and 104.8%. Regarding matrix effects in plasma, GRh3 values spanned 98.7%–103.5% (R.S.D% < 8.2%), while the IS matrix effect was 97.9% (R.S.D% = 6.7%). After IS correction, the adjusted matrix effects for GRh3 were between 97.9% and 103.5%. In liver tissue, GRh3 matrix effects ranged from 94.3% to 100.3% (R.S.D% < 8.8%), with the IS matrix effect being 98.1% (R.S.D% = 8.3%). Post-IS correction, the adjusted matrix effects for GRh3 were between 96.1% and 102.2%.
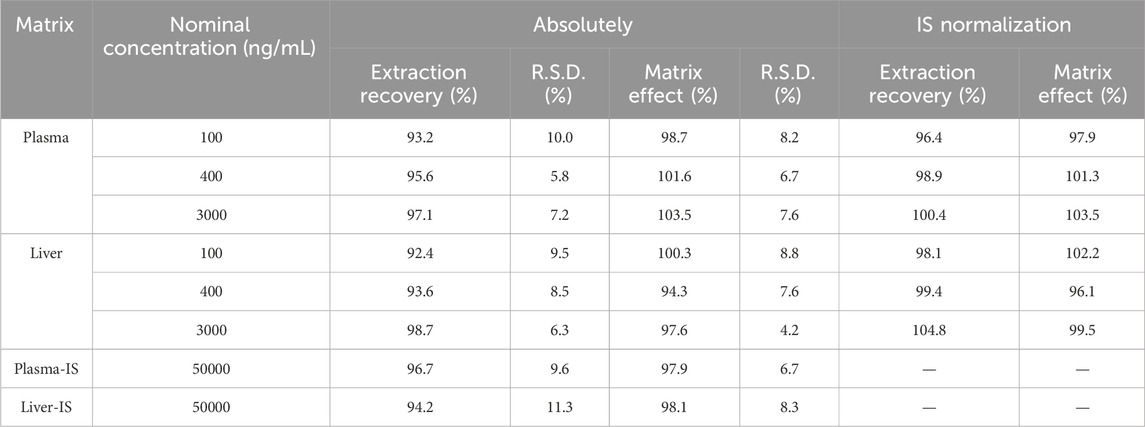
Table 3. Extraction recoveries and matrix effects of GRh3 and GRh4 (IS) in plasma and liver homogenate (n = 6).
3.6 Sample stability
Collected samples are not immediately processed for analysis but are temporarily stored at −80°C until needed, at which point they are thawed and brought to room temperature for sample preparation. To ensure the reliability and precision of analytical outcomes, it is crucial to assess the stability of these samples under various conditions. The assessment results, as detailed in Table 4, reveal that plasma and liver homogenate with three QC concentrations maintain their stability under diverse conditions: when kept at room temperature for 3 h (R.E%: −4.3%–5.7%, R.S.D% < 9.2%), stored at −80°C for up to 30 days (R.E%: −6.9% to −4.2%, R.S.D% < 9.7%), and subjected to three freeze-thaw cycles (R.E%: −12.3% to −2.3%, R.S.D% < 9.7%). These findings underscore the robust stability of the samples across all tested conditions, confirming that they meet stringent stability criteria.
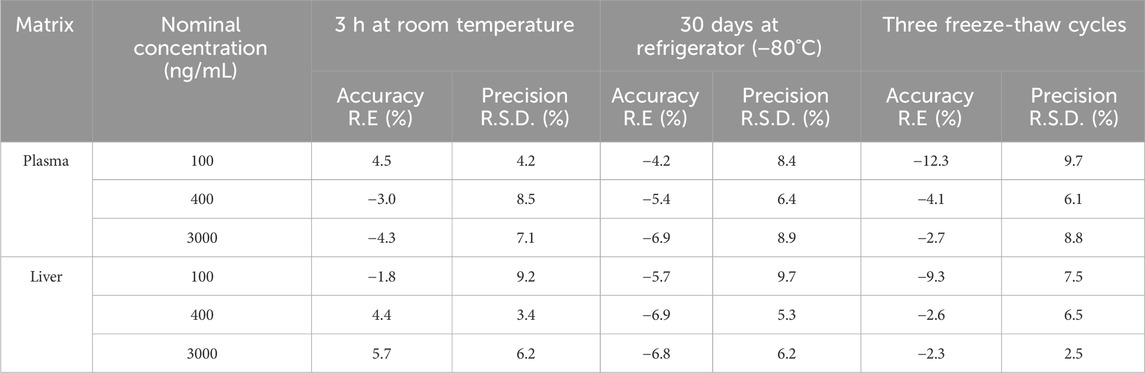
Table 4. Sample stability of GRh3 in plasma and liver homogenate (n = 6).
3.7 Post-preparation sample stability
Post-preparation samples are not immediately analyzed but are instead subjected to periods of storage at room temperature and in an autosampler (8°C). Additionally, in this study, some samples are temporarily stored in a refrigerator at −20°C until analysis. To ensure the reliability and precision of analytical outcomes, it is crucial to assess the stability of post-preparation samples under various conditions: at room temperature, in an autosampler (8°C), and in a refrigerator at −20°C. As detailed in Table 5, post-preparation samples exhibit satisfactory stability when kept at room temperature for 3 h (R.E%: −6.0%–6.6%, R.S.D% < 10.2%), in an autosampler (8°C) for 12 h (R.E%: −8.5% to −2.7%, R.S.D% < 9.0%), and in a refrigerator at −20°C for up to 2 days (R.E%: −8.2% to −4.9%, R.S.D% < 10.1%). These findings confirm that the samples meet the necessary stability criteria, thereby ensuring the validity and accuracy of subsequent analyses. These results underscore the stability of post-preparation samples across all conditions. Consequently, this method ensures the validity and accuracy of subsequent analyses.
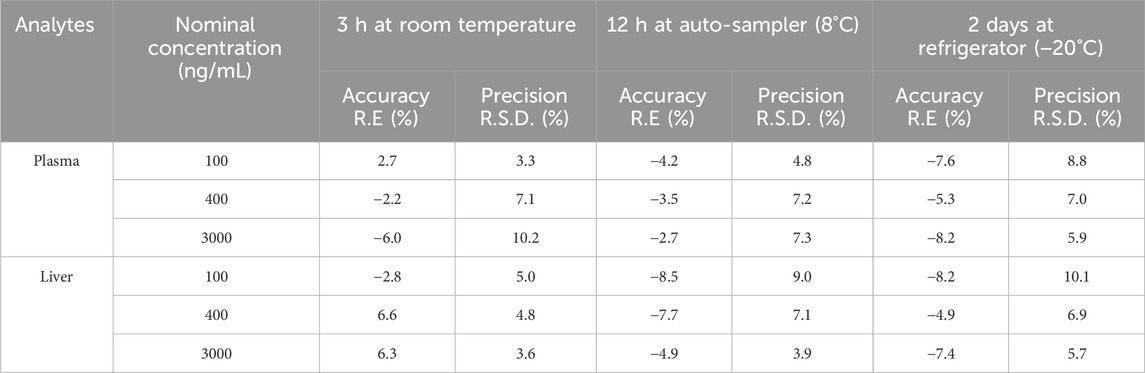
Table 5. Post-preparation sample stability (n = 6).
3.8 Pharmacokinetics analysis
After intragastric administration of GRh3, the plasma concentration-time profile is illustrated in Figure 5, while the PK parameters derived from non-compartmental analysis are summarized in Table 6. The findings reveal a Tmax of 8.0 h for GRh3, with a T1/2 of 14.7 ± 1.7 h. MRT were calculated as 14.4 ± 2.8 h for MRT(0-t) and 18.5 ± 1.8 h for
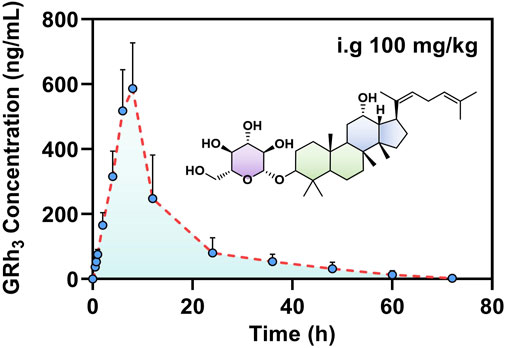
Figure 5. The plasma concentration-time profile of GRh3 after oral administration of 100 mg/kg in rats (n = 7).
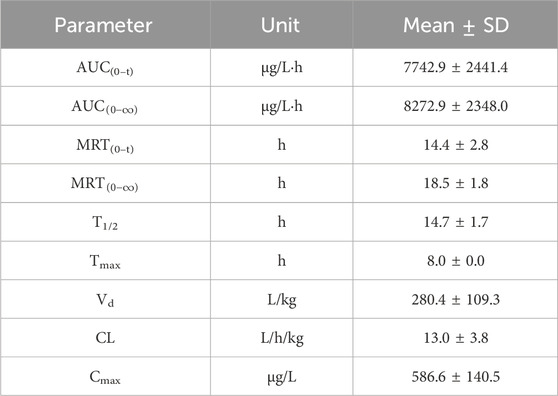
Table 6. PK parameters of GRh3 after oral administration of 100 mg/kg in rats (n = 7).
3.9 Tissue distribution study
To comprehensively characterize the tissue distribution of GRh3 in rats, tissues were harvested at Tmax (8.0 h) post-intragastric administration, and the GRh3 content in each tissue was quantitatively determined. The results reveal extensive distribution of GRh3 across multiple tissues, with notably higher concentrations in certain organs compared to plasma levels (Figure 6). Specifically, the highest concentrations were observed in the intestines (15445.2 ng/g), followed by the stomach (2906.7 ng/g) and liver (1930.8 ng/g). Remarkably, GRh3 demonstrated substantial brain penetration, accumulating prominently in the hippocampus, where concentrations reached up to 520.0 ng/g. These findings highlight the broad tissue distribution and significant brain transmissivity of GRh3.
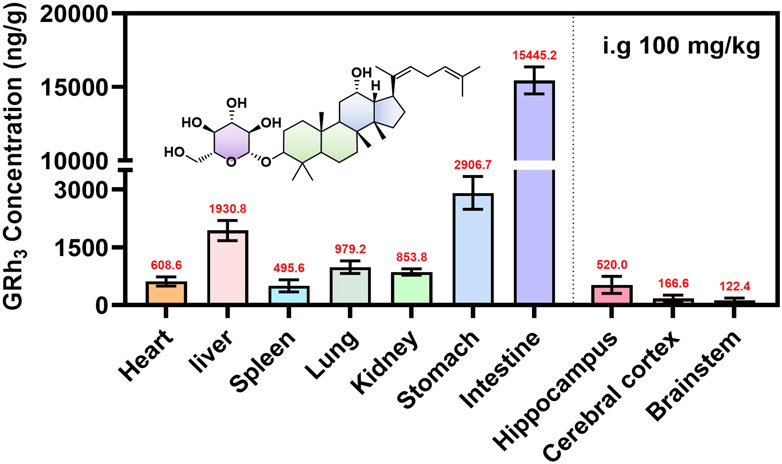
Figure 6. The tissue distribution of GRh3 after oral administration of 100 mg/kg in rats (n = 7).
4 Discussion
This study developed and validated a highly sensitive and selective method based on LC-MS/MS for the precise quantification of GRh3 in rat plasma and various tissues. During method development, Q1 full scans revealed that GRh3 exhibited the highest intensity in the [M+HCOO]−, which directed subsequent product ion scanning (Figure 7A). The two most intense product ions were paired with [M+HCOO]− to establish the MRM quantitative ion transitions. Systematic optimization of key parameters (DP, CE, ion source temperature, spray voltage, and gas settings) maximized signal intensity. The optimization of column selection and mobile phase conditions revealed that the Shimadzu Shim-pack GIST-HP C18 column (2.1 mm × 50 mm, 3 μm), paired with a water (0.1% formic acid)/acetonitrile system, provided optimal chromatographic separation and maximized analytical sensitivity. The ion transition 649.6 > 603.1 was ultimately selected for GRh3 quantification based on peak symmetry, sensitivity, and minimal interference. As no isotopically labeled IS for GRh3 was available, GRh4 was selected as the IS due to its similar properties. The optimization for GRh4 followed the same procedure. The GRh4 product ion scan was conducted (Figure 7B), and the ion transition 665.5 > 619.4 was chosen for detection.
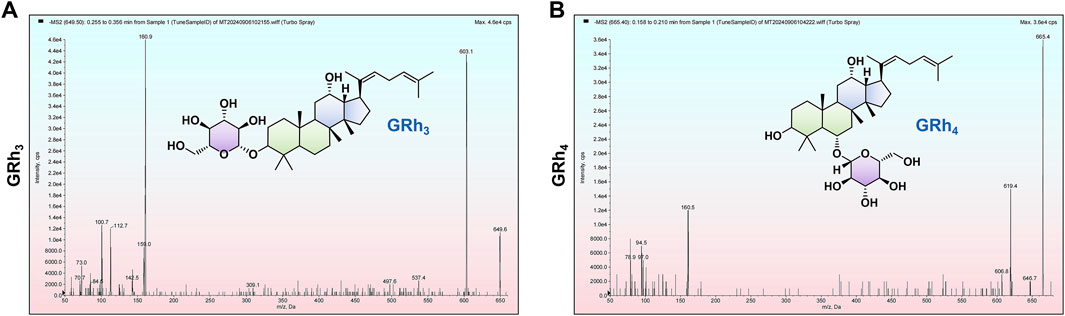
Figure 7. The [M+HCOO]− product ion scans. (A) GRh3. (B) GRh4.
The PK data demonstrate that GRh3 exhibits a “prolonged retention-low clearance” sustained-release profile. The extended time to reach peak plasma concentration (Tmax = 8.0 h) suggests a delayed absorption phenomenon, which may be attributed to gastrointestinal retention effects or significant first-pass elimination (Omeh et al., 2022; Pond and Tozer, 1984). Consequently, this delays the entry of GRh3 into the systemic circulation. From the perspective of elimination half-life and mean residence time, GRh3 exhibits relatively high T1/2 (14.7 ± 1.7 h), MRT(0-t) (14.4 ± 2.8 h), and
Tissue distribution data indicated that the highest concentrations of GRh3 in the intestines, followed by the stomach and liver, indicative of a pronounced first-pass effect (Hervieu et al., 2025). These findings are consistent with the high Vd, prolonged T1/2, and extended MRT observed in the PK data. Notably, GRh3 also exhibits significant brain distribution, particularly in the hippocampus, where its concentrations reached up to 520.0 ng/g, exceeding levels observed in the spleen (495.6 ng/g). The classical BBB theory posits that compounds with high lipophilicity and molecular weight below 500 Da can passively diffuse through the BBB (Xie et al., 2019). However, tissue distribution study has shown orally administered GRh3 accumulates in rat brain parenchyma despite its molecular weight of 604 Da, which deviates significantly from the BBB permeability criteria.
This finding suggests that passive diffusion alone cannot fully explain the observed central nervous system (CNS) distribution of GRh3, implying the involvement of active transporter-mediated mechanisms. The BBB expresses a diverse array of transporters that regulate the movement of substances into and out of the brain. These transporters are broadly categorized into influx and efflux systems (Parvez et al., 2023; Ronaldson and Davis, 2015). Influx transporters, including organic anion transporting polypeptides (OATPs), organic cation transporters (OCTs), monocarboxylate transporters (MCTs), L-type amino acid transporter 1 (LAT1), and glucose transporters (GLUTs), facilitate the uptake of nutrients and drugs from the bloodstream into the brain (Parvez et al., 2023; Tamai and Tsuji, 2000). Conversely, efflux transporters such as P-glycoprotein (P-gp), breast cancer resistance protein (BCRP), and multidrug resistance-associated proteins (MRPs) actively expel substances from the brain, helping to maintain CNS homeostasis (Cox et al., 2023; Parvez et al., 2023). Previous studies have reported that GRb1 can cross the BBB through interactions with GLUT1 (Wang et al., 2018), and that GRg3 has been shown to act as a P-gp inhibitor at the BBB (Xu et al., 2021). Ginsenosides share a similar structural backbone, and GRh3 is likely to retain critical molecular characteristics that support interactions with transporters in a manner similar to its analogs, potentially enabling its transport across the BBB into the brain parenchyma.
In addition to potential active transport, the integrity of the BBB may also contribute to GRh3’s accumulation in the CNS. Our previous in vitro studies demonstrated that GRh3 induces oxidative stress and neuronal apoptosis via the IP3R-Ca2+/NOX2/NF-κB pathway (Wang et al., 2025). Both oxidative stress and inflammation have been implicated in BBB disruption (Fang et al., 2024; Gao et al., 2023), suggesting that GRh3 may impair BBB function and thereby facilitate its own entry into the brain. This is supported by the notably high concentration of GRh3 in the hippocampus, a brain region highly susceptible to oxidative damage and neuroinflammation. To verify this possibility, future studies should assess BBB integrity following GRh3 administration using classical methods such as Evans Blue dye extravasation and immunohistochemical detection of tight junction proteins, including Claudin-5 and Occludin. Overall, elucidating both active transport mechanisms and structural BBB alterations will be critical for fully understanding the brain pharmacokinetics and potential neurotoxicity of GRh3.
5 Conclusion
This study developed and validated a LC-MS/MS method for detecting GRh3 concentrations in rat plasma and tissues. Subsequently, the PK result indicated that oral administration of GRh3 exhibited a prolonged Tmax (8.0 h) and an extended T1/2 (14.7 ± 1.7 h), indicating relatively slow absorption and excretion processes. The tissue distribution data showed that GRh3 significantly accumulated in the intestine, stomach, and liver, and was also able to penetrate the BBB to accumulate in brain tissues, particularly in the hippocampus. However, the mechanisms underlying its BBB penetration remain to be further investigated. This study provides essential support for the further research and development of GRh3.
Data availability statement
The original contributions presented in the study are included in the article/supplementary material, further inquiries can be directed to the corresponding authors.
Ethics statement
The animal study was approved by Animal Experimentation Committee of Zunyi Medical University. The study was conducted in accordance with the local legislation and institutional requirements.
Author contributions
CH: Conceptualization, Data curation, Formal Analysis, Methodology, Validation, Writing – original draft, Writing – review and editing, Project administration, Software, Visualization. YW: Formal Analysis, Visualization, Writing – review and editing, Conceptualization, Software. YL: Data curation, Methodology, Visualization, Writing – review and editing, Validation. XW: Data curation, Visualization, Writing – review and editing, Validation. PS: Writing – review and editing, Data curation, Software. HM: Conceptualization, Supervision, Writing – review and editing, Formal Analysis, Software. LY: Conceptualization, Funding acquisition, Supervision, Writing – review and editing.
Funding
The author(s) declare that financial support was received for the research and/or publication of this article. This study was supported by National Natural Science Foundation of China (8227131503).
Conflict of interest
The authors declare that the research was conducted in the absence of any commercial or financial relationships that could be construed as a potential conflict of interest.
Generative AI statement
The author(s) declare that no Generative AI was used in the creation of this manuscript.
Publisher’s note
All claims expressed in this article are solely those of the authors and do not necessarily represent those of their affiliated organizations, or those of the publisher, the editors and the reviewers. Any product that may be evaluated in this article, or claim that may be made by its manufacturer, is not guaranteed or endorsed by the publisher.
References
Aboghazleh, R., Boyajian, S. D., Atiyat, A., Udwan, M., Al-Helalat, M., and Al-Rashaideh, R. (2024). Rodent brain extraction and dissection: a comprehensive approach. MethodsX 12, 102516. doi:10.1016/j.mex.2023.102516
Baeg, I. H., and So, S. H. (2013). The world ginseng market and the ginseng (korea). J. Ginseng Res. 37 (1), 1–7. doi:10.5142/jgr.2013.37.1
CDE. (2005). Technical guidelines for non-clinical pharmacokinetics studies of chemical drugs: CFDA.
Cox, B., Nicolaï, J., and Williamson, B. (2023). The role of the efflux transporter, P-glycoprotein, at the blood-brain barrier in drug discovery. Biopharm. Drug Dispos. 44 (1), 113–126. doi:10.1002/bdd.2331
EMA (2011). Guideline on bioanalytical method validation (EMEA/CHMP/EWP/192217/2009). London, United Kingdom: European Medicines Agency EMA.
Eom, S. J., Hwang, J. E., Kim, K. T., and Paik, H. D. (2017). Antibacterial effects against various foodborne pathogens and sensory properties of yogurt supplemented with Panax ginseng marc extract. Korean J. Food Sci. Anim. Resour. 37 (5), 787–791. doi:10.5851/kosfa.2017.37.5.787
Eusébio, S., Soares, A. R., Fiúza, P., and Garcia, T. (2024). Amiodarone-induced interstitial pneumonia: a cause of respiratory failure. Cureus 16 (11), e74253. doi:10.7759/cureus.74253
Fang, M., Yu, Q., Ou, J., Lou, J., Zhu, J., and Lin, Z. (2024). The neuroprotective mechanisms of PPAR-γ: inhibition of microglia-mediated neuroinflammation and oxidative stress in a neonatal mouse model of hypoxic-ischemic white matter injury. CNS Neurosci. Ther. 30 (11), e70081. doi:10.1111/cns.70081
Gan, Y., Li, Z., Fan, B., Ji, Z., Yang, L., Wu, Y., et al. (2024). De novo Biosynthesis of a Polyene-Type Ginsenoside Precursor Dammaradienol in Saccharomyces cerevisiae. ACS Synth. Biol. 13 (12), 4015–4026. doi:10.1021/acssynbio.4c00396
Gao, H. M., Chen, H., Cui, G. Y., and Hu, J. X. (2023). Damage mechanism and therapy progress of the blood-brain barrier after ischemic stroke. Cell Biosci. 13 (1), 196. doi:10.1186/s13578-023-01126-z
Hao, L., Li, S., Li, C., Zhang, Z., Hu, X., and Yan, H. (2025). A review of the therapeutic potential of ginseng and its bioactive components in nonalcoholic fatty liver disease. Drug Des. Devel Ther. 19, 83–96. doi:10.2147/dddt.S500719
Hervieu, L., Groo, A. C., Bellien, J., Guerrot, D., and Malzert-Fréon, A. (2025). Glucuronidation of orally administered drugs and the value of nanocarriers in strategies for its overcome. Pharmacol. Ther. 266, 108773. doi:10.1016/j.pharmthera.2024.108773
Hoch, M., Huth, F., Manley, P. W., Loisios-Konstantinidis, I., Combes, F. P., Li, Y. F., et al. (2024). Clinical pharmacology of asciminib: a review. Clin. Pharmacokinet. 63 (11), 1513–1528. doi:10.1007/s40262-024-01428-6
Kim, E. J., Jung, I. H., Van Le, T. K., Jeong, J. J., Kim, N. J., and Kim, D. H. (2013). Ginsenosides Rg5 and Rh3 protect scopolamine-induced memory deficits in mice. J. Ethnopharmacol. 146 (1), 294–299. doi:10.1016/j.jep.2012.12.047
Lee, Y. Y., Park, J. S., Lee, E. J., Lee, S. Y., Kim, D. H., Kang, J. L., et al. (2015). Anti-inflammatory mechanism of ginseng saponin metabolite Rh3 in lipopolysaccharide-stimulated microglia: critical role of 5'-adenosine monophosphate-activated protein kinase signaling pathway. J. Agric. Food Chem. 63 (13), 3472–3480. doi:10.1021/jf506110y
Omeh, R., Ugwueze, M., Offiah, R., Mbah, C., Momoh, A., Onyishi, I., et al. (2022). Oral drug delivery: gastrointestinal tract adaptations, barriers and strategies for delivery enhancement - a review. Bio-Research 20, 1685–1698. doi:10.4314/br.v20i3.6
Parvez, M. M., Sadighi, A., Ahn, Y., Keller, S. F., and Enoru, J. O. (2023). Uptake transporters at the blood-brain barrier and their role in brain drug disposition. Pharmaceutics 15 (10), 2473. doi:10.3390/pharmaceutics15102473
Pond, S. M., and Tozer, T. N. (1984). First-pass elimination. Basic concepts and clinical consequences. Clin. Pharmacokinet. 9 (1), 1–25. doi:10.2165/00003088-198409010-00001
Ronaldson, P. T., and Davis, T. P. (2015). Targeting transporters: promoting blood-brain barrier repair in response to oxidative stress injury. Brain Res. 1623, 39–52. doi:10.1016/j.brainres.2015.03.018
Shah, M. A., Abuzar, S. M., Ilyas, K., Qadees, I., Bilal, M., Yousaf, R., et al. (2023). Ginsenosides in cancer: targeting cell cycle arrest and apoptosis. Chem. Biol. Interact. 382, 110634. doi:10.1016/j.cbi.2023.110634
Shan, M., Bai, Y., Fang, X., Lan, X., Zhang, Y., Cao, Y., et al. (2023). American ginseng for the treatment of alzheimer's disease: a review. Molecules 28 (15), 5716. doi:10.3390/molecules28155716
Shang, S., Yang, H., Qu, L., Fan, D., and Deng, J. (2025). Ginsenoside, a potential natural product against liver diseases: a comprehensive review from molecular mechanisms to application. Crit. Rev. Food Sci. Nutr., 1–25. doi:10.1080/10408398.2025.2451761
Tamai, I., and Tsuji, A. (2000). Transporter-mediated permeation of drugs across the blood-brain barrier. J. Pharm. Sci. 89 (11), 1371–1388. doi:10.1002/1520-6017(200011)89:11<1371::aid-jps1>3.0.co;2-d
Wang, X. M., She, C., Li, Q., Zhang, D., Xu, J. X., Li, M. H., et al. (2020). Ginsenoside Rh3 activates Nrf2 signaling and protects endometrial cells from oxygen and glucose deprivation-reoxygenation. Aging (Albany NY) 12 (7), 6109–6119. doi:10.18632/aging.103009
Wang, Y., Chen, J., Li, S., and Cai, Z. (2025). Ginsenoside Rh3-induced neurotoxicity involving the IP3R-Ca2+/NOX2/NF-κB signaling pathways. J. Nat. Med. doi:10.1007/s11418-025-01912-8
Wang, Y., Wu, D., Wang, Y., Sun, J., Wang, X., Huang, Y., et al. (2024). Bioinformatics study of the potential therapeutic effects of ginsenoside Rh3 in reversing insulin resistance. Front. Mol. Biosci. 11, 1339973. doi:10.3389/fmolb.2024.1339973
Wang, Y. Z., Xu, Q., Wu, W., Liu, Y., Jiang, Y., Cai, Q. Q., et al. (2018). Brain transport profiles of ginsenoside Rb(1) by glucose transporter 1: in vitro and in vivo. Front. Pharmacol. 9, 398. doi:10.3389/fphar.2018.00398
Wu, Y., Pi, D., Zhou, S., Yi, Z., Dong, Y., Wang, W., et al. (2023). Ginsenoside Rh3 induces pyroptosis and ferroptosis through the Stat3/p53/NRF2 axis in colorectal cancer cells. Acta Biochim. Biophys. Sin. (Shanghai) 55 (4), 587–600. doi:10.3724/abbs.2023068
Xie, J., Shen, Z., Anraku, Y., Kataoka, K., and Chen, X. (2019). Nanomaterial-based blood-brain-barrier (BBB) crossing strategies. Biomaterials 224, 119491. doi:10.1016/j.biomaterials.2019.119491
Xu, J. F., Wan, Y., Tang, F., Chen, L., Yang, Y., Xia, J., et al. (2021). Emerging significance of ginsenosides as potentially reversal agents of chemoresistance in cancer therapy. Front. Pharmacol. 12, 720474. doi:10.3389/fphar.2021.720474
Yang, T., Xu, W., Wei, X., Zhang, Z., Sun, Y., Liu, H., et al. (2022). Determination of ginsenoside Rh3 in rat plasma by LC-MS/MS and its application to a pharmacokinetic study. Biomed. Chromatogr. 36 (2), e5268. doi:10.1002/bmc.5268
Yun, T. K. (2001). Brief introduction of Panax ginseng C.A. meyer. J. Korean Med. Sci. 16 (Suppl. l), S3–S5. doi:10.3346/jkms.2001.16.S.S3
Keywords: GRh3, pharmacokinetics, tissue distribution, blood-brain barrier, LC-MS/MS
Citation: Hu C, Wang Y, Liu Y, Wang X, Song P, Ma H and Yang L (2025) Pharmacokinetics and tissue distribution analysis of ginsenoside Rh3 in rats using a novel LC-MS/MS quantification strategy. Front. Pharmacol. 16:1582644. doi: 10.3389/fphar.2025.1582644
Received: 24 February 2025; Accepted: 26 June 2025;
Published: 10 July 2025.
Edited by:
Bin Yu, Nanjing University of Chinese Medicine, ChinaReviewed by:
Mamunur Rashid, University of Nebraska Medical Center, United StatesSerban Moldoveanu, Independent Researcher, Greensboro, United States
Copyright © 2025 Hu, Wang, Liu, Wang, Song, Ma and Yang. This is an open-access article distributed under the terms of the Creative Commons Attribution License (CC BY). The use, distribution or reproduction in other forums is permitted, provided the original author(s) and the copyright owner(s) are credited and that the original publication in this journal is cited, in accordance with accepted academic practice. No use, distribution or reproduction is permitted which does not comply with these terms.
*Correspondence: Hong Ma, cmVkbGVtb25vbmx5QGljbG91ZC5jb20=; Ling Yang, eWxpbmdAc2h1dGNtLmVkdS5jbg==
†These authors have contributed equally to this work