 Dehui Fan1†Hengping Liu2†Zhenning Zhang1Meiyi Su1Zhixian Yuan1Ying Lin1Shuquan Yang1
 Wenqiang Li3*Xintao Zhang4*
- 1The Fifth Clinical College of Guangzhou University of Chinese Medicine Guangzhou, Guangdong Second Traditional Chinese Medicine Hospital, Guangzhou, China
- 2Beijing University of Chinese Medicine Third Affiliated Hospital, Beijing, China
- 3Engineering Technology Research Center for Sports Assistive Devices of Guangdong, Guangzhou Sport University, Guangzhou, China
- 4Department of Sports Medicine and Rehabilitation, National and Local Joint Engineering, Research Center of Orthopaedic Biomaterials, Peking University Shenzhen Hospital, Shenzhen, China
by Fan D, Liu H, Zhang Z, Su M, Yuan Z, Lin Y, Yang S, Li W and Zhang X (2021). Front. Pharmacol. 12:618724. doi: 10.3389/fphar.2021.618724
In the published article, there was an error in Figures 3B, 4A,B as published. Images from different groups were stored in the same folder during image shooting, resulting in the misuse of images. The corrected Figures 3B, 4A,B and their captions appear below.
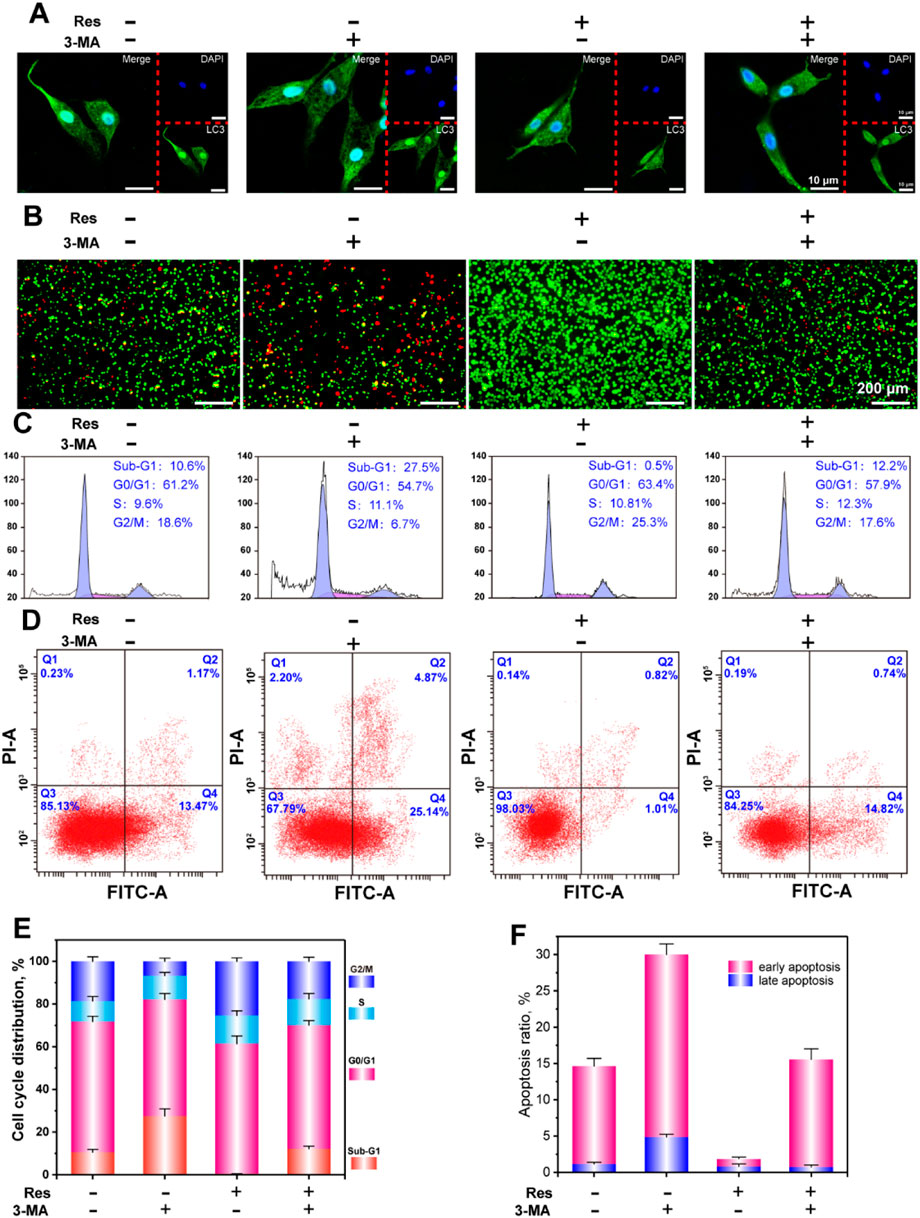
Figure 3. CLSM observation of LC3 puncta (A), AO-EB staining (B), flow cytometry analysis of the cell cycle (C), apoptosis (D), and statistical analysis of the cell cycle (E), and apoptosis (F). The values are represented as the mean ± SD (n = 3). *p < 0.05, **p < 0.01 vs. control (without Res and 3-MA).
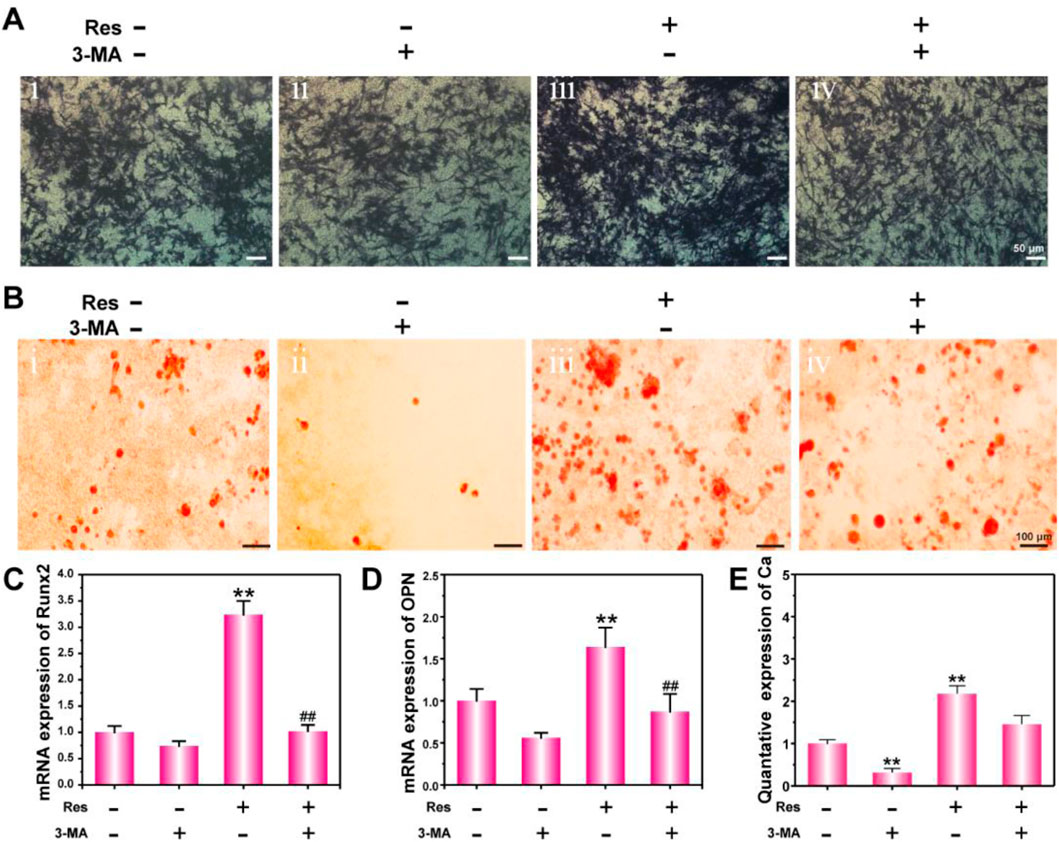
Figure 4. Osteogenic differentiation of BMSCs treated with Res and 3-MA for 14 days. ALP activity detection (A) and ARS staining (B). mRNA expression of Runx2 (C) and OPN (D) detected by q-PCR. The quantative data of Ca nodulus analyzed by ARS staining using ImageJ software (E). The values are represented as the mean ± SD (n = 3). *p < 0.05, **p < 0.01 vs. control (without Res and 3-MA); #p < 0.05, ##p < 0.01 vs. Res group.
In the published article, there was an error in Figures 7A, 8 as published. The H&E, Masson, OCN and CD31 staining images of the animal tissue sections in Figures 7, 8 overlap with those used in our previous published study. This occurred because the animal experiments for both research projects were conducted concurrently, leading to inadvertent misplacement of data files. The corrected Figures 7A, 8 and their captions appear below.
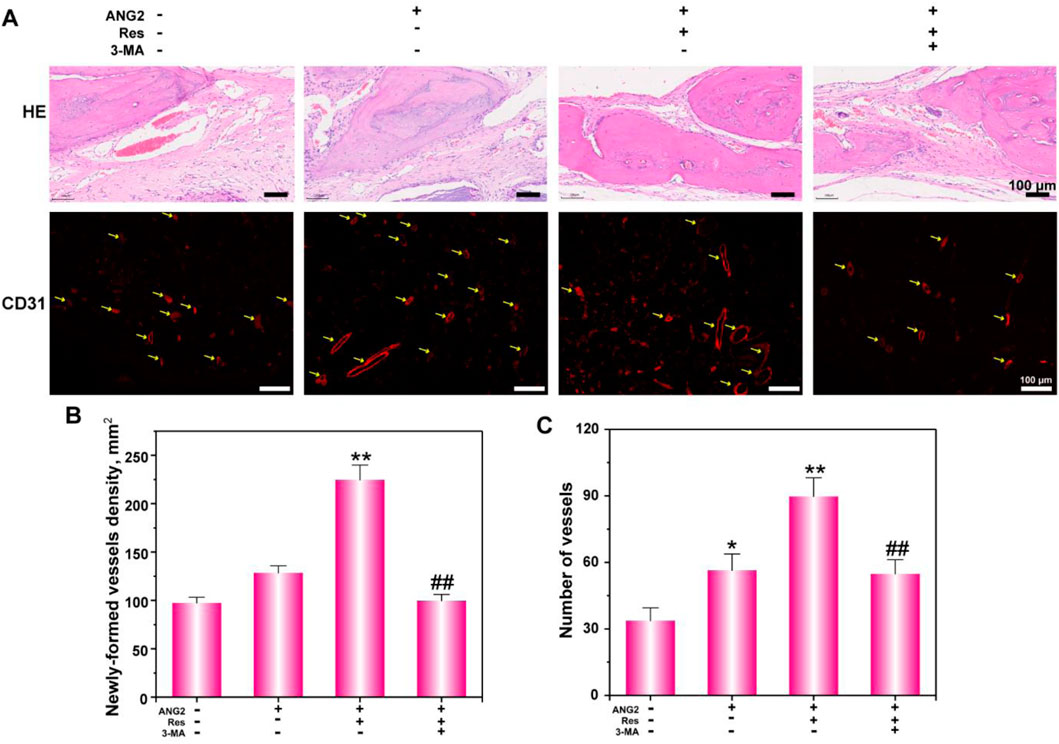
Figure 7. Histological analysis (A) of bone defects via H&E staining and CD31 immunofluorescence staining. (B) The newly formed vessel density and (C) number were determined. The values are represented as the mean ± SD (n = 6).*p < 0.05, **p < 0.01 vs. ANG2 group; #p < 0.05, ##p < 0.01 vs. ANG2/Res group.
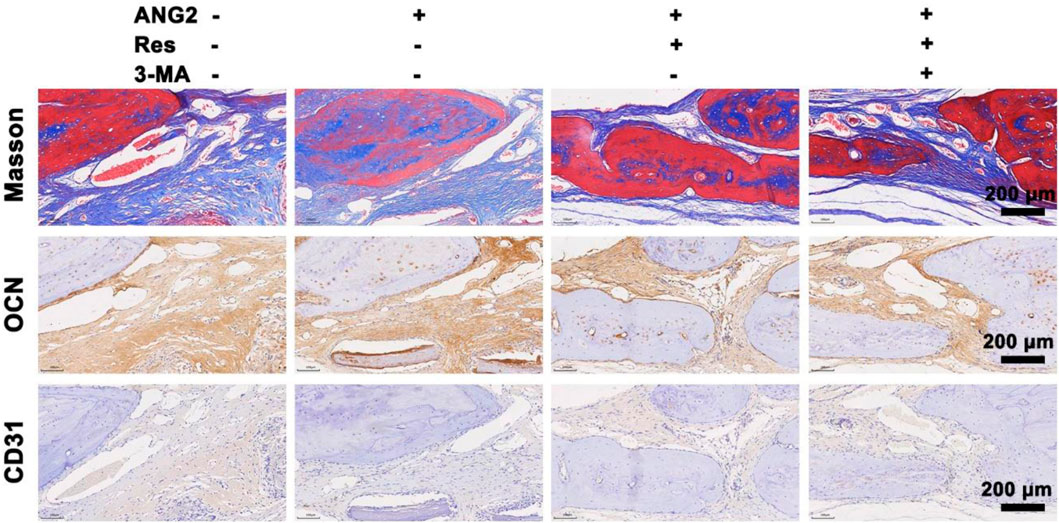
Figure 8. Masson staining and immunohistochemical staining for OCN and CD31 in the bone defect area at the 8th week. The values are represented as the mean ± SD (n = 6).
The original article has been updated.
Generative AI statement
Any alternative text (alt text) provided alongside figures in this article has been generated by Frontiers with the support of artificial intelligence and reasonable efforts have been made to ensure accuracy, including review by the authors wherever possible. If you identify any issues, please contact us.
Publisher’s note
All claims expressed in this article are solely those of the authors and do not necessarily represent those of their affiliated organizations, or those of the publisher, the editors and the reviewers. Any product that may be evaluated in this article, or claim that may be made by its manufacturer, is not guaranteed or endorsed by the publisher.
Keywords: resveratrol, ANG2, autophagy, hypoxia condition, vascularization, bone defect
Citation: Fan D, Liu H, Zhang Z, Su M, Yuan Z, Lin Y, Yang S, Li W and Zhang X (2025) Correction: Resveratrol and Angiogenin-2 combined with PEGDA/TCS hydrogel for the targeted therapy of hypoxic bone defects via activation of the autophagy pathway. Front. Pharmacol. 16:1597755. doi: 10.3389/fphar.2025.1597755
Received: 21 March 2025; Accepted: 25 June 2025;
Published: 17 September 2025.
Edited and reviewed by:
Bernd Rosenkranz, Fundisa African Academy of Medicines Development, South AfricaCopyright © 2025 Fan, Liu, Zhang, Su, Yuan, Lin, Yang, Li and Zhang. This is an open-access article distributed under the terms of the Creative Commons Attribution License (CC BY). The use, distribution or reproduction in other forums is permitted, provided the original author(s) and the copyright owner(s) are credited and that the original publication in this journal is cited, in accordance with accepted academic practice. No use, distribution or reproduction is permitted which does not comply with these terms.
*Correspondence: Wenqiang Li, Z3p0eWx3cUBmb3htYWlsLmNvbQ==, NDA1MTE5OTIzQHFxLmNvbQ==; Xintao Zhang, emhhbmd4aW50YW9Ac2luYS5jb20=
†These authors have contributed equally to this work