Abstract
Introduction:
Diabetic retinopathy (DR) is the leading cause of vision loss in working-age individuals globally, and the associated complication of diabetic macular edema (DME) is the most frequent cause of vision loss in these patients. The retinal swelling characteristic of DME can be attributed to fluid leakage due to damage to the two blood-retina barriers—the inner barrier composed primarily of retinal microvascular endothelial cells and the outer barrier composed of retinal pigment epithelial cells (RPE).
Methods:
Based on the previously characterized proinflammatory roles of prostanoid signaling in DR, we assayed the distinct prostanoid signaling mechanisms regulating inner and outer blood-retina barrier function using in vitro methods involving monoculture of primary human cells.
Results:
Prostaglandin E2 (PGE2) stimulation of retinal endothelial monolayers caused a decrease in barrier permeability in electric cell-substrate impedance sensing (ECIS) assays and dextran flux assays. These effects occurred via the EP4 receptor of PGE2. In direct contrast, PGE2 stimulation of RPE monolayers caused an increase in barrier permeability via the EP2 receptor. Other prostanoids did not alter barrier permeability in either monocellular model. RNA sequencing of retinal endothelial and RPE cells with or without PGE2 stimulation revealed significant dysregulation of genes encoding junctional complex components and signaling that likely drive the observed effects on cell barrier resistance.
Discussion:
Together these results suggest opposing mechanisms of PGE2 signaling in the retina via two distinct receptors, indicating cell type-specific and likely receptor-specific targets for the potential therapeutic management of DME or other causes of dysfunctional retinal vascular permeability.
1 Introduction
In the United States and worldwide, diabetic retinopathy (DR), a microvascular complication of diabetes mellitus, has become a leading cause of irreversible vision loss (Yau et al., 2012; Lundeen et al., 2023; Kempen et al., 2004). DR pathogenesis is characterized in its early stages by retinal features that include rising inflammation, pericyte and endothelial cell death, capillary regression, neuronal damage, leukocyte adhesion, and vascular leakage from blood-retina barrier dysfunction (Tang and Kern, 2011; Antonetti et al., 2012; Antonetti et al., 2021; Bianco et al., 2022). Together, these features define the stage of nonproliferative diabetic retinopathy (NPDR) (Tang and Kern, 2011; Antonetti et al., 2012). As the disease progresses, aberrant angiogenesis of retinal capillaries, known as neovascularization, marks the onset of proliferative diabetic retinopathy (PDR), the later stage of disease that is responsible for the most severe and irreversible vision loss (Tang and Kern, 2011; Antonetti et al., 2012).
Notably, swelling of the retina known as diabetic macular edema (DME) is the most common cause of vision loss in patients with diabetes, although in some cases it is reversible with treatment and can even resolve spontaneously (Ferris and Patz, 1984). DME is defined as the accumulation of fluid and lipids within the layers of the retina particularly in the macula, the central region responsible for high acuity vision (Ferris and Patz, 1984; Bhagat et al., 2009). Worsening conditions of diabetes and DR cause breakdown of the blood-retina barriers and imbalances in retinal fluid intake and drainage that lead to swelling and retinal thickening (Ferris and Patz, 1984; Bhagat et al., 2009; Daruich et al., 2018). In one study, up to 44% of diabetic patients developed some degree of DME when monitored over 9 years (Diabetes Control and Complications Trial Research Group, 1995). DME can develop in patients with any stage of retinopathy, but it is increasingly observed as DR severity and time since diabetes onset increases (Klein et al., 1984; Klein et al., 1995).
The role of inflammation in the early phases of DR and DME has emerged as a key area of research to study and treat disease. In particular, the prostanoid family of signaling lipids generated by cyclooxygenase (COX)-1 and COX-2-mediated metabolism of arachidonic acid may be especially relevant to the progression of retinal vascular diseases (Stark and Penn, 2024a). The five prostanoids signal through 9 G protein-coupled receptors (GPCRs) with different specificities and distinct downstream signaling: prostaglandins PGD2 via receptors DP1 and DP2; PGE2 via EP1, EP2, EP3, and EP4; PGF2α via FP; PGI2 via IP; and thromboxane A2 (TXA2) via TP. Due to the many downstream pathways that could be activated by diverse prostanoid signaling, we hypothesize that select prostanoids and/or their receptors may be clinically relevant targets for the management of inflammation in DME.
Retinal vascular hyperpermeability, a key feature of DME, may affect both the inner and outer barriers of the retina. The inner blood-retina barrier is primarily composed of the retinal microvascular endothelial cells that form the vessels supplying blood to the inner retina. Tight junction proteins connect neighboring endothelial cells, and these cells function in coordination with retinal pericytes and Müller glia as the neurovascular unit of the retina (Antonetti et al., 2012; Pan et al., 2021; O'Leary and Campbell, 2023). The outer blood-retina barrier is composed of the retinal pigment epithelial cells (RPE) and serves as the physical barrier between the photoreceptors and the fenestrated capillary bed of the choroid. Adjacent RPE are also interconnected by tight junction proteins to regulate fluid and nutrient transport from the choroid and back (Pan et al., 2021; O'Leary and Campbell, 2023).
Work from Nakamura et al. previously studied prostanoid signaling in blood-retina barriers from a perspective of clinical utility (Nakamura et al., 2023). Latanoprost, the common glaucoma treatment that facilitates uveoscleral outflow and lowers intraocular pressure, is an analog of PGF2α. Similarly, the more recently approved glaucoma drug omidenepag isopropyl is a PGE2-EP2 receptor agonist. The retinal inflammatory effects of these two drugs were evaluated by Nakamura and colleagues in human retinal microvascular endothelial cells (hRMEC) and ARPE-19 cells to model the inner and outer blood-retina barriers, respectively. Co-stimulation with both latanoprost and omidenepag, but not either drug alone, increased proinflammatory cytokine levels in each cell type. Notably, co-stimulation also enhanced barrier function of hRMEC, yet conversely, it decreased barrier function of ARPE-19 (Nakamura et al., 2023).
Here, we sought to fully characterize the pharmacology of prostanoid signaling in the inner and outer blood-retina barriers using in vitro techniques. We observed changes in the cell barrier permeability of both hRMEC and RPE cultures treated with PGE2 but not when treated with PGF2α. Interestingly, the PGE2 effects were observed in opposite directions: PGE2 strengthened hRMEC barrier resistance via the EP4 receptor, but it reduced ARPE-19 resistance via the EP2 receptor, each occurring through elevated cAMP signaling. RNA sequencing of hRMEC or ARPE-19 with or without PGE2 stimulation revealed differential expression of many genes involved in junctional complexes, possible mechanisms for these changes in barrier resistance. Together, these new results suggest cell type-specific, receptor-specific responses to DR-relevant prostanoid signaling with potential implications for the management of DME.
2 Materials and methods
2.1 Materials and reagents
Catalog numbers and supplier information for all reagents are presented in Supplementary Table S1.
2.2 Cell culture
Primary human retinal microvascular endothelial cells (hRMEC) were obtained from Cell Systems. Cells were grown on tissue culture-treated dishes coated with Attachment Factor (Cell Systems) in Endothelial Basal Media (EBM; Cell Systems) supplemented with 10% fetal bovine serum (FBS; R&D Systems; Lot #M22319) and EGM SingleQuots (Lonza). Passage 8 cells were used for experiments.
Primary human retinal pigment epithelial cells (hRPE) were obtained from Lonza. Cells were grown on uncoated tissue culture-treated dishes in Dulbecco’s Modified Eagle Medium/Nutrient Mixture F-12 (DMEM/F-12; Gibco) supplemented with 10% FBS and 1% penicillin/streptomycin (Gibco). Passage 5 cells were used for experiments.
Human RPE cell line ARPE-19 cells were obtained from ATCC. Cells were grown in DMEM/F-12 supplemented with 10% FBS and 1% penicillin/streptomycin on uncoated tissue culture-treated dishes for all experiments except for ECIS assays, where wells were coated with Attachment Factor. Passage 24–25 cells were used for experiments.
All cell cultures were maintained in incubators held at 37 °C, 5% CO2, and 95% humidity and used FBS from a single lot, #M22319, to reduce uncontrolled experimental variability.
2.3 Electric cell-substrate impedance sensing (ECIS) assays
ECIS assays were performed in an ECIS Z-Theta 96-well array station (Applied BioPhysics). Gold electrode culture plates (Applied BioPhysics) were incubated with 10 mM L-cysteine (Sigma-Aldrich) for 10 min then washed twice with cell culture grade water (Sigma-Aldrich). Culture plates were then coated with Attachment Factor before plating cells. Assays were run with the ECIS array station housed in a cell culture incubator maintained at 37 °C, 5% CO2, and 95% humidity for the duration of the experiments. Media were changed daily until treatment. When cell monolayer resistance reached a stable plateau after 18–72 h, cells were treated with PGD2 (10 pM-10 μM), PGE2 (3 pM-10 μM), PGF2α (3 pM-10 μM), DP1 antagonist BW A868C (50 nM–500 nM), DP2 antagonist OC000459 (50 nM–500 nM), EP1 antagonist SC-51322 (5 nM–500 nM), EP2 antagonist PF-04418948 (30 pM-3 μM), EP2 antagonist TG4-155 (100 nM-10 μM), EP3 antagonist DG-041 (5 nM–500 nM), EP4 antagonist L-161,982 (10 pM-10 μM), EP2 agonist butaprost (1 nM-10 μM), EP4 agonist L-902,688 (1 pM-100 nM), FP antagonist AL8810 (50 nM–500 nM), IP antagonist CAY10441 (50 nM–500 nM), TP antagonist daltroban (50 nM–500 nM), forskolin (1 μM), phosphodiesterase inhibitor IBMX (300 μM), PKA inhibitor KT5720 (1 μM), EPAC inhibitor ESI-09 (10 μM), or relevant vehicles. Treatments were diluted in DMSO so equal concentrations of DMSO were present in each sample per experiment, never exceeding 0.2% of the final volume. No cytotoxicity or negative effects were observed under 0.2% DMSO. In experiments using receptor antagonists or IBMX, cells were pretreated with the relevant inhibitor for 3 h followed by PGE2 stimulation. Following treatment, resistance of monolayers at 4,000 Hz of stimulation was analyzed. Resistance measures of each well were normalized to the resistance of that well immediately prior to treatment (time 0).
2.4 Transwell dextran flux assays
Transwell assays were performed using polyester membrane transwell insert plates, 0.4 μm pore size, 12 mm diameter or 6.5 mm diameter (Corning). For hRMEC assays, the transwell inserts were coated with Attachment Factor prior to plating. For ARPE-19 assays, phenol-free DMEM/F-12 (Gibco) supplemented as described above was used. Cells were grown to confluence in the top chamber with fresh media in the bottom chamber. Where applicable, cells were pretreated for 3 h by replacing media in the top and bottom chambers with media containing the EP4 antagonist L-161,982 (1 μM) or DMSO vehicle. For treatment, media in the bottom chambers were replaced with media containing the relevant treatment of (10 nM–100 nM PGE2 or DMSO vehicle ± antagonist), and media in the top chamber were replaced with relevant treatment +1 mg/mL FITC-conjugated 70 kDa dextran (Sigma-Aldrich). Fluorescence in the bottom chamber was measured with 492 nm excitation and 518 nM emission with a plate reader after 24 h of incubation. Cell-free transwell inserts in these conditions yielded 3.22-fold higher fluorescence values compared with vehicle-treated cell-coated transwell inserts (data not shown). Data were normalized to vehicle-treated conditions and reported as fold change in fluorescence vs vehicle.
2.5 RNA sequencing
hRMEC and ARPE-19 cultures were treated with 100 nM PGE2 or vehicle for 6 h (n = 3). After treatment, cells were washed with cold PBS, lysed, and total RNA was extracted using the RNeasy Mini Kit (Qiagen) according to the manufacturer’s protocol. RNA samples were submitted to the Vanderbilt Technologies for Advanced Genomics (VANTAGE) core laboratory (Nashville, TN) for RNA sequencing (RNA-Seq). Total RNA was quantified using a BioTek Synergy Multimode Plate reader and BioTek Gen5 2.09 software before being processed for RNA sequencing. RNA quality was determined using the Agilent Bioanalyzer 2,100 Instrument. RNA-Seq libraries were prepared using 200 ng of total RNA and the NEBNext rRNA Depletion Kit (New England Biolabs) according to manufacturer’s instructions. This kit employs an RNaseH-based method to deplete both cytoplasmic (5S rRNA, 5.8S rRNA, 18S rRNA, and 28S rRNA) and mitochondrial ribosomal RNA (12S rRNA and 16S rRNA) from total RNA preparations. The mRNA was enriched via poly-A-selection using oligoDT beads (New England Biolabs) and then the RNA was thermally fragmented and converted to cDNA. The cDNA was adenylated for adaptor ligation and PCR amplified. The libraries were sequenced using the Illumina NovaSeq 6,000 with 150 bp paired end reads targeting 50 M reads per sample. Illumina Real Time Analysis NovaSeq Control Software (1.8.0) was used for base calling. Gene transcripts were considered significantly differentially expressed if they met the inclusion criteria of a ±2 fold change and an adjusted P-value < 0.05.
2.6 Western blots
hRMEC and ARPE-19 cells were grown to confluence in 6-well tissue culture-treated plates (Corning). Cells were treated with 100 nM PGE2 or vehicle for 6 h, washed with cold PBS, and lysed in RIPA buffer (Sigma) containing cOmplete Mini EDTA-free Protease Inhibitor Cocktail tablets (Roche). Lysates were centrifuged at 10,000 x g for 10 min, then supernatants were isolated for analysis. The total protein concentrations were determined using a Pierce BCA assay kit. Equal concentrations of protein were loaded and run on 4%–20% Mini-PROTEAN TGX polyacrylamide gels (Bio-Rad) then transferred using the iBlot two system (Invitrogen) and nitrocellulose transfer stacks (Invitrogen). Blots were incubated in Intercept TBS blocking buffer (LI-COR) for 1 h and subsequently stained with the primary antibodies rat anti-Frizzled-4 (1 μg/mL), rabbit anti-ZO-2 (1 μg/mL), rabbit anti-CLDND1 (0.25 μg/mL), mouse anti-occludin (1 μg/mL), rabbit anti-PAR-3 (0.5 μg/mL), or mouse anti-β-actin (1:2000), each diluted in blocking buffer with 0.2% Tween 20 (Sigma) as specified. Four washes in TBS with 0.1% Tween 20 were performed, then blots were stained with the secondary antibodies 800CW donkey anti-rabbit (1:10,000), 680LT donkey anti-mouse (1:10,000), or 680RD goat anti-rat (1:10,000). Images were captured using a LI-COR Odyssey CLx reader and quantified using Fiji/ImageJ. Protein levels were normalized to β-actin and reported as fold-change versus vehicle-treated samples.
2.7 cAMP ELISA
ARPE-19 cells were grown to confluence in 96-well flat-bottom tissue culture-treated plates (Corning). Cells were pretreated for 1 h with the EP2 antagonist PF-04418948 (100 nM-1 μM) and then stimulated with PGE2 (1 μM) for 15 min. Samples were lysed and cAMP was quantified using a cAMP competitive ELISA (Abcam) according to the kit’s instructions.
2.8 Statistical analyses
Data analyses were performed using GraphPad Prism 10 software. Data are represented as mean ± standard deviation (SD) shown as error bars. For ECIS assays, where applicable, area under the curve (AUC) was calculated for the average resistance of each treatment group over 12 h. One-way ANOVAs with Tukey’s post hoc multiple comparison tests were used to compare AUC results with relevant comparisons shown. Dose-response curves were fit for relevant experiments using a three-parameter nonlinear regression, and the relative IC50 or EC50 values were calculated from these curves. For transwell dextran flux assays, data were analyzed using unpaired T-tests (for two groups) or one-way ANOVAs with Tukey’s or Dunnett’s post hoc multiple comparison tests (for three groups, as specified). For the cAMP ELISA, one outlier was removed by a Grubbs’ outlier identification with an alpha of 0.01, then data were analyzed by one-way ANOVA with Tukey’s post hoc multiple comparison tests. The threshold for significance for all assays was P < 0.05.
3 Results
3.1 PGE2 decreases permeability of hRMEC monolayers modeling the inner blood-retina barrier
To evaluate the effects of prostanoid stimulation on inner blood-retina barrier function, the resistance of hRMEC monolayers was measured with ECIS assays. Cells were grown in ECIS plates to a steady-state resistance indicative of mature monolayers before prostanoid or vehicle stimulation. Previous work from our laboratory found that primary human Müller glia, which aid in damage responses and maintaining homeostasis of the retina, cultured in conditions modeling systemic diabetes elevate production of PGE2, whereas hRMEC increased production of PGF2α in these conditions (Stark and Penn, 2024b). Here, 100 nM PGF2α promoted a very modest increase in hRMEC monolayer ECIS resistance over 12 h, whereas 100 nM PGE2 rapidly increased hRMEC monolayer resistance and sustained this effect for the full assay period (Figure 1A; Supplementary Figure S1A). These effects were further characterized across a wide range of prostanoid concentrations. Area under the curve (AUC) measurements from the dose-response of hRMEC stimulated with PGE2 for 12 h indicates an EC50 of 491.2 pM for PGE2 (Figure 1B). In contrast, the dose-response curve for PGF2α was flat over the physiologic range, only showing a change in resistance with 3 μM or 10 μM, high concentrations that are unlikely to be specific to the FP receptor of PGF2α (Figure 1C). As further confirmation of the effects of PGE2, transwell dextran flux assays were performed. 100 nM PGE2 reduced FITC-conjugated 70 kDa dextran flux across hRMEC monolayers by 27.94% after 24 h, validating the barrier enhancement observed in ECIS experiments (Figure 1D).
FIGURE 1
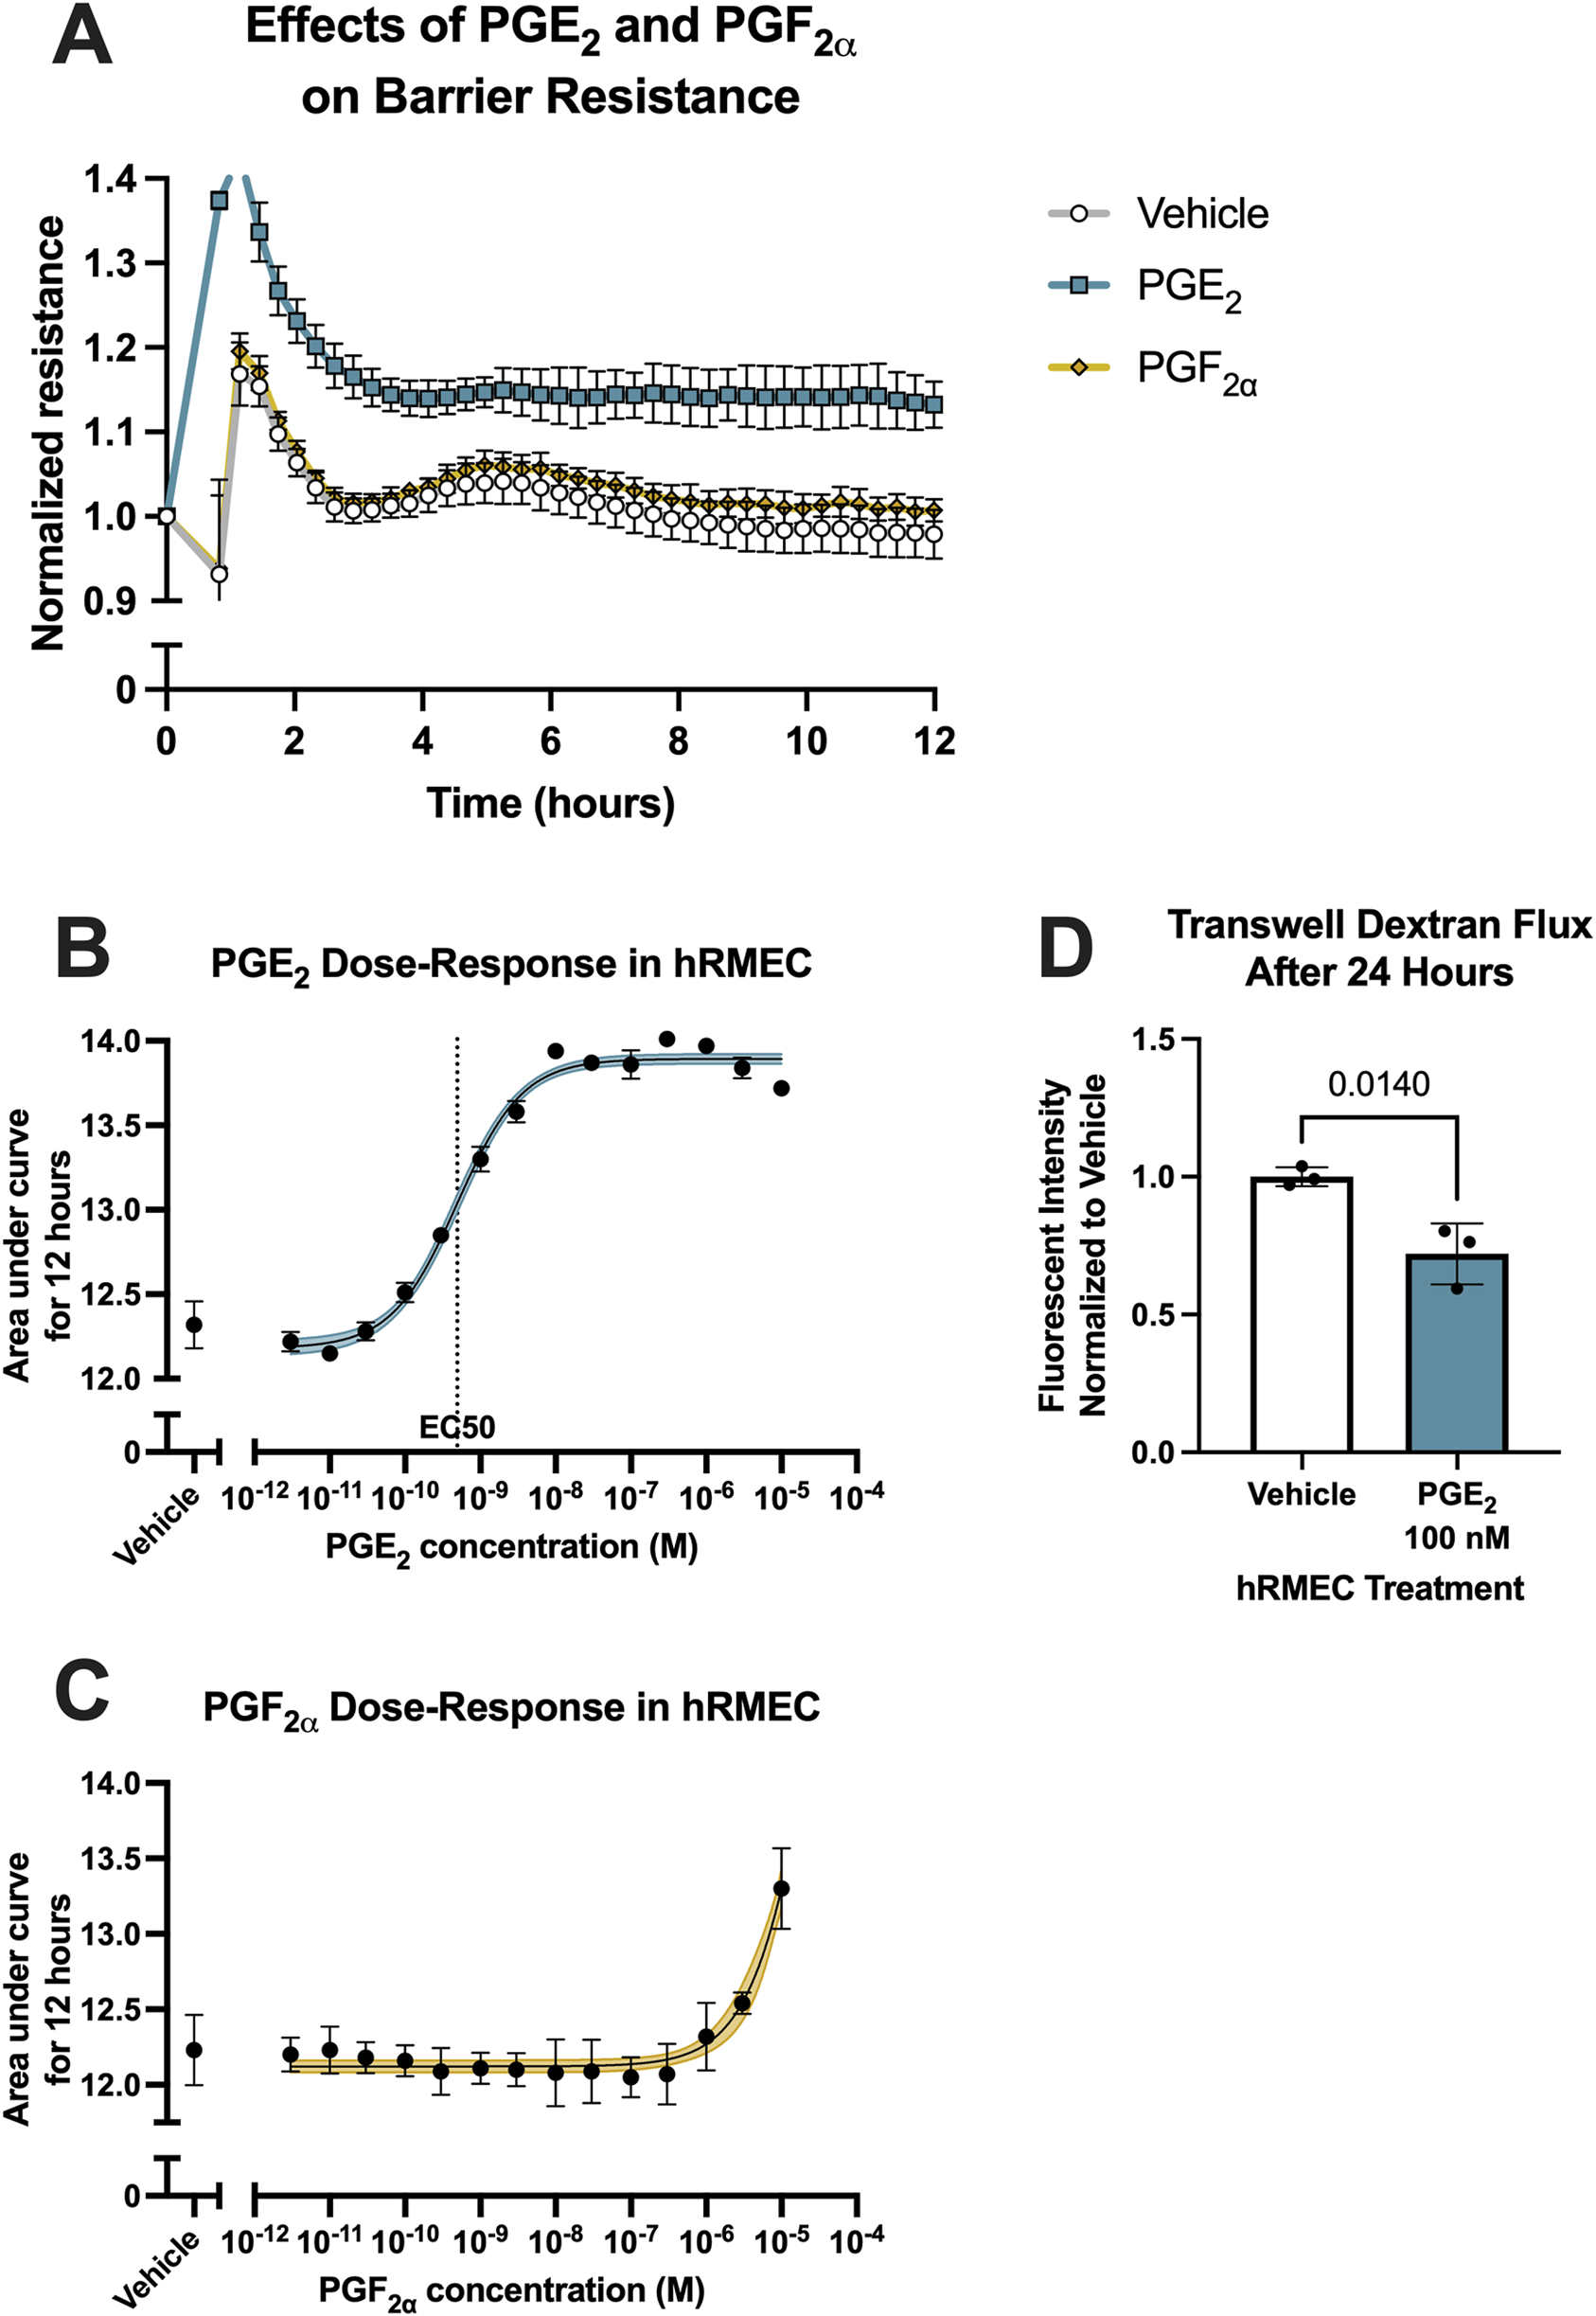
PGE2, but not PGF2α, strengthens hRMEC barrier function. (A) Normalized resistance ECIS results of hRMEC stimulated with 100 nM PGE2, 100 nM PGF2α, or vehicle over 12 h (n = 8–16, passage 8). (B) Dose-response curve of hRMEC stimulation with 3 pM–10 μM PGE2 or vehicle over 12 h (n = 6–12, passage 8). (C) Dose-response curve of hRMEC stimulation with 3 pM–10 μM PGF2α or vehicle over 12 h (n = 6-8, passage 8). (D) Transwell dextran flux across hRMEC stimulated with 100 nM PGE2 or vehicle after 24 h (n = 3, passage 8). All data represent mean ± SD shown by error bars. 1B-C were analyzed using three-parameter nonlinear regression models with the 95% confidence intervals shown. 1D was analyzed using an unpaired T-test with the P-value shown.
3.2 Inner blood-retina barrier enhancement is mediated by the EP4 receptor
PGE2 signals via four GPCRs with distinct downstream signaling. Antagonists selective for each receptor were employed to determine through which receptor(s) PGE2 promotes the enhancement of hRMEC barrier function. Antagonists tested were SC-51322 for EP1, PF-04418948 for EP2, DG-041 for EP3, and L-161,982 for EP4. hRMEC were pretreated with vehicle or an antagonist for 3 h followed by stimulation with 10 nM PGE2. The EP1 receptor antagonist SC-51322 at 500 nM had modest effects in inhibiting PGE2-induced elevation of ECIS resistance in hRMEC, but the EP4 receptor antagonist L-161,982 at 500 nM completely inhibited these effects of PGE2 on barrier function (Figures 2A–E). Lower concentrations of each antagonist were tested but not shown in 2A-D due to lesser or lack of efficacy. The EP4 antagonism was confirmed within a range of L-161,982 concentrations, and an IC50 of 229.6 nM was determined from the dose-response curve (Figure 2F). In complementary transwell dextran flux assays, pretreatment of 1 μM L-161,982 for 1 h fully inhibited the decrease in permeability observed by stimulation with 100 nM PGE2 (Figure 2G). Additionally, the EP4 agonist L-902,688 promoted barrier enhancement in ECIS with an EC50 of 613.5 pM, mimicking the full effects of PGE2 in hRMEC (Figure 2H).
FIGURE 2
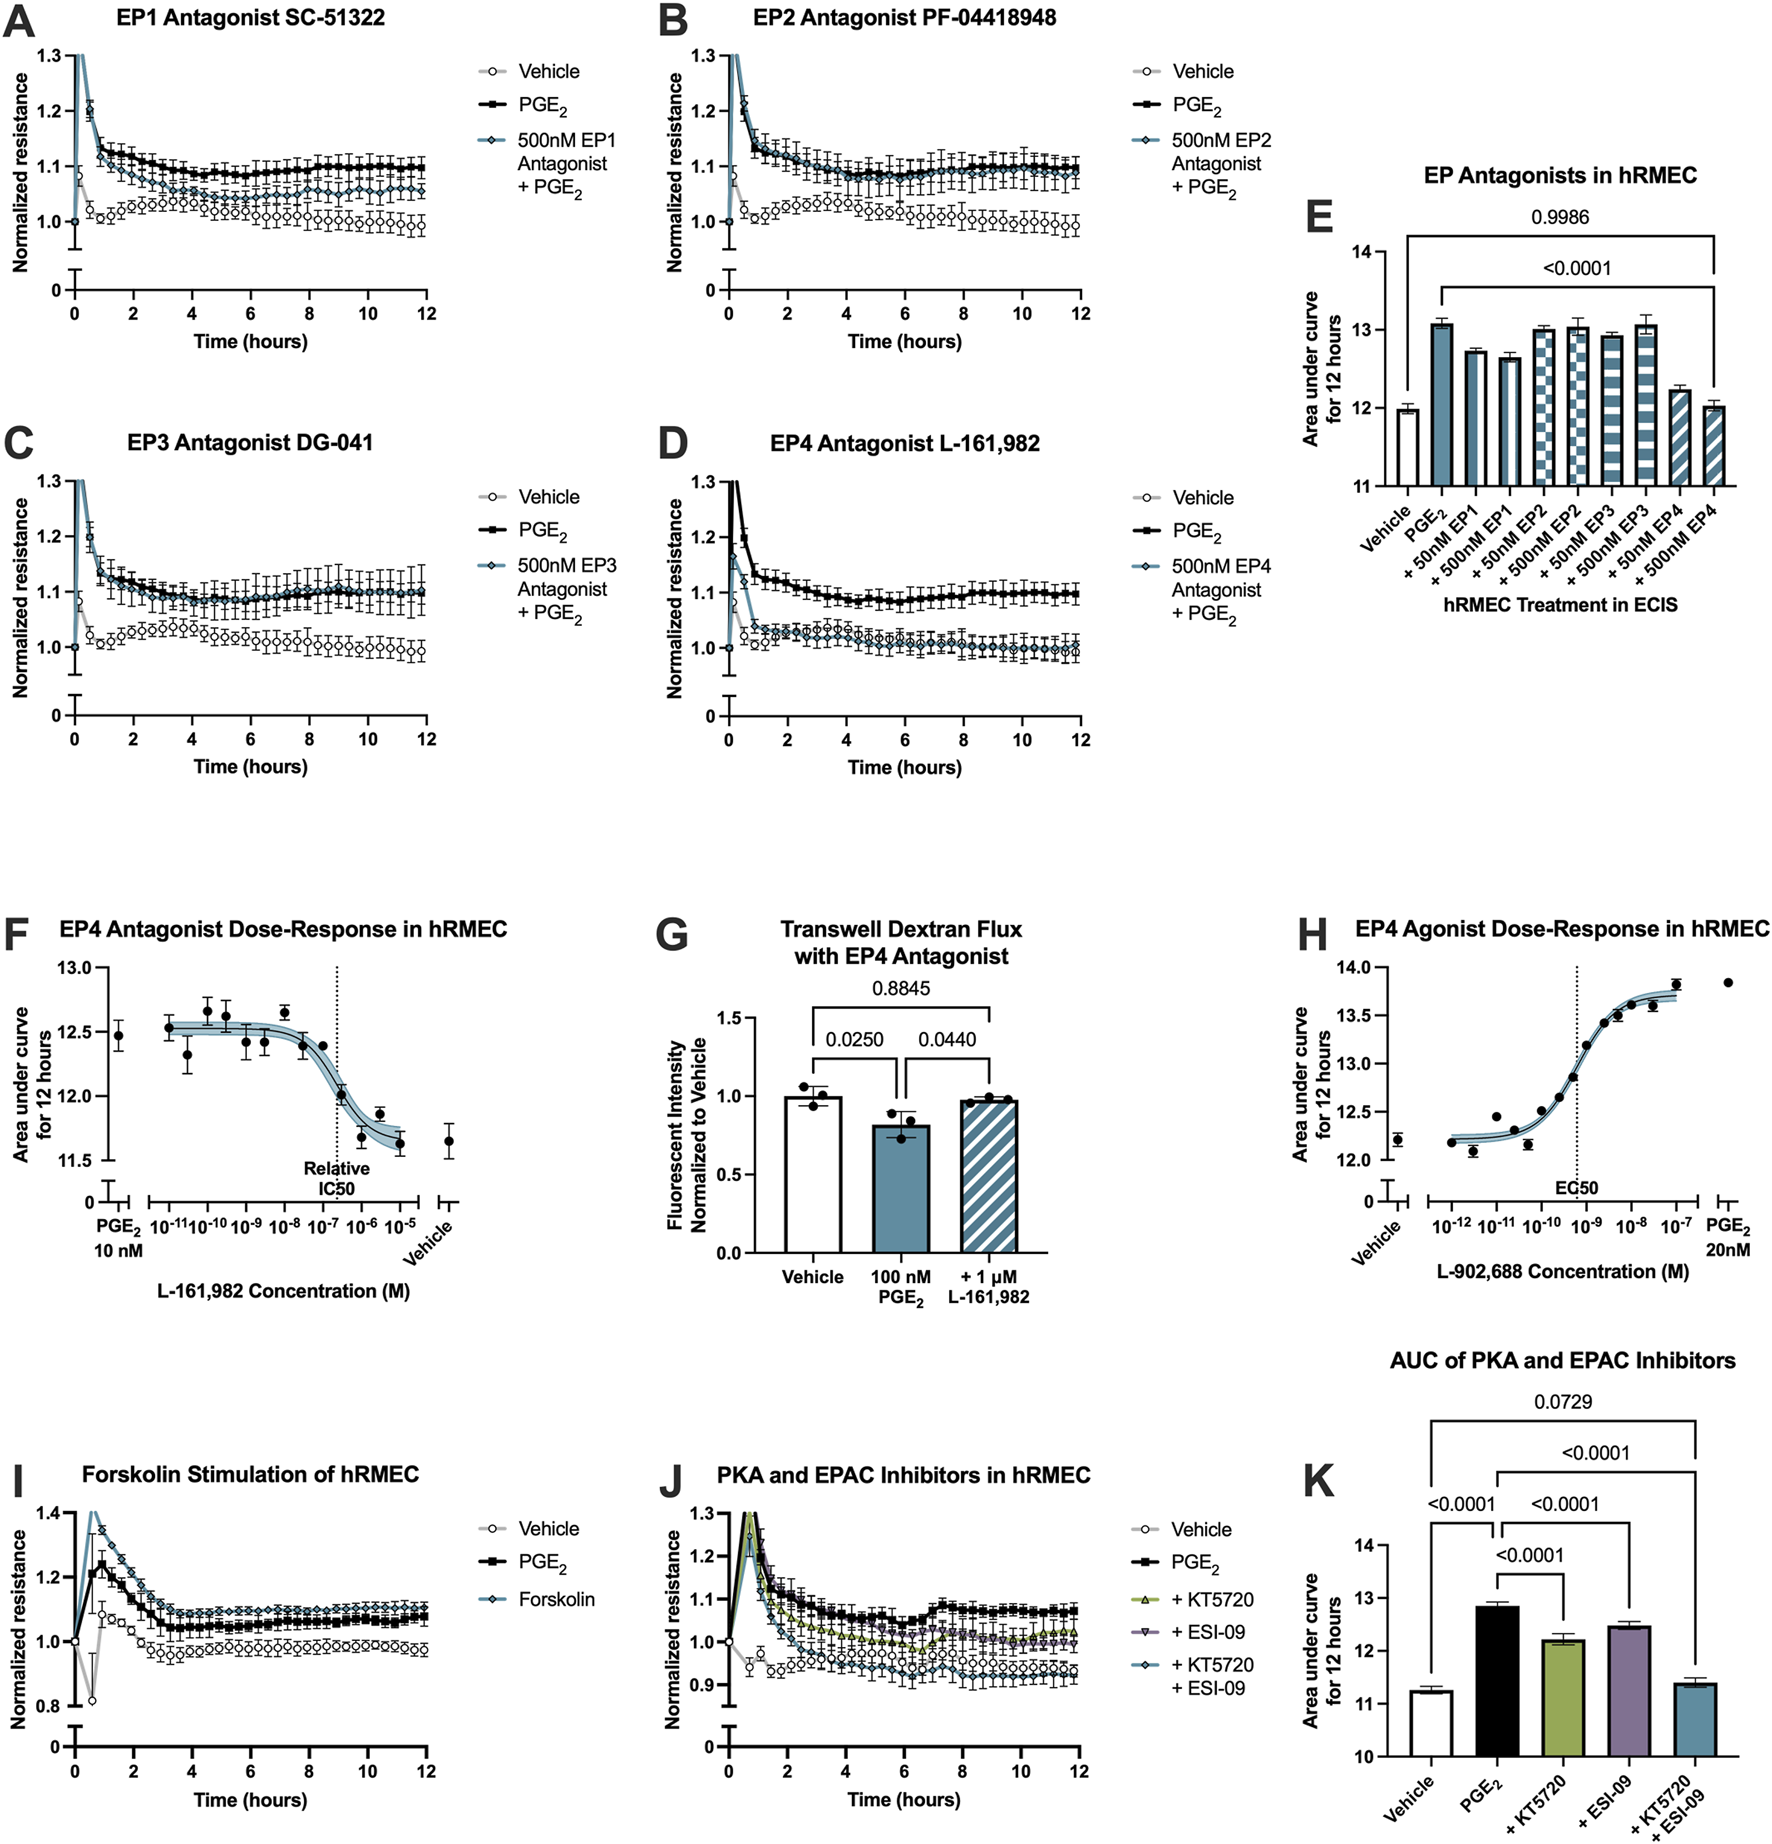
PGE2-induced barrier enhancement of hRMEC is mediated by the EP4 receptor. Normalized ECIS resistance measures from hRMEC pretreated with (A) 500 nM SC-51322, (B) 500 nM PF-04418948, (C) 500 nM DG-041, (D) 500 nM L-161,982, or vehicle for 3 h followed by stimulation with 10 nM PGE2 or vehicle over 12 h (n = 6-7, passage 8). Each antagonist is separated to an individual graph for clarity. (E) ECIS results expressed as AUC over 12 h from treatment of hRMEC with 50 nM–500 nM of EP antagonists +10 nM PGE2 or vehicle (n = 6-7, passage 8, comparisons to 500 nM EP4 antagonist shown). (F) Dose-response curve of hRMEC pretreated with 10 pM-10 μM L-161,982 or vehicle for 3 h followed by 10 nM PGE2 or vehicle stimulation over 12 h (n = 3-8, passage 8). (G) Transwell dextran flux across hRMEC pretreated with 1 μM L-161,982 or vehicle followed by 100 nM PGE2 or vehicle stimulation after 24 h (n = 3, passage 8). (H) Dose-response curve of hRMEC stimulation with 1 pM–100 nM L-902,688, 20 nM PGE2, or vehicle over 12 h (n = 4-6, passage 8). (I) Normalized resistance ECIS results of hRMEC stimulated with 1 μM forskolin, 10 nM PGE2, or vehicle over 12 h (n = 5-6, passage 8). (J) Normalized resistance ECIS results of hRMEC pretreated with 1 μM KT5720, 10 μM ESI-09, 1 μM KT5720 + 10 μM ESI-09, or vehicle for 3 h followed by 10 nM PGE2 or vehicle stimulation over 12 h (n = 5-6, passage 8). (K) ECIS results expressed as AUC over 12 h from treatment of hRMEC ± KT5720 and ESI-09 + 10 nM PGE2 or vehicle (n = 5-6, passage 8). All data represent mean ± SD shown by error bars. 2E, 2G, and 2K were analyzed using one-way ANOVAs and Tukey’s multiple comparisons tests with P-values shown for relevant comparisons. 2F and 2H were analyzed using three-parameter nonlinear regression models with the 95% confidence intervals shown.
Downstream signaling of the EP4 receptor, a Gαs-coupled receptor that promotes adenylyl cyclase (AC) activation and cAMP production, was examined by comparing the effects of PGE2 stimulation to the effects of the direct AC activator forskolin in an ECIS assay. 1 μM forskolin promoted a comparable elevation of barrier resistance to that caused by 10 nM PGE2 stimulation, suggesting that the PGE2-induced change in resistance is cAMP-dependent (Figure 2I; Supplementary Figure S1B). Finally, further signaling activation downstream of cAMP was evaluated using the protein kinase A (PKA) inhibitor KT5720 (1 μM), the EPAC inhibitor ESI-09 (10 μM), or both inhibitors in combination in ECIS assays. hRMEC were pretreated with inhibitor(s) or vehicle for 3 h followed by 10 nM PGE2 stimulation. Both the PKA and EPAC inhibitors partially yet significantly reduced PGE2-induced barrier resistance elevation. The combination of both inhibitors prevented this change in resistance to levels not significantly different from vehicle-treated wells by AUC measurement, indicating a full blockade of downstream signaling (Figures 2J,K). Therefore, EPAC and PKA are dual downstream effectors of PGE2-EP4-cAMP barrier enhancement in hRMEC.
3.3 PGE2 dysregulates junctional complexes in hRMEC
To explore the mechanism by which PGE2 strengthens hRMEC barrier function, we performed bulk RNA sequencing of hRMEC stimulated with 100 nM PGE2 or vehicle for 6 h. There were 616 differentially expressed gene transcripts that met the inclusion criteria of a fold change greater than two or less than −2 and an adjusted P-value less than 0.05. From these data, we identified 30 transcripts annotated with the Gene Ontology terms “tight junction” or “cell-cell junction” that were differentially expressed after PGE2 treatment (Figure 3). Transcripts specifically involved in tight junctions, as filtered with the Gene Ontology term “tight junction,” are shown in Table 1. Most relevant from this dataset is the 2.80-fold elevation of TJP2 (ZO-2), as well as the 70.62-fold elevation of FRZ4 (Frizzled-4). Upregulation of these known tight junction-related components as well as other genes could explain the alteration in hRMEC barrier resistance driven by PGE2. Western blots to validate these targets at the protein level showed a nonsignificant 39.6% increase in Frizzled-4 levels after PGE2 stimulation but no change in ZO-2 levels, indicating additional junctional complex proteins and molecular mechanisms could also be involved in these effects Supplementary Figure S2A,S2B).
FIGURE 3
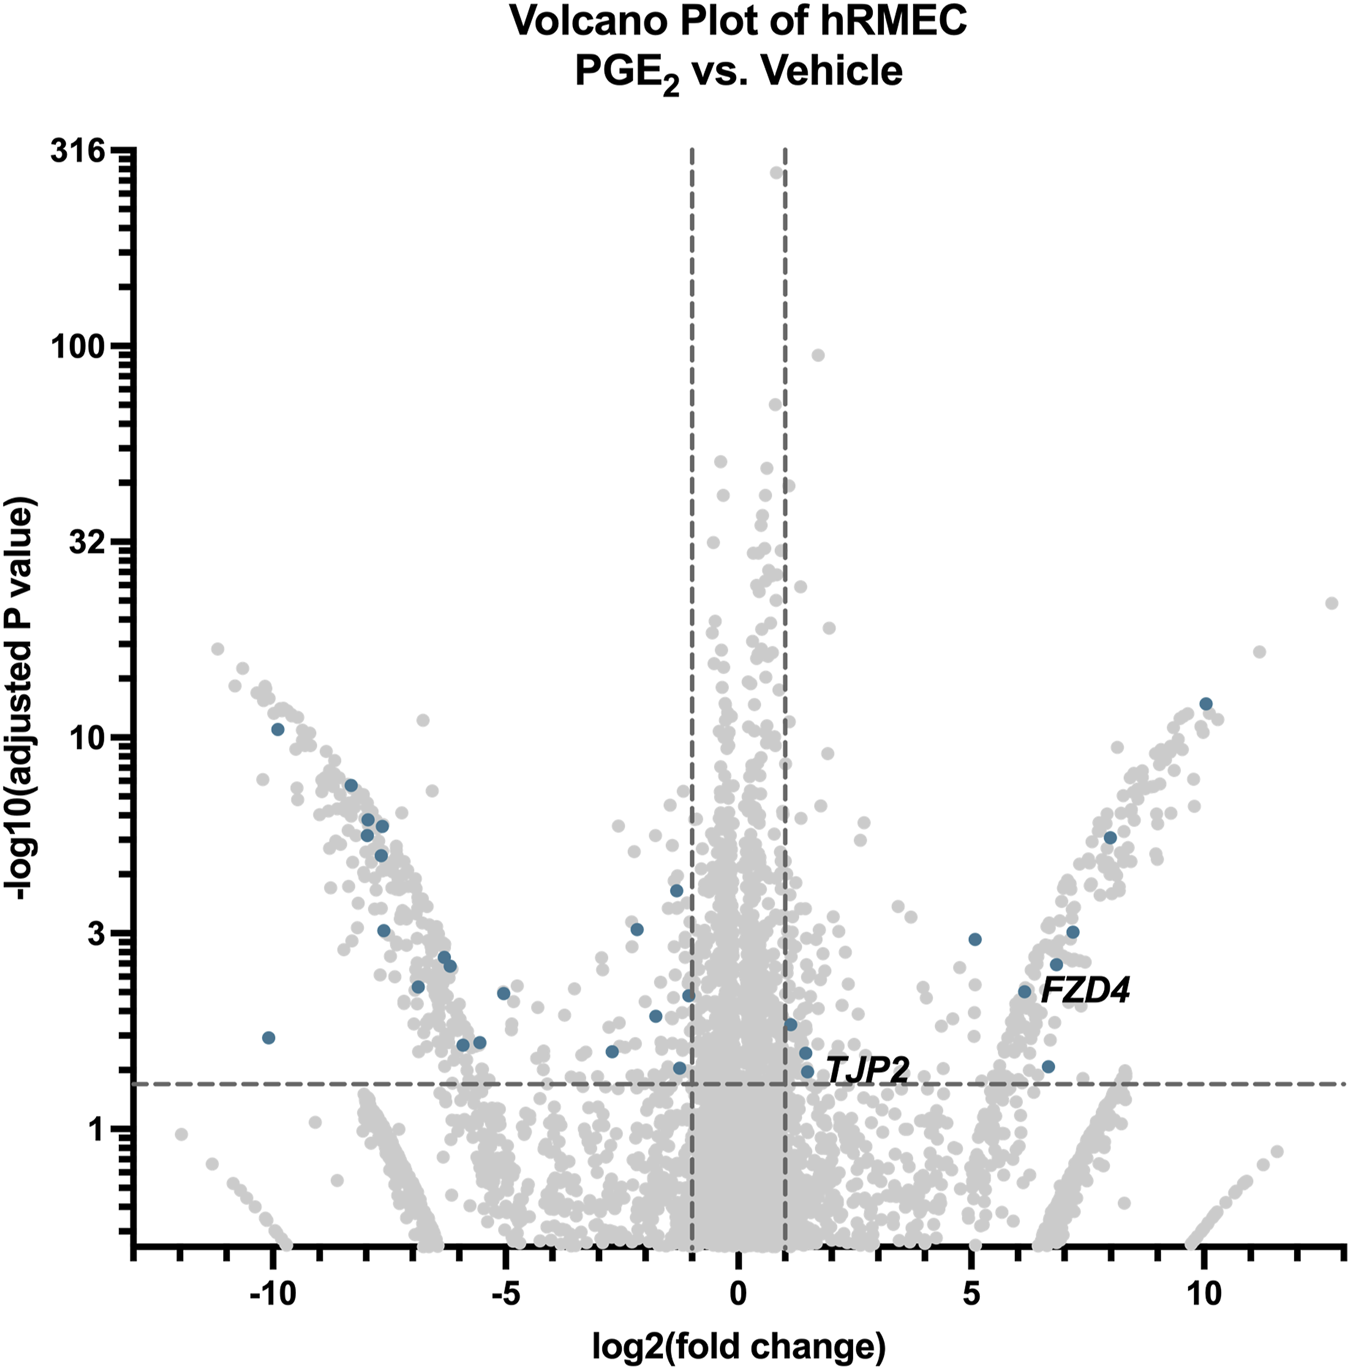
RNA-seq of hRMEC reveals differential gene expression after PGE2 stimulation. Volcano plot of differentially expressed genes and transcripts in hRMEC after 6-h stimulation with 100 nM PGE2 compared with vehicle controls. Blue dots represent differentially expressed transcripts involved in tight junctions and/or cell-cell junctions. Labels to the right of dots highlight hypothesized important gene expression changes. Transcripts upregulated or downregulated by 2-fold with an adjusted P-value < 0.05 were considered significantly differentially expressed.
TABLE 1
| Gene name | Transcript ID | log2FoldChange | Adjusted P-value |
|---|---|---|---|
| FZD4 | ENST00000531380.2 | 6.1424 | 0.00570 |
| TJP2 | ENST00000650460.1 | 1.4877 | 0.03971 |
| TBCD | ENST00000682921.1 | −1.7747 | 0.01149 |
| CDK4 | ENST00000552388.1 | −2.7092 | 0.02656 |
| C1QTNF5 | ENST00000528368.3 | −5.5547 | 0.02182 |
| CCND1 | ENST00000227507.3 | −6.1937 | 0.00249 |
| ECT2 | ENST00000441497.6 | −6.8792 | 0.00492 |
| SYNPO | ENST00000307662.5 | −7.9699 | 2.4E-06 |
Differentially expressed tight junction gene transcripts in PGE2-stimulated hRMEC.
3.4 PGE2 increases permeability of RPE monolayers modeling the outer blood-retina barrier
Because of the complex differences between the inner and outer blood-retina barriers, the effects of prostanoid signaling on outer blood-retina barrier function was also investigated using RPE cell culture models in ECIS assays. Primary human RPE cells (hRPE) were cultured in ECIS plates to a steady-state resistance characteristic of mature monolayers, then cells were stimulated with prostanoids or vehicle. Similar to hRMEC, hRPE resistance was largely unaffected by 100 nM PGF2α stimulation. However, 100 nM PGE2 had an opposite effect in hRPE to that observed in hRMEC: it promoted a transient decrease in ECIS resistance, indicating an increase in barrier permeability, that recovered to vehicle levels after 24 h (Figure 4A; Supplementary Figure S1C).
FIGURE 4
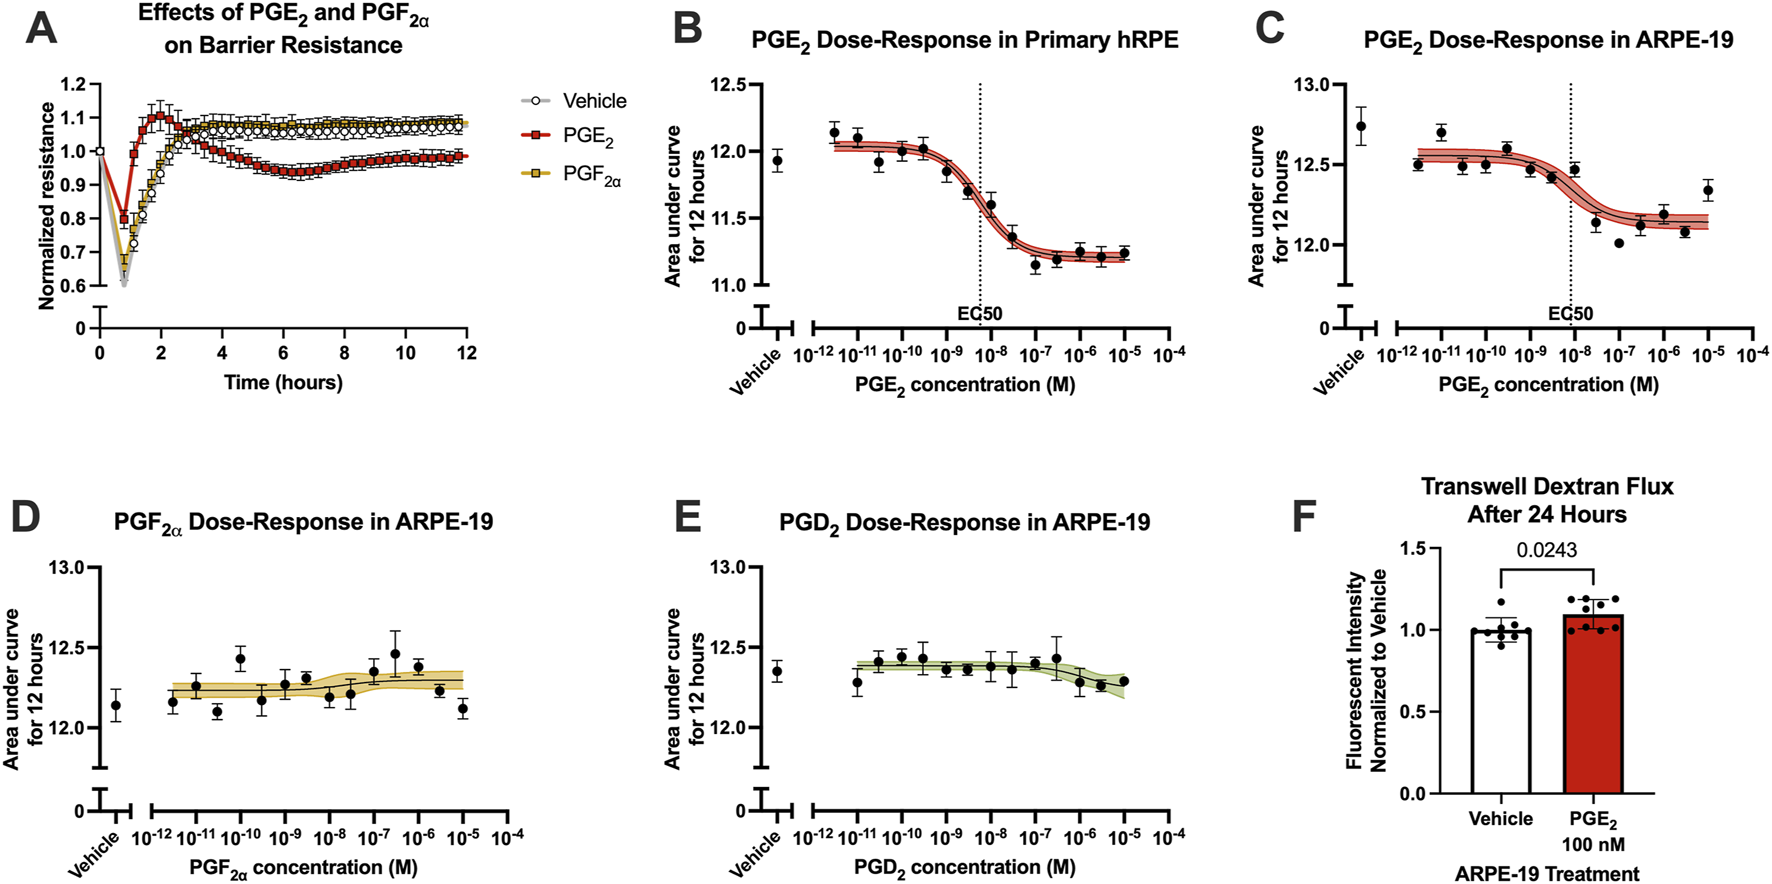
PGE2, but not PGF2α, induces RPE barrier permeability. (A) Normalized resistance ECIS results of hRPE stimulated with 100 nM PGE2, 100 nM PGF2α, or vehicle over 12 h (n = 6, passage 5). (B) Dose-response curve of hRPE stimulation with 3 pM–10 μM PGE2 or vehicle over 12 h (n = 6-9, passage 5). (C) Dose-response curve of ARPE-19 stimulation with 3 pM–10 μM PGE2 or vehicle over 12 h (n = 5–11, passage 24). (D) Dose-response curve of ARPE-19 stimulation with 3 pM–10 μM PGF2α or vehicle over 12 h (n = 6-9, passage 24). (E) Dose-response curve of ARPE-19 stimulation with 3 pM–10 μM PGD2 or vehicle over 12 h (n = 4-6, passage 24). (F) Transwell dextran flux across ARPE-19 stimulated with 100 nM PGE2 or vehicle after 24 h (n = 9, passage 24). All data represent mean ± SD shown by error bars. 4B-E were analyzed using three-parameter nonlinear regression models with the 95% confidence intervals shown. 4F was analyzed using an unpaired T-test with the P-value shown.
Stimulation of hRPE with a range of PGE2 concentrations yielded a complete dose-response curve with a calculated EC50 of 5.672 nM as measured using AUC of ECIS results over 12 h (Figure 4B). However, hRPE have significant limitations resulting from their responses to culture conditions, affecting barrier forming properties, altering cell morphology, and causing rapid epithelial-mesenchymal transition at low passages. Therefore, we continued these assays using the well-characterized immortalized human RPE cell line, ARPE-19 cells. The transcriptional and functional properties of ARPE-19 also differ from hRPE, notably including a higher proliferative capacity of ARPE-19 that could facilitate robust monolayer formation essential for ECIS assays (Alge et al., 2006). The parallel dose-response assay in ARPE-19 generated an EC50 of 8.135 nM for PGE2, indicating comparable effects on barrier function in the two RPE cell culture models despite a partially reduced threshold for change in resistance (Figure 4C). The resistance of ARPE-19 stimulated with PGE2 began to return to baseline over time whereas resistance of hRPE stimulated with PGE2 remained decreased for the duration of the experiments, likely due to the different proliferative capacities of these cell types. Stimulation with either PGF2α or PGD2 up to 10 μM showed no change on ARPE-19 barrier resistance, suggesting PGE2 selectivity of this permeability effect (Figures 4D,E). Furthermore, stimulation of ARPE-19 cells with 100 nM PGE2 in transwell dextran flux assays caused a 9.6% increase in permeability after 24 h, similar to the maximal induction of permeability in ECIS (Figure 4F).
3.5 Outer blood-retina barrier permeability is mediated by the EP2 receptor
The receptor(s) mediating the effects of PGE2 on ARPE-19 barrier permeability were probed using selective antagonists, as analyzed in hRMEC. Here, ARPE-19 were pretreated with vehicle or an antagonist for 3 h, then cells were stimulated with 100 nM PGE2. In these assays, only the EP2 receptor antagonist PF-04418948 at 500 nM inhibited PGE2-induced permeability (Figures 5A–E). Lower antagonist concentrations were tested but not shown in 5A-D due to lack of efficacy. As confirmation, PGE2-induced permeability in primary hRPE was also inhibited to a similar degree by PF-04418948 (Figure 5F; Supplementary Figure S1D). However, dose-response curves generated from a range of PF-04418948 concentrations in ARPE-19 revealed that the maximal effects of this antagonist partially prevented the effects of PGE2, up to 44.7% recovery with a relative IC50 of 36.7 nM (Figure 5G). These partial effects were also confirmed using a second EP2-selective antagonist, TG4-155 (Figure 5H; Supplementary Figure S1E). Stimulation with the EP2 selective agonist butaprost did model the compete effects of PGE2 to promote barrier permeability with an EC50 of 256.4 nM (Figure 5I). Therefore, while PGE2 may also signal via an unidentified receptor in RPE, EP2 is the primary receptor mediating the increase in resistance.
FIGURE 5
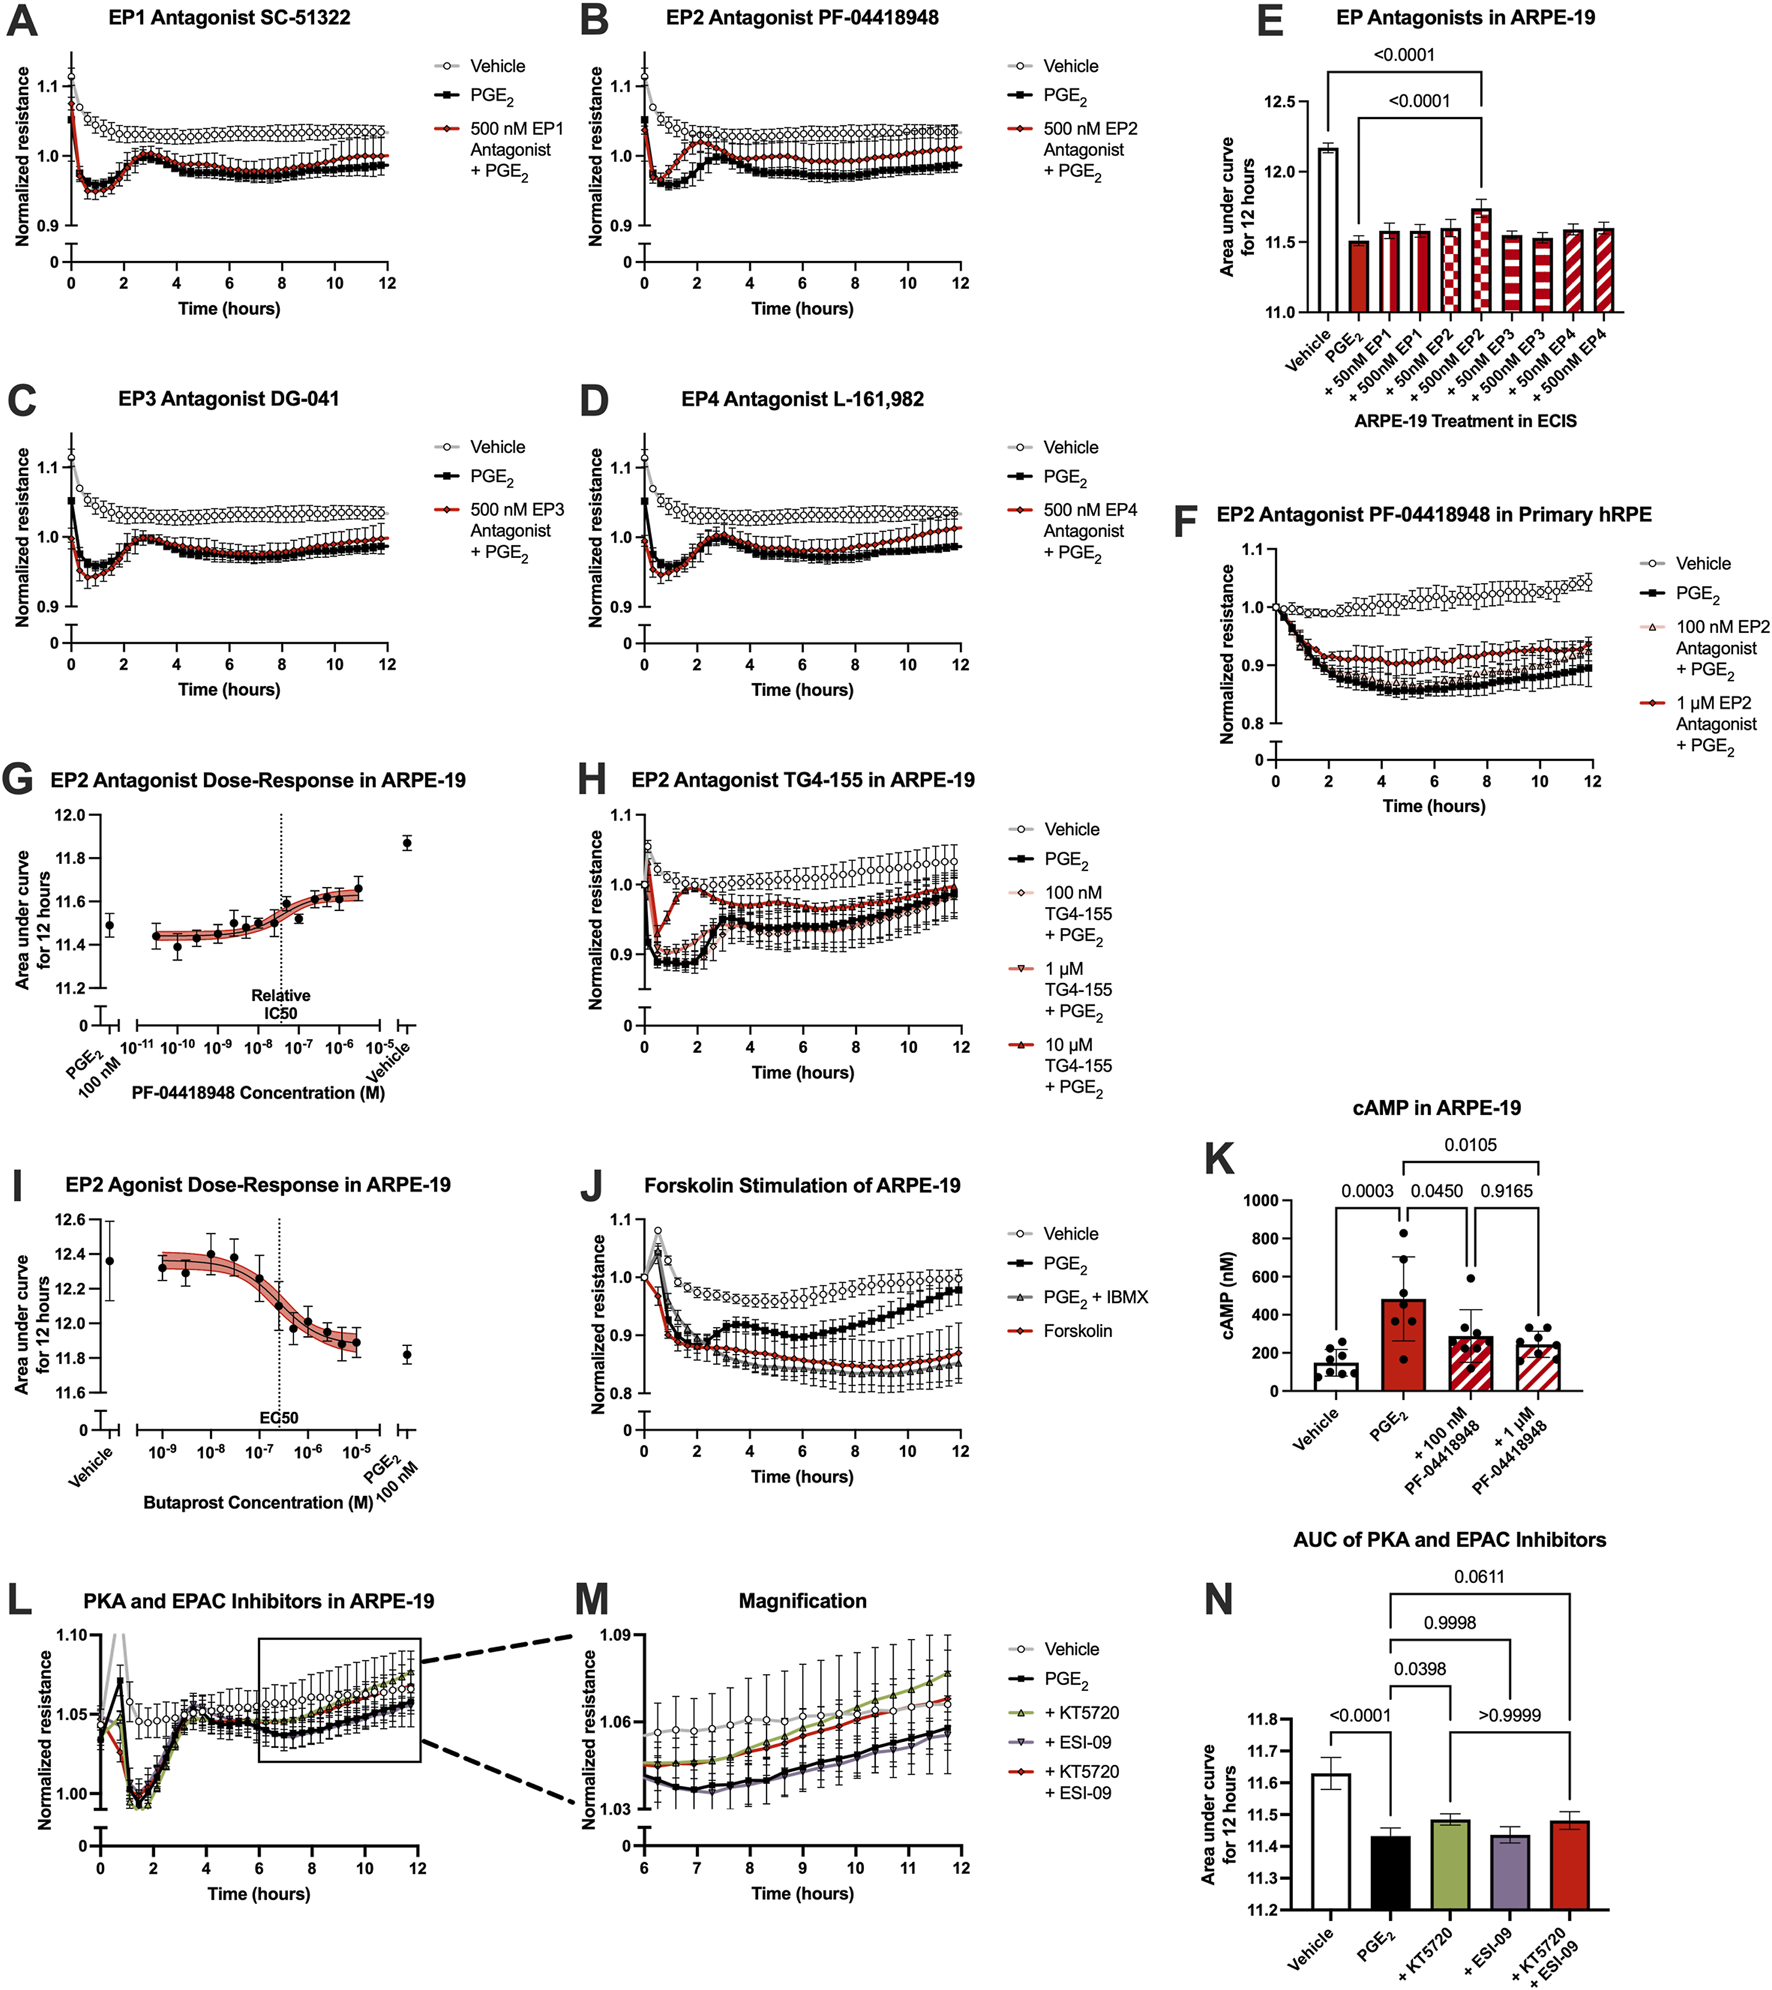
PGE2-induced barrier permeability of ARPE-19 is mediated in part by the EP2 receptor. Normalized resistance ECIS results of ARPE-19 pretreated with (A) 500 nM SC-51322, (B) 500 nM PF-04418948, (C) 500 nM DG-041, (D) 500 nM L-161,982, or vehicle for 3 h followed by stimulation with 100 nM PGE2 or vehicle over 12 h (n = 4-6, passage 25). Each antagonist is separated to an individual graph for clarity. (E) ECIS results expressed as AUC over 12 h from treatment of ARPE-19 with 50 nM–500 nM of EP antagonists +100 nM PGE2 or vehicle (n = 4-6, passage 25, comparisons to 500 nM EP2 antagonist shown). (F) Normalized resistance ECIS results of hRPE pretreated with 100 nM-1 μM PF-04418948 for 3 h followed by stimulation with 100 nM PGE2 or vehicle over 12 h (n = 4-6, passage 5). (G) Dose-response curve of ARPE-19 pretreated with 30 pM-3 μM PF-04418948 or vehicle for 3 h followed by 100 nM PGE2 or vehicle stimulation over 12 h (n = 3-6, passage 24). (H) Normalized resistance ECIS results of ARPE-19 pretreated with 100 nM-10 μM TG4-155 or vehicle for 3 h followed by stimulation with 100 nM PGE2 over 12 h (n = 5-8, passage 25). (I) Dose-response curve of ARPE-19 stimulation with 1 nM–10 μM butaprost, 100 nM PGE2, or vehicle over 12 h (n = 6–10, passage 24). (J) Normalized resistance ECIS results of hRMEC pretreated with 300 μM IBMX or vehicle for 3 h followed by stimulation with 1 μM forskolin, 100 nM PGE2, or vehicle over 12 h (n = 5-6, passage 24). (K) cAMP production in ARPE-19 pretreated with 100 nM-1 μM PF-04418948 for 1 h followed by stimulation with 1 μM PGE2 or vehicle for 15 min (n = 7-8, passage 24). (L) Normalized resistance ECIS results of ARPE-19 pretreated with 1 μM KT5720, 10 μM ESI-09, 1 μM KT5720 + 10 μM ESI-09, or vehicle for 3 h followed by 100 nM PGE2 or vehicle stimulation over 12 h (n = 6, passage 24). (M) Magnification of KT5720 ± ESI-09 ECIS results from 6 to 12 h. (N) ECIS results expressed as AUC over 12 h from treatment of hRMEC ± KT5720 and ESI-09 + 10 nM PGE2 or vehicle (n = 6, passage 24). All data represent mean ± SD shown by error bars. 5E, 5K, and 5N were analyzed using one-way ANOVAs and Tukey’s multiple comparisons tests with P-values shown for relevant comparisons. 5G and 5I were analyzed using three-parameter nonlinear regression models with the 95% confidence intervals shown.
As EP2, like EP4, is a Gαs-coupled receptor, the effects of PGE2 were also compared to forskolin stimulation to determine if these effects were mimicked by cAMP elevation. Indeed, 1 μM forskolin induced permeability to a similar extent as 100 nM PGE2 with a 3-h pretreatment of 300 μM IBMX, a phosphodiesterase inhibitor to prevent cAMP degradation, suggesting cAMP dependence in this cell behavior (Figure 5J; Supplementary Figure S1F). Furthermore, ELISAs for cAMP levels showed that 1 μM PGE2 increased cAMP production 226% over vehicle treatment, and PF-04418948 partially but significantly prevented PGE2-stimulated cAMP production to a similar degree as observed in previous experiments: 40.3% reduction for 100 nM and 49.3% reduction for 1 μM PF-04418948 versus PGE2 (Figure 5K). Lastly, signaling downstream of cAMP was also evaluated using PKA inhibitor KT5720, EPAC inhibitor ESI-09, or their combination in ECIS assays. In ARPE-19, only KT5720 inhibited the PGE2-induced decrease in resistance to a degree, restoring resistance to baseline by 12 h post-stimulation and showing a small yet significant effect by AUC measurement. ESI-09 had no effect in ARPE-19, and the combination of inhibitors was not different from KT5720 alone (Figures 5L–N). Together, these results indicate that PGE2 induces barrier permeability in RPE via EP2-cAMP-PKA signaling.
Because the permeability-inducing effects of PGE2 were only partially inhibited by EP2 receptor antagonists yet antagonists to EP1, EP3, and EP4 did not affect this signaling, off-target signaling of PGE2 via other prostanoid receptors was evaluated in ARPE-19 ECIS assays. Stable ARPE-19 monolayers were pretreated for 3 h with the antagonists BW A868C for the DP1 receptor, OC000459 for the DP2 receptor, AL8810 for the FP receptor, CAY10441 for the IP receptor, and daltroban for the TP receptor as well as relevant vehicles, followed by stimulation with 100 nM PGE2 or vehicle. None of these other prostanoid receptor antagonists up to 500 nM concentrations prevented PGE2-induced permeability (Figures 6A–F). Of note, 50 nM DP1, 50 nM FP, 500 nM FP, and 500 nM IP antagonists did cause small but statistically significant decreases in the AUC measures over 12 h compared with PGE2 alone (Figure 6F). This indicates minor exacerbation of PGE2-induced permeability. These may represent small but genuine physiological effects of these antagonists. Nevertheless, none of these antagonists inhibit the effects of PGE2 on ARPE-19 permeability, thus suggesting that PGE2 does not induce permeability by off-target signaling via another non-EP prostanoid receptor. Furthermore, treatment with antagonists alone (no PGE2 stimulation) did not elicit significantly different AUC values from vehicle-treated cells with the exception of 500 nM DP1, which again yielded only a very small induction of permeability (Figure 6G, individual traces not shown). We conclude that EP2 is the primary prostanoid receptor of action for PGE2-induced permeability in RPE because only antagonists to the EP2 receptor demonstrated a mitigating effect on PGE2-induced monolayer resistance.
FIGURE 6
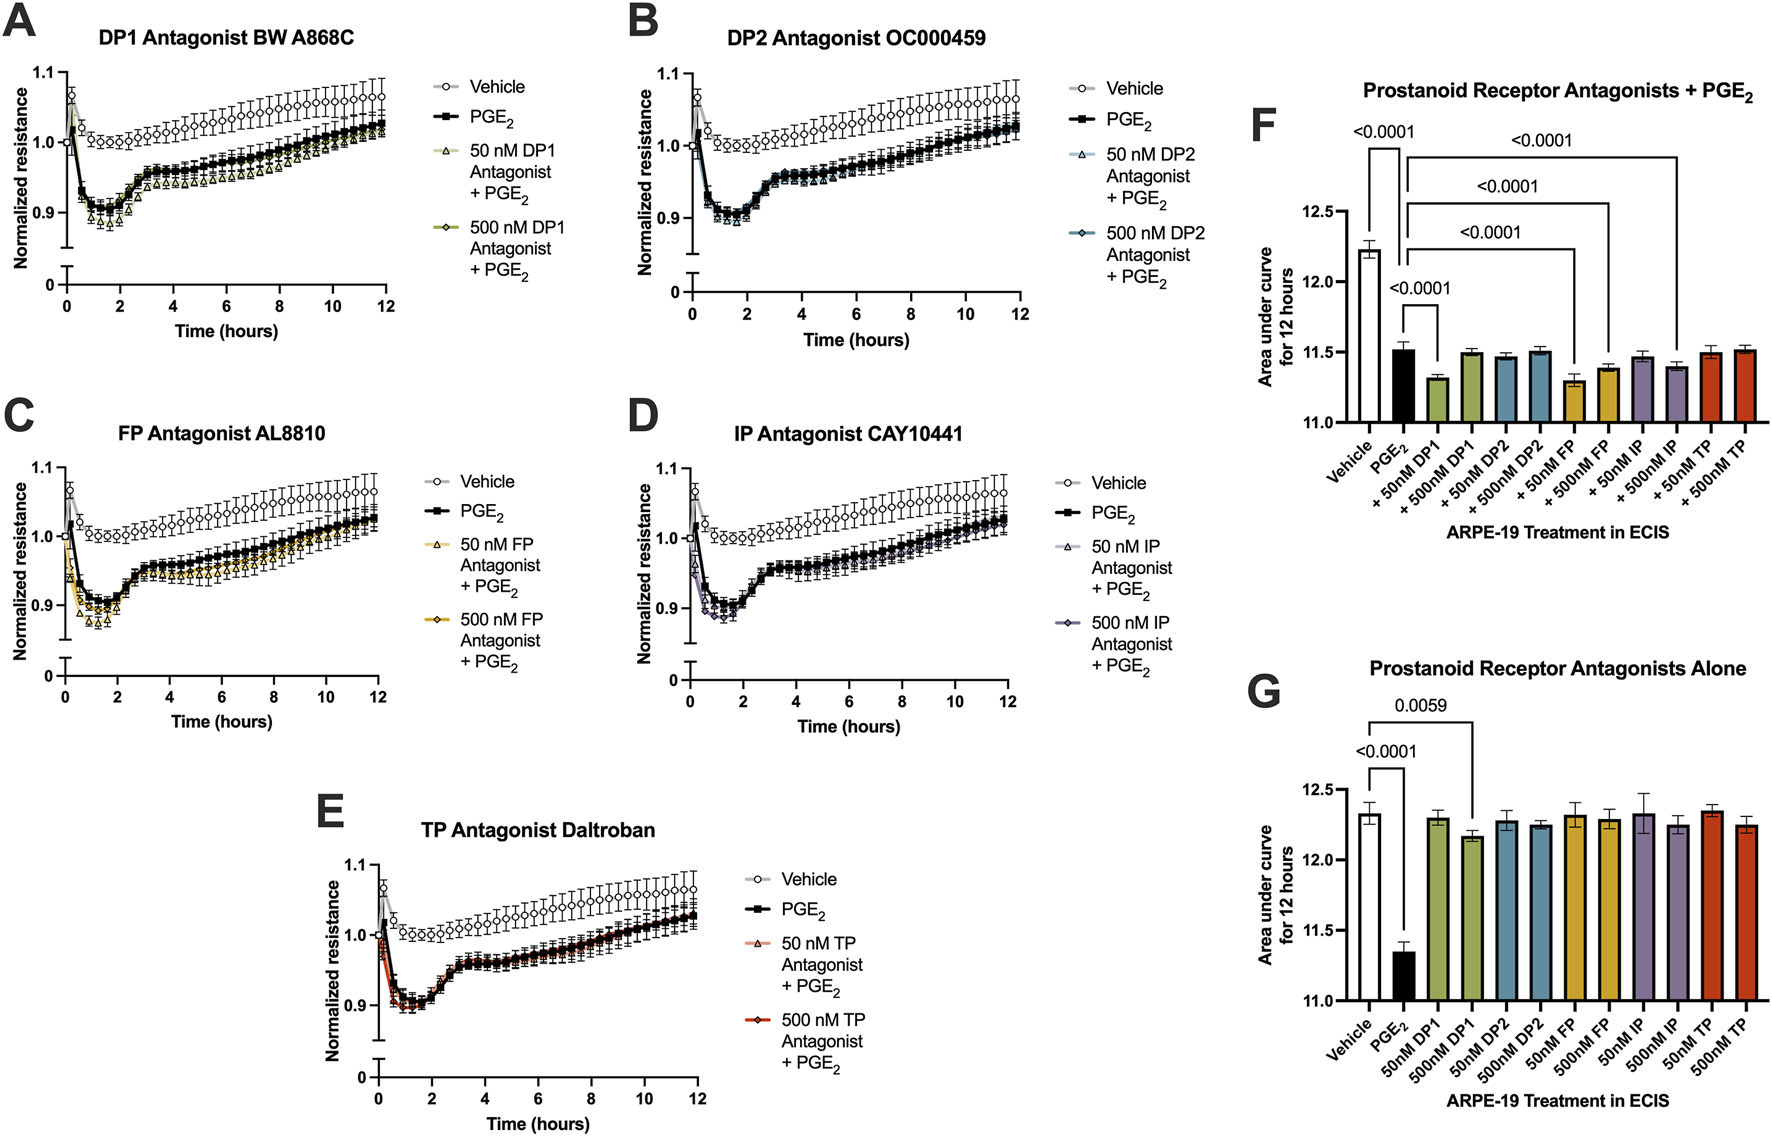
PGE2 does not signal off-target via a non-EP prostanoid receptor in ARPE-19. Normalized ECIS resistance measures from ARPE-19 pretreated with (A) 50–500 nM BW A868C, (B) 50–500 nM OC000459, (C) 50–500 nM AL8810, (D) 50–500 nM CAY10441, (E) 50–500 nM daltroban, or vehicle for 3 h followed by stimulation with 100 nM PGE2 or vehicle over 12 h (n = 4-6, passage 24). Each antagonist is separated to an individual graph for clarity. (F) ECIS results expressed as AUC over 12 h from treatment of ARPE-19 with 50 nM–500 nM of EP antagonists +100 nM PGE2 or vehicle (n = 4-6, passage 24). (G) ECIS results expressed as AUC over 12 h from treatment of ARPE-19 with 100 nM PGE2, vehicle, or 50 nM–500 nM of EP antagonists alone (n = 5-6, passage 24). All data represent mean ± SD shown by error bars. 6F was analyzed using a one-way ANOVA with Dunnett’s multiple comparisons test to compare all groups to 100 nM PGE2 treatment, significant P-values shown. 6G was analyzed using a one-way ANOVA with Dunnett’s multiple comparisons test to compare all groups to vehicle treatment, significant P-values shown.
3.6 PGE2 dysregulates junctional complexes in ARPE-19
Finally, we conducted bulk RNA sequencing of ARPE-19 samples stimulated with 100 nM PGE2 or vehicle for 6 h to study mechanisms of PGE2-induced barrier permeability in these cells. Here, 1,354 differentially regulated genes and transcripts met the aforementioned inclusion criteria, and 48 of these transcripts were annotated with the Gene Ontology “tight junction” or “cell-cell junction” terms (Figure 7). The 15 transcripts representing nine unique genes filtered with the “tight junction” Gene Ontology term are shown in Table 2. Out of these differentially expressed genes, the 257.9-fold upregulation of OCLN (occludin), 8.19-fold upregulation of PARD3 (PAR-3), and 5.39-fold downregulation of CLDND1 (claudin domain-containing protein 1) may well cause the defects in ARPE-19 barrier function observed after PGE2 stimulation. Western blots of ARPE-19 validated significant occludin upregulation and CLDND1 downregulation after PGE2 stimulation, yet PAR-3 protein levels were unchanged (Supplementary Figures S2C,S2D). Therefore, additional molecular mechanisms are also likely involved in this blood-retina barrier regulation.
FIGURE 7
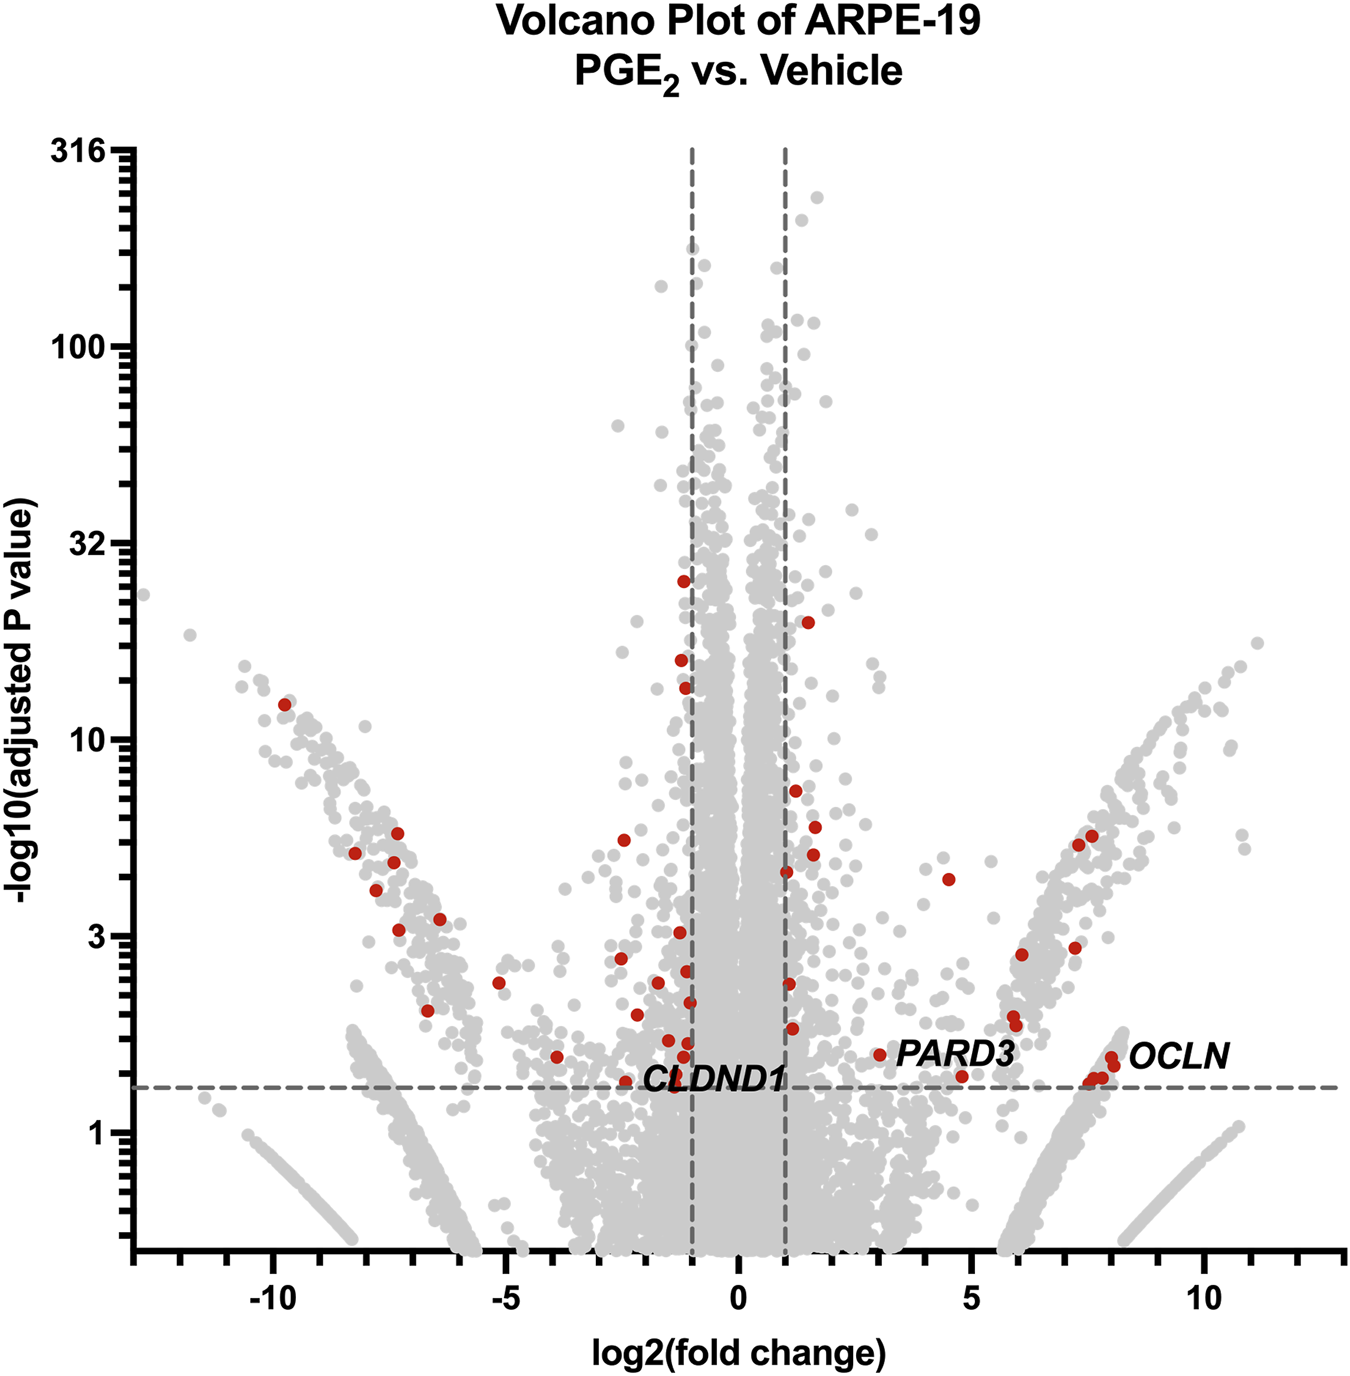
RNA-seq of ARPE-19 reveals differential gene expression after PGE2 stimulation. Volcano plot of differentially expressed genes and transcripts in ARPE-19 after 6-h stimulation with 100 nM PGE2 compared with vehicle controls. Red dots represent differentially expressed transcripts involved in tight junctions and/or cell-cell junctions. Labels to the right of dots highlight hypothesized important gene expression changes. Transcripts upregulated or downregulated by 2-fold with an adjusted P-value < 0.05 were considered significantly differentially expressed.
TABLE 2
| Gene name | Transcript ID | log2FoldChange | Adjusted P-value |
|---|---|---|---|
| ASH1L | ENST00000368346.7 | 8.0636 | 0.0332 |
| OCLN | ENST00000514370.5 | 8.0106 | 0.0279 |
| DLG1* | ENST00000667104.1 | 7.6326 | 0.0422 |
| UBN1 | ENST00000585857.1 | 6.0854 | 0.0015 |
| DLG1* | ENST00000419227.5 | 5.8992 | 0.0106 |
| RPGRIP1L | ENST00000262135.9 | 4.5196 | 3.88E-05 |
| PARD3 | ENST00000696673.1 | 3.0345 | 0.0264 |
| DLG1* | ENST00000448528.6 | −1.2308 | 1.19E-16 |
| DLG1* | ENST00000419354.5 | −1.2642 | 0.0006 |
| DLG1* | ENST00000664564.1 | −1.3700 | 0.0474 |
| DLG1* | ENST00000661013.1 | −1.3784 | 0.0492 |
| ARHGEF2 | ENST00000462460.6 | −1.5016 | 0.0192 |
| DLG1* | ENST00000665728.1 | −1.7221 | 0.0039 |
| CLDND1 | ENST00000506927.1 | −2.4310 | 0.0450 |
| PMP22 | ENST00000395938.7 | −9.7495 | 5.52E-13 |
Differentially expressed tight junction gene transcripts in PGE2-stimulated ARPE-19.
* denotes gene with multiple differentially expressed transcripts.
4 Discussion
In this study, we analyzed the effects of prostanoid stimulation of cells that regulate retinal barrier function as a potential component of DME disease onset and progression. DME progression is most widely studied from the perspective of inner blood-retina barrier leakage, yet the outer blood-retina barrier function could also play an important role in this condition. One study analyzing FITC-dextran leakage from both the inner and outer blood-retina barriers in streptozotocin (STZ)-induced diabetic mice showed a relative ratio of leakage of 1:2.48 from the outer versus inner barriers, showing that a significant portion of dextran leakage occurred via the outer blood-retina barrier (Xu and Le, 2011). This high degree of vascular leakage attributable to each barrier warranted further study of these barriers together in the context of DR and DME.
Previous work from our laboratory indicated that two prostanoids, PGE2 and PGF2α, are produced significantly and consistently by primary human Müller glia and retinal microvascular endothelial cells, respectively, when cultured in conditions modeling the chronic hyperglycemia, dyslipidemia, and inflammation prevalent systemically in diabetes (Stark and Penn, 2024b). This informed our selection of stimuli for investigation relevant to retinal barrier function here.
PGF2α has pronounced roles in the anterior chamber of the eye, yet its role in DME is less characterized. The PGF2α analogs latanoprost, bimatoprost, travoprost, and tafluprost, formulated as topical eyedrops used once daily, serve as the standard-of-care therapy for glaucoma (Aihara, 2021). These drugs act by increasing uveoscleral outflow of aqueous humor from the anterior segment of the eye to decrease intraocular pressure (Toris et al., 1993). Despite recognition of its roles in glaucoma, PGF2α in DR pathologies is less studied and understood. Our previous work showed that PGF2α-FP signaling can stimulate proinflammatory cytokine production in Müller glia as well as leukocyte adhesion to hRMEC monolayers, each important pathologies in early DR (Stark and Penn, 2024b). Additionally, PGF2α signaling has well recognized roles in pericyte death, another critical event occurring early in DR. Bovine retinal pericytes cultured in conditions of elevated glucose showed impaired adhesion to culture matrices and migration through transwell chambers, and stimulation with PGF2α restored both functions via FP receptor/RhoA signaling (Peng et al., 2018). Further, intraperitoneal latanoprost injection prevented STZ-induced capillary regression in the superficial—but not deep—capillary plexus of the mouse retina, indicating functional consequences of FP-mediated pericyte survival (Peng et al., 2018). These investigators subsequently found that human retinal pericytes demonstrated elevated apoptosis when cultured in elevated glucose conditions, and PGF2α also prevented glucose-induced cell death via the FP receptor’s activation of the PI3K/Akt/GSK3β/β-catenin pathway (Cheng et al., 2021). These other effects relevant to early-stage DR notwithstanding, there are no prior reports of involvement of PGF2α signaling in either inner or outer blood-retina barrier function in vitro. This suggests that effects of prostanoid signaling in the retina are cell type-specific and behavior-specific.
In contrast, many effects of PGE2 in cell behaviors of DR have been characterized. Relevant to NPDR, PGE2 stimulated in vivo vascular leakage, retinal thickening, endothelial cell apoptosis, capillary dropout, and leukocyte adhesion in STZ rats (Wang et al., 2019). The EP2 agonist butaprost mimicked these effects, and AH6809 inhibited them (Wang et al., 2019); however, AH6809 is a prostaglandin antagonist with comparable affinity to the EP1, EP2, EP3, and DP1 receptors (Abramovitz et al., 2000), and the specificity of its effects to one receptor were not evaluated in that study. In our previous work, we showed that PGE2-EP2 signaling promoted proinflammatory cytokine production in primary human Müller glia but not leukocyte adhesion to hRMEC (Stark and Penn, 2024b). PGE2 also has noted proangiogenic roles relevant to PDR via both EP3 (Sennlaub et al., 2003; Chen et al., 2017) and EP4 (Yanni et al., 2009; Xie et al., 2021) receptor signaling. Furthermore, PGE2 levels in vitreous samples from patients with PDR were 53% higher than the levels from nondiabetic patient vitreous samples (Schoenberger et al., 2012). In this study using well-characterized antagonists, each with selectivity for a single EP receptor, we determined that PGE2 strengthens barrier function in hRMEC via the EP4 receptor and decreases barrier function in ARPE-19 via the EP2 receptor, results that are partially aligned with these previous studies.
The effects of PGE2 on barrier function have been documented in other systems with similarly distinct effects in endothelial or epithelial cell types. Directly compared with our findings in hRMEC, lung microvascular endothelial cells have similarly strengthened barrier function via PGE2-EP4 signaling in ECIS and other transendothelial resistance assays (Birukova et al., 2007; Konya et al., 2013; Bärnthaler et al., 2017). Still, not all endothelial cell types respond in this manner. PGE2 caused an increase in dextran flux across human brain microvessel endothelial cell monolayers in transwell chambers, an effect that was attenuated by either EP3 or EP4 antagonists (Dalvi et al., 2015). In modeling the colon epithelium with T84 human colonic cells, PGE2 stimulated a decrease in transepithelial resistance via the EP4 receptor, a similar effect to our RPE results albeit via a different Gαs-coupled EP receptor (Lejeune et al., 2010). Further, signaling of PGE2 through both EP1 and EP4 promoted barrier dysfunction in Caco-2 cells, which also model the colon epithelium (Martín-Venegas et al., 2006; Rodríguez-Lagunas et al., 2010). Nonetheless, research comparing the RPE barrier to other epithelial barriers of the body, such as the colon epithelium, is limited.
Our findings support a role of EP4 in mediating the full barrier-enhancing effects of PGE2 in hRMEC, yet EP2 antagonists only partially prevented PGE2-induced permeability in ARPE-19. No other EP receptor antagonists affected monolayer resistance when tested at concentrations up to 500 nM. Additionally, neither PGD2 nor PGF2α affected RPE barrier resistance in physiological ranges, and antagonists to DP1, DP2, FP, IP, and TP receptors did not inhibit PGE2-induced permeability. While certain concentrations of some of these antagonists caused a small but significant exacerbation of permeability, these effects show no blockade of PGE2-induced permeability. These statistically significant effects of 50 nM DP1, 50 nM FP, 500 nM FP, or 500 nM IP receptor antagonists could be attributable to two primary reasons. First, they may be due to the structural similarities among prostanoids and their receptor binding affinities, activating signaling that promotes permeability similarly to PGE2 (Narumiya et al., 1999). Second, the antagonists may inhibit the endogenous PGD2, PGF2α, or PGI2 signaling in these cultures that otherwise maintain normal barrier function, thereby exacerbating the effects of PGE2 to a degree. Previous studies have shown that DP1 activation reduces permeability of mouse vascular endothelium in Evans blue measurements and of bovine aortic endothelial cells in FITC-dextran flux assays (Murata et al., 2008), and IP activation decreases permeability of intestine epithelium biopsies from patients with inflammatory bowel diseases (Pochard et al., 2021). Additionally, while AL8810 is commonly used as an antagonist to block FP receptor signaling and is the best available compound for this purpose, AL8810 is, in fact, a very weak partial agonist of the FP receptor with maximal activating efficacy of 19%–23% (Griffin et al., 1999). AL8810 has been shown to promote EGFR transactivation and MAPK/ERK1/2 signaling via biased mechanisms distinct from those of PGF2α, which may also explain the permeability effects we observed (Goupil et al., 2012). To understand the additional effect of PGE2 that is not mitigated by EP2 antagonism, we must consider additional non-prostanoid receptors. To date, PGE2 has not been described to bind to any non-prostanoid receptors; however, other prostanoid ligands bind non-prostanoid receptors under some conditions. One possibility is that PGE2 may act as a PPARγ agonist. Other studies show that the EP4 agonist L-902,688 (Li, 2018), PGI2 analogs (Falcetti et al., 2007), PGD2 (Yu et al., 1995), and the PGD2 metabolite 15d-PGJ2 (Yu et al., 1995; Kliewer et al., 1995) all activate PPARγ; however, we do not believe that identifying novel signaling mechanisms of PGE2 falls within the scope of this work. Overall, although EP2 antagonists did not fully block this response, we hypothesize that EP2 is the primary prostanoid receptor mediating this signaling in RPE.
Although the opposite effects of PGE2 on hRMEC and RPE barrier function occur via different receptors, downstream signaling pathways of both EP2 and EP4 promote elevation of cAMP levels. These opposing cell behaviors in response to elevated cAMP levels have been observed previously. Enhancement of multiple types of microvascular endothelial barriers by cAMP signaling is well-characterized (Adamso et al., 1998; He et al., 2000). Adenylyl cyclase activation at the plasma membrane, elevating the membrane-localized cAMP concentration, drives this endothelial barrier strengthening (Sayner et al., 2006). Specific to retinal microvascular endothelial cells, several studies have shown that barrier function is preserved and/or restored by cAMP activation of both PKA and EPAC-Rap1 pathways independently, similar to our findings (Birukova et al., 2007; van der Wijk et al., 2017; Ramos et al., 2018; Liu et al., 2019; Steinle, 2020; Birukova et al., 2008; Lorenowicz et al., 2008). The barrier-altering effects of cAMP in RPE are less characterized, but published results are consistent with its ability to decrease permeability in cell culture and animal models (Pavan et al., 2014; Wittchen and Hartnett, 2011; Wittchen et al., 2013). Other studies showed cAMP-mediated permeability in RPE occurs via EPAC-Rap1 signaling (Wittchen and Hartnett, 2011; Wittchen et al., 2013), but we found that only PKA, not EPAC, mediated these effects in ARPE-19 after PGE2 stimulation. While specific mechanisms remain to be characterized in full, we hypothesize that cell type-specific and prostanoid-stimulated differences in expression levels of adenylyl cyclases, phosphotidesterases, or A-kinase anchoring proteins (AKAPs) could each affect the local cAMP levels. This would promote distinct gradients of cAMP that in turn differentially activate PKA and/or EPAC, altering the cellular responses as we observed herein.
Using RNA sequencing of hRMEC and ARPE-19 stimulated in the presence or absence of PGE2, we identified widespread up- and downregulation of genes involved in cell-cell junctions, particularly tight junctions, to identify gene products that might promote changes in barrier resistance in each cell type. 100 nM concentrations of PGE2 were chosen to stimulate both hRMEC and ARPE-19 rather than the respective EC50 values based on the PGE2 dose-response curves for each cell type. This higher concentration showed the maximal effects in each cell type without excessive doses that may likely promote off-target effects, so we therefore reasoned it would show optimal effects in RNA sequencing analyses. While the 100 nM PGE2 concentration may be limit the overall physiologic relevance, both EP4 inhibition in hRMEC and EP2 inhibition in ARPE-19 were still fully or mostly efficacious against this high concentration in other assays shown. In hRMEC, TJP2 and FRZ4 upregulation in RNA-seq each may support the observed increase in barrier resistance. TJP2 encodes ZO-2, a critical component of blood-retina barriers that is especially important for maintaining membrane rigidity (Naylor et al., 2019; Campbell and Humphries, 2013; Pinto-Duenas et al., 2024). Furthermore, the frizzled class receptor 4 encoded by FRZ4 is the primary receptor of norrin, and the norrin signaling pathway is known to promote blood-retina barrier function in vitro and in vivo (Diaz-Coranguez et al., 2020; Zhang et al., 2023). It is also a receptor for the Wnt ligand, and Wnt/β-catenin signaling also has important roles in maintaining the inner blood-retina barrier (Yemanyi et al., 2021). Antibody-based pharmacologic activation of FZD4 was sufficient to restore blood-retina barrier function that was compromised in mouse models (Ding et al., 2023); therefore, it is possible that FRZ4 gene overexpression may have similar enhancing effects on barrier function. In ARPE-19, downregulation of CLDND1 as well as upregulation of OCLN and PARD3 were identified by our sequencing analysis. Claudin family proteins are well-characterized components of tight junctions that regulate barrier integrity of RPE and other epithelial cells and also interact with additional junctional complex proteins including occludin (Findley and Koval, 2009; Rizzolo et al., 2011). While occludin is similarly an essential component of junctional complexes to promote blood-retina barrier regulation (O'Leary and Campbell, 2023; Campbell and Humphries, 2013; Goncalves et al., 2021; Murakami et al., 2009), such high upregulation as observed here could detrimentally disrupt normal junctional complex organization. Similarly, complex dysfunction may be promoted by the upregulation of PAR-3, which has been shown to critically regulate RPE barriers through its interactions with PAR-6 and PKCζ or with junctional adhesion mole (JAM) (Omri et al., 2013; Ebnet et al., 2001). It is possible that overexpression of such junctional complex signaling proteins is counterproductive to blood-retina barrier integrity. Indeed, lower expression of tight junction constituents does not necessarily result in a weaker barrier, nor does higher expression necessarily promote a stronger barrier. Either up- or downregulation could disrupt organization and downstream signaling, leading to impaired function of the junctional complex. Western blot analyses suggested that Frizzled-4 was elevated in hRMEC and validated that occludin and CLDND1 were dysregulated in ARPE-19 in agreement with the RNA-seq results, but additional molecules not assayed here are likely involved in the PGE2-induced changes in barrier function in either cell type. Subsequent experiments to further validate additional targets and to test the individual roles of these up- and downregulated tight junction molecules are warranted for a full understanding of the mechanisms of PGE2 signaling on barrier function in both hRMEC and ARPE-19.
Our discovery that PGE2 causes opposing effects on barrier resistance in hRMEC versus ARPE-19 aligns with the results of Nakamura et al. (2023), yet our respective findings regarding which prostanoid(s) are responsible for these behaviors differ somewhat. While Nakamura et al. found that only co-stimulation with latanoprost and omidenepag elicited changes in barrier permeability, we instead detail that PGE2 alone, not PGF2α, drives the effects with high potency. The evaluation of latanoprost and omidenepag in barrier function assays both alone and in combination informs important drug safety and clinical relevance, yet we hypothesize that the effects on barrier function elicited by Nakamura’s combination approach may be due to the higher cumulative concentration of the drugs as they activate EP receptors. This would suggest off-target signaling for latanoprost, mirroring the effects of very high PGF2α concentrations in our assays.
The use of ECIS assays allows powerful, sensitive, and high-throughput measurements of changes in permeability in both retinal cell types in vitro. Further, the relevance of these experiments is improved through validation with physical barrier leakage analyses in transwell dextran flux assays. Nonetheless, in vitro studies in cell culture models are inherently limited. Cell growth requires artificial conditions that do not replicate retinal architecture and involve non-native growth supplementation. FBS supplementation was required to facilitate cell growth and survival in culture, yet FBS itself contains growth factors, proteins, hormones, and fatty acids including arachidonic acid that could affect experiment endpoints (Subbiahanadar Chelladurai et al., 2021; Lee et al., 2023). To control for this, we used a consistent supplementation of all media with 10% FBS and used FBS of the same lot number for all experiments. Further, our in vitro study is limited in its relevance to the intact diabetic retina. Previous studies have begun to analyze effects of prostanoid signaling using in vivo methods. Nakamura et al. observed that RPE flat mounts from mice intravitreally injected with omidenepag, latanoprost, or both drugs in combination had disrupted ZO-1 junctional complex staining compared with vehicle-injected mice, indicating impaired barrier function due to EP2 and/or FP receptor signaling (Nakamura et al., 2023). Similarly, Wang et al. found that PGE2 and the EP2 agonist butaprost each exacerbated Evans blue dye vascular leakage in retinal whole mounts from rats with STZ-induced diabetes, and the partially selective EP2 antagonist AH6809 prevented this leakage (Wang et al., 2019). Finally, a study by Amrite et al. indirectly addressed a role of prostanoid signaling in vascular leakage in vivo by injecting COX-2-selective celecoxib-containing microparticles into the eyes of STZ rats. The celecoxib microparticles caused a 40% decrease in retinal PGE2 levels as well as a 50% decrease in FITC-dextran leakage from the retinas compared with control microparticle injections, which potentially supports the findings of PGE2-induced permeability (Amrite et al., 2006). Each of these studies, however, only analyzed vascular leakage across a single blood-retina barrier. To better characterize potentially distinct roles of PGE2 in blood-retina barrier function as we observed in vitro, FITC-dextran measurements in retinal transverse sections, a method established by Xu and Le. (2011), could be performed alongside the relevant PGE2 antagonist injections, facilitating the direct comparison of effects on inner and outer blood-retina barriers in vivo.
Overall, we found that hRMEC modeling the inner blood-retina barrier and RPE cell cultures modeling the outer blood-retina barrier respond to PGE2 in opposing manners. hRMEC barrier function is strengthened by PGE2 signaling via the EP4 receptor, whereas ARPE-19 barriers become more permeable from PGE2 signaling via the EP2 receptor. Both receptors promote intracellular cAMP production, which may affect different downstream signaling pathways and/or junctional complex proteins in these two cell types. Our findings might impact the management of DR and DME due to the opposing cellular responses to PGE2, which is elevated in patients with DR. Cell type-specific and receptor-specific therapeutic development could balance the pro-strengthening, anti-permeability effects of PGE2 in the blood-retina barriers relevant to vascular leakage and DME progression.
Statements
Data availability statement
The datasets presented in this study can be found in online repositories. The names of the repository/repositories and accession number(s) can be found below: https://www.ncbi.nlm.nih.gov/, GSE301373.
Ethics statement
Ethical approval was not required for the studies on humans in accordance with the local legislation and institutional requirements because only commercially available established cell lines were used. Ethical approval was not required for the studies on animals in accordance with the local legislation and institutional requirements because only commercially available established cell lines were used.
Author contributions
AS: Conceptualization, Data curation, Formal Analysis, Funding acquisition, Investigation, Methodology, Validation, Visualization, Writing – original draft, Writing – review and editing. AG: Formal Analysis, Investigation, Validation, Visualization, Writing – review and editing. CO: Formal Analysis, Investigation, Validation, Visualization, Writing – review and editing. TS: Data curation, Formal Analysis, Validation, Writing – review and editing. AB: Formal Analysis, Investigation, Validation, Visualization, Writing – review and editing. GM: Formal Analysis, Validation, Writing – review and editing. JP: Conceptualization, Formal Analysis, Funding acquisition, Methodology, Project administration, Supervision, Writing – original draft, Writing – review and editing.
Funding
The author(s) declare that financial support was received for the research and/or publication of this article. This work was supported by NIH grants R01 EY007533 (JSP), R01 EY023397 (JSP), F31 EY034386 (AKS), T32 GM007628 (AKS); an endowment from the Knights Templar Eye Foundation (JSP); and an unrestricted grant from Research to Prevent Blindness, Inc.
Acknowledgments
We thank the Vanderbilt VANTAGE core facility for their help in conducting and analyzing RNA-seq experiments for this project.
Conflict of interest
The authors declare that the research was conducted in the absence of any commercial or financial relationships that could be construed as a potential conflict of interest.
Generative AI statement
The author(s) declare that no Generative AI was used in the creation of this manuscript.
Any alternative text (alt text) provided alongside figures in this article has been generated by Frontiers with the support of artificial intelligence and reasonable efforts have been made to ensure accuracy, including review by the authors wherever possible. If you identify any issues, please contact us.
Publisher’s note
All claims expressed in this article are solely those of the authors and do not necessarily represent those of their affiliated organizations, or those of the publisher, the editors and the reviewers. Any product that may be evaluated in this article, or claim that may be made by its manufacturer, is not guaranteed or endorsed by the publisher.
Supplementary material
The Supplementary Material for this article can be found online at: https://www.frontiersin.org/articles/10.3389/fphar.2025.1608376/full#supplementary-material
References
1
Abramovitz M. Adam M. Boie Y. Carrière M. Denis D. Godbout C. et al (2000). The utilization of recombinant prostanoid receptors to determine the affinities and selectivities of prostaglandins and related analogs. Biochim. Biophys. Acta1483, 285–293. 10.1016/s1388-1981(99)00164-x
2
Adamson R. H. Liu B. Fry G. N. Rubin L. L. Curry F. E. (1998). Microvascular permeability and number of tight junctions are modulated by cAMP. Am. J. Physiol.274, H1885–H1894. 10.1152/ajpheart.1998.274.6.H1885
3
Aihara M. (2021). Prostanoid receptor agonists for glaucoma treatment. Jpn. J. Ophthalmol.65, 581–590. 10.1007/s10384-021-00844-6
4
Alge C. S. Hauck S. M. Priglinger S. G. Kampik A. Ueffing M. (2006). Differential protein profiling of primary versus immortalized human RPE cells identifies expression patterns associated with cytoskeletal remodeling and cell survival. J. Proteome Res.5, 862–878. 10.1021/pr050420t
5
Amrite A. C. Ayalasomayajula S. P. Cheruvu N. P. Kompella U. B. (2006). Single periocular injection of celecoxib-PLGA microparticles inhibits diabetes-induced elevations in retinal PGE2, VEGF, and vascular leakage. Invest Ophthalmol. Vis. Sci.47, 1149–1160. 10.1167/iovs.05-0531
6
Antonetti D. A. Klein R. Gardner T. W. (2012). Diabetic retinopathy. N. Engl. J. Med.366, 1227–1239. 10.1056/NEJMra1005073
7
Antonetti D. A. Silva P. S. Stitt A. W. (2021). Current understanding of the molecular and cellular pathology of diabetic retinopathy. Nat. Rev. Endocrinol.17, 195–206. 10.1038/s41574-020-00451-4
8
Bärnthaler T. Maric J. Platzer W. Konya V. Theiler A. Hasenöhrl C. et al (2017). The role of PGE 2 in alveolar epithelial and lung Microvascular Endothelial Crosstalk. Sci. Rep.7, 7923. 10.1038/s41598-017-08228-y
9
Bhagat N. Grigorian R. A. Tutela A. Zarbin M. A. (2009). Diabetic macular edema: pathogenesis and treatment. Surv. Ophthalmol.54, 1–32. 10.1016/j.survophthal.2008.10.001
10
Bianco L. Arrigo A. Aragona E. Antropoli A. Berni A. Saladino A. et al (2022). Neuroinflammation and neurodegeneration in diabetic retinopathy. Front. Aging Neurosci.14, 937999. 10.3389/fnagi.2022.937999
11
Birukova A. A. Zagranichnaya T. Fu P. Alekseeva E. Chen W. Jacobson J. R. et al (2007). Prostaglandins PGE(2) and PGI(2) promote endothelial barrier enhancement via PKA- and Epac1/Rap1-dependent Rac activation. Exp. Cell Res.313, 2504–2520. 10.1016/j.yexcr.2007.03.036
12
Birukova A. A. Zagranichnaya T. Alekseeva E. Bokoch G. M. Birukov K. G. (2008). Epac/Rap and PKA are novel mechanisms of ANP-induced Rac-mediated pulmonary endothelial barrier protection. J. Cell Physiol.215, 715–724. 10.1002/jcp.21354
13
Campbell M. Humphries P. (2013). “The Blood-Retina Barrier,” in Biology and Regulation of Blood-Tissue Barriers. Advances in Experimental Medicine and Biology. Editors ChengC. Y. (New York, NY: Springer), 763.
14
Chen D. Tang J. Wan Q. Zhang J. Wang K. Shen Y. et al (2017). E-Prostanoid 3 receptor mediates sprouting angiogenesis through suppression of the protein kinase A/β-Catenin/Notch pathway. Arterioscler. Thromb. Vasc. Biol.37, 856–866. 10.1161/ATVBAHA.116.308587
15
Cheng Y. Peng L. Deng X. Li T. Guo H. Xu C. et al (2021). Prostaglandin F2α protects against pericyte apoptosis by inhibiting the PI3K/Akt/GSK3β/β-catenin signaling pathway. Ann. Transl. Med.9, 1021. 10.21037/atm-21-2717
16
Dalvi S. Nguyen H. H. On N. Mitchell R. W. Aukema H. M. Miller D. W. et al (2015). Exogenous arachidonic acid mediates permeability of human brain microvessel endothelial cells through prostaglandin E2 activation of EP3 and EP4 receptors. J. Neurochem.135, 867–879. 10.1111/jnc.13117
17
Daruich A. Matet A. Moulin A. Kowalczuk L. Nicolas M. Sellam A. et al (2018). Mechanisms of macular edema: beyond the surface. Prog. Retin Eye Res.63, 20–68. 10.1016/j.preteyeres.2017.10.006
18
Diabetes Control and Complications Trial Research Group (1995). Progression of retinopathy with intensive versus conventional treatment in the diabetes control and complications trial. Diabetes control and complications trial research group. Ophthalmology102, 647–661. 10.1016/s0161-6420(95)30973-6
19
Diaz-Coranguez M. Lin C. M. Liebner S. Antonetti D. A. (2020). Norrin restores blood-retinal barrier properties after vascular endothelial growth factor-induced permeability. J. Biol. Chem.295, 4647–4660. 10.1074/jbc.RA119.011273
20
Ding J. Lee S. J. Vlahos L. Yuki K. Rada C. C. van Unen V. et al (2023). Therapeutic blood-brain barrier modulation and stroke treatment by a bioengineered FZD(4)-selective WNT surrogate in mice. Nat. Commun.14, 2947. 10.1038/s41467-023-37689-1
21
Ebnet K. Suzuki A. Horikoshi Y. Hirose T. Meyer Zu Brickwedde M. K. Ohno S. et al (2001). The cell polarity protein ASIP/PAR-3 directly associates with junctional adhesion molecule (JAM). EMBO J.20, 3738–3748. 10.1093/emboj/20.14.3738
22
Falcetti E. Flavell D. M. Staels B. Tinker A. Haworth S. G. Clapp L. H. (2007). IP receptor-dependent activation of PPARgamma by stable prostacyclin analogues. Biochem. Biophys. Res. Commun.360, 821–827. 10.1016/j.bbrc.2007.06.135
23
Ferris F. L. Patz A. (1984). Macular edema. A complication of diabetic retinopathy. Surv. Ophthalmol.28 (Suppl. l), 452–461. 10.1016/0039-6257(84)90227-3
24
Findley M. K. Koval M. (2009). Regulation and roles for claudin-family tight junction proteins. IUBMB Life61, 431–437. 10.1002/iub.175
25
Goncalves A. Dreffs A. Lin C. M. Sheskey S. Hudson N. Keil J. et al (2021). Vascular expression of permeability-resistant occludin mutant preserves visual function in diabetes. Diabetes70, 1549–1560. 10.2337/db20-1220
26
Goupil E. Wisehart V. Khoury E. Zimmerman B. Jaffal S. Hébert T. E. et al (2012). Biasing the prostaglandin F2α receptor responses toward EGFR-dependent transactivation of MAPK. Mol. Endocrinol.26, 1189–1202. 10.1210/me.2011-1245
27
Griffin B. W. Klimko P. Crider J. Y. Sharif N. A. (1999). AL-8810: a novel prostaglandin F2 alpha analog with selective antagonist effects at the prostaglandin F2 alpha (FP) receptor. J. Pharmacol. Exp. Ther.290, 1278–1284. 10.1016/s0022-3565(24)35032-3
28
He P. Zeng M. Curry F. E. (2000). Dominant role of cAMP in regulation of microvessel permeability. Am. J. Physiol. Heart Circ. Physiol.278, H1124–H1133. 10.1152/ajpheart.2000.278.4.H1124
29
Kempen J. H. O'Colmain B. J. Leske M. C. Haffner S. M. Klein R. Moss S. E. et al (2004). The prevalence of diabetic retinopathy among adults in the United States. Arch. Ophthalmol.122, 552–563. 10.1001/archopht.122.4.552
30
Klein R. Klein B. E. Moss S. E. Davis M. D. DeMets D. L. (1984). The Wisconsin epidemiologic study of diabetic retinopathy. IV. Diabetic macular edema. Ophthalmology91, 1464–1474. 10.1016/s0161-6420(84)34102-1
31
Klein R. Klein B. E. Moss S. E. Cruickshanks K. J. (1995). The Wisconsin Epidemiologic Study of Diabetic Retinopathy. XV. The long-term incidence of macular edema. Ophthalmology102, 7–16. 10.1016/s0161-6420(95)31052-4
32
Kliewer S. A. Lenhard J. M. Willson T. M. Patel I. Morris D. C. Lehmann J. M. (1995). A prostaglandin J2 metabolite binds peroxisome proliferator-activated receptor gamma and promotes adipocyte differentiation. Cell83, 813–819. 10.1016/0092-8674(95)90194-9
33
Konya V. Üllen A. Kampitsch N. Theiler A. Philipose S. Parzmair G. P. et al (2013). Endothelial E-type prostanoid 4 receptors promote barrier function and inhibit neutrophil trafficking. J. Allergy Clin. Immunol.131, 532–540. 10.1016/j.jaci.2012.05.008
34
Lee D. Y. Yun S. H. Lee S. Y. Lee J. Jr Mariano E. Joo S. T. et al (2023). Analysis of commercial fetal bovine serum (FBS) and its substitutes in the development of cultured meat. Food Res. Int.174, 113617. 10.1016/j.foodres.2023.113617
35
Lejeune M. Leung P. Beck P. L. Chadee K. (2010). Role of EP4 receptor and prostaglandin transporter in prostaglandin E2-induced alteration in colonic epithelial barrier integrity. Am. J. Physiol. Gastrointest. Liver Physiol.299, G1097–G1105. 10.1152/ajpgi.00280.2010
36
Li H. H. , (2018). Prostanoid EP(4) agonist L-902,688 activates PPARgamma and attenuates pulmonary arterial hypertension. Am. J. Physiol. Lung Cell Mol. Physiol.314, L349–L359. 10.1152/ajplung.00245.2017
37
Liu L. Jiang Y. Steinle J. J. (2019). Epac1 and Glycyrrhizin both inhibit HMGB1 levels to reduce diabetes-induced neuronal and vascular damage in the mouse retina. J. Clin. Med.8, 772. 10.3390/jcm8060772
38
Lorenowicz M. J. Fernandez-Borja M. Kooistra M. R. Bos J. L. Hordijk P. L. (2008). PKA and Epac1 regulate endothelial integrity and migration through parallel and independent pathways. Eur. J. Cell Biol.87, 779–792. 10.1016/j.ejcb.2008.05.004
39
Lundeen E. A. Burke-Conte Z. Rein D. B. Wittenborn J. S. Saaddine J. Lee A. Y. et al (2023). Prevalence of diabetic retinopathy in the US in 2021. JAMA Ophthalmol.141, 747–754. 10.1001/jamaophthalmol.2023.2289
40
Martín-Venegas R. Roig-Pérez S. Ferrer R. Moreno J. J. (2006). Arachidonic acid cascade and epithelial barrier function during Caco-2 cell differentiation. J. Lipid Res.47, 1416–1423. 10.1194/jlr.M500564-JLR200
41
Murakami T. Felinski E. A. Antonetti D. A. (2009). Occludin phosphorylation and ubiquitination regulate tight junction trafficking and vascular endothelial growth factor-induced permeability. J. Biol. Chem.284, 21036–21046. 10.1074/jbc.M109.016766
42
Murata T. Lin M. I. Aritake K. Matsumoto S. Narumiya S. Ozaki H. et al (2008). Role of prostaglandin D2 receptor DP as a suppressor of tumor hyperpermeability and angiogenesis in vivo. Proc. Natl. Acad. Sci. U. S. A.105, 20009–20014. 10.1073/pnas.0805171105
43
Nakamura N. Honjo M. Yamagishi R. Sakata R. Watanabe S. Aihara M. (2023). Synergic effects of EP2 and FP receptors co-activation on blood-retinal barrier and microglia. Exp. Eye Res.237, 109691. 10.1016/j.exer.2023.109691
44
Narumiya S. Sugimoto Y. Ushikubi F. (1999). Prostanoid receptors: structures, properties, and functions. Physiol. Rev.79, 1193–1226. 10.1152/physrev.1999.79.4.1193
45
Naylor A. Hopkins A. Hudson N. Campbell M. (2019). Tight junctions of the outer blood retina barrier. Int. J. Mol. Sci.21, 211. 10.3390/ijms21010211
46
O'Leary F. Campbell M. (2023). The blood-retina barrier in health and disease. FEBS J.290, 878–891. 10.1111/febs.16330
47
Omri S. Behar-Cohen F. Rothschild P. R. Gélizé E. Jonet L. Jeanny J. C. et al (2013). PKCζ mediates breakdown of outer blood-retinal barriers in diabetic retinopathy. PLoS One8, e81600. 10.1371/journal.pone.0081600
48
Pan W. W. Lin F. Fort P. E. (2021). The innate immune system in diabetic retinopathy. Prog. Retin Eye Res.84, 100940. 10.1016/j.preteyeres.2021.100940
49
Pavan B. Capuzzo A. Forlani G. (2014). High glucose-induced barrier impairment of human retinal pigment epithelium is ameliorated by treatment with Goji berry extracts through modulation of cAMP levels. Exp. Eye Res.120, 50–54. 10.1016/j.exer.2013.12.006
50
Peng L. Sun B. Liu M. Huang J. Liu Y. Xie Z. et al (2018). Plasma metabolic profile reveals PGF2α protecting against non-proliferative diabetic retinopathy in patients with type 2 diabetes. Biochem. Biophys. Res. Commun.496, 1276–1283. 10.1016/j.bbrc.2018.01.188
51
Pinto-Duenas D. C. Hernández-Guzmán C. Marsch P. M. Wadurkar A. S. Martín-Tapia D. Alarcón L. et al (2024). The role of ZO-2 in modulating JAM-A and gamma-Actin junctional recruitment, apical membrane and tight junction tension, and cell response to substrate stiffness and topography. Int. J. Mol. Sci.25, 2453. 10.3390/ijms25052453
52
Pochard C. Gonzales J. Bessard A. Mahe M. M. Bourreille A. Cenac N. et al (2021). PGI2 inhibits intestinal epithelial permeability and apoptosis to alleviate colitis. Cell Mol. Gastroenterol. Hepatol.12, 1037–1060. 10.1016/j.jcmgh.2021.05.001
53
Ramos C. J. Lin C. Liu X. Antonetti D. A. (2018). The EPAC-Rap1 pathway prevents and reverses cytokine-induced retinal vascular permeability. J. Biol. Chem.293, 717–730. 10.1074/jbc.M117.815381
54
Rizzolo L. J. Peng S. Luo Y. Xiao W. (2011). Integration of tight junctions and claudins with the barrier functions of the retinal pigment epithelium. Prog. Retin Eye Res.30, 296–323. 10.1016/j.preteyeres.2011.06.002
55
Rodríguez-Lagunas M. J. Martín-Venegas R. Moreno J. J. Ferrer R. (2010). PGE2 promotes Ca2+-mediated epithelial barrier disruption through EP1 and EP4 receptors in Caco-2 cell monolayers. Am. J. Physiol. Cell Physiol.299, C324–C334. 10.1152/ajpcell.00397.2009
56
Sayner S. L. Alexeyev M. Dessauer C. W. Stevens T. (2006). Soluble adenylyl cyclase reveals the significance of cAMP compartmentation on pulmonary microvascular endothelial cell barrier. Circ. Res.98, 675–681. 10.1161/01.RES.0000209516.84815.3e
57
Schoenberger S. D. Kim S. J. Sheng J. Rezaei K. A. Lalezary M. Cherney E. (2012). Increased prostaglandin E2 (PGE2) levels in proliferative diabetic retinopathy, and correlation with VEGF and inflammatory cytokines. Invest Ophthalmol. Vis. Sci.53, 5906–5911. 10.1167/iovs.12-10410
58
Sennlaub F. Valamanesh F. Vazquez-Tello A. El-Asrar A. M. Checchin D. Brault S. et al (2003). Cyclooxygenase-2 in human and experimental ischemic proliferative retinopathy. Circulation108, 198–204. 10.1161/01.CIR.0000080735.93327.00
59
Stark A. K. Penn J. S. (2024a). Prostanoid signaling in retinal vascular diseases. Prostagl. Other Lipid Mediat174, 106864. 10.1016/j.prostaglandins.2024.106864
60
Stark A. K. Penn J. S. (2024b). Prostanoid signaling in retinal cells elicits inflammatory responses relevant to early-stage diabetic retinopathy. J. Neuroinflammation21, 329. 10.1186/s12974-024-03319-w
61
Steinle J. J. (2020). Review: role of cAMP signaling in diabetic retinopathy. Mol. Vis.26, 355–358.
62
Subbiahanadar Chelladurai K. Selvan Christyraj J. D. Rajagopalan K. Yesudhason B. V. Venkatachalam S. Mohan M. et al (2021). Alternative to FBS in animal cell culture - an overview and future perspective. Heliyon7, e07686. 10.1016/j.heliyon.2021.e07686
63
Tang J. Kern T. S. (2011). Inflammation in diabetic retinopathy. Prog. Retin. eye Res.30, 343–358. 10.1016/j.preteyeres.2011.05.002
64
Toris C. B. Camras C. B. Yablonski M. E. (1993). Effects of PhXA41, a new prostaglandin F2 alpha analog, on aqueous humor dynamics in human eyes. Ophthalmology100, 1297–1304. 10.1016/s0161-6420(93)31484-3
65
van der Wijk A. E. Vogels I. M. C. van Noorden C. J. F. Klaassen I. Schlingemann R. O. (2017). TNFα-Induced disruption of the blood-retinal barrier in vitro is regulated by intracellular 3',5'-Cyclic adenosine monophosphate levels. Invest Ophthalmol. Vis. Sci.58, 3496–3505. 10.1167/iovs.16-21091
66
Wang M. Wang Y. Xie T. Zhan P. Zou J. Nie X. et al (2019). Prostaglandin E2/EP2 receptor signalling pathway promotes diabetic retinopathy in a rat model of diabetes. Diabetologia62, 335–348. 10.1007/s00125-018-4755-3
67
Wittchen E. S. Hartnett M. E. (2011). The small GTPase Rap1 is a novel regulator of RPE cell barrier function. Invest Ophthalmol. Vis. Sci.52, 7455–7463. 10.1167/iovs.11-7295
68
Wittchen E. S. Nishimura E. McCloskey M. Wang H. Quilliam L. A. Chrzanowska-Wodnicka M. et al (2013). Rap1 GTPase activation and barrier enhancement in rpe inhibits choroidal neovascularization in vivo. PLoS One8, e73070. 10.1371/journal.pone.0073070
69
Xie T. Zhang Z. Cui Y. Shu Y. Liu Y. Zou J. et al (2021). Prostaglandin E(2) promotes pathological retinal neovascularisation via EP(4)R-EGFR-Gab1-AKT signaling pathway. Exp. Eye Res.205, 108507. 10.1016/j.exer.2021.108507
70
Xu H. Z. Le Y. Z. (2011). Significance of outer blood-retina barrier breakdown in diabetes and ischemia. Investig. Ophthalmol. Vis. Sci.52, 2160–2164. 10.1167/iovs.10-6518
71
Yanni S. E. Barnett J. M. Clark M. L. Penn J. S. (2009). The role of PGE2 receptor EP4 in pathologic ocular angiogenesis. Investig. Ophthalmol. Vis. Sci.50, 5479–5486. 10.1167/iovs.09-3652
72
Yau J. W. Rogers S. L. Kawasaki R. Lamoureux E. L. Kowalski J. W. Bek T. et al (2012). Global prevalence and major risk factors of diabetic retinopathy. Diabetes Care35, 556–564. 10.2337/dc11-1909
73
Yemanyi F. Bora K. Blomfield A. K. Wang Z. Chen J. (2021). Wnt signaling in inner blood-retinal barrier maintenance. Int. J. Mol. Sci.22, 11877. 10.3390/ijms222111877
74
Yu K. Bayona W. Kallen C. B. Harding H. P. Ravera C. P. McMahon G. et al (1995). Differential activation of peroxisome proliferator-activated receptors by eicosanoids. J. Biol. Chem.270, 23975–23983. 10.1074/jbc.270.41.23975
75
Zhang L. Abedin M. Jo H. N. Levey J. Dinh Q. C. Chen Z. et al (2023). A Frizzled4-LRP5 agonist promotes blood-retina barrier function by inducing a Norrin-like transcriptional response. iScience26, 107415. 10.1016/j.isci.2023.107415
Summary
Keywords
ophthalmology, diabetic retinopathy, diabetic macular edema, prostaglandin, lipid signaling, inflammation, blood-retina barrier, barrier function
Citation
Stark AK, Gilmartin AR, Ontko CD, Smith TE, Beall AL, McCollum GW and Penn JS (2025) Prostaglandin E2 stimulates opposing effects on inner and outer blood-retina barrier function. Front. Pharmacol. 16:1608376. doi: 10.3389/fphar.2025.1608376
Received
08 April 2025
Accepted
31 August 2025
Published
26 September 2025
Volume
16 - 2025
Edited by
Stefania Tacconelli, University of Studies G d'Annunzio Chieti and Pescara, Italy
Reviewed by
Neil J. Grimsey, University of Georgia, United States
Shruthi Karnam, University of California, Berkeley, United States
Updates
Copyright
© 2025 Stark, Gilmartin, Ontko, Smith, Beall, McCollum and Penn.
This is an open-access article distributed under the terms of the Creative Commons Attribution License (CC BY). The use, distribution or reproduction in other forums is permitted, provided the original author(s) and the copyright owner(s) are credited and that the original publication in this journal is cited, in accordance with accepted academic practice. No use, distribution or reproduction is permitted which does not comply with these terms.
*Correspondence: Amy K. Stark, amy.k.stark@vanderbilt.edu; John S. Penn, john.s.penn@vumc.org
Disclaimer
All claims expressed in this article are solely those of the authors and do not necessarily represent those of their affiliated organizations, or those of the publisher, the editors and the reviewers. Any product that may be evaluated in this article or claim that may be made by its manufacturer is not guaranteed or endorsed by the publisher.