 Ji Shao1†
 Xue Han
 Bilian Chen
 Qiaojuan Shi
- 1Zhejiang Provincial Key Laboratory of Laboratory Animals and Safety Research, Hangzhou Medical College, Hangzhou, China
- 2NMPA Key Laboratory of Quality Evaluation of Traditional Chinese Medicine, Zhejiang Institute for Food and Drug Control, Hangzhou, China
Objective: This study systematically investigated the pharmacokinetic characteristics, cerebral distribution, and metabolic transformation of Gastrodia elata components in both healthy and cerebral ischemia rat models.
Methods: Chemical profiling of Gastrodia elata was conducted using UPLC-Q-TOF-MS. Based on the systemically absorbed constituents identified in plasma and brain tissues of dosed rats, a validated UPLC-QQQ-MS method was established to quantitatively determine target compound levels in plasma and brain tissues of both normal and cerebral ischemic rats following 3-day oral administration. Subsequently, UPLC-Q-TOF-MS was reapplied to conduct identification and comparative analysis of xenobiotic metabolites in both in vivo systems and brain tissues.
Results: Based on the established therapeutic efficacy of Gastrodia elata extract against cerebral ischemia-reperfusion injury, chemical profiling identified 53 constituents, among which six were simultaneously detected in plasma and brain tissue of dosed rats. The established simultaneous quantitative analytical method demonstrated reduced gastrointestinal absorption of parishin A, parishin B, parishin C, parishin E and gastrodin in ischemic model rats compared to healthy controls. Notably, brain accumulation of these compounds was significantly increased in ischemic models, attributable to compromised blood-brain barrier integrity. Xenobiotic metabolite analysis identified nine biotransformation products, four of which exhibited quantifiable exposure levels in brain tissues across all experimental groups.
Conclusion: This study systematically revealed the bioactive components of Gastrodia elata and their cerebral distribution patterns. The pharmacokinetic characteristics of gastrodin and related bioactive compounds were also elucidated. These findings provide a valuable reference for pharmacological exploration, safety evaluation, and clinical application of Gastrodia elata in cerebrovascular disorders.
1 Introduction
Stroke ranks as the second leading global cause of mortality (6.6 million annual deaths) and the third primary contributor to disability worldwide (Feigin et al., 2023). Ischemic stroke, representing over 80% of cases, arises from cerebral hypoperfusion due to vascular occlusion, culminating in ischemic necrosis and neurological deficits. While timely reperfusion remains the cornerstone therapeutic intervention, paradoxical reperfusion injury frequently manifests as blood-brain barrier (BBB) disruption, cerebral edema, and exacerbated neuronal damage (Guo et al., 2016), critically impacting patient prognosis.
Gastrodia elata Blume (GEB) is a valuable traditional Chinese medicine with significant effects on nervous system-related diseases, such as headache, epilepsy, and stroke. It is the tuber of the orchid and is widely distributed in China, Japan, South Korea, Nepal, India, Russia, and other places (Chen, 2023). In 2023, the National Health Commission of the People’s Republic of China and the State Administration for Market Regulation jointly issued a document to include GEB in the list of substances that traditionally serve as both food and traditional Chinese medicinal botanical drugs (Sun-waterhouse et al., 2024; Cong, 2024). Chronic toxicity studies have indicated that GEB has no significant mutagenic or toxic properties (Lu et al., 2020). Currently, more than 100 GEB compounds have been identified and are mainly classified as aromatic compounds, steroidal compounds, and organic acids based on the structure of their parent nuclei (Gong et al., 2024). Among these compounds, aromatic compounds such as 4-hydroxybenzyl alcohol (HBA), gastrodin (GAS), and Parishin compounds are the characteristic components of GEB with various pharmacological activities. Previous literature has indicated that HBA promotes a neuroprotective effect via anti-apoptosis (Yu et al., 2010). GAS can treat or improve epilepsy, Alzheimer’s disease, cerebral ischemia-reperfusion (I/R) injury, etc (Xiao et al., 2023). Parishins can protect the myocardium by inhibiting the phosphorylation of JNK1 (Wang et al., 2020). Although accumulating evidence suggests that multiple bioactive constituents in GEB may confer protective effects against cerebral ischemia-reperfusion injury, the precise pharmacodynamic substances responsible for its therapeutic efficacy remain to be elucidated. As a time-honored herbal medicine with predominant empirical applications, critical knowledge gaps persist regarding the specific bioactive entities that ultimately mediate its pharmacological actions in vivo, particularly their absorption patterns, metabolic transformations, and biodistribution dynamics within cerebral.
Pharmacokinetic characterization is pivotal for deciphering the therapeutic mechanisms of herbal medicines. The spatiotemporal distribution of bioactive compounds in target organs directly determines their pharmacological efficacy. Notably, disease-induced pathophysiological alterations—such as gastrointestinal dysmotility and BBB compromise in cerebral ischemia (Wang et al., 2024) - may substantially modify drug disposition parameters (Liu et al., 2022). This underscores the imperative to investigate disease-state pharmacokinetics for optimizing therapeutic regimens. Concurrently, the evolving advancements in high-resolution mass spectrometry have substantially augmented the capability for xenobiotic metabolite identification, particularly demonstrating unique advantages in tracing the biotransformation pathways of herbal medicine parent components (Wang et al., 2022).
Building upon preliminary research indicating GEB’s therapeutic potential for cerebral ischemia, we performed the following experiments: 1) Identification of GEB chemical constituents using UPLC-QTOF-MS; 2) Analysis of pharmacokinetic profiles and tissue distribution in both normal rats and rats with cerebral ischemia-reperfusion injury (CIRI) via UPLC-MS/MS; and 3) Identification of xenobiotic metabolites in rats using UPLC-QTOF-MS. The graphical abstract of the experimental workflow is shown in Figure 1. Through an integrated comparative analysis of component absorption kinetics, cerebral distribution characteristics, and exogenous metabolites, this study aims to elucidate the in vivo metabolic trajectory of GEB constituents, providing a pharmacokinetic foundation for subsequent pharmacodynamic research targeting CIRI.
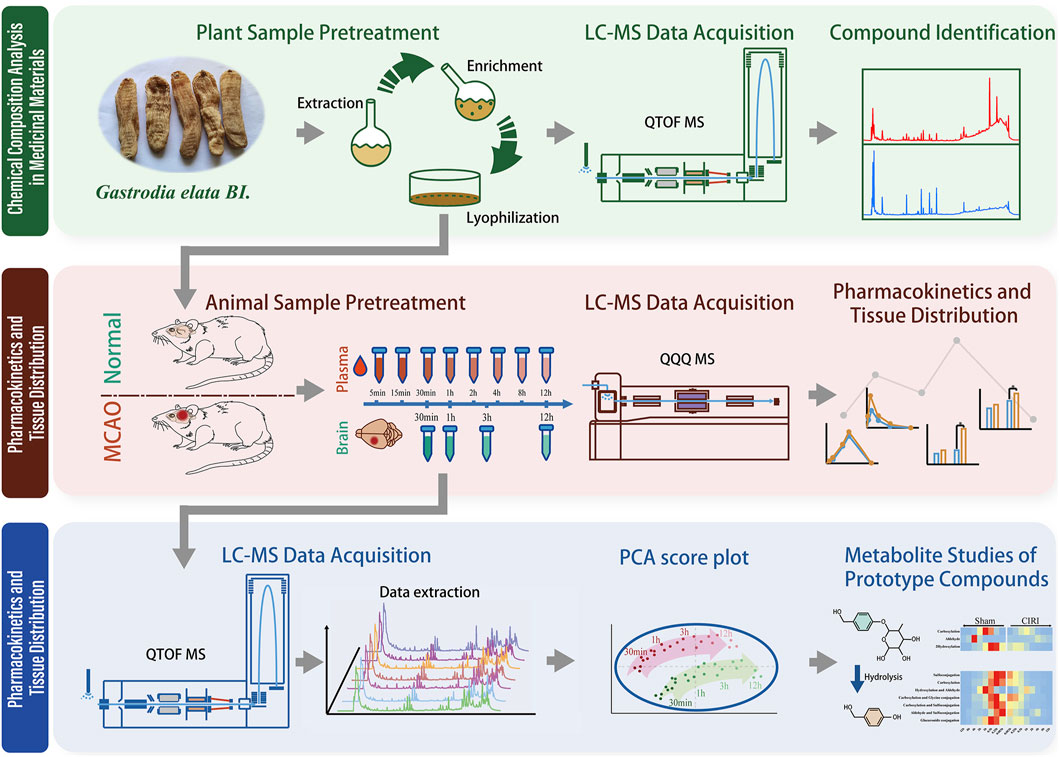
Figure 1. Graphical abstract.
2 Materials and METHODS
2.1 Reagents and chemicals
GEB tubers were procured from Ningbo Mingbei Chinese Pharmaceutical Co., Ltd. (Batch: 202,210; Origin: Shangluo, Shaanxi Province, China). The botanical material was authenticated as the dried tuber of Gastrodia elata Bl. through morphological and microscopic characterization by Mr. Guo Zengxi, Chief Pharmacologist of Traditional Chinese Medicine at Zhejiang Institute for Food and Drug Control. The crude drug (2 kg) was subjected to three successive reflux extractions with 75% aqueous ethanol (solvent-to-material ratio 10:1 v/w, 1 h per cycle), followed by combined filtration and concentration using rotary evaporation. The resultant extract was subsequently lyophilized, yielding 441.7 g of standardized extract (22.1% w/w yield). Quantitative analysis via ultra-performance liquid chromatography revealed the following constituent profile: Parishin A (PA, 6.11%), Parishin B (PB, 3.10%), Parishin C (PC, 0.57%), Parishin E (PE, 3.44%), gastrodin (GAS, 1.28%), S-(4-hydroxybenzyl) glutathione (4-HBG, 0.60%), and 4-hydroxybenzyl alcohol (HBA, 0.77%).
Reference standards were obtained as follows: PA from Yuanye Bio-Technology Co., Ltd. (Shanghai, China; purity >98%); PB, PC, PE, and 4-HBG from Weikeqi Bio-Technology Co., Ltd. (Chengdu, China; purity >98%); GAS and bergenin (internal standard, IS) from the National Institute for Food and Drug Control (Beijing, China; purity >98%). HPLC-grade methanol, acetonitrile, and formic acid were purchased from Merck KGaA (Darmstadt, Germany). Deionized water was generated using a Milli-Q Integral Water Purification System (MilliporeSigma, United States). Chemical structures of analytes and IS are provided in Figure 2.
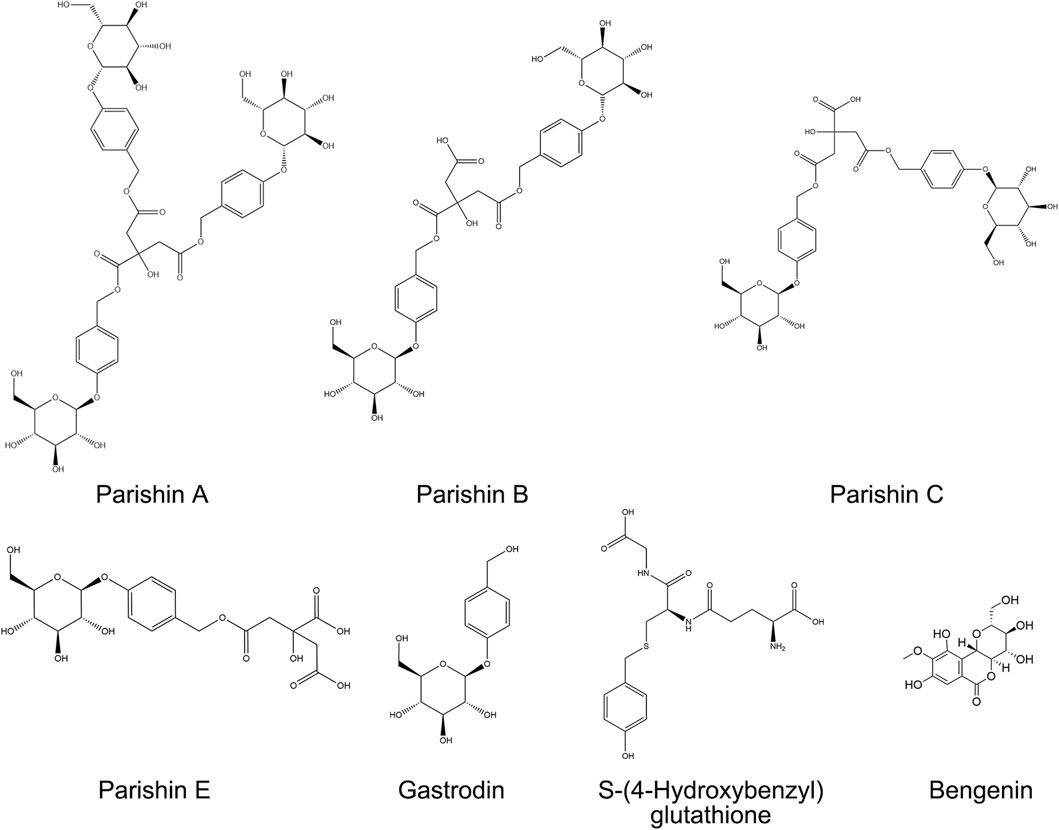
Figure 2. Chemical structures of PA, PB, PC, PE, GAS, 4-HBG, and Bergenin (IS).
2.2 In vivo analyses
Male Sprague-Dawley rats (body weight 200–220 g) were procured from the Laboratory Animal Center of Hangzhou Medical College [Laboratory Animal Quality Certificate No. SCXK (Zhe) 2019–0,011]. Animals were housed in a specific pathogen-free (SPF) facility maintaining controlled environmental conditions: ambient temperature 22°C ± 2°C, relative humidity 50% ± 10%, and 12/12 h light/dark cycle with ad libitum access to standardized rodent chow and autoclaved water. Adaptive feeding was carried out for a week before the analyses, followed by a 12 h fast without prohibiting water. All animal-related protocols were carried out per the Laboratory animals care and use guidelines. Terminal anesthesia was achieved via intraperitoneal injection of pentobarbital sodium (40 mg/kg), followed by confirmation of euthanasia through cervical dislocation.
The experimental cohort was randomly allocated into two groups: Normal controls (n = 20) and middle cerebral artery occlusion (MCAO) models (n = 20). Cerebral ischemia was induced using Longa’s intraluminal filament technique under pentobarbital sodium anesthesia (40 mg/kg, i. p.). Briefly, a silicone-coated 4–0 nylon monofilament was advanced through the right external carotid artery to occlude the middle cerebral artery origin. After 120 min of ischemia, reperfusion was initiated by filament withdrawal. Neurological function was evaluated at 24 h post-reperfusion using the modified Neurological Severity Score (mNSS) system, which quantifies sensorimotor deficits through a 14-point composite scale assessing reflexes, balance, and motor coordination. Animals demonstrating moderate neurological impairment (mNSS 7–12) were included for subsequent interventions, while those with lethal scores (>12) or unsuccessful occlusion (mNSS <7) were excluded. Selected MCAO rats were administered standardized GEB extract (1,200 mg/kg, corresponding to 48 g crude drug per human daily equivalent) by oral gavage once daily for three consecutive days.
2.3 Chromatographic and mass spectrometric conditions
2.3.1 Qualitative mass spectrometry analysis
The Agilent 1,290 series UPLC system equipped with an Agilent 6545 Q-TOF-MS (California, United States) was employed for UPLC-Q-TOF-MS analysis. Before each analysis, the instrument was calibrated via a tuning fluid Lu et al., 2019. Furthermore, system control, data acquisition, and processing were managed by MassHunter Workstation Software (Version B.08.00). Electrospray ionization was employed for recording mass spectra in negative and positive ion modes as well as with the auto MS/MS option. Moreover, Precursor and fragment ions with mass-to-charge ratios of 50–1,500 and 100–1,200 m/z mass-to-charge ratios were identified, respectively. The flow rate was 8 L/min, while the ion source gas temperature was 320°C. For the nebulizer, nitrogen was employed with 35 psi pressure. The respective capillary, skimmer, and fragmentor voltage were 3,500, 65, and 135 V. The collision energies were 20 and 40 eV.
The employed chromatographic column was a Waters CORTECS T3-C18 column (2.7 μm, 150 × 4.6 mm), with 35°C. Mobile phase A consisted of water containing 0.1% (v/v) formic acid, and mobile phase B was acetonitrile. For GEB as well as plasma and brain samples, different gradient elution procedures were set up for different analytical purposes.
The compound species and structure of GEB were comprehensively identified. Gradient elution was set as follows: 1% B for 0–10 min, 1%–10% B for 10–18 min, 10%–30% B for 18–35 min, 30%–60% B for 35–40 min, 60%–95% B for 40–60 min, 95%–1% B for 60–61 min, lastly, the gradient was restored to 1% B and then stopped at 70 min with a flow rate of 0.3 mL/min. The sample was injected at 1 μL volume. The data were acquired via positive and negative ion modes.
For the rapid identification of xenobiotic metabolites in plasma and brain tissue, gradient elution was performed as follows: 3%–35% B for 0–10 min, 35%–95% B for 10–20 min, 95%–3% B for 20–20.1 min, and then the gradient was restored to 3% B and stopped at 25 min with a flow rate of 0.5 mL/min. The negative ion collection mode was applied, and the sample injection volume was 4 μL.
2.3.2 Quantitative mass spectrometry analysis
For this analysis, the Shimadzu 8,050 triple-quadrupole mass spectrometer and Shimadzu LC-30AD UPLC (Kyoto, Japan) equipped with an ESI interface were employed. Negative ion multiple reaction monitoring (MRM) mode was utilized for mass spectrometer settings. The instrument parameters were as follows: interface voltage = 3.0 kV, nebulizer gas flow = 3.0 L/min, heating gas flow = 10.0 L/min, drying gas flow = 10.0 L/min, DL temperature = 200°C, interface temperature = 300°C, heat block temperature = 400°C. The precursor-product ion pairs of the optimized MRM for the compounds and the internal standard are shown in Supplementary Table S1.
For the chromatography, a waters CORTECS T3-C18 column (2.7 μm; 150 × 4.6 mm) was selected, and the column temperature was set at 40°C. The mobile phase comprised (A) 0.02% formic acid water and (B) acetonitrile. The gradient elution was as follows: 3% B for 0–4.5 min, 3%–8% B for 4.5–5 min, 8%–30% B for 5–11 min, 30%–95% B for 11–12 min, 95%–3% B for 12–12.1 min, and back to 3% B for 16 min. The sample size was 4 μL, and the flow rate was 1 mL/min.
2.4 Pharmacokinetic sample processing
Eight behaviorally qualified rats from each group (Normal vs. MCAO, n = 8/group) received standardized GEB extract (1,200 mg/kg, equivalent to 48 g crude drug per human daily dose) via oral gavage once daily for three consecutive days. Serial blood sampling (0.5 mL) was performed via jugular vein cannulation at pre-dose (0 h) and 5 min, 15 min, 30 min, 1 h, 2 h, 4 h, 8 h, and 12 h post-final administration. Blood samples were immediately transferred to EDTA-K2 anticoagulant tubes, followed by centrifugation at 3,000 × g for 10 min at 4°C using a refrigerated centrifuge. The resultant plasma was aliquoted into polypropylene tubes.
2.5 Tissue distribution sample processing
An independent cohort (n = 6/group) was sacrificed under deep anesthesia (pentobarbital sodium 40 mg/kg, i. p.) at 0.5 h, 1 h, 3 h, and 12 h post-final dosing. Cerebral perfusion was performed with ice-cold normal saline via left ventricular cannulation to eliminate residual blood. Whole brains were rapidly excised, weighed, and homogenized in four volumes of phosphate-buffered saline (pH 7.4) using a tissue grinder (Precellys 24, Bertin Technologies, France). Homogenates were centrifuged at 12,000 × g for 15 min at 4°C. The supernatants were filtered through 0.22 μm PVDF membranes and aliquoted into polypropylene tubes.
2.6 Preparation of animal plasma and brain tissue samples
The literature has indicated that the protein precipitation method has a higher recovery rate than the liquid-liquid extraction protocol and is easier to operate than the solid-phase extraction technique (Liu et al., 2023).
Take 200 µL of rat plasma, add 100 µL of internal standard solution and 300 µL of ice-cold methanol, then vortex-mix for 5 min. Centrifuge the mixture at 12,000 rpm for 10 min at 4°C. Collect the supernatant and filter it through a 0.22 µm microporous membrane to obtain the final sample. For UPLC-MS/MS analysis, 4 μL of the supernatant was injected.
Weigh 300 mg of rat brain tissue and add 3 volumes of PBS solution. Homogenize the mixture at 70 Hz for 90 s, followed by centrifugation at 12,000 rpm for 10 min at 4°C. Collect the supernatant to obtain the test tissue homogenate. Take 400 µL of the homogenate, add 50 µL of internal standard solution and 1,150 µL of methanol, then vortex-mix for 5 min. Centrifuge the mixture at 12,000 rpm for 10 min at 4°C. Collect 1,200 µL of the supernatant and dry it under a nitrogen stream. Reconstitute the residue in 300 µL of methanol, centrifuge again, collect the supernatant, and filter through a 0.22 µm microporous membrane to obtain the final sample. For UPLC-MS/MS analysis, 4 μL of the supernatant was injected.
2.7 Preparation of stock and working solutions
2.7.1 Standard stock solutions
The stock solution was prepared by dissolving 6 precisely weighed reference materials in methanol. The stock solution was then mixed and diluted with methanol to acquire a series of standard working solutions. Bergenin (120 ng/mL) was dissolved in methanol and configured as an internal standard (IS).
2.7.2 Plasma calibration standards & QC samples
Calibration curves were constructed by spiking 20 μL of analyte working solution into 180 μL drug-free rat plasma, yielding six concentration levels. Quality control samples (QCs) at low (L), medium (M) and high (H) levels were prepared in the same manner. Spiked samples were vortex-mixed (1,500 rpm, 1 min) and processed identically to experimental samples through protein precipitation with ice-cold methanol (1:3 v/v).
2.7.3 Brain tissue calibration standards & QC samples
For cerebral quantification, 40 μL of the composite working solution was added to 360 μL blank brain homogenate, establishing six-point calibration curves. Quality controls (QCs) at three levels (L, M, H) were prepared similarly. Homogenate-spiked samples underwent identical homogenization and centrifugation protocols as described in Section 2.6.
The specific concentrations of the prepared calibration standards and QC samples are provided in Supplementary Tables S2–S3.
2.8 Method validation
Based on the ICH M10 “Bioanalytical Method Validation”, the method was validated to determine 6 components in the biological matrix, including specificity, recovery, linearity, accuracy, precision, lower quantification limit, stability, and matrix effect.
2.8.1 Specificity
The chromatograms of blank matrix samples from six rats, blank biosamples supplemented with control and IS, and biosamples of rats treated with GEB extract were analyzed for specificity analysis to minimize potential interference from endogenous substances.
According to ICH M10 guidelines, the analyte and IS retention sites of blank matrix samples should not show endogenous reactions. For each matrix, the interfering substance response should not exceed 5% of the IS response or 20% of the analyte response in the lower limit of quantification (LLOQ) sample.
2.8.2 Linearity and lower quantitation limits
The calibration curves of the peak area ratio of the pooled analyte and IS against each analyte’s concentration were plotted via Least-squares linear regression (weighted factor: 1/x2). When the regression coefficient r of the calibration curve was ≥ 0.99, the requirement was met. The LLOQ was described as the lowest concentration in the calibration curve that could be quantitatively measured when the signal-to-noise ratio was > 10.
2.8.3 Accuracy and precision
The accuracy and intra-day precision were investigated by repeated measurements of QC samples at 3 concentrations (L, M, H) daily, analyzed in six replicates per day over three consecutive days. Furthermore, accuracy and precision were depicted by relative error (RE) and relative standard deviation (RSD), respectively. The RSD of QC should be < 15% and RE within ± 15%.
2.8.4 Recovery and matrix effect
At the 3 concentration levels (L, M, H), the recovery and matrix effects of the components were determined using six replicates of QC samples. Recovery was determined by comparing the peak areas of before extraction samples to post-extracted spiked samples at three QC concentrations. The matrix effect is the peak response ratio between the component dissolved in the mobile phase at various concentrations and the component dissolved in the blank biological matrix. Acceptable RSD for recovery and matrix effects was set as ≤ 15%.
2.8.5 Stability
Stability was elucidated by assessing the QC sample’s (L, M, H) stability in different storage and handling conditions, such as at - 80°C for 1 month (long-term) storage and 3 freeze-thaw cycles. The RSD of QC should be < 15% and RE within ± 15%.
2.9 Drug configuration
High-dose GEB extract was prepared by adding 4.8 g of GEB extract in 40 mL of purified water to make a 120 mg/mL solution (calculated based on the human daily intake of 48 g of GEB).
The low dose of GEB was prepared by adding 2 g of GEB extract in 40 mL of purified water to make a 50 mg/mL solution (calculated based on the human daily intake of 20 g of GEB).
For preparing positive drugs, 2 nimodipine tablets (30 mg/tablet) were ground and added to 50 mL of purified water to make a 1.2 mg/mL solution (calculated based on the human daily intake of 120 mg of nimodipine).
All the solutions were stored at −40°C for no more than 1 week.
2.10 TTC staining
After induction of deep anesthesia with pentobarbital (40 mg/kg), the rats were euthanized by cervical dislocation, followed by decapitation for brain removal. The brains were immediately flash-frozen in a freezer for 20 min. Then, the olfactory bulb and cerebellum were removed, the brain was cut into 6 coronal sections from anterior to posterior, stained with 1% TTC solution in the dark for 20 min at 37°C, and preserved in 4% paraformaldehyde for 30 min.
2.11 Xenobiotic metabolite studies
The metabolism of all identified compounds was studied based on the simple decomposition pathway of the main compounds in GEB: PA→ PB/PC→ PE/PG→ GAS → 4-HBA.
The xenobiotic metabolite investigation protocol comprised three sequential phases: (1) Raw MS data stratification by experimental groups (Normal/MCAO) and temporal sampling points (0–12 h) was first performed to establish cohort-specific metabolic trajectories; (2) An algorithmic workflow in MassHunter Profinder (vB.10.0) then executed feature extraction through peak detection (>300 counts), retention time alignment (ΔRT = 0.05% + 0.15 min), mass calibration (Δm/z = 20 ppm + 2.0 mDa), and adduct annotation ([M-H]-/[M + HCOO]-), exporting processed data as. csv files; (3) A xenobiotic metabolite prediction database was constructed using R (v4.1.1) to screen candidate components with a mass tolerance of ±10 ppm, followed by structural confirmation through fragmentation pattern analysis, MS/MS spectral matching, and retention time consistency validation. The R code and detailed MS/MS structural confirmation process for xenobiotic metabolites are provided in Supplementary Data.
2.12 Data analysis
LabSolutions LCMS Version 5.118 (Kyoto, Japan) was utilized to quantify 6 parent compounds. Pharmacokinetic parameters, time to reach the maximum concentration (Tmax), clearance rectified by bioavailability (CLz/F), mean resident time (MRT), including area under the plasma concentration-time curve (AUC), elimination half-life (T1/2), apparent volume of distribution rectified by bioavailability (Vz/F) were analyzed by a non-compartmental method using Winnonlin 8.10 software (Pharsight Co., United States) software. Pharmacokinetic parameters were depicted as mean ± standard deviation (SD) (x ± s). All the statistical analyses were carried out via GraphPad Prism Version 10.0 software, and p < 0.05 was deemed statistically significant.
3 Results
3.1 Evaluation of the therapeutic effect of GEB on cerebral ischemia in rats
Rats were allocated into five groups: sham-operated (Sham), MCAO, low-dose GEB extract (GEB-L), high-dose GEB extract (GEB-H), and nimodipine control (NMDP). Model validity was confirmed via modified Neurological Severity Score (mNSS), with rats demonstrating moderate neurological impairment (scores 7–12) on post-operative day 1 selected for subsequent experiments. Longitudinal monitoring included body weight tracking and survival assessment, complemented by triphenyltetrazolium chloride (TTC) staining for cerebral infarction evaluation at study termination. The MCAO group exhibited characteristic ischemic pathology: progressive neurological deterioration, significant weight loss, and extensive infarction; in contrast, both GEB and NMDP improved these outcomes, with the GEB-H showing significantly superior efficacy to the GEB-L group, indicating its dose-dependent therapeutic effects (Figures 3A–E).
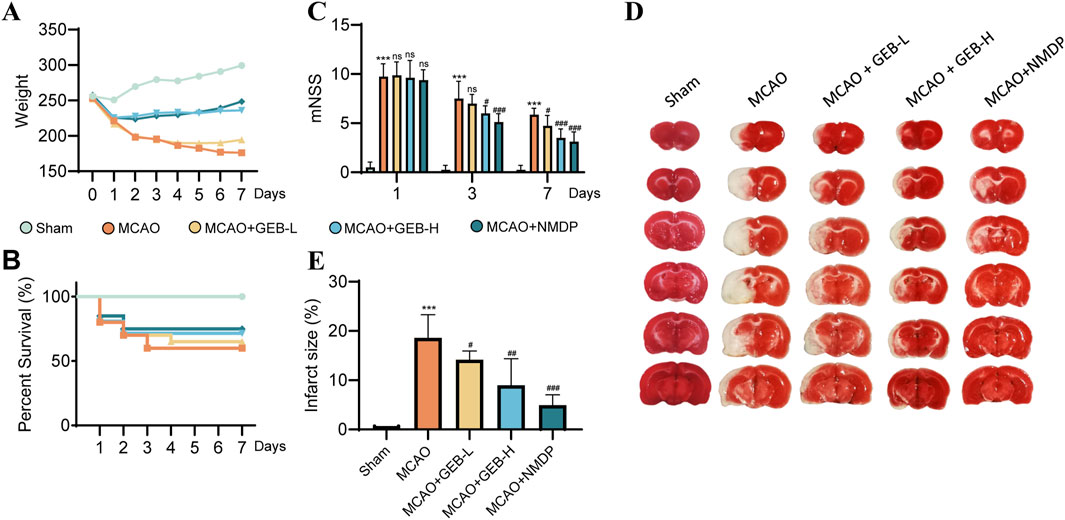
Figure 3. Evaluation of the therapeutic effect of GEB extract on cerebral ischemia in rats (mean ± SEM, n = 6). Azure represents Sham group, orange represents MCAO group, yellow represents GEB-L group, skyBlue represents GEB -H group, darkBlue represents NMDP group. ***P < 0.005 vs Sham group. #P < 0.05, ##P < 0.01, ###P < 0.005 vs MCAO group. (A) Weight monitoring for 1 week. (B) Survival curves within a week. (C) mNSS score. (D,E) TTC staining.
As evidenced by previous studies (Wang et al., 2022), the 1–3 day period following cerebral ischemia constitutes the acute phase, characterized by severe cerebral edema, pro-inflammatory cytokine storm, and progressive BBB disruption. This transitions into the subacute phase (days 3–7), marked by a homeostatic balance between pro- and anti-inflammatory signaling that initiates repair mechanisms, with day 3 post-ischemia representing a critical transition point in BBB breakdown/recovery dynamics Shi et al., 2012. Based on previous findings, we also observed that, except for the sham group, deaths occurred in varying degrees among the other groups of rats within 1–3 days after surgery. After day 3, mortality was observed in only one group. The mNSS results indicated that the model group maintained scores above 7 on postoperative day 3, reflecting severe brain injury in these rats. By day 7, all groups showed improvement in behavioral scores with time. Given this biphasic pathology, our investigation employed a 3-day high-dose GEB extract regimen to systematically compare the pharmacokinetic profiles and cerebral biodistribution patterns between normal and MCAO model rats Lu et al., 2019.
3.2 Identification of chemical compounds in GEB extracts
UPLC-Q-TOF-MS analysis was systematically performed in dual ionization modes (positive/negative) to elucidate the phytochemical profile of GEB extracts. As shown in the total ion chromatograms (TICs, Figure 4), 53 characteristic constituents were identified through accurate mass measurement (<10 ppm error), diagnostic fragment ions, and chromatographic retention behavior, including 16 amino acids, 14 parishin-type compounds, GAS, and HBA. Mechanistic studies have revealed that signature phenolic constituents in GEB - particularly HBA, GAS, and parishin derivatives - demonstrate multifunctional bioactivities encompassing mitochondrial apoptosis inhibition, antidepressant effects, and marked anti-inflammatory efficacy, constituting the principal pharmacologically active components underlying GEB’s therapeutic actions (Jiang et al., 2014; Zhang et al., 2012). The complete phytochemical inventory with structural annotations is provided in Table 1.
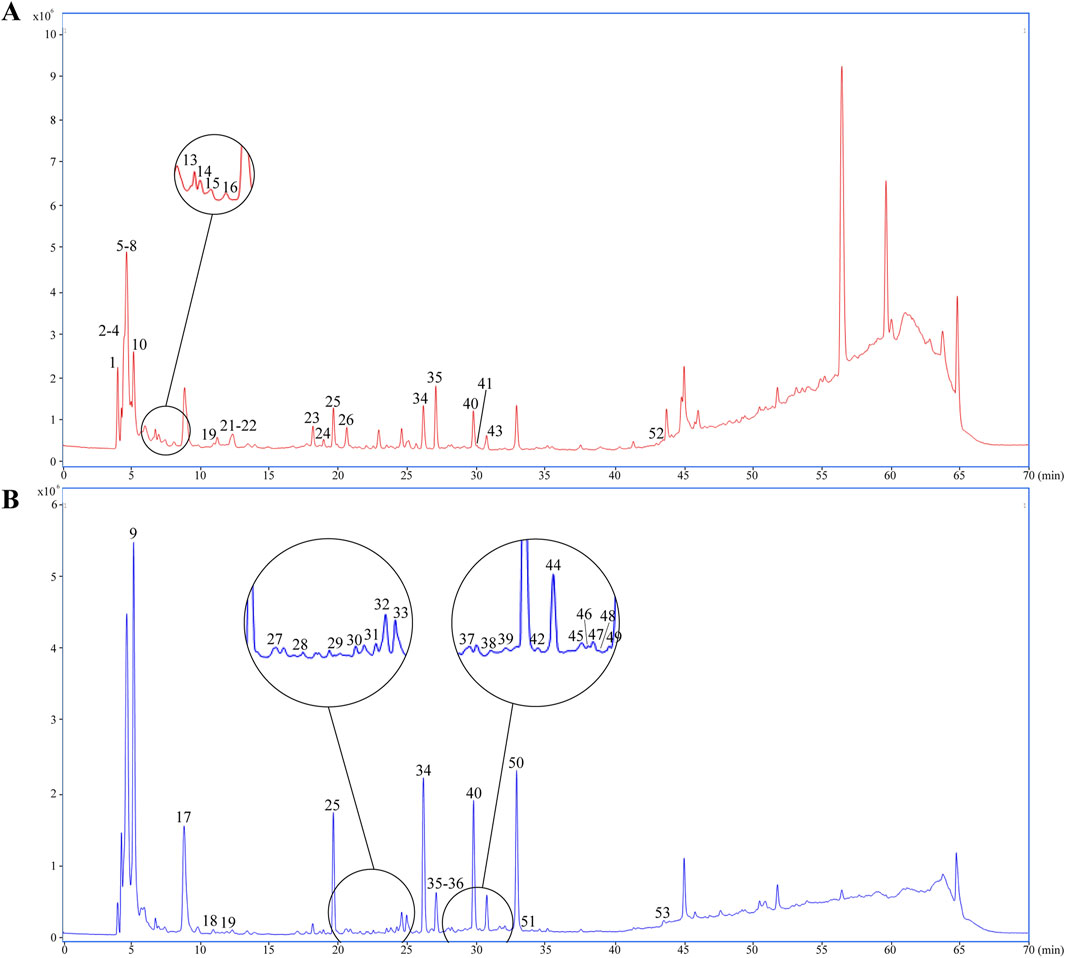
Figure 4. Dentification of chemical composition in GEB extract by UPLC-Q-TOF-MS. (A) Plot of the TIC in positive ion mode. (B) Plot of the TIC in negative ion mode.
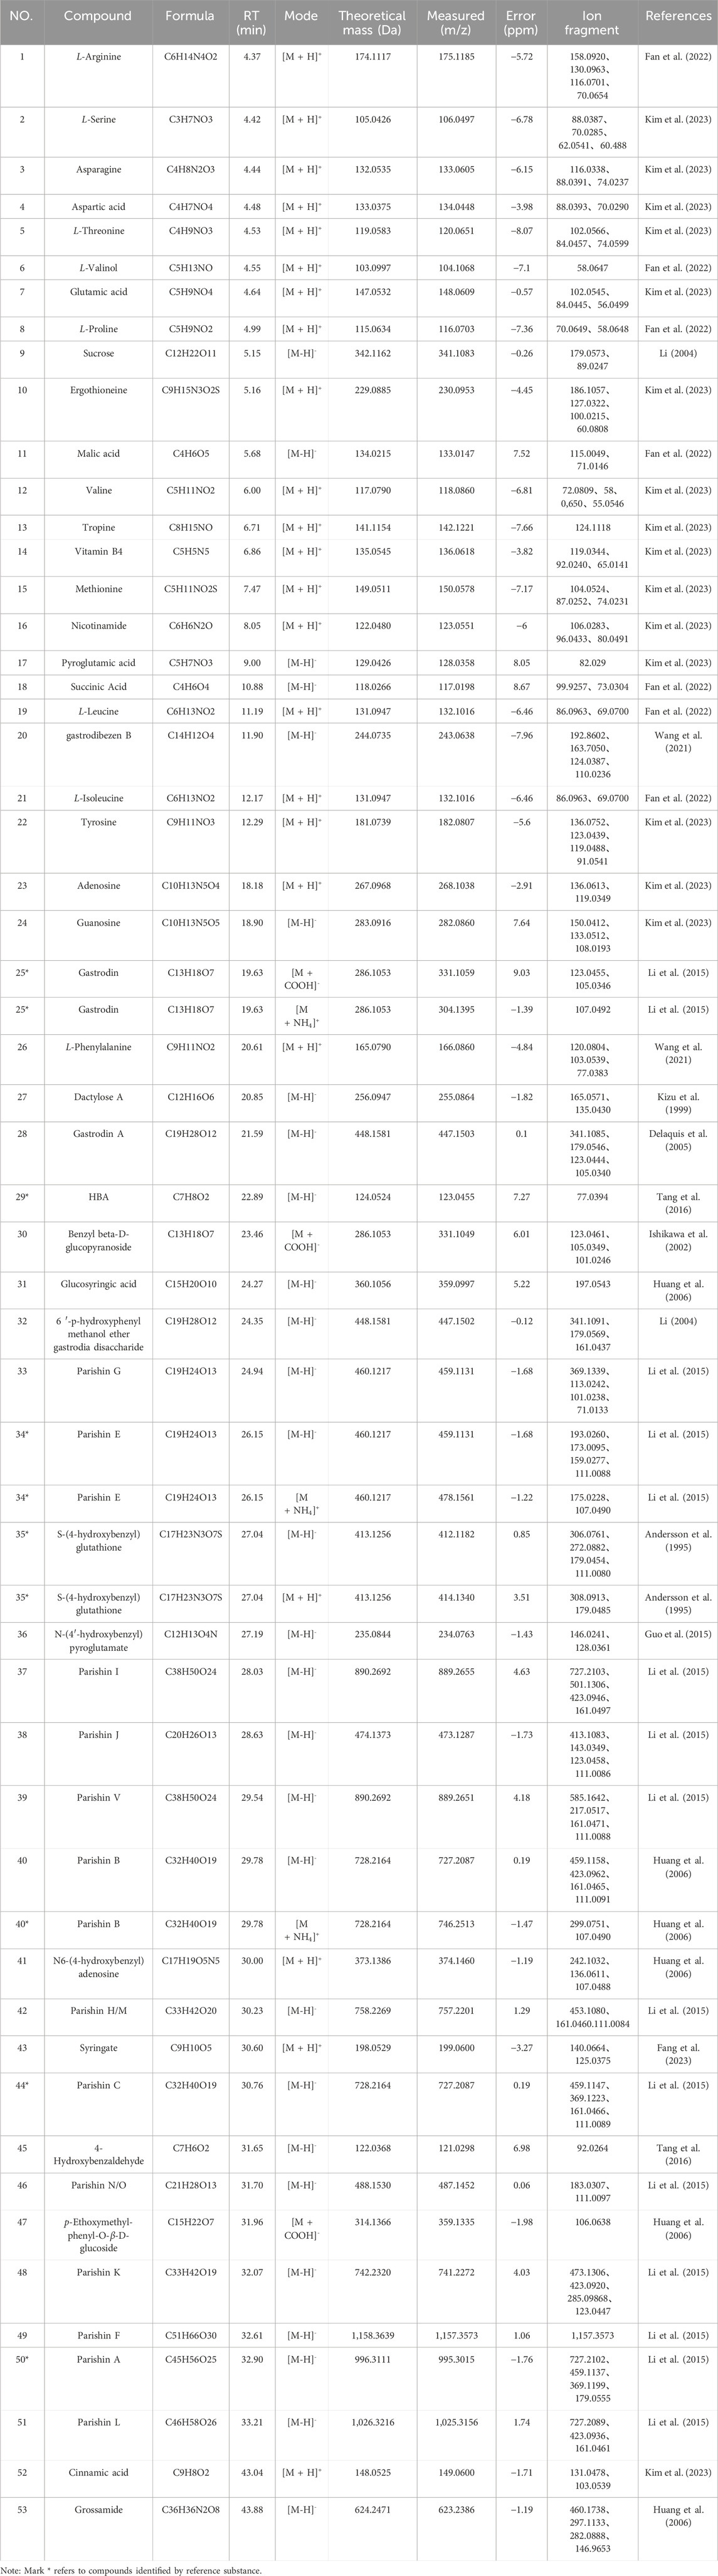
Table 1. Details of GEB extract compounds.
3.3 Identification of components in rat plasma and brain tissue
UPLC-Q-TOF-MS analysis in negative ion mode was systematically employed to detect prototypical components of GEB in plasma and cerebral tissues of dosed versus control rats. Six intact phytochemicals—PA, PB, PC, PE, GAS, and 4-HBG—were unequivocally identified through characteristic adducts, with chromatographic and spectral consistency against reference standards. As illustrated by the extracted ion chromatograms (EICs) plots in Figure 5, all identifications were validated via retention time alignment and MS/MS spectral matching, forming the foundation for subsequent pharmacokinetic and cerebral biodistribution studies.
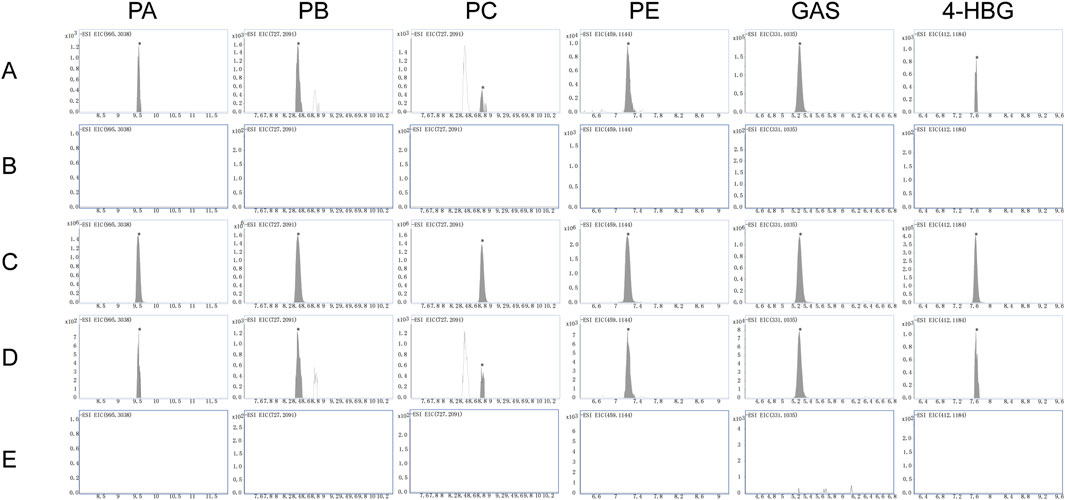
Figure 5. EICs plots in negative ion mode: (A,B) Plasma from rats treated with GEB extract versus vehicle-treated control rats. (C) Standard reference materials for various compounds. (D,E) Brain tissue from rats treated with GEB extract versus vehicle-treated control rats.
3.4 Method validation
For the methodological validation, the sensitivity, linearity, specificity, matrix effect, precision, accuracy, and stability of the method were comprehensively assessed. The data revealed that the method was reliable, stable, and suitable for pharmacokinetics and brain tissue distribution analysis.
3.4.1 Specificity
The MRM chromatograms of blank matrix plasma spiked with standard mixed standard material, blank matrix plasma, rat plasma, blank matrix brain tissue, and brain tissue spiked with standard mixed standard material 1 h after administrating GEB extract are shown in Figure 6. No interference peaks were observed from endogenous components near the retention time for the six selected compounds and IS. These data showed that the analyte had good specificity in rat plasma and brain tissue.
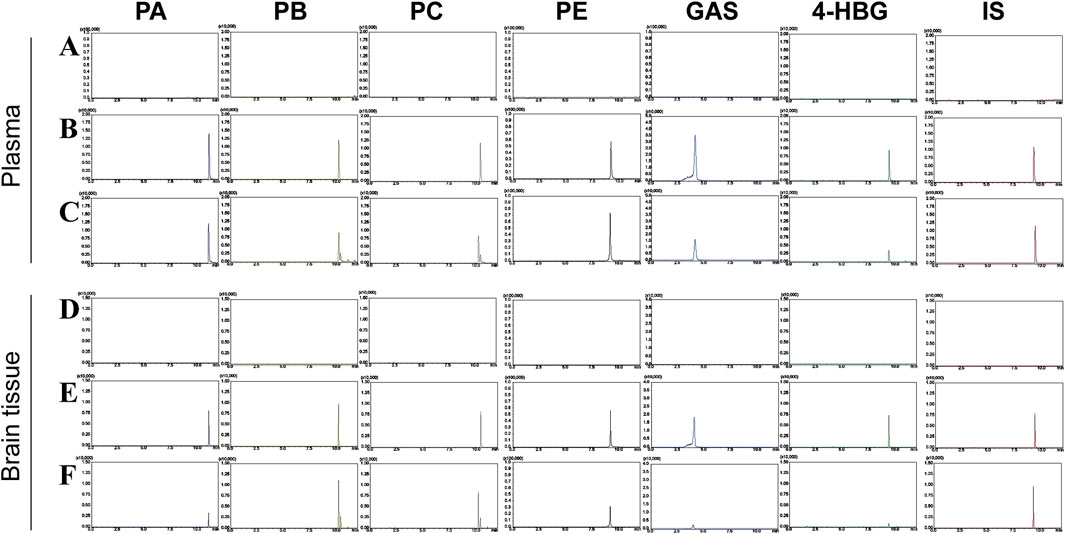
Figure 6. MRM chromatograms of PA, PB, PC, PE, GAS, 4-HBG, and IS under negative ion conditions. (A) blank matrix plasma; (B) blank matrix plasma spiked with mixed reference materials; (C) rat plasma 1h after GEB extract administration; (D) blank matrix brain tissue; (E) brain tissue spiked with the mixed reference material; (F) brain tissue of rats at 1 h after administration of GEB extract.
3.4.2 Linearity and lower limits of quantitation (LLOQ)
Equations for correlation coefficients, calibration curves, and lower limits of quantification for PA, PB, PC, E, GAS, and 4-HBG in brain tissue and plasma are shown in Table 2. Furthermore, excellent linearity was observed over the concentration range of all biological samples with a correlation coefficient (r2) > 0.99.
Table 2. The regression equation, linear range, r2, and LLOQ of six analytes in plasma and brain tissue (n = 6).
3.4.3 Accuracy and precision
The intra- and inter-day precision of plasma samples was 93.25%–110.32% and 85.24%–109.81%, respectively, while that of the brain tissue samples was 91.99%–108.94% and 85.56%–107.09%, respectively (Table 3). The RE and RSD were within the acceptable standard range, indicating that the brain tissue and plasma samples had good stability and the analytical method had good repeatability.
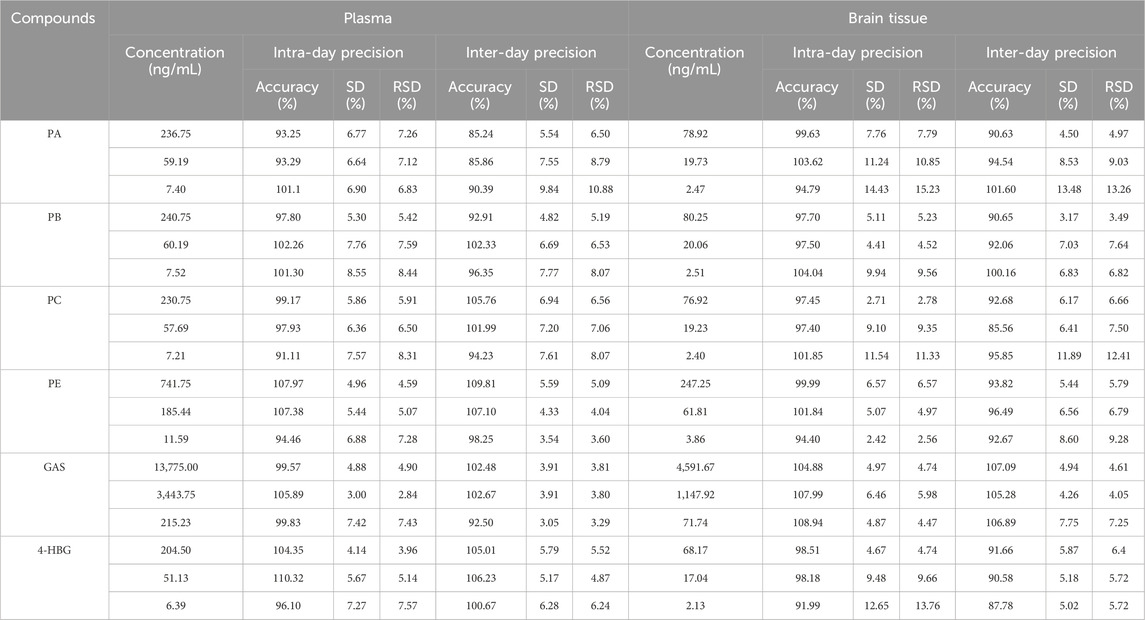
Table 3. Intra-day and inter-day precision of PA, PB, PC, PE, GAS, and 4-HBG in plasma and brain tissue (n = 6).
3.4.4 Recovery and matrix effect
The matrix effect of all plasma samples ranged between 86.26% and 114.26%, while that of the brain samples ranged from 91.58% to 112.50%. Furthermore, their RE and RSD were within the acceptable standard range. Moreover, the endogenous substances in both plasma and brain tissue samples did not significantly affect the ionization efficiency of the analyte (Table 4).
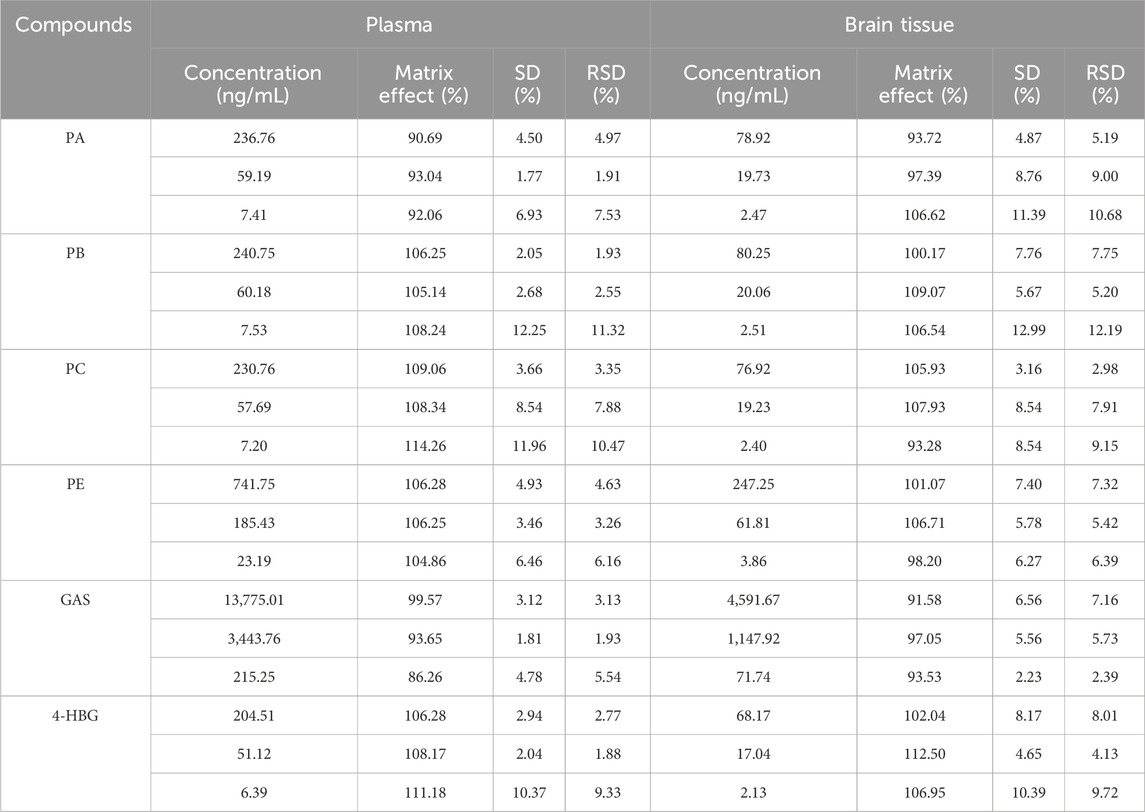
Table 4. Matrix effects of PA, PB, PC, PE, GAS, and 4-HBG in Plasma and Brain tissue (n = 6).
The recovery of all plasma samples ranged between 96.23% and 108.77%, whereas that of the brain tissue sample was between 96.57% and 106.51%. Their RE and RSD were within the acceptable standard range, suggesting that plasma and brain tissue analysis results had a certain reliability (Table 5).
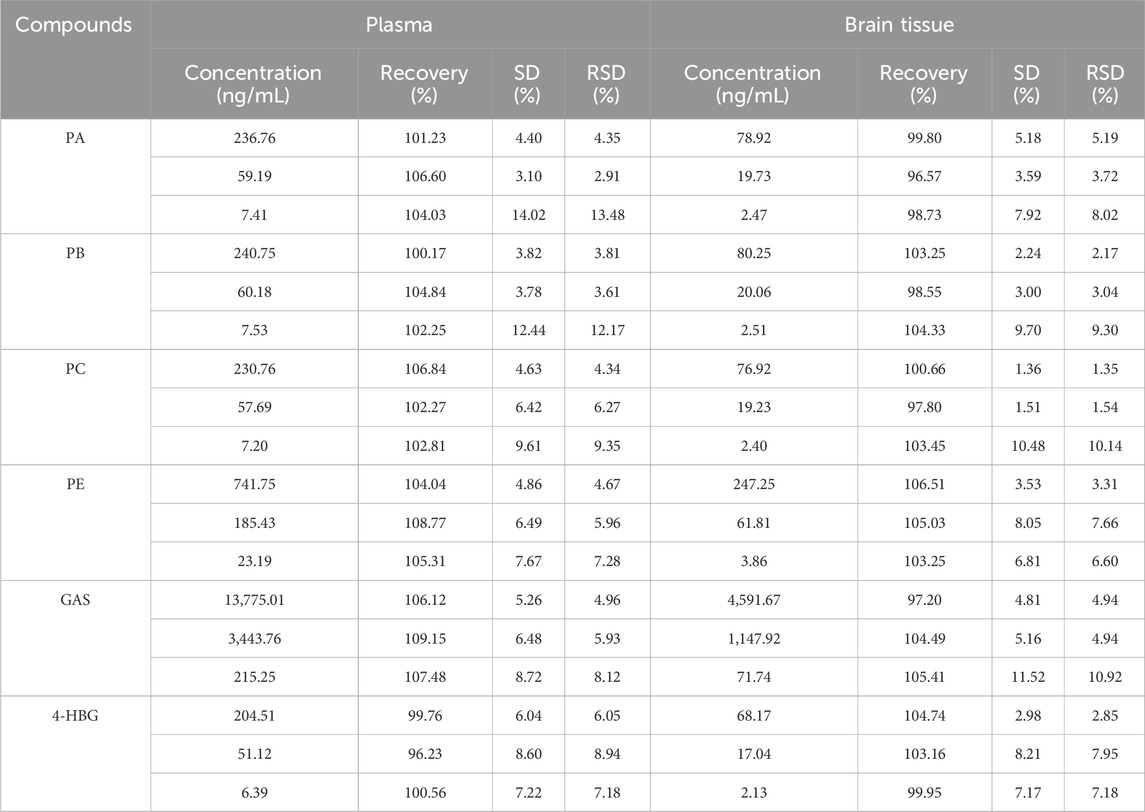
Table 5. Recovery of PA, PB, PC, PE, GAS, and 4-HBG in plasma and brain tissue (n = 6).
3.4.5 Stability
Table 6 summarizes the stability results. The RSD of plasma and brain tissue samples after 1 month of storage at −80°C and 3 freeze-thaw cycles at −80°C was less than ± 15.0%. These results suggested that the 6 components were stable in brain tissue and plasma under different conditions (Table 6).
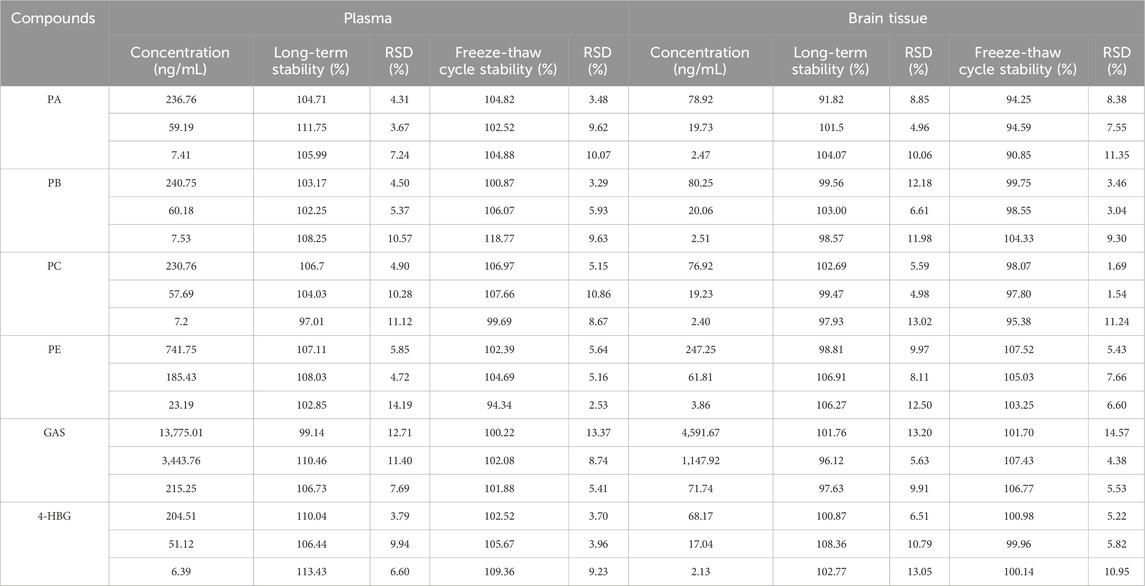
Table 6. Stability of PA, PB, PC, PE, GAS, and 4-HBG in plasma and brain tissue (n = 6).
3.5 Pharmacokinetics of GEB extract in normal and MCAO rats
Pharmacokinetic profiling of six GEB-derived compounds (PA, PB, PC, PE, GAS, 4-HBG) was conducted via non-compartmental analysis following oral administration (Figure 7; Table 7). GAS, recognized as a principal bioactive constituent, demonstrated the highest systemic exposure in both normal and MCAO rats (AUC0-t: 6,620 ± 365 vs. 4,836 ± 791 ng*h/mL; Cmax: 6,620 ± 392 vs. 4,646 ± 1,195 ng/mL, p < 0.05), followed by PE, PB, PA, and PC. All compounds exhibited rapid absorption (Tmax < 2.5 h) and short elimination half-lives (T1/2 < 4 h), indicating favorable in vivo disposition kinetics. Notably, MCAO rats showed significantly reduced exposure parameters (AUC0-
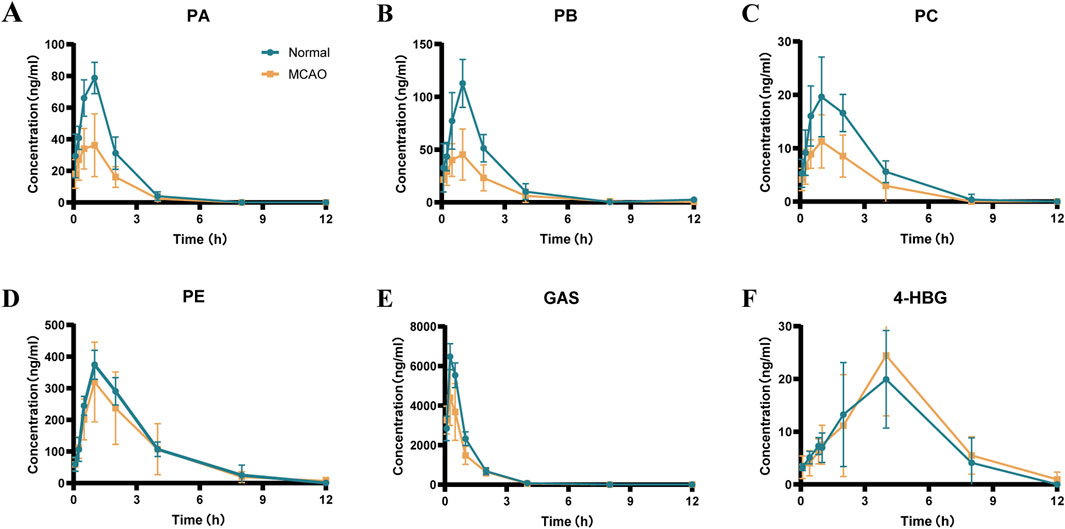
Figure 7. Mean plasma concentration-time curves of the 6 components in normal and MCAO rats after oral administration of GEB extract (mean ± SEM, n = 8). Blue represents normal rats and orange represents MCAO rats. n = 8. (A) PA, (B) PB, (C) PC, (D) PE, (E) GAS, (F) 4-HBG.
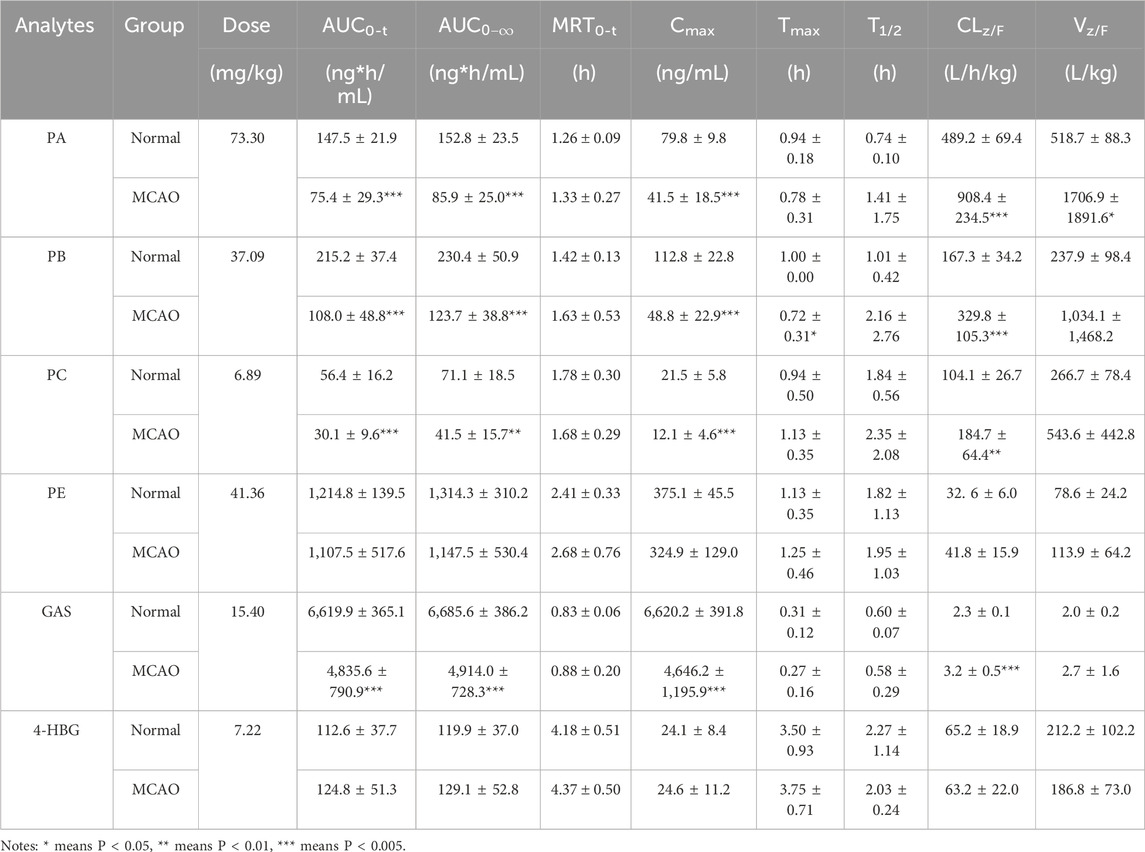
Table 7. Pharmacokinetic parameters of six analytes in normal and MCAO rats after administration of GEB extract at the dosage of 4.8 g/kg (n = 8).
The novel glutathione conjugate 4-HBG displayed distinct absorption kinetics (Tmax 2.3 ± 1.1 vs. 2.03 ± 0.2 h) without inter-group variation (AUC0-t 120 ± 37 vs. 129 ± 53 ng*h/mL, p > 0.05). This delayed absorption profile aligns with its structural complexity as a p-hydroxybenzyl-glutathione adduct. Mechanistically, 4-HBG’s neuroprotective efficacy against glutamate excitotoxicity has been attributed to competitive inhibition of kainate receptor binding (Andersson et al., 1995), corroborating its therapeutic potential despite moderate systemic exposure.
3.6 Brain tissue distribution of GEB extract in normal and MCAO rats
Cerebral distribution analysis revealed distinct patterns of six GEB-derived compounds (PA, PB, PC, PE, GAS, 4-HBG) between normal and MCAO rats following oral administration (Figure 8). In normophysiological conditions, GAS exhibited limited BBB penetrability (<40 ng/mL cerebral concentration), with all compounds peaking within 0.5–1 h post-dosing. In contrast, ischemic pathophysiology significantly enhanced BBB permeability, resulting in 1.8–12.9-fold higher cerebral concentrations of all analytes in MCAO rats compared to controls (p < 0.01). Notably, sustained cerebral retention was observed in MCAO cohorts, with measurable PE (4.25 ± 2.46 ng/g) concentrations persisting at 12 h—a timepoint when these components were undetectable in normal brains (<LLOQ). This ischemia-facilitated cerebral sequestration of bioactive constituents provides direct pharmacological evidence supporting their roles as critical mediators of GEB’s therapeutic effects against ischemic injury (Wang et al., 2008).
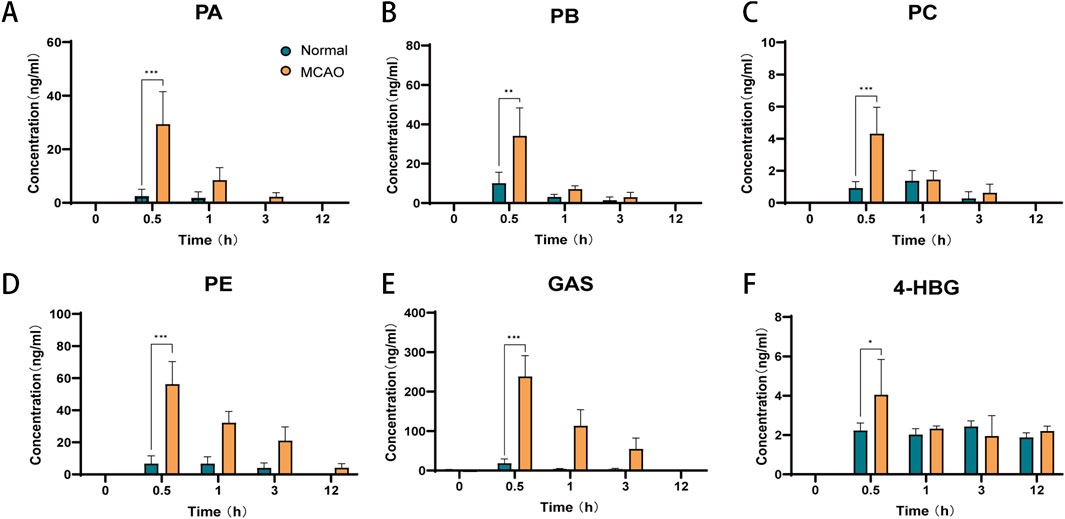
Figure 8. Brain tissue distribution of six components of GEB extract after oral administration in normal and cerebral infarction rats (mean ± SEM, n = 6). Blue represents normal rats and orange represents MCAO rats. *P < 0.05, **P < 0.01, ***P < 0.005. n = 6. (A) PA, (B) PB, (C) PC, (D) PE, (E) GAS, (F) 4-HBG.
3.7 Xenobiotic metabolite distribution in normal and MCAO rats
Pharmacokinetic data showed that both PA and GAS exhibited measurable exposure in rats, while the concentration of their terminal hydrolysis product HBA was very low. To determine whether this phenomenon resulted from the slow metabolic conversion of GAS to HBA or rapid metabolism of HBA below detectable limits, this study systematically investigated the complete metabolic pathway from PA to HBA. Furthermore, given the pivotal role of xenobiotic metabolites in drug metabolism, elucidating their dynamics is crucial for understanding the pharmacological, toxicological, and physiological effects of drugs in vivo.
Exogenous compounds are absorbed into the body and undergo stepwise metabolic pathways that produce precise changes in mass numbers. Theoretically, the metabolites of a compound can be predicted because most metabolic reactions, such as reduction, oxidation, deglycosylation, hydroxylation, and sulfonation coupling, are well-known (Gong et al., 2012). This investigation evaluated all possible metabolic processes based on the characteristics of the series of compounds that undergo stepwise hydrolysis from PA to HBA (4-HBG is not included because it is not obtained through stepwise hydrolysis of PA). Furthermore, a xenobiotic metabolic patterns database of all the compounds contained in PA to HBA was established in sequence (Supplementary Table S4).
Plasma and brain tissue samples were analyzed by UPLC-QTOF-MS in negative ion mode to obtain detailed mass spectral data. Peak extraction was carried out using MassHunter Profinder software B.10.0, and data were saved in as. csv format. The PCA analysis revealed certain regularity in the changes in the rat’s plasma components (Supplementary Figure S1). Furthermore, using the R software, metabolic patterns database and digitized mass spectrometry data were matched to obtain the metabolic data of the compounds (R code is provided in the Supplementary Material). Using MassHunter qualitative analysis software, nine exogenous metabolites were identified by correlating fragment ion m/z values with fragmentation patterns, four of which were detected in brain tissue (The EIC plots of the administered and blank samples are shown in Supplementary Figures S2–S3. Retention times of potential metabolites, fragment ions, and proposed fragmentation pathways are shown in Supplementary Figures S4–S12). Figure 9A shows the specific xenobiotic metabolites detected in rat plasma after stepwise hydrolysis from PA to HBA.
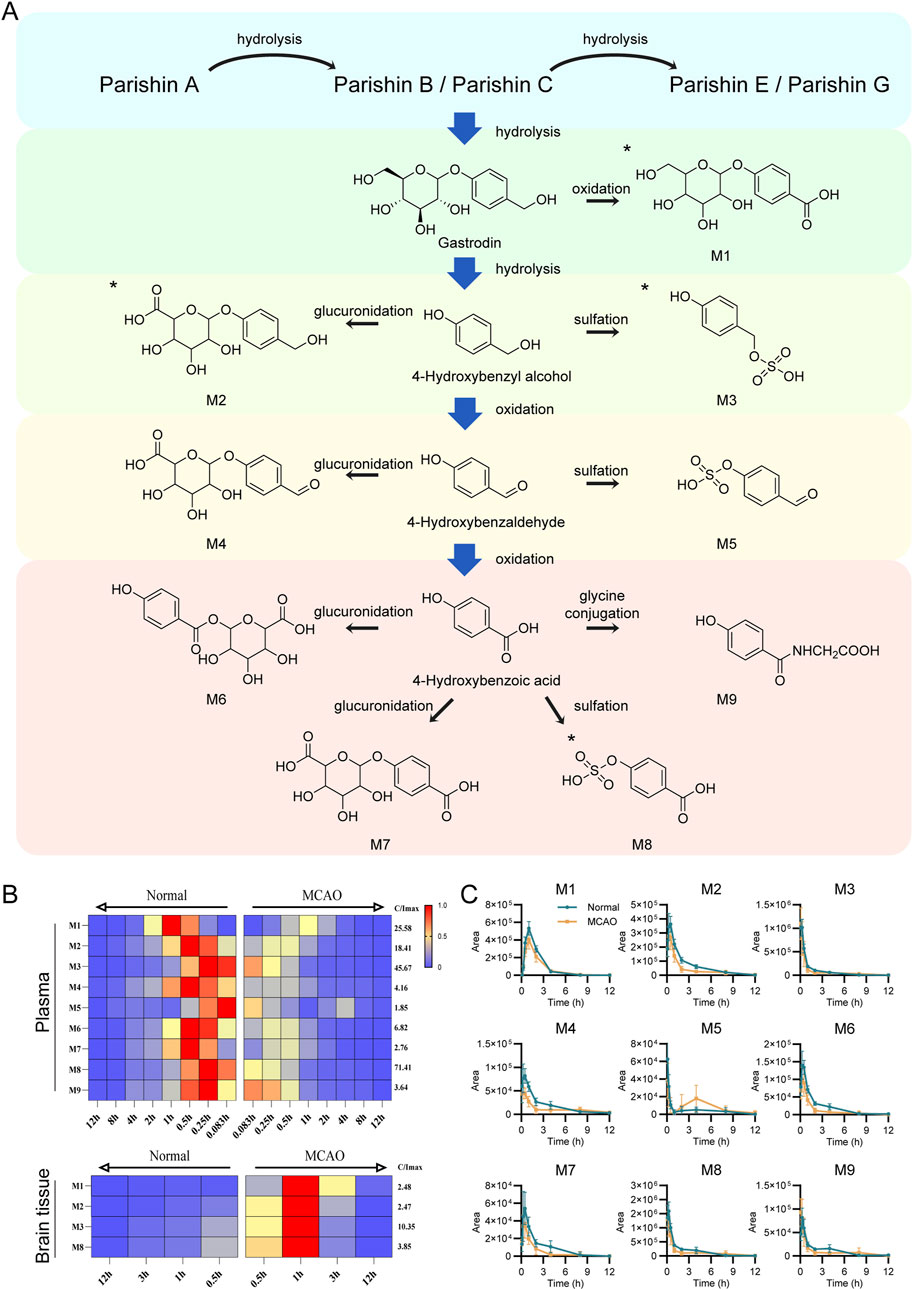
Figure 9. Identification of validated xenobiotic metabolites in Normal and MCAO model rats after oral administration of GEB extract. (A) Sequential hydrolysis and metabolic pathways of xenobiotic metabolites from PA to HBA. All metabolites were detected in plasma, with those identified in brain tissue marked by asterisks (*). (B) Time-dependent heatmap visualization of xenobiotic metabolites in plasma (n = 8) and brain tissue (n = 6). Data were normalized to the internal standard (IS) and expressed as relative abundance. The maximum value is set to red, the minimum to blue, and intermediate values to yellow (maximum intensity scale shown on the right). Normal rats and MCAO rats are positioned on the left and right sides, respectively. The x-axis utilizes mirrored time scales to facilitate horizontal comparison between groups. The y-axis displays the distinct types of identified xenobiotic metabolites. (C) Comparative peak area profiles of nine xenobiotic metabolites in plasma between Normal and MCAO groups.
It was observed that parishin-type compounds metabolism mainly includes hydrolysis and is eventually excreted as GAS or HBA metabolites. Given the minimal HBA levels alongside substantial xenobiotic metabolites detected in rats, we hypothesize that partial hydrolysis of GAS to HBA may occur, but HBA is rapidly cleared in vivo, resulting in concentrations below the limit of detection. Due to pathological changes in the metabolism of MCAO rats, the relative content of xenobiotic metabolites was lower, and the peak value and metabolic rate of xenobiotic metabolites were faster relative to the normal rats (Figures 9B,C). In the MCAO rat’s brain tissue, the peak areas of 4 xenobiotic metabolites were higher than those in normal rats (Supplementary Figure S13). This result was consistent with the distribution of the parent products, suggesting that the corresponding xenobiotic metabolites had a considerable distribution in the brain after cerebral ischemia.
4 Discussion
Pathophysiological alterations, including dysregulated tissue pH and inflammatory mediator infiltration, profoundly modify drug disposition through dual mechanisms: (1) physicochemical modulation of blood/tissue barriers affecting membrane permeability; and (2) functional impairment of metabolic enzymes and transport systems. These changes collectively perturb drug absorption, distribution, metabolism, and excretion (ADME) processes. Under cerebral ischemia-reperfusion conditions, drug distribution patterns are significantly altered, whether due to compromised gastrointestinal absorption capacity, impaired renal metabolic function, or altered permeability resulting from cerebral edema. The spatiotemporal distribution of bioactive compounds in target organs directly determines their pharmacological effects. Therefore, investigating the pharmacokinetic differences of the GEB extract between normal and cerebral ischemia rat models is crucial for elucidating its mechanism of action and optimizing its clinical translation.
Building upon the methodological foundation established for characterizing GEB’s constituents and metabolites, and given the well-documented neuroprotective efficacy of GEB in both traditional use and modern pharmacology, it is imperative to understand the pharmacokinetic behavior of its key bioactive components under pathological conditions to elucidate their contribution to the overall therapeutic outcome. Our previous studies demonstrated that Gastrodia elata extract exhibits therapeutic effects against CIRI, with the GEB-H showing significantly superior efficacy to the GEB-L; based on these findings, this study developed a sensitive UPLC-Q-TOF-MS method for detailed characterization of GEB extracts, identifying 53 constituents and prioritizing six bioactive parent compounds (PA, PB, PC, PE, GAS, 4-HBG) for pharmacokinetic evaluation. A validated UPLC-QQQ-MS method enabled precise quantification of these analytes in plasma and brain tissues over 12 h post-administration, with all six target analytes achieving quantitation at ng/mL levels in plasma and ng/g levels in brain tissue. Notably, we pioneered an R-based computational pipeline integrating metabolic pattern prediction (±10 ppm mass accuracy) and spectral matching, successfully identifying nine xenobiotic metabolites—four exhibiting cerebral distribution—thereby establishing a methodological foundation for elucidating GEB’s in vivo pharmacological xenobiotic mechanisms.
GEB has been empirically employed in traditional medicine for centuries to treat neurological disorders such as depression and insomnia, with its therapeutic efficacy validated through historical and modern pharmacological studies (Zhou et al., 2024). Contemporary research reveals a complex phytochemical profile comprising multiple bioactive constituents that synergistically mediate neuroprotective effects. GAS exerts anti-apoptotic activity in glutamate-challenged neuronal cells by suppressing the CaMKII/ASK-1/p38 MAPK/p53 signaling cascade, reducing oxidative stress and mitochondrial dysfunction (Jiang et al., 2014). N6-(4-Hydroxybenzyl)adenosine enhances GABAergic neurotransmission through adenosine receptor activation, contributing to sedative-hypnotic effects (Zhang et al., 2012). PC ameliorates depressive behaviors by modulating hypothalamic-pituitary-adrenal axis hyperactivity and neurotransmitter balance (Jiang et al., 2024). HBA preserves neural function under ischemic conditions via NMDA-CREB-BDNF pathway modulation (Xiao et al., 2024). Additionally, polybenzyl ether derivatives such as 2,4-bis(4-hydroxybenzyl)phenol demonstrate potent melatonin receptor agonism, further contributing to sedative-hypnotic efficacy (Chen et al., 2019). While biphenyl compounds were undetected in our extracts—potentially due to geographical or processing variations—the identified bioactive components collectively underpin GEB’s neuropharmacological outcomes (Lai et al., 2016).
The pharmacokinetic characterization revealed six primary bioactive components in systemic circulation following GEB extract administration: PA, PB, PC, PE, GAS, and 4-HBG. Notably, HBA—the terminal hydrolysis product of both parishin and GAS—was excluded from pharmacokinetic analysis due to its subtherapeutic plasma concentrations. This phenomenon is likely primarily attributable to HBA’s rapid metabolic conversion via phase II reactions (sulfation/glucuronidation), as strongly suggested by the abundant HBA-derived metabolites detected in biological matrices. While insufficient precursor availability cannot be entirely ruled out as a potential contributing factor, (Lin et al., 2008),- (Zhang et al., 2008), the observed metabolite abundance indicates that extensive phase II metabolism is a dominant driver of the low circulating HBA concentrations. Comparative pharmacokinetic analysis demonstrated distinct disposition patterns among components: GAS exhibited the highest systemic exposure (AUC
The metabolic fate of xenobiotics exhibits considerable predictability due to well-characterized biotransformation pathways (Ma et al., 2023). Parent compounds undergo structural modifications during metabolism, manifesting as diagnostic mass shifts detectable through high-resolution mass spectrometry. In this investigation, we constructed a hierarchical metabolic database encompassing sequential hydrolysis products along the PA→HBA transformation axis. Leveraging R-based computational algorithms, we developed a mass defect-driven matching strategy (± 10 ppm tolerance), enabling successful identification of nine xenobiotic metabolites in vivo. Furthermore, we propose that parishin, the predominant phenolic compound in Gastrodia elata, undergoes stepwise hydrolysis to GAS and HBA, followed by metabolic elimination from the body. This integrative approach demonstrates enhanced capability in resolving complex metabolic networks (Wang et al., 2022), and the above results provide a reference for further studies on efficacy evaluation, quality control, and rational use of drugs.
5 Conclusion
This study characterized the pharmacokinetics and cerebral distribution of bioactive compounds from GEB in CIRI. We identified 53 constituents, with six parent compounds (PA, PB, PC, PE, GAS, 4-HBG) achieving systemic and brain exposure. CIRI significantly increased BBB permeability, leading to markedly enhanced cerebral accumulation of all analytes despite reduced plasma levels for most, suggesting their role in GEB’s efficacy.
We innovatively mapped the metabolic pathway from PA to HBA and generated a precise theoretical xenobiotic metabolite database using R programming. This identified nine phase I/II metabolites, four of which showed enhanced cerebral distribution in ischemia. This is the first systematic elucidation of GEB’s in vivo metabolic fate, detailing the transformation from parishin-type precursors to terminal phenolic metabolites.
These findings establish the pharmacokinetic and metabolic basis for GEB’s therapeutic effects against CIRI. The identified parent compounds and metabolites collectively form GEB’s pharmacodynamic substance basis. The developed methodology provides a robust framework for herbal medicine quality control and metabolic research, laying essential groundwork for further development of GEB-based therapies.
Data availability statement
The original contributions presented in the study are included in the article/Supplementary Material, further inquiries can be directed to the corresponding authors.
Ethics statement
The animal study was approved by Institutional Animal Care and Use Committee, Zhejiang Center of Laboratory Animals. The study was conducted in accordance with the local legislation and institutional requirements.
Author contributions
JS: Validation, Methodology, Writing - original draft, Writing - review and editing, Formal Analysis, Investigation, Visualization. QX: Validation, Writing - review and editing, Writing - original draft. YL: Methodology, Investigation, Writing - original draft, Writing - review and editing. TD: Writing - review and editing, Writing - original draft, Formal Analysis. XH: Writing - original draft, Software, Writing - review and editing. BC: Writing - review and editing, Project administration, Writing - original draft. QS: Writing - review and editing, Funding acquisition, Conceptualization, Writing - original draft. CF: Writing - review and editing, Project administration, Writing - original draft. HY: Writing - original draft, Supervision, Writing - review and editing.
Funding
The author(s) declare that financial support was received for the research and/or publication of this article. This study was supported by the Zhejiang Provincial Natural Science Foundation (TGD24C040023), Research projects of Hangzhou Medical College (KYZD202102) and Zhejiang Provincial Drug Regulatory Science and Technology Plan Project (2023015).
Acknowledgments
The authors wish to acknowledge Liwei, Laboratory Animal Center of Zhejiang University, for her assistance in animal experiments.
Conflict of interest
The authors declare that the research was conducted in the absence of any commercial or financial relationships that could be construed as a potential conflict of interest.
Generative AI statement
The author(s) declare that no Generative AI was used in the creation of this manuscript.
Publisher’s note
All claims expressed in this article are solely those of the authors and do not necessarily represent those of their affiliated organizations, or those of the publisher, the editors and the reviewers. Any product that may be evaluated in this article, or claim that may be made by its manufacturer, is not guaranteed or endorsed by the publisher.
Supplementary material
The Supplementary Material for this article can be found online at: https://www.frontiersin.org/articles/10.3389/fphar.2025.1624576/full#supplementary-material
Abbreviations
AUC, Area under curve; CE, Collision energy; CLz/F: Clearance rectified by bioavailability; EIC, Extracted ion chromatogram; GAS, Gastrodin; HBA, 4-Hydroxybenzyl alcohol; IS, Internal standard; LOD, Limit of detection; LLOQ, Lower limit of quantitation; MCAO, Middle Cerebral Artery Occlusion; mNSS, Modified neurological severity score; MRT, Mean resident time; NMDP, Nimodipine; PA, Parishin A; PB, Parishin B; PC, Parishin C; PE, Parishin E; Tmax, Time to reach the maximum concentration; T1/2, Elimination half-life; Vz/F, Apparent volume of distribution rectified by bioavailability; 4-HBG, S-(4-Hydroxybenzyl) Glutathione.
References
Andersson, M., Bergendorff, O., Nielsen, M., Sterner, O., Witt, R., Ai, J., et al. (1995). Inhibition of kainic acid binding to glutamate receptors by extracts of gastrodia. Phytochemistry 38 (4), 835–836. doi:10.1016/0031-9422(94)00771-k
Chen, S.-Q. (2023). Flora of China Vol, twenty-fifth ed. Beijing & Missouri botanical garden. Beijing: Science Press.
Chen, S. Y., Geng, C. A., Ma, Y. B., Huang, X. Y., Yang, X. T., Su, L. H., et al. (2019). Polybenzyls from Gastrodia elata, their agonistic effects on melatonin receptors and structure-activity relationships. Bioorg. & Med. Chem. 27 (15), 3299–3306. doi:10.1016/j.bmc.2019.06.008
Cong, B. (2024). Perspectives in food & medicine homology. Food & Med. Homol. 1, 9420018. doi:10.26599/FMH.2024.9420018
Delaquis, P., Stanich, K., and Toivonen, P. (2005). Effect of pH on the inhibition of listeria spp. by vanillin and vanillic acid. J. food Prot. 68 (7), 1472–1476. doi:10.4315/0362-028x-68.7.1472
Fan, Y. L., Liu, R. Z., Tan, Q., Zhao, H. L., Song, M., Wang, R., et al. (2022). A database-guided integrated strategy for comprehensive chemical profiling of traditional Chinese medicine. J. Chromatogr. A 1674, 463145. doi:10.1016/j.chroma.2022.463145
Fang, X., Liu, Y., Xiao, J., Ma, C., and Huang, Y. (2023). GC-MS and LC-MS/MS metabolomics revealed dynamic changes of volatile and non-volatile compounds during withering process of Black tea. Food Chem. 410, 135396. doi:10.1016/j.foodchem.2023.135396
Feigin, V. L., and Owolabi, M. O.World StrokeOrganization–Lancet Neurology Commission Stroke Collaboration Group (2023). Pragmatic solutions to reduce the global burden of stroke: a world stroke organization-lancet neurology commission. Lancet. Neurology 22 (12), 1160–1206. doi:10.1016/S1474-4422(23)00277-6
Gong, M. Q., Lai, F. F., Chen, J. Z., Li, X. H., Chen, Y. J., and He, Y. (2024). Traditional uses, phytochemistry, pharmacology, applications, and quality control of Gastrodia elata blume: a comprehensive review. J. Ethnopharmacol. 319 (Pt 1), 117128. doi:10.1016/j.jep.2023.117128
Gong, P., Cui, N., Wu, L., Liang, Y., Hao, K., Xu, X., et al. (2012). Chemicalome and metabolome matching approach to elucidating biological metabolic networks of complex mixtures. Anal. Chem. 84 (6), 2995–3002. doi:10.1021/ac3002353
Guo, Q., Wang, Y., Lin, S., Zhu, C., Chen, M., Jiang, Z., et al. (2015). 4-Hydroxybenzyl-substituted amino acid derivatives from Gastrodia elata. Acta Pharm. Sin. B 5 (4), 350–357. doi:10.1016/j.apsb.2015.02.002
Guo, Z., Yu, S., Chen, X., Ye, R., Zhu, W., and Liu, X. (2016). NLRP3 is involved in ischemia/reperfusion injury. CNS & neurological Disord. drug targets 15 (6), 699–712. doi:10.2174/1871527315666160321111829
Huang, Z. B., Wu, Z., Chen, F. K., and Zou, L. B. (2006). The protective effects of phenolic constituents from Gastrodia elata on the cytotoxicity induced by KCl and glutamate. Archives pharmacal Res. 29 (11), 963–968. doi:10.1007/BF02969279
Ishikawa, T., Kudo, M., and Kitajima, J. (2002). Water-soluble constituents of dill. Chem. & Pharm. Bull. 50 (4), 501–507. doi:10.1248/cpb.50.501
Jiang, G., Wu, H., Hu, Y., Li, J., and Li, Q. (2014). Gastrodin inhibits glutamate-induced apoptosis of PC12 cells via inhibition of CaMKII/ASK-1/p38 MAPK/p53 signaling cascade. Cell. Mol. Neurobiol. 34 (4), 591–602. doi:10.1007/s10571-014-0043-z
Jiang, N., Yao, C., Zhang, Y., Chen, Y., Chen, F., Luo, Y., et al. (2024). Antidepressant effects of parishin C in chronic social defeat stress-induced depressive mice. J. Ethnopharmacol. 325, 117891. doi:10.1016/j.jep.2024.117891
Kim, S., Chen, J., Cheng, T., Gindulyte, A., He, J., He, S., et al. (2023). PubChem 2023 update. Nucleic acids Res. 51 (D1), D1373–D1380. doi:10.1093/nar/gkac956
Kizu, H., Kaneko, E. I., and Tomimori, T. (1999). Studies on nepalese crude drugs. XXVI. Chemical constituents of panch aunle, the roots of Dactylorhiza hatagirea D. Don. Chem. Pharm. Bull. 47 (11), 1618–1625. doi:10.1248/cpb.47.1618
Lai, C. J., Zha, L., Liu, D. H., Kang, L., Ma, X., Zhan, Z. L., et al. (2016). Global profiling and rapid matching of natural products using diagnostic product ion network and in silico analogue database: gastrodia elata as a case study. J. Chromatogr. A 1456, 187–195. doi:10.1016/j.chroma.2016.06.013
Li, N. (2004). Studies on chemical constituents of three medicinal plants of curculipa and Gastrodia elata. Ph.D. kunming institute of botany. Kunming, China: Chinese Academy of Sciences.
Li, Z., Wang, Y., Ouyang, H., Lu, Y., Qiu, Y., Feng, Y., et al. (2015). A novel dereplication strategy for the identification of two new trace compounds in the extract of Gastrodia elata using UHPLC/Q-TOF-MS/MS. J. Chromatogr. B, Anal. Technol. Biomed. life Sci. 988, 45–52. doi:10.1016/j.jchromb.2015.02.020
Lin, L. C., Chen, Y. F., Lee, W. C., Wu, Y. T., and Tsai, T. H. (2008). Pharmacokinetics of gastrodin and its metabolite p-hydroxybenzyl alcohol in rat blood, brain and bile by microdialysis coupled to LC-MS/MS. J. Pharm. Biomed. analysis 48 (3), 909–917. doi:10.1016/j.jpba.2008.07.013
Liu, F., Nong, X., Qu, W., and Li, X. (2023). Pharmacokinetics and tissue distribution of 12 major active components in normal and chronic gastritis rats after oral administration of weikangling capsules. J. Ethnopharmacol. 316, 116722. doi:10.1016/j.jep.2023.116722
Liu, W., Zeng, K., Zhou, X., Zhang, Y., and Nie, C. (2022). Comparative study on brain pharmacokinetics of buyang huanwu decoction in normal and cerebral ischemia rats using brain microdialysis combined with LC-MS/MS. Chin. Herb. Med. 14 (4), 630–637. doi:10.1016/j.chmed.2022.03.007
Lu, K. H., Ou, G. L., Chang, H. P., Chen, W. C., Liu, S. H., and Sheen, L. Y. (2020). Safety evaluation of water extract of Gastrodia elata blume: genotoxicity and 28-day oral toxicity studies. Regul. Toxicol. Pharmacol. RTP 114, 104657. doi:10.1016/j.yrtph.2020.104657
Lu, Y. Y., Chen, J. F., Song, J. Y., Du, Z. Y., Wang, J. L., Qian, Y., et al. (2019). Pharmacokinetics study of 16 representative components from baoyuan decoction in rat plasma by LC-MS/MS with a large-volume direct injection method. Phytomedicine Int. J. phytotherapy Phytopharm. 57, 148–157. doi:10.1016/j.phymed.2018.09.002
Ma, C., Sheng, N., Li, Y., Zheng, H., Wang, Z., and Zhang, J. (2023). A comprehensive perspective on the disposition, metabolism, and pharmacokinetics of representative multi-components of dengzhan shengmai in rats with chronic cerebral hypoperfusion after oral administration. J. Ethnopharmacol. 307, 116212. doi:10.1016/j.jep.2023.116212
Shi, Q. J., Xiao, L., Zhao, B., Zhang, X. Y., Wang, X. R., Xu, D. M., et al. (2012). Intracerebroventricular injection of HAMI 3379, a selective cysteinyl leukotriene receptor 2 antagonist, protects against acute brain injury after focal cerebral ischemia in rats. Brain Res. 1484, 57–67. doi:10.1016/j.brainres.2012.09.020
Sun-waterhouse, D. X., Chen, X. Y., Liu, Z. H., I.N. Waterhouse, G., and Kang, W. Y. (2024). Transformation from traditional medicine-food homology to modern food-medicine homology. Food & Med. Homol. 1, 9420014. doi:10.26599/FMH.2024.9420014
Tang, C., Wang, L., Liu, X., Cheng, M., and Xiao, H. (2015). Pharmacokinetic study of Gastrodia elata in rats. Anal. Bioanal. Chem. 407 (29), 8903–8910. doi:10.1007/s00216-015-9054-y
Tang, C., Wang, L., Liu, X., Cheng, M., and Xiao, H. (2016). Chemical fingerprint and metabolic profile analysis of ethyl acetate fraction of Gastrodia elata by ultra performance liquid chromatography/quadrupole-time of flight mass spectrometry. J. Chromatogr. B, Anal. Technol. Biomed. life Sci. 1011, 233–239. doi:10.1016/j.jchromb.2015.09.043
Wang, H., Tang, L., Hu, S., Kong, X., Ouyang, Y., Zhang, D., et al. (2024). Chemical profiling of shengmai injection, tissue distribution and pharmacokinetic characteristics of ginsenosides after intravenous dosing shengmai injection in rats with cerebral ischemia. J. Ethnopharmacol. 319 (Pt 1), 117119. doi:10.1016/j.jep.2023.117119
Wang, H. Y., Qu, C., Li, M. N., Li, C. R., Liu, R. Z., Guo, Z., et al. (2022). Time-series-dependent global data filtering strategy for mining and profiling of xenobiotic metabolites in a dynamic complex matrix: application to biotransformation of flavonoids in the extract of Ginkgo biloba by gut microbiota. J. Agric. food Chem. 70 (45), 14386–14394. doi:10.1021/acs.jafc.2c03080
Wang, Q., Chen, G., and Zeng, S. (2008). Distribution and metabolism of gastrodin in rat brain. J. Pharm. Biomed. analysis 46 (2), 399–404. doi:10.1016/j.jpba.2007.10.017
Wang, Q., Li, Z., Wang, D., Yang, S., and Feng, Y. (2020). Myocardial protection properties of parishins from the roots of Gastrodia elata Bl. Biomed. & Pharmacother. = Biomedecine & Pharmacother. 121, 109645. doi:10.1016/j.biopha.2019.109645
Wang, Y., Zhang, M., Zhou, X., Xu, C., Zhu, C., Yuan, Y., et al. (2021). Insight into medicinal chemistry behind traditional Chinese medicines: p-hydroxybenzyl alcohol-derived dimers and trimers from Gastrodia elata. Nat. Prod. bioprospecting 11 (1), 31–50. doi:10.1007/s13659-020-00258-w
Xiao, G., Tang, R., Yang, N., and Chen, Y. (2023). Review on pharmacological effects of gastrodin. Archives pharmacal Res. 46 (9-10), 744–770. doi:10.1007/s12272-023-01463-0
Xiao, T., Yu, X., Tao, J., Yang, L., and Duan, X. (2024). Metabolomics-based study of the protective effect of 4-Hydroxybenzyl alcohol on ischemic astrocytes. Int. J. Mol. Sci. 25 (18), 9907. doi:10.3390/ijms25189907
Xu, C., Feng, J., Sun, H., Yan, M., Yang, Q., Zhou, X., et al. (2024). Pharmacokinetics of 4-Hydroxybenzaldehyde in normal and cerebral ischemia-reperfusion injury rats based on microdialysis technique. Eur. J. drug metabolism Pharmacokinet. 49 (1), 23–32. doi:10.1007/s13318-023-00863-3
Xu, Y. M., Ding, G. H., Huang, J., and Xiong, Y. (2016). Tanshinone IIA pretreatment attenuates ischemia/reperfusion-induced renal injury. Exp. Ther. Med. 12 (4), 2741–2746. doi:10.3892/etm.2016.3674
Yu, S. S., Zhao, J., Zheng, W. P., and Zhao, Y. (2010). Neuroprotective effect of 4-hydroxybenzyl alcohol against transient focal cerebral ischemia via anti-apoptosis in rats. Brain Res. 1308, 167–175. doi:10.1016/j.brainres.2009.10.037
Zhang, W., Sheng, Y. X., and Zhang, J. L. (2008). Determination and pharmacokinetics of gastrodin and p-hydroxybenzylalcohol after oral administration of Gastrodia elata bl. extract in rats by high-performance liquid chromatography-electrospray ionization mass spectrometric method. Phytomedicine Int. J. phytotherapy Phytopharm. 15 (10), 844–850. doi:10.1016/j.phymed.2008.02.012
Zhang, Y., Li, M., Kang, R. X., Shi, J. G., Liu, G. T., and Zhang, J. J. (2012). NHBA isolated from Gastrodia elata exerts sedative and hypnotic effects in sodium pentobarbital-treated mice. Pharmacol. Biochem. Behav. 102 (3), 450–457. doi:10.1016/j.pbb.2012.06.002
Zhou, H. B., Lu, S. Z., Yu, Z. S., Zhang, J. L., and Mei, Z. N. (2024). Mechanisms for the biological activity of Gastrodia elata blume and its constituents: a comprehensive review on sedative-hypnotic, and antidepressant properties. Phytomedicine Int. J. phytotherapy Phytopharm. 123, 155251. doi:10.1016/j.phymed.2023.155251
Keywords: Gastrodia elata, cerebral ischemia, pharmacokinetics, brain tissue distribution, xenobiotic metabolite identification
Citation: Shao J, Xu Q, Luo Y, Dong T, Han X, Chen B, Ying H, Fang C and Shi Q (2025) Pharmacokinetics and brain tissue distribution of Gastrodia elata extract in normal and cerebral ischemic rats: a comparative study. Front. Pharmacol. 16:1624576. doi: 10.3389/fphar.2025.1624576
Received: 07 May 2025; Accepted: 07 July 2025;
Published: 31 July 2025.
Edited by:
Wenlong Sun, Shandong University of Technology, ChinaReviewed by:
Yinshi Sun, Chinese Academy of Agricultural Sciences, ChinaXiaotong Zhao, Cleveland State University, United States
Yang Shi, Hunan University, China
Oswaldo Hernández-Abreu, Universidad Juárez Autónoma de Tabasco, Mexico
Copyright © 2025 Shao, Xu, Luo, Dong, Han, Chen, Ying, Fang and Shi. This is an open-access article distributed under the terms of the Creative Commons Attribution License (CC BY). The use, distribution or reproduction in other forums is permitted, provided the original author(s) and the copyright owner(s) are credited and that the original publication in this journal is cited, in accordance with accepted academic practice. No use, distribution or reproduction is permitted which does not comply with these terms.
*Correspondence: Huazhong Ying, eWh6MDEwMUAxMjYuY29t; Cuifen Fang, ZmNmMDUwN0AxMjYuY29t; Qiaojuan Shi, MjAyMDAwMDE1NEBobWMuZWR1LmNu
†These authors have contributed equally to this work