 Miao Li
 Na Gao1†
 Lei Xu
 Peng Ge
 Nan Jiang
 Yuhong Shang
- 1Department of Obstetrics and Gynecology, The First Affiliated Hospital of Dalian Medical University, Dalian, China
- 2Department of General Surgery, The First Affiliated Hospital of Dalian Medical University, Dalian, China
Background: The natural compound paeonol exhibits therapeutic promise against cervical carcinoma, though its precise molecular mechanisms remain undefined.
Methods: First, we treated human cervical cancer (HeLa) cells with different concentrations of paeonol. Cellular proliferation and apoptotic responses were evaluated via cell-counting kit 8 (CCK8) assays and flow cytometric analysis. Subsequent transcriptomic profiling employed RNA sequencing coupled with alternative splicing assessment to detect differentially expressed genes (DEGs). Protein interaction networks were established for pivotal DEGs, followed by Gene Ontology (GO) and Kyoto Encyclopedia of Genes and Genomes (KEGG) pathway enrichment investigations. Clinical data pertinent to cervical cancer were retrieved from The Cancer Genome Atlas (TCGA). Prognostic model development incorporated Kaplan–Meier survival estimation, Least Absolute Shrinkage and Selection Operator (LASSO) regression, alongside univariate and multivariate COX proportional hazards analyses, with model accuracy subsequently assessed. Finally, Quantitative reverse transcription polymerase chain reaction (qRT-PCR) validated DEG expression.
Results: Paeonol treatment suppressed proliferation while inducing apoptosis in HeLa cells. Transcriptomic and splicing analyses revealed 12 critical DEGs: NLRP1, FN1, NQO2, NREP, B4GALNT1, ANK3, FAM219A, ODF3B, MAPK15, EPGN, MUC1, and MEG3. Enrichment analyses indicated these DEGs principally associate with inflammatory processes and the biological regulation of cellular proliferation and apoptotic death. Analysis of clinical outcomes in 197 TCGA patients demonstrated significantly enhanced five-year survival probability within the low-risk cohort. FN1, NQO2, and ODF3B were incorporated into a prognostic signature following LASSO regression. Univariate and multivariate COX analyses identified T stage, tumor grade, and differential expression of these three genes as significant outcome predictors; the resultant prognostic model exhibited robust accuracy. qRT-PCR results corroborated the RNA sequencing data concerning DEG expression patterns.
Conclusion: Paeonol modulates HeLa cell proliferation and apoptosis through regulation of 12 key genes, including FN1. This activity involves governing inflammatory responses alongside cellular proliferation, migration, and differentiation processes. These findings offer a theoretical foundation supporting paeonol’s potential clinical utility in cervical cancer management.
1 Introduction
Cervical carcinoma represents a prevalent malignancy affecting the female reproductive tract. Globally, its incidence constitutes the second most frequently diagnosed malignancy among women, surpassed only by breast cancer (Saei et al., 2018; Moore, 2006), and ranks fourth overall for female malignant neoplasms (Sharma et al., 2020). During 2020, approximately 604,127 new cervical cancer diagnoses occurred worldwide alongside 341,831 associated mortalities, reflecting an upward trajectory for both metrics (Singh et al., 2023). Within numerous developed nations, widespread implementation of Human Papillomavirus (HPV) vaccination programs coupled with routine screening has successfully diminished cervical cancer occurrence (Vu et al., 2018). Conversely, within many developing regions, incidence and mortality rates persistently escalate, necessitating novel therapeutic approaches. Current management strategies involve surgical intervention, radiotherapy, and chemotherapy, supplemented by second-line options including targeted agents and immunotherapies (Mauricio et al., 2021; Feng et al., 2020); these modalities, however, frequently incur adverse effects, substantial expense, and significant patient morbidity. Natural products have gained increasing attention in recent years as potential anti-neoplastic agents. Such compounds often offer advantages including multi-target activity, lower cost structures, and reduced adverse reaction profiles compared to conventional therapies (Naeem et al., 2022). Consequently, our investigation focuses on identifying novel natural product-derived therapeutics effective against this malignancy.
Alternative splicing (AS), or differential mRNA processing, denotes the mechanism generating varied mature transcript isoforms from precursor mRNAs. This process significantly expands proteomic diversity and functional complexity (Peng et al., 2022). Neoplastic cells frequently exhibit aberrant AS events yielding proteins that disrupt critical cellular functions—such as apoptotic regulation and cell cycle control—induce DNA damage, and consequently foster tumor initiation and progression. Furthermore, such aberrantly spliced isoforms can influence signaling pathways and drug targets, contributing to therapeutic resistance (Sciarrillo et al., 2020). Certain cancer-specific splicing variants possess utility as diagnostic biomarkers and potential therapeutic targets (Zhang et al., 2021). Cervical carcinogenesis may involve HPV-mediated dysregulation of splicing in normal cervical epithelia (Francies et al., 2021; Wu et al., 2018), motivating our search for agents capable of modulating pathological AS within cervical carcinoma cells.
Paeonol (2′-hydroxy-4′-methoxyacetophenone), a bioactive phenolic compound isolated from the dried root bark of Paeonia suffruticosa (Ranunculaceae family), demonstrates established anti-cancer properties. It suppresses malignant progression in breast, ovarian, and gastric carcinomas via mechanisms encompassing inhibition of neoplastic cell growth, induction of programmed cell death, cell cycle arrest, and modulation of diverse oncogenic signaling cascades (Sheng et al., 2021). In vitro studies confirm paeonol curbs proliferation, migration, and invasion capabilities of HeLa cervical cancer cells (Du et al., 2022), though its precise mechanistic underpinnings require elucidation; potential involvement of PI3K/AKT (Zhang et al., 2019), Nrf2/HO-1 (Hong et al., 2022), and JAK-STAT (Liu et al., 2023) signaling inhibition has been proposed. Additionally, paeonol reverses tumor cell resistance to chemotherapeutics like paclitaxel and cisplatin (Gao et al., 2019), enhances radiosensitivity, and synergistically suppresses HeLa cell proliferation when combined with cisplatin—likely through enhanced apoptotic induction (Han et al., 2016). Collectively, these findings underscore paeonol’s therapeutic promise for cervical cancer.
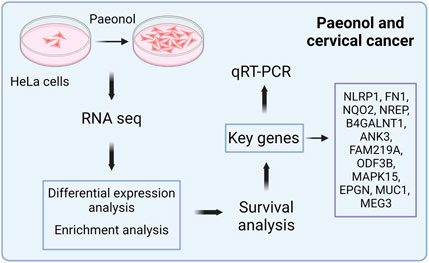
HeLa cells were treated with paeonol to evaluate its effects on cellular proliferation and apoptosis. Concurrently, transcriptomic profiling via high-throughput RNA sequencing (RNA-seq) was performed to discern potential molecular targets. Bioinformatics analyses were subsequently applied to cervical cancer clinical datasets sourced from The Cancer Genome Atlas (TCGA). Utilizing R software, survival analysis integrated these molecular signatures to establish a prognostic model, thereby evaluating paeonol’s translational potential. This integrated approach furnishes a molecular rationale supporting future clinical application of this compound.
2 Methods
2.1 Reagents
The following materials were utilized: Paeonol (Aladdin: H111081; 0.5 mg/mL), Dulbecco’s Modified Eagle Medium (Procell: PM150210), trypsin solution (Gibco: 25200072), fetal bovine serum (Hyclone: SH30084.03), and phosphate-buffered saline (PBS) (Life: C10010500BT). Proliferation assays employed RPMI-1640 medium (Hyclone, Inc.: SH30809.01B), fetal bovine serum (Gibco: 10099-141C), and a CCK-8 assay kit (Dongren Chemical: CK04).
2.2 Instruments
CO2 incubator (Heal force: HF90); Biological safety cabinet (Heal force: HF-1200LC); Inverted phase contrast microscope (Olympus: IX71); Electric constant temperature water bath (American standard: HH-US-A); Full-featured microplate detector (PerkinElmer/envision); Refrigerated centrifuge (Heal force: neofuge 15R).
2.3 Cell culture
HeLa cells were maintained in complete DMEM medium (Procell, Cat# PM150210) supplemented with 10% heat-inactivated fetal bovine serum (Hyclone, Cat# SH30084.03), 100 U/mL penicillin, and 100 U/mL streptomycin at 37 °C under 5% CO2 humidified atmosphere. For experiments, logarithmically growing cells were washed with PBS (Life Technologies, Cat# C10010500BT), detached using 0.25% trypsin-EDTA (Gibco, Cat# 25200072) for 1–3 min at 37 °C, and centrifuged at 1,000 rpm for 5 min. Cell density was determined via Trypan Blue exclusion using a 1:1 cell suspension/dye mixture. Remaining cells were pelleted (1,000 rpm, 5 min), resuspended, and seeded into 6-well plates at 4 × 10⁵ cells/well (n = 6 replicates per condition). Following overnight incubation, experimental groups received medium containing 0.5 mg/mL paeonol, while controls received paeonol-free medium. Incubation continued for 24 h prior to proliferation and apoptosis assessment.
2.4 Cell proliferation and apoptosis experiments
Cellular proliferation was quantified at 0, 24, 48, and 72 h post-treatment using CCK-8 reagent. Briefly, 10 μL CCK-8 solution was added per well, plates incubated (37 °C, 5% CO2, 4 h), mixed thoroughly, and absorbance measured at 450 nm.
Apoptosis was evaluated in 48 h-treated cells. Cells were collected, pelleted (1,000 rpm, 5 min), washed once with PBS, repelleted, and resuspended in 1× binding buffer. Annexin V-FITC (5 μL) and propidium iodide (10 μL) were added, followed by 15 min dark incubation at ambient temperature. Cells were diluted in 200 μL binding buffer and analyzed by flow cytometry. Comparative analysis employed Student’s t-test (significance threshold P < 0.05).
2.5 RNA-sequnce library construction
Total RNA (1 μg per sample; n = 6, 3 control, 3 treated) underwent purification with RNA clean beads and RQ1 DNase (Promega). RNA fragmentation and strand-specific library construction utilized the VAHTS Universal V8 RNA-seq Library Prep Kit for Illumina (NR605), involving sequential steps: first-strand synthesis, second-strand synthesis, end repair, adapter ligation, PCR amplification, and purification. Library concentration was determined via Qubit 4.0 fluorometry, and samples stored at −80 °C. Sequencing was performed on the Illumina Novaseq 6000 platform (PE150 mode) to generate high-quality transcriptomic data.
2.6 RNAseq analysis and differential gene expression analysis
Raw sequencing reads containing more than 2-N bases were first discarded. Subsequently, the raw reads were trimmed of adaptors and low-quality bases using a FASTX-Toolkit (v.0.0.13; http://hannonlab.cshl.edu/fastxtoolkit/). In addition, short reads of less than 16 nt were dropped to retain clean reads, which were subsequently aligned to the GRch38 genome by HISAT2. Uniquely mapped reads were ultimately used to calculate read number and paired-end fragments per kilobase of exon per million fragments mapped (FPKM) for each gene. The software DEseq2, which is specifically used to analyze the differential expression of genes, was applied to screen the RNA-seq data for DEGs. The results were analyzed based on the fold change (FC ≥ 2 or ≤0.5) and false discovery rate (FDR<0.05) to determine whether a gene was differentially expressed (Liu et al., 2022). Significantly upregulated and downregulated genes were visualized via heatmaps.
2.7 Alternative splicing analysis
RNA-seq data were interrogated to quantify alternative splicing events per sample. Differentially regulated alternative splicing events (RASE) in treated cells were defined (p-value ≤0.05) and associated with their corresponding genes (RASGs). Integration of RASG and DEG datasets identified key DEGs exhibiting concurrent differential expression and splicing alterations for subsequent investigation.
2.8 Enrichment analysis
Key DEGs underwent Gene Ontology (GO) and Kyoto Encyclopedia of Genes and Genomes (KEGG) pathway enrichment analyses using the “clusterProfiler” R package (significance P < 0.05), with results graphically represented. These analyses implicated paeonol in suppressing proliferation and inducing apoptosis in HeLa cells.
2.9 qRT-PCR
Quantitative reverse transcription polymerase chain reaction (qRT-PCR) was applied to validate RNA-seq-derived differential expression patterns of key DEGs. Quantitative PCR analysis was performed on RNA samples reverse-transcribed into cDNA using HiScript® III RT SuperMix (+gDNA wiper) following genomic DNA elimination (42 °C, 2 min), with RT reactions conducted at 37 °C for 15 min and 85 °C for 5 s qPCR amplifications were carried out in 10 μL reactions containing 2 μL cDNA, 1 μL each of 10 μM gene-specific primers (GAPDH: F-GGTCGGAGTCAACGGATTTG/R-GGAAGATGGTGATGGGATTTC; NLRP1: F-GTCCCTCCTATTCCTCTTTG/R-GCCTAACAGCATCTCAGG; FN1: F-CCTCTTATCAACTGCATACT/R-GCATGATCTTGTTACTGTGA; NQO2: F-CATCCGAAGAAGAAAGAAAGG/R-CCTAGTGTGCTGCTTACG; NREP: F-AGGAGGGAGAGGAGTAATG/R-GTTGTTGTGTTAGCCAGTC; B4GALNT1: F-GAACAATGGACATCTACAAGG/R-CACTCTGCCTAATCTTCCTC; FAM219A: F-GGAGTGTTAAGGCAGTATCTA/R-TGGCAGCTTCTGTGTCTA; ODF3B: F-CTGGCTTCCGAGTGTTGT/R-GCCTATCAGGTCGTGAGT; MAPK15: F-ACGAACATGGATCTGAGGA/R-ACACCAGGAGTCGCCTAA; EPGN: F-GGAGTGGAGAGTTGAAGTT/R-AGGCAATCCTGTATTGTTTC; MUC1: F-TCTGAAGGAGGCTGTGAG/R-ACTTCTGCCAACTTGTAGG), and HieffTM qPCR SYBR® Green Master Mix on a QuantStudio 12K system, using the following thermocycling protocol: 95 °C for 5 min; 40 cycles of 95 °C for 10 s and 60 °C for 30 s; followed by melt curve analysis (95 °C→60 °C→95 °C, 15 s/step). Gene expression was normalized to GAPDH and analyzed using the 2−ΔΔCT method to compare untreated controls (n = 3) versus 0.5 mg/mL drug-treated cells (n = 3).
2.10 Survival analysis and construction and evaluation of pivotal gene prognostic model
Cervical cancer patient transcriptomic data, alongside clinical variables (age, disease stage), were retrieved from The Cancer Genome Atlas (TCGA; https://portal.gdc.cancer.gov/repository). Prognostically relevant genes and covariates were identified through Least Absolute Shrinkage and Selection Operator (LASSO) regression, followed by univariate and multivariate Cox proportional hazards analyses (Song and Shu, 2022; Xu et al., 2022). A predictive model was constructed, visualized via forest plot. Individual risk scores were computed [risk score = Σ (gene expression × regression coefficient)]. Patients were stratified into high-risk and low-risk cohorts based on median risk score, and survival differences assessed via Kaplan-Meier analysis using R (Wu et al., 2022). A nomogram integrated Cox regression results for prognostic visualization. Model calibration was evaluated using calibration curves.
2.11 Statistical analysis
Pairwise comparisons utilized Student’s t-test. Bioinformatics analyses employed R software. Survival outcomes were evaluated by Kaplan-Meier methodology. Prognostic determinants were identified via LASSO-Cox regression, enabling prognostic model construction.
3 Results
3.1 Impact of paeonol on cellular proliferation and apoptosis
Treatment with 0.5 mg/mL paeonol induced significant suppression of HeLa cell proliferation relative to untreated controls as observed effects in leukemia cell lines before (Kim et al., 2004). This inhibitory effect was statistically robust after 24 h (P = 0.0005) and persisted through 72 h (P = 0.0003) (Figures 1A,B). Furthermore, at this concentration, paeonol treatment markedly enhanced apoptotic cell death in HeLa cultures (Figures 1C,D).
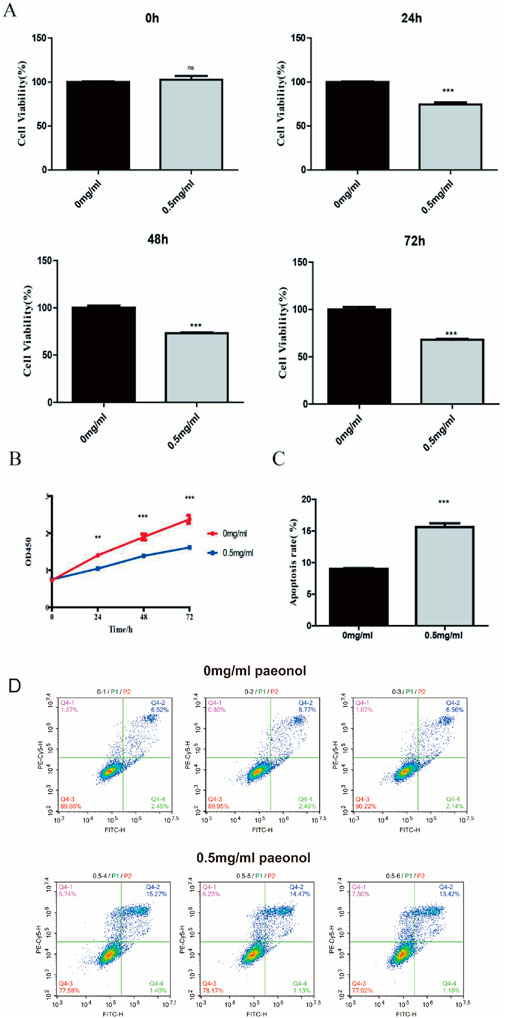
Figure 1. Impact of paeonol on HeLa cell proliferation and apoptosis. Effect of paeonol on cell proliferation (A,B) and apoptosis (C). ** indicates that P value is less than 0.01. *** indicates that P value is less than 0.001. Flow cytometric analysis of cell apoptosis (D), assessed by Annexin V-FITC/PI double staining.
3.2 Transcriptomic profiling outcomes
High-quality sequencing reads (clean reads) were aligned against the HeLa cell reference genome (GRCh38, Homo sapiens), yielding uniquely mapped reads positioned exclusively at singular genomic loci. Distribution analysis of these uniquely mapped sequences across genomic regions revealed predominant enrichment within coding sequence regions (CDS), indicative of robust sequencing quality (Figure 2A). Consequently, uniquely mapped reads were retained for downstream analyses. Inter-sample gene expression correlation coefficients were computed, where elevated values denote substantial similarity in transcriptional profiles and data homogeneity. Conversely, diminished coefficients reflect pronounced differential expression or potential quality concerns. Proximity to unity signifies minimal inter-sample variation and fewer differentially expressed genes (Jazayeri et al., 2015). Cluster analysis demonstrated pairwise correlation coefficients exceeding 0.98 (Figure 2B), confirming high replicate consistency. These findings collectively indicate paeonol modulates a limited transcriptional repertoire (Zhou et al., 2022).
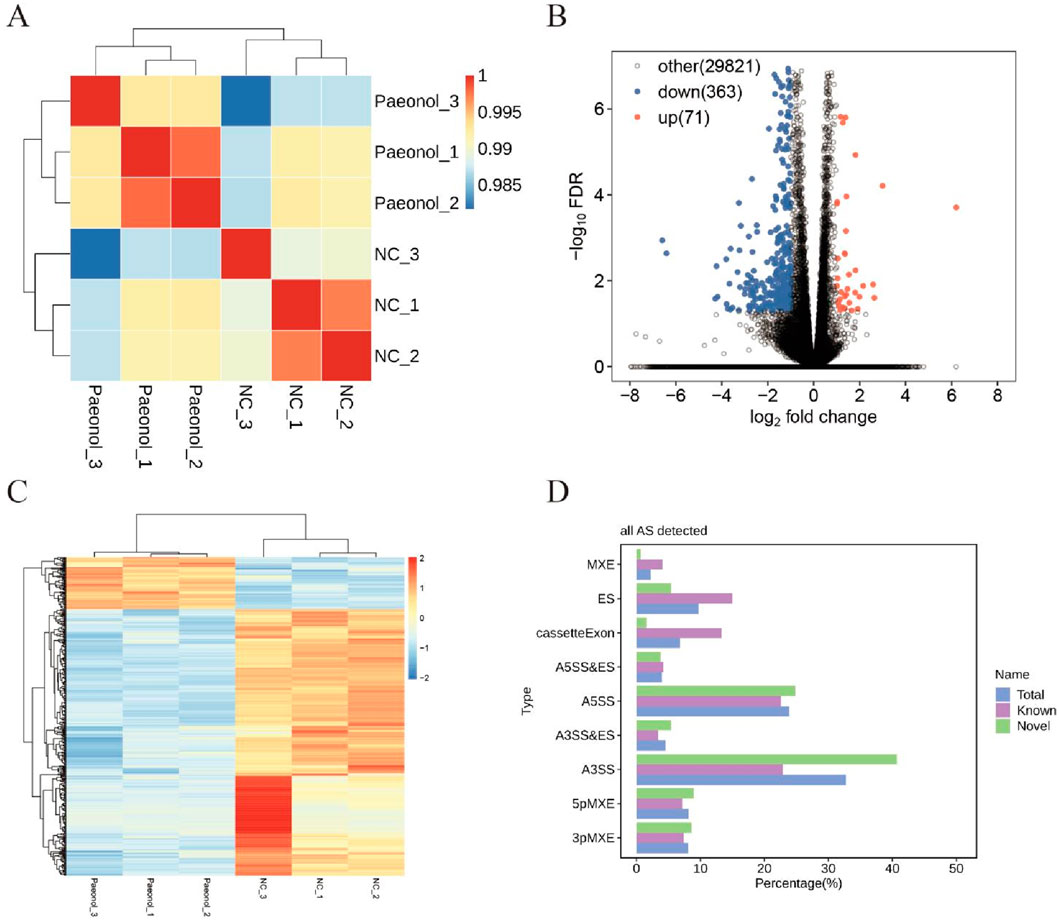
Figure 2. Transcriptomic Profiling Outcomes in Paeonol-Treated Cells. (A) Sample correlation clustering. (B) Differential expression volcano plot. (C) Per-sample gene expression heatmap. (D) Alternative splicing event detection.
3.3 Differential gene expression
Comparative transcriptomics identified 434 differentially expressed genes (DEGs), comprising 71 significantly upregulated and 363 downregulated transcripts (Figure 2C). Hierarchical clustering of expression values revealed distinct transcriptional signatures between control and treated cohorts (Figure 2D).
3.4 Alternative splicing analysis
Nine splicing modalities were quantified: exon skipping (ES), alternative 5′ splice site (A5SS), alternative 3′ splice site (A3SS), mutually exclusive exons (MXE), mutually exclusive 5′ UTRs (5pMXE), mutually exclusive 3′ UTRs (3pMXE), cassette exon, A3SS&ES, and A5SS&ES. Among 105,078 detected splicing events, 46,568 corresponded to previously annotated isoforms while 58,510 represented novel events (Figure 2E).
Comparative analysis between experimental and control conditions identified 939 upregulated and 739 downregulated regulated alternative splicing events (RASEs). The A3SS and A5SS subtypes constituted the predominant fraction among all detected RASEs (Table 1).

Table 1. Distribution of differential variable splicing events (RASE).
Integrative examination of regulated alternative splicing genes (RASGs) and differentially expressed genes (DEGs) revealed twelve transcripts exhibiting concurrent marked transcriptional divergence and significant splicing alterations. These pivotal genes—designated key DEGs—comprise NLRP1, FN1, NQO2, NREP, B4GALNT1, ANK3, FAM219A, ODF3B, MAPK15, EPGN, MUC1, and MEG3. Transcriptional profiling demonstrated upregulation of NLRP1, B4GALNT1, FAM219A, NQO2, and EPGN, alongside downregulation of FN1, NREP, ANK3, ODF3B, MAPK15, MUC1, and MEG3 in treated cells (Table 2).
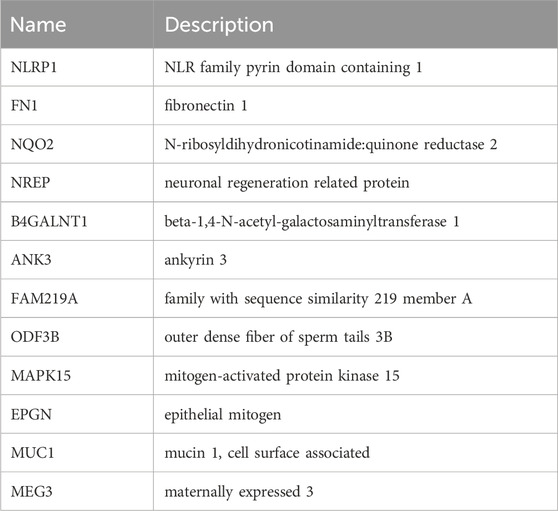
Table 2. Key DEGs.
3.5 GO enrichment analysis and KEGG enrichment analysis of the key DEGs
Results from GO and KEGG enrichment analyses of key DEGs are presented in Figure 3. The GO analysis identified enrichment in biological processes including positive regulation of cell cycle progression, MAPK cascade signaling, and positive modulation of cell population proliferation (Figure 3A). Molecular functions and cellular components implicated encompassed MAPK activity, protein domain-specific binding, and tight junction formation (Figures 3B,C). KEGG pathway analysis demonstrated significant enrichment for DEGs in: NOD-like receptor signaling, cancer-associated proteoglycans, ganglio-series glycosphingolipid biosynthesis, ECM-receptor interactions, and IL-17 signaling pathways (Figure 3D).
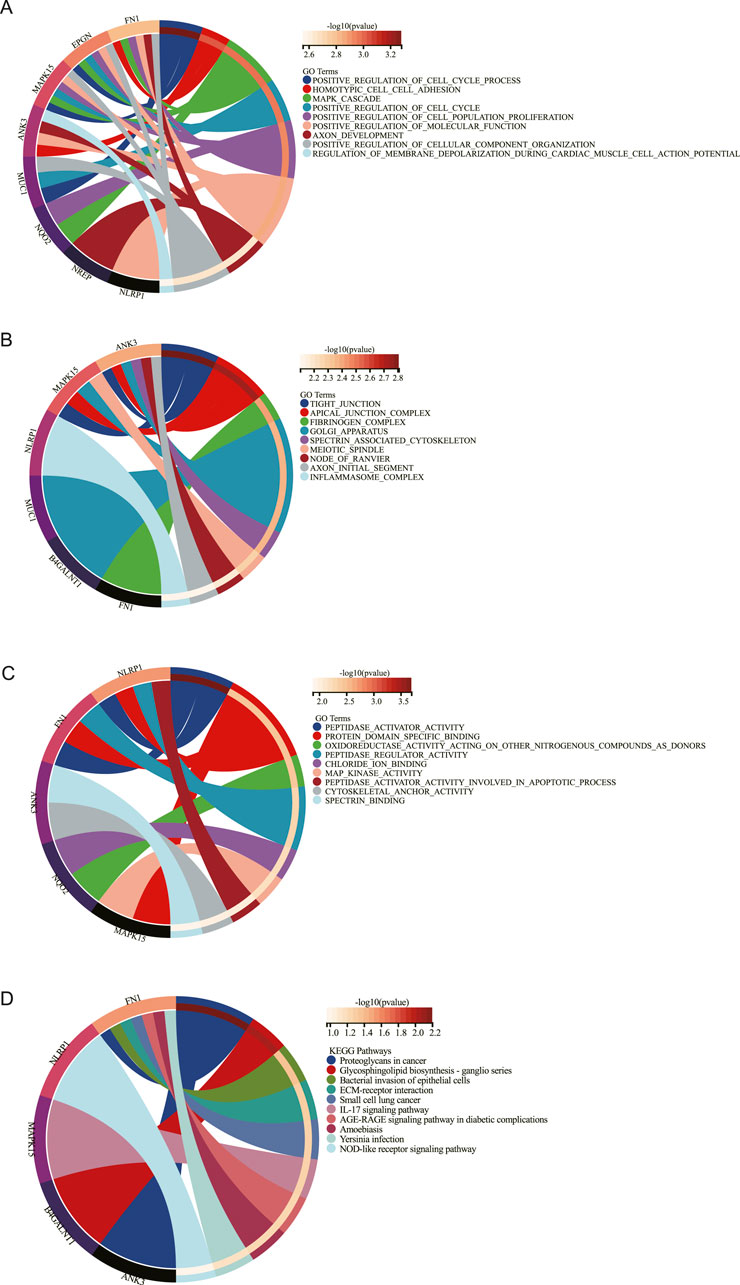
Figure 3. Functional enrichment analysis. GO enrichment of biology process (BP) (A), cellular component (CC) (B), and molecular function (MF) (C) enrichment analysis of DEGs. (D). KEGG enrichment analysis of DEGs.
3.6 Survival analysis and prognostic model construction
Cervical cancer patients (n = 197) from TCGA were stratified into high-risk and low-risk cohorts based on analytical outcomes. Subsequent Kaplan–Meier analysis demonstrated significantly reduced five-year survival in high-risk versus low-risk patients (P = 0.0411; Figures 4A,B).
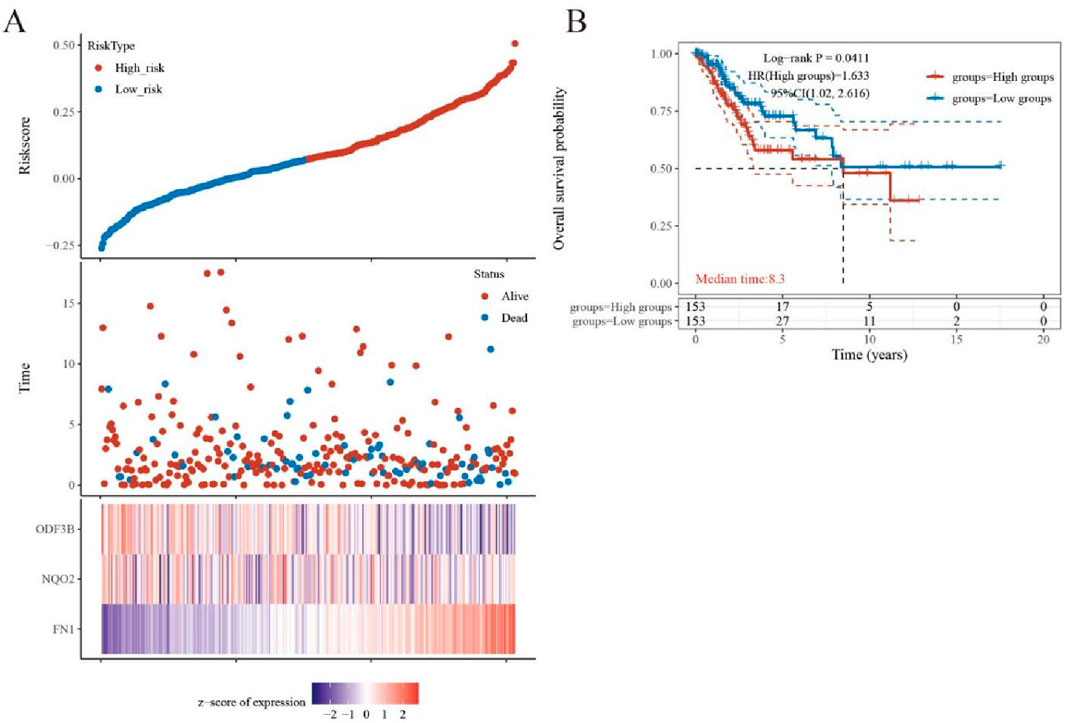
Figure 4. Diagnosis and survival prognosis analysis. (A) Grouping according to risk score and distribution of patient survival. (B) Kaplan-Meier survival anlysis.
Key DEGs underwent LASSO regression analysis to identify genes suitable for inclusion in prognostic models (Figure 5A). Three genes FN1, NQO2, and ODF3B, which log2foldchange is −1.67, 1.39, and −1.22, demonstrated significant associations with cervical cancer patient survival and were consequently incorporated into the prognostic model. Univariate COX regression indicated correlations between these genes and both tumor size (T stage) and TNM staging (Figure 5B), where T denotes primary tumor status, N represents lymph node involvement, and M indicates distant metastasis. Multivariate COX analysis (Figure 5C) revealed that tumor T stage and risk score exerted significant prognostic influence, with the risk score functioning as an independent outcome predictor.
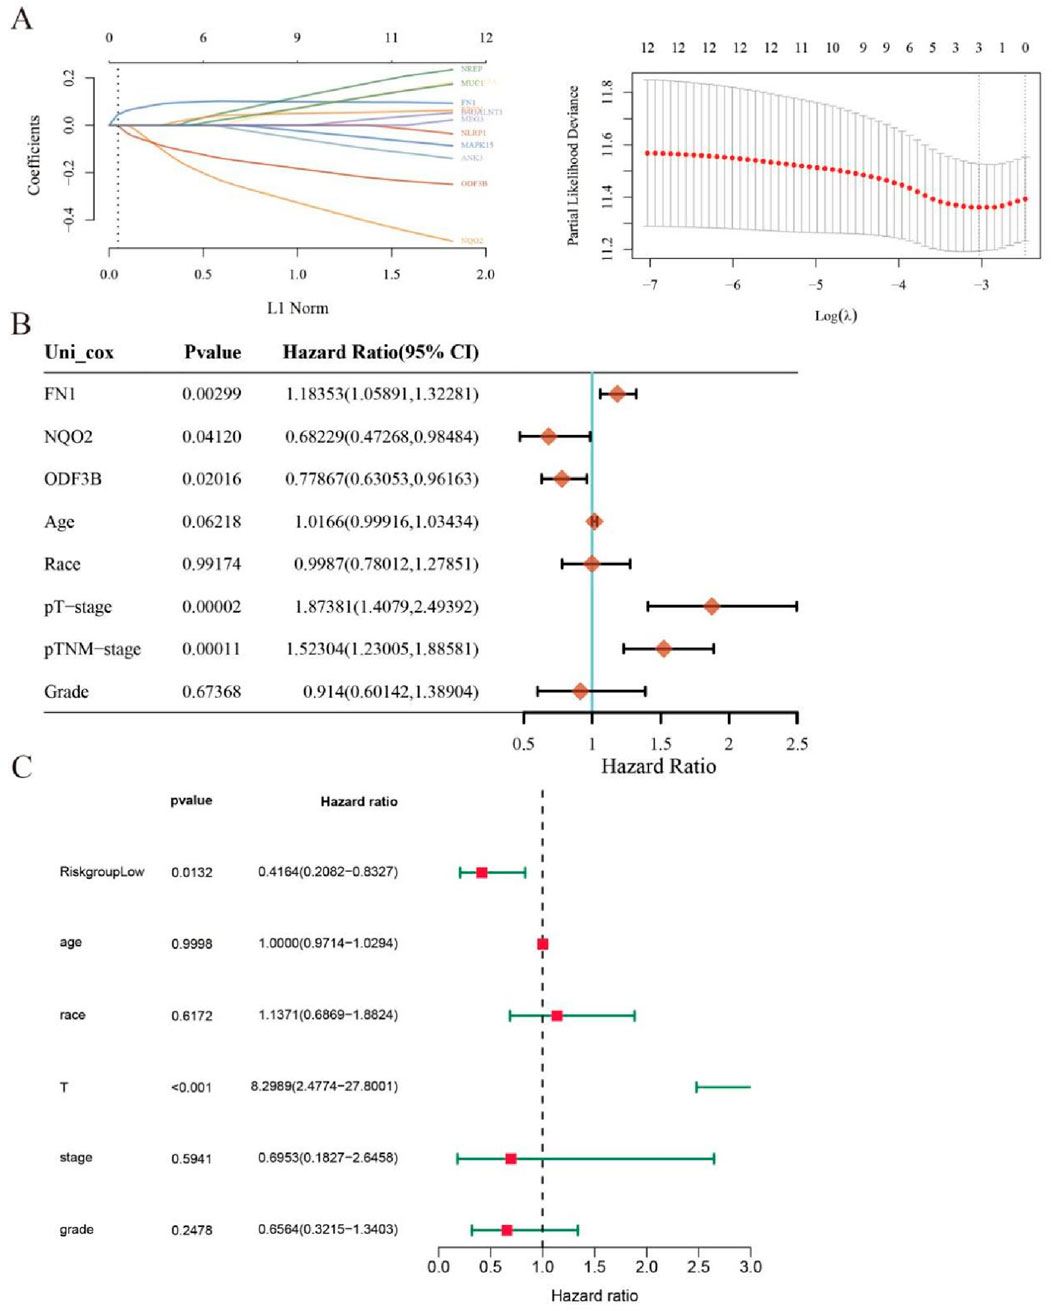
Figure 5. LASSO regression analysis. (A) LASSO regression analysis screens out genes for inclusion in the prognostic model. (B) Univariate COX analysis outcomes appear as a forest plot. (C) Forest plot for multivariate COX analysis.
Correlating with improved survival outcomes, patients exhibiting lower risk scores were identified. A corresponding expression heatmap provides enhanced visualization of these findings (Figure 6A). Subsequent nomogram development based on the prognostic model (Figure 6B) enabled model validation via calibration curve assessment (Figure 6C).
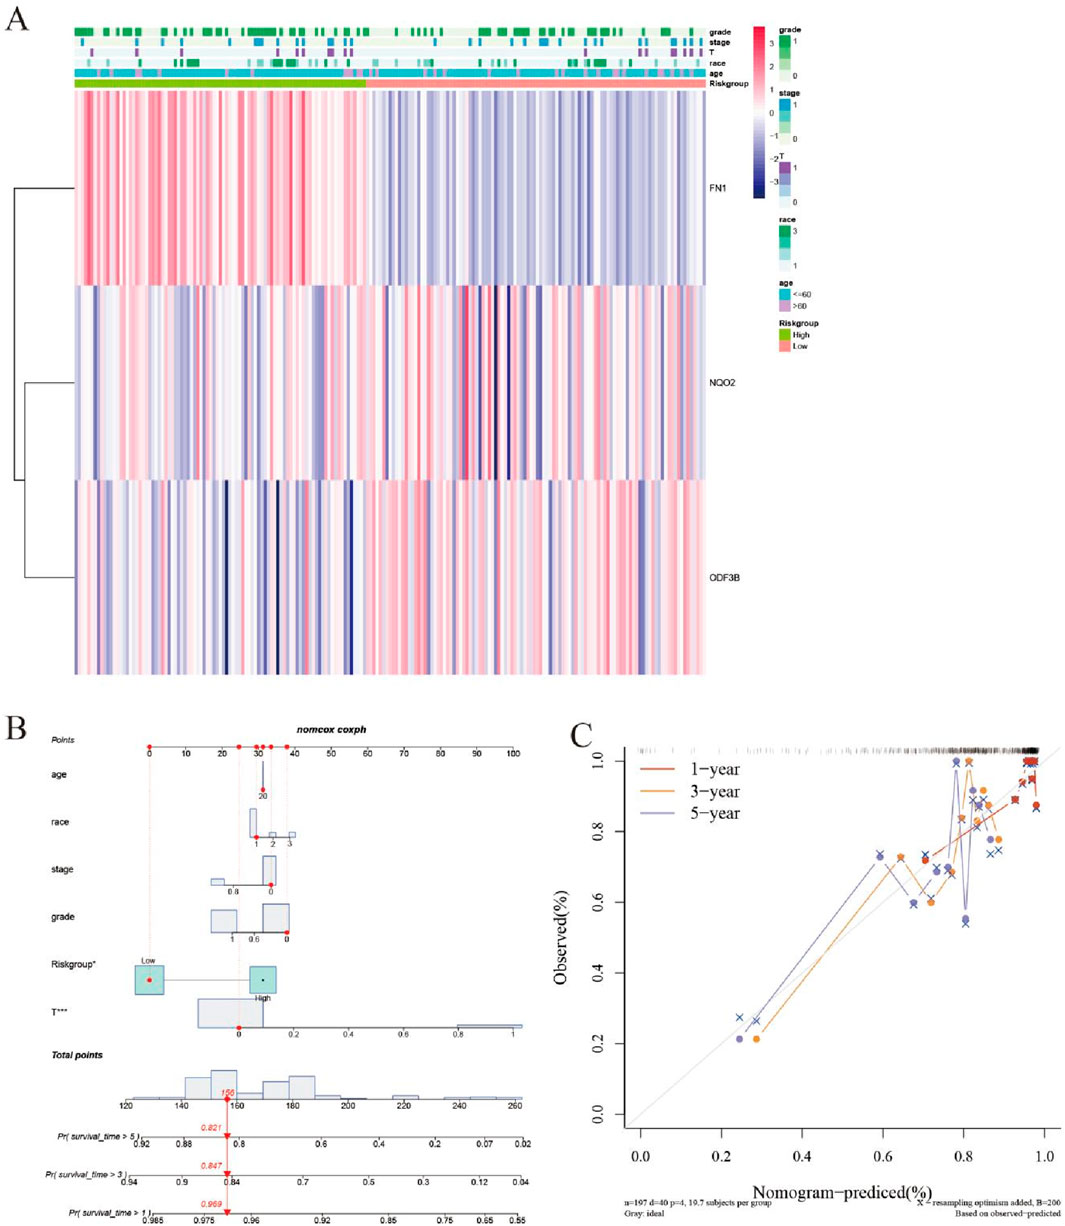
Figure 6. Evaluation of the efficacy of prognostic models. (A) Heat map. (B) Nomogram graph. (C) Calibration graph.
3.7 qRT-PCR verification
Quantitative RT-PCR measurements were performed for selected pivotal DEGs in experimental versus control cellular populations (Figure 7). Relative to controls, treated cells demonstrated elevated NLRP1, FAM219A, NQO2, and EPGN expression alongside reduced FN1, NREP, ODF3B, and MUC1 transcription levels.
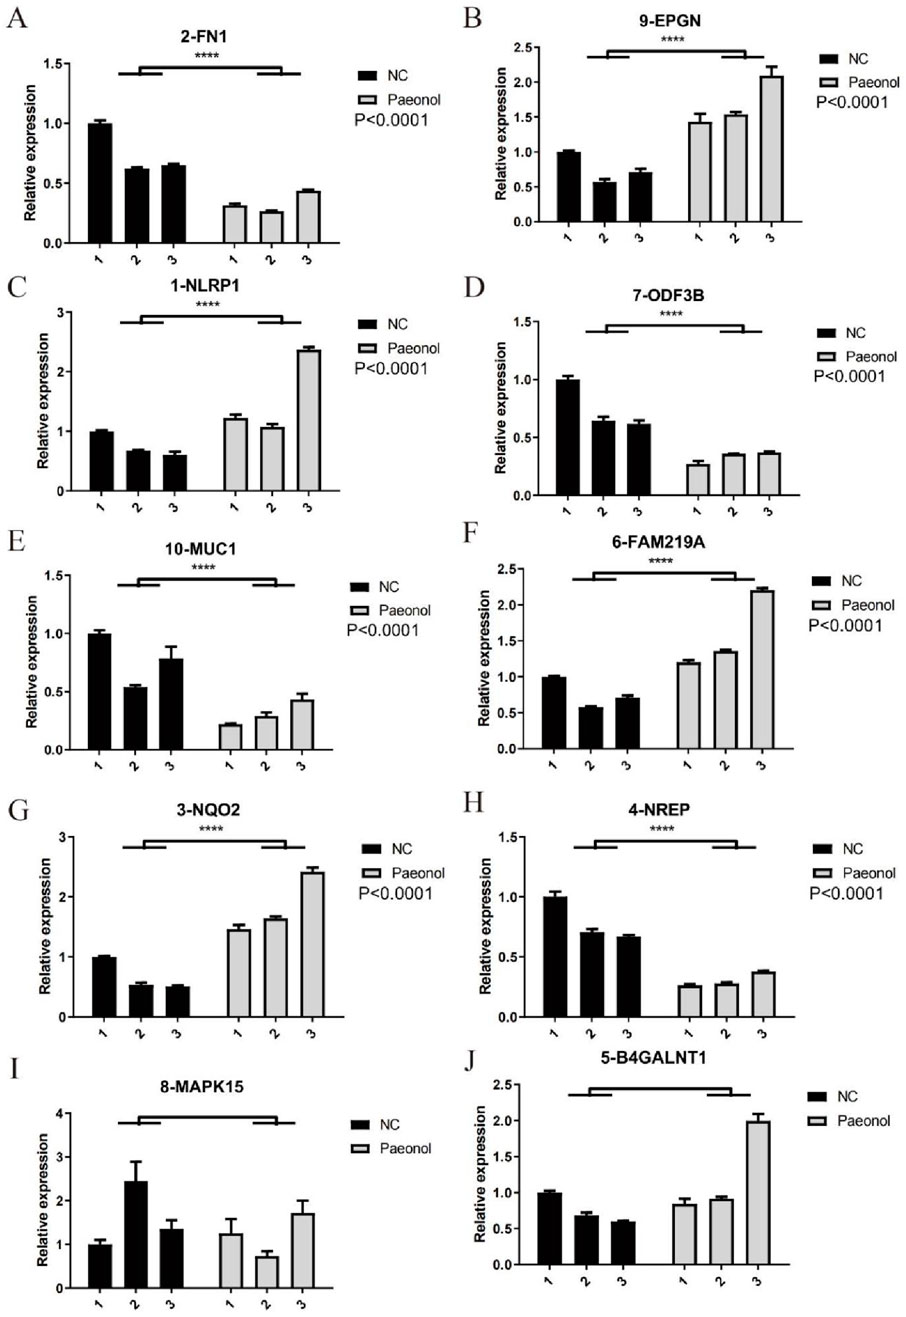
Figure 7. Expression levels of 10 key DEGs. (A) FN1, (B) EPGN, (C) NLRP-1, (D) ODF3B, (E) MUC1, (F) FAM219A, (G) NQ2, (H) NREP, (I) MAPK15, (J) B4GALNT1 quantified by qRT-PCR in Hela.
4 Discussion
As a natural compound exhibiting anticancer properties, paeonol modulates serum glutathione peroxidase and superoxide dismutase activities in experimental models, suppressing lipid peroxidation and inflammatory responses to inhibit tumor growth (Sun et al., 2023; Morsy et al., 2022a). This positions paeonol as a potential therapeutic agent against cervical carcinoma. Our investigation assessed 0.5 mg/mL paeonol’s impact on HeLa cell proliferation and apoptosis, revealing significant proliferation suppression and apoptosis induction. Transcriptomic profiling identified 12 pivotal differentially expressed genes (DEGs)—NLRP1, FN1, NQO2, NREP, B4GALNT1, ANK3, FAM219A, ODF3B, MAPK15, EPGN, MUC1, and MEG3—potentially regulating cervical cancer cell behavior.
Functional enrichment studies implicated these DEGs in MAPK signaling cascades, cancer-associated proteoglycan pathways, extracellular matrix (ECM) recognition systems, NOD-like receptor signaling, IL-17 pathways, and metabolic processes. These molecular networks govern inflammatory cascades, cellular proliferation, migratory capacity, and apoptotic induction, collectively inhibiting neoplastic expansion.
Transcriptomic and qRT-PCR validation demonstrated elevated NLRP1, FAM219A, NQO2, and EPGN expression in treated cells. NLRP1, an inflammasome component, triggers pyroptosis during viral challenge (Morsy et al., 2022b), while NQO2 overexpression diminishes oxygen radical concentrations to restrict proliferation (Robinson et al., 2022). Conversely, FN1, NREP, ODF3B, and MUC1 exhibited reduced expression. FN1 facilitates cellular adhesion and motility (Lozinskaya et al., 2023; Wang et al., 2022; Cai et al., 2018), with elevated levels correlating with adverse clinical outcomes. NREP promotes tumor invasion and metastasis when overexpressed (Li et al., 2023; McDonough et al., 2005). MUC1 typically forms protective epithelial barriers (Kashyap and Kullaa, 2020), but its pathological overexpression in malignancies stimulates angiogenesis, proliferation, invasion, and chemoresistance while inhibiting apoptosis (Li et al., 2022; Chen et al., 2021; Nath and Mukherjee, 2014) through MAPK, Wnt, and PI3K/Akt pathway activation.
Thus, upregulated genes in paeonol-treated cells exert antitumor effects, while downregulated genes typically promote oncogenesis and treatment resistance.
MAPK cascades comprise three-tiered kinase modules MAPKKK (MAP3K), MAPKK (MKK/MEK/MAP2K), and MAPK (MK) regulating cellular growth, differentiation, inflammatory responses, and immune modulation (Widmann et al., 1999; Davis, 1993). These pathways influence numerous cancer-relevant processes (Gong et al., 2022), rendering components like JNK and p38 potential therapeutic targets (Dhillon et al., 2007). The ECM—comprising collagen, fibronectin, and glycoproteins (Nersisyan et al., 2021)—modulates cell survival, apoptosis, differentiation, and migration. ECM-receptor interactions critically influence tumor cell detachment, adhesion, proliferation, and death (Bao et al., 2019), with dysregulation implicated in gastric, prostate, colorectal, and glioblastoma pathogenesis (Andersen et al., 2018; Yan et al., 2018; Rahbari et al., 2016; Cui et al., 2018). As ECM constituents, proteoglycans facilitate tumor progression; certain HPV subtypes exploit proteoglycan receptors for cellular entry and transformation (Bartlett and Park, 2010).
NOD-like receptor signaling activates NF-κB, MAPK, and inflammasome pathways, driving IL-1β-mediated inflammation. While IL-17 normally confers protection, aberrant pathway activation stimulates ERK, JNK, and p38 cascades, upregulating IL-6, IL-1, and NF-κB to promote carcinogenesis (Amatya et al., 2017).
Enrichment analyses indicate pivotal DEGs modulate proinflammatory cytokine production, inflammatory regulation, and cellular proliferation/differentiation/migration/apoptosis. Systemic inflammation accelerates cancer progression through multifaceted mechanisms (Liang et al., 2022), highlighting inflammatory pathway regulation as crucial for oncogenesis control. Notably, downregulated DEGs associate with tumor-promoting pathways (IL-17, Wnt, ECM-receptor interactions), suggesting paeonol suppresses inflammatory and proliferative networks in HeLa cells.
Survival modeling revealed differential FN1, NQO2, and ODF3B expression between high-risk and low-risk cohorts. Elevated FN1 characterized high-risk patients, while NQO2 and ODF3B expression was diminished. Reduced FN1 with increased NQO2/ODF3B may inhibit inflammation and cellular proliferation/migration. Forest plots indicated hazard ratios >1 correlate with adverse outcomes. Calibration curves demonstrated model reliability when approaching ideal prediction lines. qRT-PCR validation confirmed RNA-seq differential expression patterns for key DEGs.
5 Conclusion
Integrating transcriptomic sequencing with bioinformatics approaches, this study establishes paeonol’s capacity to modulate critical DEGs including FN1 and MUC1. By governing inflammatory pathways and cellular proliferation/differentiation/invasion, paeonol inhibits cervical cancer cell growth while promoting apoptosis. These findings establish mechanistic foundations for paeonol’s clinical application in cervical cancer management and provide novel perspectives on natural product therapeutics. Further investigation must elucidate precise pharmacological characteristics to validate clinical translation potential.
Data availability statement
The RNAseq data presented in the study are deposited in the NCBI repository, available at: https://www.ncbi.nlm.nih.gov/geo/query/acc.cgi?acc=GSE305604.
Ethics statement
Ethical approval was not required for the studies on animals in accordance with the local legislation and institutional requirements because only commercially available established cell lines were used.
Author contributions
ML: Investigation, Writing – original draft, Resources, Visualization, Software, Formal Analysis, Data curation. NG: Methodology, Data curation, Writing – original draft, Validation, Resources, Visualization. LX: Conceptualization, Methodology, Writing – review and editing, Software, Formal Analysis. PG: Investigation, Software, Validation, Data curation, Writing – review and editing, Methodology. NJ: Supervision, Investigation, Writing – review and editing, Methodology, Funding acquisition, Resources, Data curation, Project administration. YS: Supervision, Investigation, Writing – review and editing, Project administration.
Funding
The author(s) declare that financial support was received for the research and/or publication of this article. This study was supported by the Basic Research Project of the Liaoning Provincial Education Department (LJKMZ20221279), Liaoning Provincial Doctoral Research Start-up Fund Project (2023-BS-158), and Dalian Research Project of Traditional Chinese Medicine (21Z12007).
Conflict of interest
The authors declare that the research was conducted in the absence of any commercial or financial relationships that could be construed as a potential conflict of interest.
Generative AI statement
The author(s) declare that no Generative AI was used in the creation of this manuscript.
Any alternative text (alt text) provided alongside figures in this article has been generated by Frontiers with the support of artificial intelligence and reasonable efforts have been made to ensure accuracy, including review by the authors wherever possible. If you identify any issues, please contact us.
Publisher’s note
All claims expressed in this article are solely those of the authors and do not necessarily represent those of their affiliated organizations, or those of the publisher, the editors and the reviewers. Any product that may be evaluated in this article, or claim that may be made by its manufacturer, is not guaranteed or endorsed by the publisher.
References
Amatya, N., Garg, A. V., and Gaffen, S. L. (2017). IL-17 signaling: the yin and the Yang. Trends Immunol. 38 (5), 310–322. doi:10.1016/j.it.2017.01.006
Andersen, M. K., Rise, K., Giskeødegård, G. F., Richardsen, E., Bertilsson, H., Størkersen, Ø., et al. (2018). Integrative metabolic and transcriptomic profiling of prostate cancer tissue containing reactive stroma. Sci. Rep. 8 (1), 14269. doi:10.1038/s41598-018-32549-1
Bao, Y., Wang, L., Shi, L., Yun, F., Liu, X., Chen, Y., et al. (2019). Transcriptome profiling revealed multiple genes and ECM-receptor interaction pathways that may be associated with breast cancer. Cell Mol. Biol. Lett. 24, 38. doi:10.1186/s11658-019-0162-0
Bartlett, A. H., and Park, P. W. (2010). Proteoglycans in host-pathogen interactions: molecular mechanisms and therapeutic implications. Expert Rev. Mol. Med. 12, e5. doi:10.1017/S1462399409001367
Cai, X., Liu, C., Zhang, T. N., Zhu, Y. W., Dong, X., and Xue, P. (2018). Down-regulation of FN1 inhibits colorectal carcinogenesis by suppressing proliferation, migration, and invasion. J. Cell Biochem. 119 (6), 4717–4728. doi:10.1002/jcb.26651
Chen, W., Zhang, Z., Zhang, S., Zhu, P., Ko, J. K., and Yung, K. K. (2021). MUC1: structure, function, and clinic application in epithelial cancers. Int. J. Mol. Sci. 22 (12), 6567. doi:10.3390/ijms22126567
Cui, X., Morales, R.-T. T., Qian, W., Wang, H., Gagner, J. P., Dolgalev, I., et al. (2018). Hacking macrophage-associated immunosuppression for regulating glioblastoma angiogenesis. Biomaterials 161, 164–178. doi:10.1016/j.biomaterials.2018.01.053
Davis, R. J. (1993). The mitogen-activated protein kinase signal transduction pathway. J. Biol. Chem. 268 (20), 14553–14556. doi:10.1016/s0021-9258(18)82362-6
Dhillon, A. S., Hagan, S., Rath, O., and Kolch, W. (2007). MAP kinase signalling pathways in cancer. Oncogene 26 (22), 3279–3290. doi:10.1038/sj.onc.1210421
Du, J., Song, D., Li, J., Li, Y., Li, B., and Li, L. (2022). Paeonol triggers apoptosis in HeLa cervical cancer cells: the role of mitochondria-related caspase pathway. Psychopharmacol. (Berl) 239 (7), 2083–2092. doi:10.1007/s00213-021-05811-0
Feng, C. H., Mell, L. K., Sharabi, A. B., McHale, M., and Mayadev, J. S. (2020). Immunotherapy with radiotherapy and chemoradiotherapy for cervical cancer. Semin. Radiat. Oncol. 30 (4), 273–280. doi:10.1016/j.semradonc.2020.05.003
Francies, F. Z., Bassa, S., Chatziioannou, A., Kaufmann, A. M., and Dlamini, Z. (2021). Splicing genomics events in cervical cancer: insights for phenotypic stratification and biomarker potency. Genes (Basel) 12 (2), 130. doi:10.3390/genes12020130
Gao, L., Wang, Z., Lu, D., Huang, J., Liu, J., and Hong, L. (2019). Paeonol induces cytoprotective autophagy via blocking the Akt/mTOR pathway in ovarian cancer cells. Cell Death Dis. 10 (8), 609. doi:10.1038/s41419-019-1849-x
Gong, T., Si, K., Liu, H., and Zhang, X. (2022). Research advances in the role of MAPK cascade in regulation of cell growth, immunity, inflammation, and cancer. Zhong Nan Da Xue Xue Bao Yi Xue Ban. 47 (12), 1721–1728. doi:10.11817/j.issn.1672-7347.2022.220155
Han, L., Guo, X., Bian, H., Yang, L., Chen, Z., Zang, W., et al. (2016). Guizhi fuling wan, A traditional Chinese herbal formula, sensitizes cisplatin-resistant human ovarian cancer cells through inactivation of the PI3K/AKT/mTOR pathway. Evid. Based Complement. Altern. Med. 2016, 4651949. doi:10.1155/2016/4651949
Hong, Y., Liu, J., Kong, W., Li, H., Cui, Y., Liu, Y., et al. (2022). WASH regulates the oxidative stress Nrf2/ARE pathway to inhibit proliferation and promote apoptosis of HeLa cells under the action of Jolkinolide B. PeerJ 10, e13499. doi:10.7717/peerj.13499
Jazayeri, S. M., Melgarejo Muñoz, L. M., and Romero, M. (2015). RNA-Seq: a glance at technologies and methodologies. Acta Biol. Colomb. 20 (2), 23–35. doi:10.15446/abc.v20n2.43639
Kashyap, B., and Kullaa, A. M. (2020). Regulation of mucin 1 expression and its relationship with oral diseases. Arch. Oral Biol. 117, 104791. doi:10.1016/j.archoralbio.2020.104791
Kim, S. H., Kim, S. A., Park, M. K., Kim, S. H., Park, Y. D., Na, H. J., et al. (2004). Paeonol inhibits anaphylactic reaction by regulating histamine and TNF-alpha. Int. Immunopharmacol. 4 (2), 279–287. doi:10.1016/j.intimp.2003.12.013
Li, Z., Yang, D., Guo, T., and Lin, M. (2022). Advances in MUC1-mediated breast cancer immunotherapy. Biomolecules 12 (7), 952. doi:10.3390/biom12070952
Li, Q., Fu, L., Wu, D., and Wang, J. (2023). NREP is a diagnostic and prognostic biomarker, and promotes gastric cancer cell proliferation and angiogenesis. Biochem. Genet. 61 (2), 669–686. doi:10.1007/s10528-022-10276-7
Liang, Z., Rehati, A., Husaiyin, E., Chen, D., Jiyuan, Z., and Abuduaini, B. (2022). RALY regulate the proliferation and expression of immune/inflammatory response genes via alternative splicing of FOS. Genes Immun. 23 (8), 246–254. doi:10.1038/s41435-022-00178-4
Liu, Y., Wang, X., Qiao, J., Wang, J., Jiang, L., Wang, C., et al. (2022). Ginsenoside Rh2 induces HeLa apoptosis through upregulating endoplasmic reticulum stress-related and downstream apoptotic gene expression. Molecules 27 (22), 7865. doi:10.3390/molecules27227865
Liu, F., Xu, J., Yang, R., Liu, S., Hu, S., Yan, M., et al. (2023). New light on treatment of cervical cancer: chinese medicine monomers can be effective for cervical cancer by inhibiting the PI3K/Akt signaling pathway. Biomed. Pharmacother. 157, 114084. doi:10.1016/j.biopha.2022.114084
Lozinskaya, N. A., Bezsonova, E. N., Dubar, M., Melekhina, D. D., Bazanov, D. R., Bunev, A. S., et al. (2023). 3-Arylidene-2-oxindoles as potent NRH:quinone oxidoreductase 2 inhibitors. Molecules 28 (3), 1174. doi:10.3390/molecules28031174
Mauricio, D., Zeybek, B., Tymon-Rosario, J., Harold, J., and Santin, A. D. (2021). Immunotherapy in cervical cancer. Curr. Oncol. Rep. 23 (6), 61. doi:10.1007/s11912-021-01052-8
McDonough, W. S., Tran, N. L., and Berens, M. E. (2005). Regulation of glioma cell migration by serine-phosphorylated P311. Neoplasia 7 (9), 862–872. doi:10.1593/neo.05190
Moore, D. H. (2006). Cervical cancer. Obstet. Gynecol. 107 (5), 1152–1161. doi:10.1097/01.AOG.0000215986.48590.79
Morsy, M. A., Abdel-Latif, R., Hafez, SMNA, Kandeel, M., and Abdel-Gaber, S. A. (2022a). Paeonol protects against methotrexate hepatotoxicity by repressing oxidative stress, inflammation, and apoptosis-the role of drug efflux transporters. Pharm. (Basel) 15 (10), 1296. doi:10.3390/ph15101296
Morsy, M. A., Ibrahim, Y. F., Abdel Hafez, S. M. N., Zenhom, N. M., Nair, A. B., Venugopala, K. N., et al. (2022b). Paeonol attenuates hepatic ischemia/reperfusion injury by modulating the Nrf2/HO-1 and TLR4/MYD88/NF-κB signaling pathways. Antioxidants (Basel) 11 (9), 1687. doi:10.3390/antiox11091687
Naeem, A., Hu, P., Yang, M., Zhang, J., Liu, Y., Zhu, W., et al. (2022). Natural products as anticancer agents: current status and future perspectives. Molecules 27 (23), 8367. doi:10.3390/molecules27238367
Nath, S., and Mukherjee, P. (2014). MUC1: a multifaceted oncoprotein with a key role in cancer progression. Trends Mol. Med. 20 (6), 332–342. doi:10.1016/j.molmed.2014.02.007
Nersisyan, S., Novosad, V., Engibaryan, N., Ushkaryov, Y., Nikulin, S., and Tonevitsky, A. (2021). ECM-receptor regulatory network and its prognostic role in colorectal cancer. Front. Genet. 12, 782699. doi:10.3389/fgene.2021.782699
Peng, Q., Zhou, Y., Oyang, L., Wu, N., Tang, Y., Su, M., et al. (2022). Impacts and mechanisms of alternative mRNA splicing in cancer metabolism, immune response, and therapeutics. Mol. Ther. 30 (3), 1018–1035. doi:10.1016/j.ymthe.2021.11.010
Rahbari, N. N., Kedrin, D., Incio, J., Liu, H., Ho, W. W., Nia, H. T., et al. (2016). Anti-VEGF therapy induces ECM remodeling and mechanical barriers to therapy in colorectal cancer liver metastases. Sci. Transl. Med. 8 (360), 360ra135. doi:10.1126/scitranslmed.aaf5219
Robinson, K. S., Toh, G. A., Rozario, P., Chua, R., Bauernfried, S., Sun, Z., et al. (2022). ZAKα-driven ribotoxic stress response activates the human NLRP1 inflammasome. Science 377 (6603), 328–335. doi:10.1126/science.abl6324
Saei, M. S. G., Kariman, N., Ebadi, A., Ozgoli, G., Ghasemi, V., and Rashidi Fakari, F. (2018). Educational interventions for cervical cancer screening behavior of women: a systematic review. Asian Pac J. Cancer Prev. 19 (4), 875–884. doi:10.22034/APJCP.2018.19.4.875
Sciarrillo, R., Wojtuszkiewicz, A., Assaraf, Y. G., Jansen, G., Kaspers, G. J. L., Giovannetti, E., et al. (2020). The role of alternative splicing in cancer: from oncogenesis to drug resistance. Drug Resist Updat 53, 100728. doi:10.1016/j.drup.2020.100728
Sharma, S., Deep, A., and Sharma, A. K. (2020). Current treatment for cervical cancer: an update. Anticancer Agents Med. Chem. 20 (15), 1768–1779. doi:10.2174/1871520620666200224093301
Sheng, S. Q., Yu, L. Y., Zhou, X. W., Pan, H. Y., Hu, F. Y., and Liu, J. L. (2021). Paeonol prevents migration and invasion, and promotes apoptosis of cervical cancer cells by inhibiting 5-lipoxygenase. Mol. Med. Rep. 23 (6), 401. doi:10.3892/mmr.2021.12040
Singh, D., Vignat, J., Lorenzoni, V., Eslahi, M., Ginsburg, O., Lauby-Secretan, B., et al. (2023). Global estimates of incidence and mortality of cervical cancer in 2020: a baseline analysis of the WHO global cervical cancer elimination initiative. Lancet Glob. Health 11 (2), e197–e206. doi:10.1016/S2214-109X(22)00501-0
Song, S., and Shu, P. (2022). Expression of ferroptosis-related gene correlates with immune microenvironment and predicts prognosis in gastric cancer. Sci. Rep. 12 (1), 8785. doi:10.1038/s41598-022-12800-6
Sun, T., Xu, W., Wang, J., Song, J., Wang, T., Wang, S., et al. (2023). Paeonol ameliorates diabetic erectile dysfunction by inhibiting HMGB1/RAGE/NF-kB pathway. Andrology 11 (2), 344–357. doi:10.1111/andr.13203
Vu, M., Yu, J., Awolude, O. A., and Chuang, L. (2018). Cervical cancer worldwide. Curr. Probl. Cancer 42 (5), 457–465. doi:10.1016/j.currproblcancer.2018.06.003
Wang, H., Zhang, J., Li, H., Yu, H., Chen, S., Liu, S., et al. (2022). FN1 is a prognostic biomarker and correlated with immune infiltrates in gastric cancers. Front. Oncol. 12, 918719. doi:10.3389/fonc.2022.918719
Widmann, C., Gibson, S., Jarpe, M. B., and Johnson, G. L. (1999). Mitogen-activated protein kinase: conservation of a three-kinase module from yeast to human. Physiol. Rev. 79 (1), 143–180. doi:10.1152/physrev.1999.79.1.143
Wu, K., Yi, Y., Liu, F., Wu, W., Chen, Y., and Zhang, W. (2018). Identification of key pathways and genes in the progression of cervical cancer using bioinformatics analysis. Oncol. Lett. 16 (1), 1003–1009. doi:10.3892/ol.2018.8768
Wu, C., Liu, F., Chen, H., Liu, Q., Song, C., Cheng, K., et al. (2022). Identification of ferroptosis-related lncRNA pairs for predicting the prognosis of head and neck squamous cell carcinoma. J. Oncol. 2022, 7602482. doi:10.1155/2022/7602482
Xu, S., Liu, D., Chang, T., Wen, X., Ma, S., Sun, G., et al. (2022). Cuproptosis-associated lncRNA establishes new prognostic profile and predicts immunotherapy response in clear cell renal cell carcinoma. Front. Genet. 13, 938259. doi:10.3389/fgene.2022.938259
Yan, P., He, Y., Xie, K., Kong, S., and Zhao, W. (2018). In silico analyses for potential key genes associated with gastric cancer. PeerJ 6, e6092. doi:10.7717/peerj.6092
Zhang, L., Li, D.-C., and Liu, L.-F. (2019). Paeonol: pharmacological effects and mechanisms of action. Int. Immunopharmacol. 72, 413–421. doi:10.1016/j.intimp.2019.04.033
Zhang, Y., Qian, J., Gu, C., and Yang, Y. (2021). Alternative splicing and cancer: a systematic review. Signal Transduct. Target Ther. 6 (1), 78. doi:10.1038/s41392-021-00486-7
Keywords: paeonol, cervical carcinoma, prognostic signature, differentially expressed genes, alternative splicing
Citation: Li M, Gao N, Xu L, Ge P, Jiang N and Shang Y (2025) Integrative RNA-seq and LASSO-COX analysis reveal Paeonol’s key target gene in proliferation suppression and apoptosis-induced in cervical cancer. Front. Pharmacol. 16:1646473. doi: 10.3389/fphar.2025.1646473
Received: 17 June 2025; Accepted: 09 September 2025;
Published: 07 October 2025.
Edited by:
Francisca Rodrigues, University of Porto, PortugalReviewed by:
Patrícia M. A. Silva, Cooperativa de Ensino Superior Politécnico e Universitário, PortugalFang Yang, Charité University Medicine Berlin, Germany
Copyright © 2025 Li, Gao, Xu, Ge, Jiang and Shang. This is an open-access article distributed under the terms of the Creative Commons Attribution License (CC BY). The use, distribution or reproduction in other forums is permitted, provided the original author(s) and the copyright owner(s) are credited and that the original publication in this journal is cited, in accordance with accepted academic practice. No use, distribution or reproduction is permitted which does not comply with these terms.
*Correspondence: Nan Jiang, bGluZGFfbmFubmFuQDEyNi5jb20=; Yuhong Shang, c2hhbmd5dWhvbmdAZG11LmVkdS5jbg==
†These authors have contributed equally to this work