Abstract
Introduction:
Tongue features, which are emerging imaging-based biomarkers, have been integrated into predictive models for various diseases. However, their role in assessing rheumatoid arthritis (RA) activity remains unexplored. This study aims to develop a clinically applicable model for assessing RA activity by analyzing the relationship between tongue features and laboratory indicators.
Methods:
We enrolled 227 patients who visited the Department of Traditional Chinese Medicine Rheumatology, China-Japan Friendship Hospital, from April 2021 to March 2023. Patients were stratified into remission/low-activity (n = 75) and moderate/high activity (n = 152) groups. Multivariable logistic regression was used to develop two predictive models: Model 1 (based on laboratory parameters) and Model 2 (Model 1 plus tongue features). Both models were presented as nomograms and web-based calculators. Model discrimination was evaluated using receiver operating characteristic curves, calibrated via calibration plots, and clinical utility was determined using decision curve analysis.
Results:
Multivariable logistic regression identified white blood cell (WBC), hemoglobin (HGB), platelets (PLT), and IgA as predictors in Model 1, while Model 2 incorporated WBC, HGB, greasy coating and sublingual varicosity. Model 2 outperformed Model 1, achieving an area under the curve of 0.846 (95% confidence interval = 0.740–0.951), with a sensitivity of 0.63 and specificity of 0.826. A nomogram and online calculator were developed from this optimized model for clinical use.
Conclusion:
We have developed a preliminary RA disease activity assessment model integrating tongue features and laboratory parameters. This model shows high accuracy and considerable potential for clinical utility.
1 Introduction
Rheumatoid arthritis (RA) is a systemic autoimmune disease characterized by chronic inflammation of the synovial membranes (Littlejohn and Monrad, 2018). Clinically, it presents with morning stiffness, joint pain, swelling, and progressive joint destruction. In advanced stages, RA may cause systemic complications, including interstitial lung disease and cardiovascular disorders. Global epidemiological data indicate a prevalence of approximately 0.5%–1% (Hassen et al., 2024). In China, the prevalence is 0.42%, with RA-related mortality accounting for 20% of deaths attributed to arthritis and musculoskeletal diseases (Jin et al., 2017). This public health burden underscores the importance of early intervention.
Treat-to-target (T2T) strategies, grounded in evidence-based medicine, are widely accepted in RA management. Their primary goal is to achieve clinical remission or maintain low disease activity through dynamic and continuous monitoring of disease progression. Accurate assessment of disease activity is clinically important for both quantitative prognostic evaluation and for guiding stepwise optimization of therapy (Anderson et al., 2012). Currently, the American College of Rheumatology (ACR) recommends multidimensional composite systems to evaluate RA activity, including the Disease Activity Score using 28-joint counts (DAS28), Simplified Disease Activity Index (SDAI), Clinical Disease Activity Index (CDAI), Patient Activity Scale (PAS), PAS-Ⅱ, and Routine Assessment of Patient Index Data 3 (RAPID-3). These measures incorporate parameters such as tender joint count (TJC), swollen joint count (SJC), and patient global assessment. Although validated and widely used, they require specialized training, particularly for assessing joint tenderness and swelling, limiting their use in non-specialist settings and creating challenges in primary care or patient self-management. Consequently, developing simplified yet reliable disease activity assessment tools are essential. Such methods can broaden use among non-rheumatologist healthcare providers and enable patient self-monitoring, thereby promoting individualized, responsive treatment strategies consistent with the T2T paradigm.
Imaging features are valuable for accurate RA diagnosis and prognosis. They reveal the extent of joint structural damage and, more importantly, enable quantitative assessment of disease progression, providing predictive insights into future clinical outcomes. Quantitative analysis of bone marrow edema via magnetic resonance imaging effectively predicts structural progression in patients in clinical remission (Gandjbakhch et al., 2011; Baker et al., 2014). Similarly, predictive models combining musculoskeletal ultrasound features with clinical risk factors can help identify individuals at high risk for bone erosion (Yan et al., 2025). Notably, tongue features, classified as imaging characteristics, are non-invasive, simple, and cost-effective. Therefore, tongue features are increasingly incorporated into clinical prediction models. Duan et al. developed a coronary artery disease diagnostic model based on tongue features, demonstrating robust performance (Duan et al., 2024). Li et al. report that incorporating tongue features significantly enhanced the accuracy of conventional machine learning models for diabetes risk prediction (Li et al., 2021). Collectively, these findings highlight the complementary diagnostic value of tongue features in systemic disease assessment and suggest that combining them with traditional serum biomarkers could yield more practical, multimodal RA risk assessment models.
Building on this evidence, this study aims to investigate the potential of objective tongue features as a complementary tool for assessing RA disease activity. Using machine learning algorithms, we integrate tongue parameters, blood biochemical indicators, and immune biomarkers to develop a disease activity assessment framework tailored to the Chinese population, thereby offering a potential adjunctive tool for clinical evaluation.
2 Materials and methods
2.1 Study design and participant selection
This cross-sectional study was conducted in accordance with the Transparent Reporting of a Multivariable Prediction Model for Individual Prognosis or Diagnosis guidelines (Collins et al., 2015). Between April 2021 and March 2023, 478 patients diagnosed with RA and treated at the Department of Traditional Chinese Medicine Rheumatology, China-Japan Friendship Hospital, were screened for eligibility. Exclusion criteria were as follows: 1) primary diagnosis other than RA or coexisting rheumatic diseases such as systemic lupus erythematosus or Sjögren’s syndrome; 2) severe infections, malignant tumors, hepatic or renal failure, or hematologic disorders; 3) neurological or psychiatric disorders impairing protocol compliance; 4) surgical procedures, major trauma, pregnancy, or lactation within the past 3 months; 5) treatment with glucocorticoids, biologics, or targeted synthetic disease-modifying antirheumatic drugs within 4 weeks before enrollment; or 6) incomplete clinical data (Figure 1).
FIGURE 1
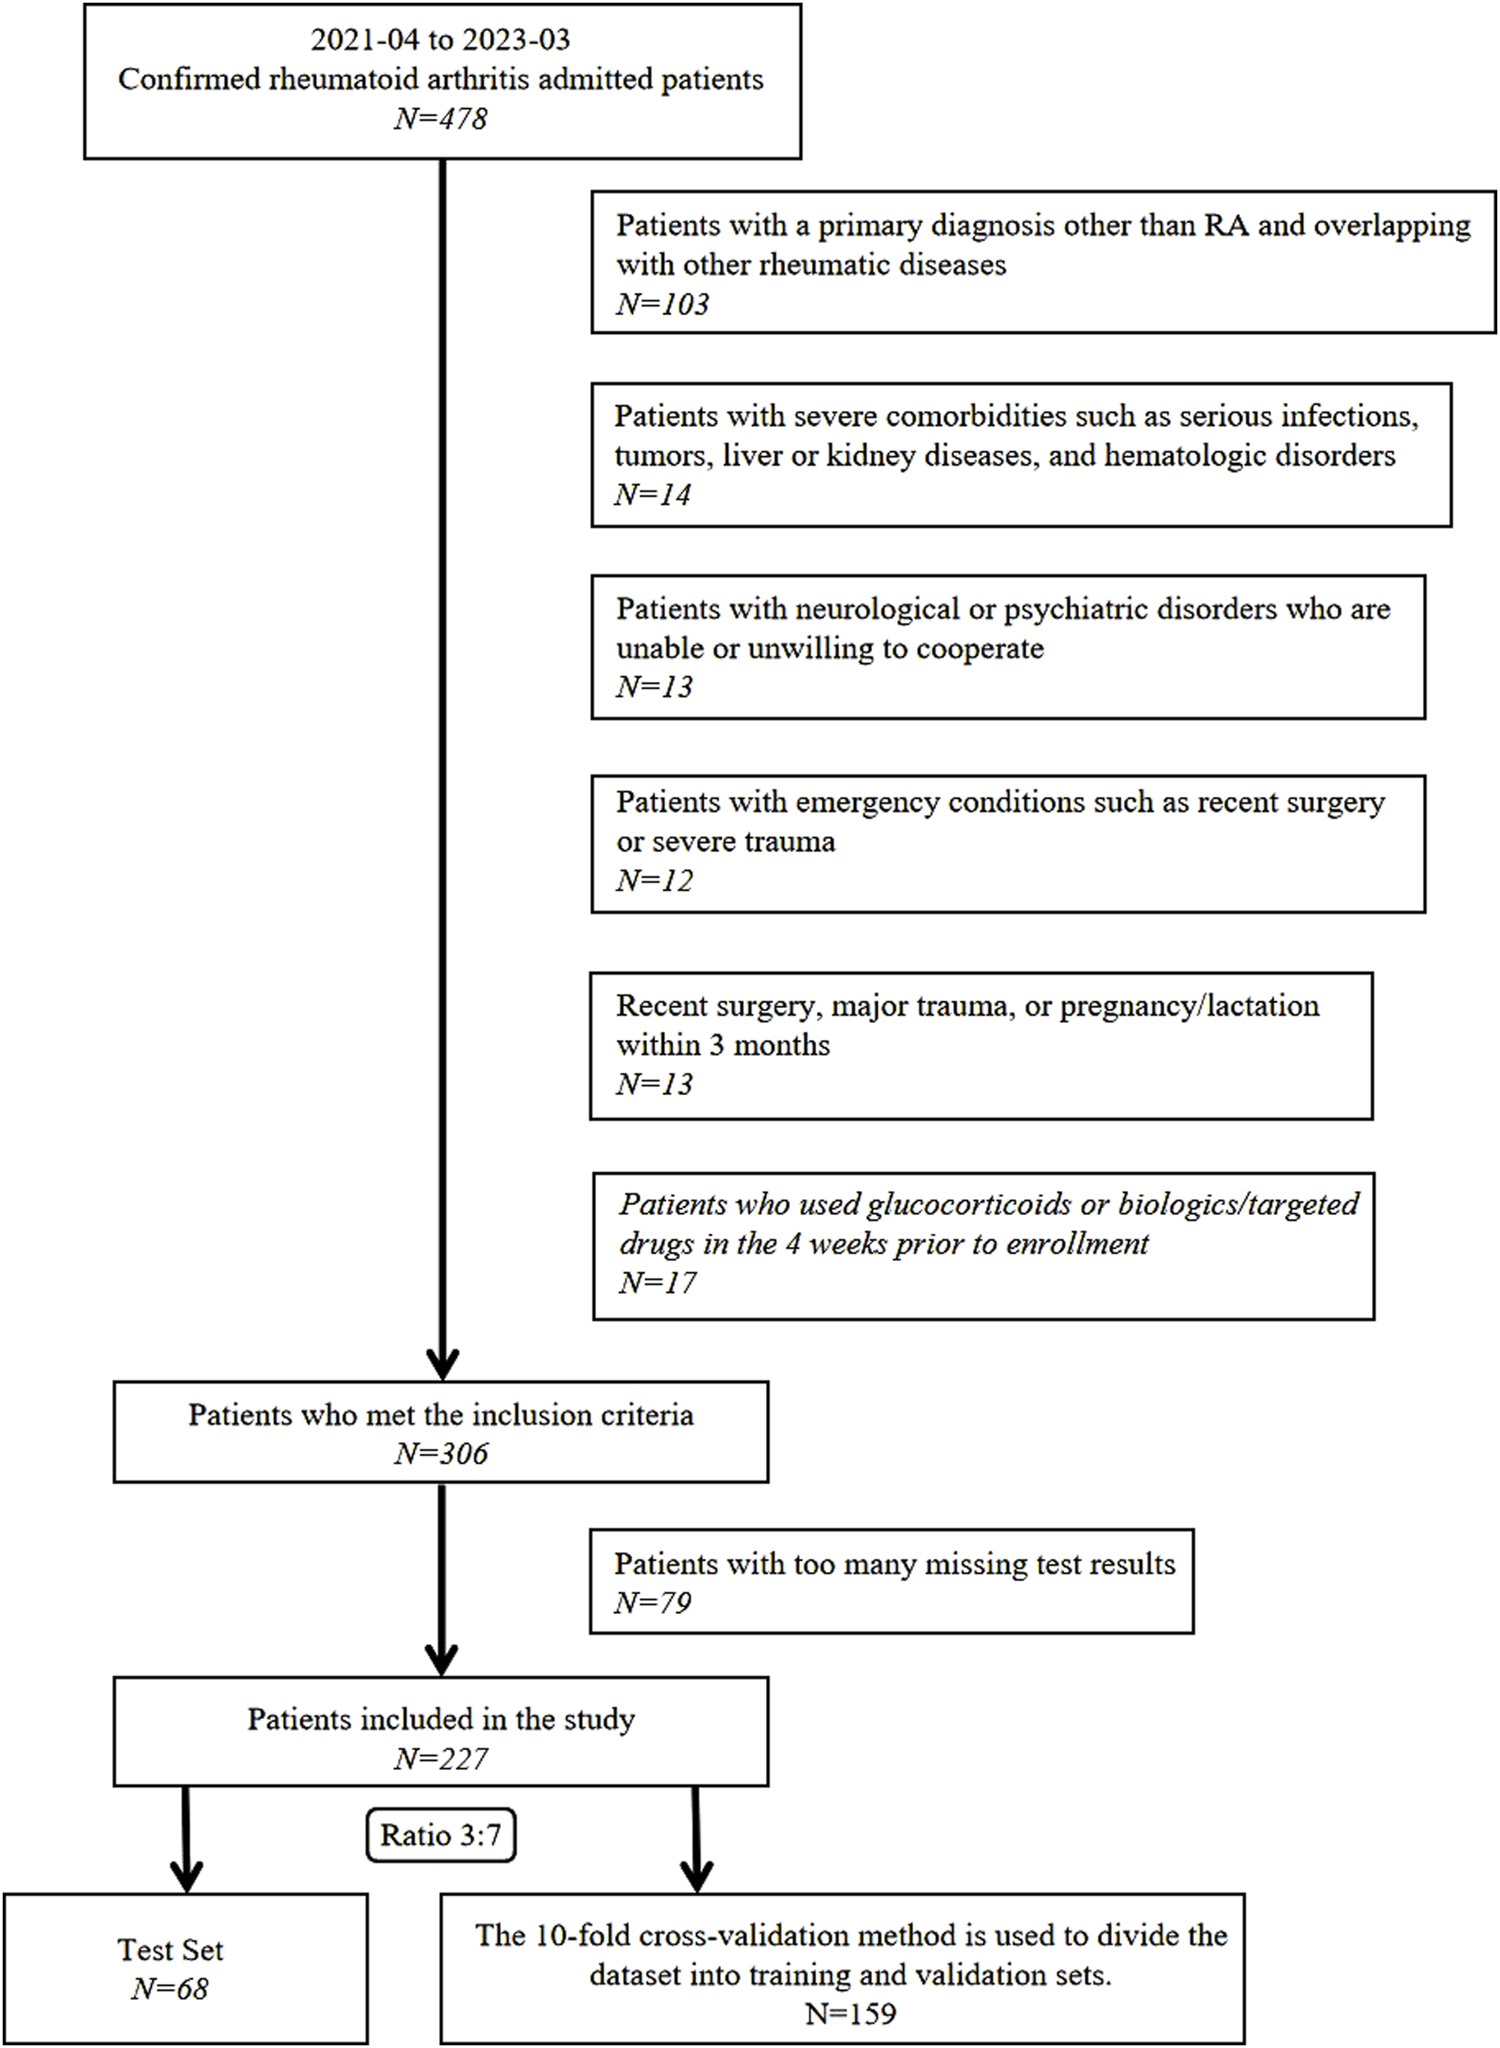
Participant screening and enrollment workflow.
After applying these rigorous exclusion criteria, 251 participants were excluded, resulting in a final cohort of 227 patients with RA. This study adhered to the ethical principles of the Declaration of Helsinki and was approved by the China-Japan Friendship Hospital Clinical Research Ethics Committee (Approval No. 2020-133-K86). All participants provided written informed consent for the anonymized use of their data in subsequent clinical research.
2.2 Diagnostic criteria
Patient enrollment required meeting the 2010 ACR and European League Against Rheumatism classification criteria for RA (Aletaha et al., 2010).
2.3 Data collection
2.3.1 Clinical data collection
Demographic and clinical characteristics were documented, including sex, age (years), disease duration (years), height (cm), weight (kg), body mass index (kg/m2), smoking history, history of alcohol consumption, and blood pressure (mmHg, measured after 5 min of rest). Morning venous blood samples were collected and analyzed at the clinical laboratory of China-Japan Friendship Hospital. Laboratory tests included: (1) hematology: white blood cell (WBC) count, red blood cell (RBC) count, hemoglobin (HGB), and platelet (PLT) count; (2) inflammatory markers: erythrocyte sedimentation rate (ESR), C-reactive protein (CRP); and (3) immunological parameters: rheumatoid factor (RF), anti-cyclic citrullinated peptide antibody (ACCP), immunoglobulins (IgA/IgM/IgG), and complement components C3 and C4.
Disease activity was assessed and classified using the DAS-28 with ESR (DAS28-ESR). Patients were categorized into remission/low activity (DAS28-ESR ≤3.2) or moderate-to-high activity (DAS28-ESR >3.2) groups. The DAS28-ESR was calculated using the validated formula (Wells et al., 2009): DAS28-ESR = , where TJC28 is the tender joint count (28 joints), SJC28 denotes the swollen joint count (28 joints), ESR is the erythrocyte sedimentation rate (mm/h), and GH is the patient global health score on a 0–100 mm visual analogue scale.
2.3.2 Tongue features collection
To ensure image consistency and minimize confounding factors, acquisition followed a standardized protocol encompassing participant preparation, precise image capture, and quality-controlled processing.
2.3.2.1 Participant preparation
Before imaging, patients completed specific preparations to optimize image quality: fasting from food and beverages (except plain water) for at least 6 h, rinsing the mouth with plain water to remove potential contaminants, and reporting dietary or medication intake within the previous 24 h to identify possible influences on tongue coating color and morphology.
2.3.2.2 Image acquisition procedures
Images were captured using a standardized Tongue Diagnosis Imaging System under constant illumination to ensure uniform lighting conditions across all patients. A precise vertical shooting angle and the built-in positioning frame of the device ensured the tongue occupied a fixed proportion within the frame, thereby standardizing the field of view. Participants sat in a standardized posture with the tongue naturally relaxed and the tip gently touching the lower incisors, allowing full exposure of the midline dorsal and sublingual regions. The acquisition protocol required standardized imaging of both areas, and all raw images were de-identified immediately after capture to protect privacy.
2.3.2.3 Image processing and quality control
After acquisition, all raw images underwent automatic exposure and color correction to standardize their appearance. The tongue region was subsequently cropped to focus on the area of interest and standardize the analytical field of view. Trained personnel conducted rigorous manual quality control to exclude images with issues such as improper tongue protrusion (e.g., incomplete exposure), excessive saliva obscuring features, or severe blurriness. Only qualified images were retained for analysis.
2.3.2.4 Tongue image interpretation and feature grading
To ensure objectivity, consistency, and diagnostic reliability in interpreting tongue features, specific protocols were followed. Sublingual vein grading, alongside evaluation of tongue coating and texture, was independently performed by at least two trained traditional Chinese medicine practitioners. When discrepancies occurred, a third expert reviewer adjudicated to reach consensus. Figure 2 shows the classification criteria for sublingual vein grading.
FIGURE 2
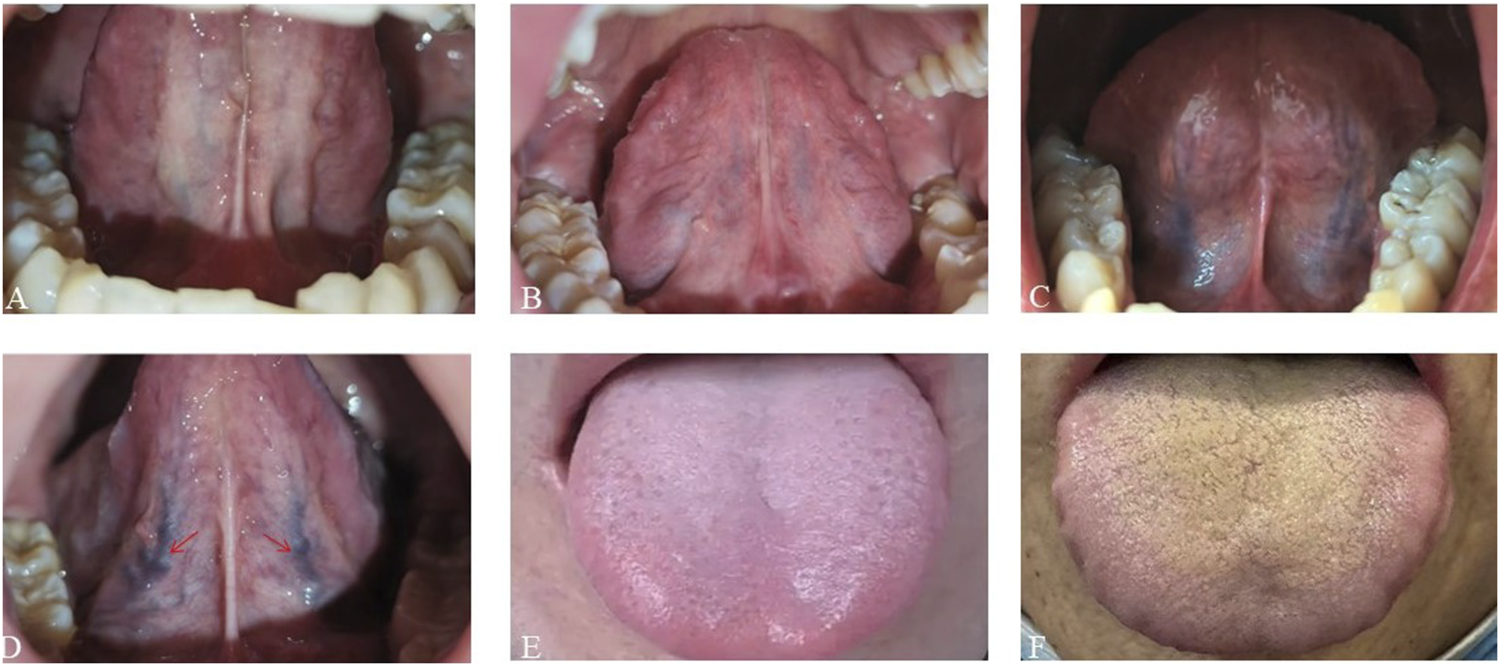
Schematic diagrams of tongue features. (A–D) Sublingual varicosity grading. The sublingual vein comprises submucosal veins on the ventral surface of the tongue that run alongside the lingual nerve and its tributaries. Grading is based on four parameters: vein length, diameter, tortuosity, and color. (A) Grade 0: Light blue or lavender veins extending ≤50% of the distance from the sublingual caruncle to the tongue tip. (B) Grade I Pale to bluish-purple veins extending beyond 50% of the distance without significant tortuosity. (C) Grade II: Dark purple veins extending beyond 50% of the distance with radial branching. (D) Grade III: Dark purple veins with localized nodular dilation (indicated by arrows); severe cases may show grape-like clusters. (E,F) Greasy coating grading. (E) Non-greasy coating: Filiform papillae remain discretely distributed (>50 μm inter-papillary spacing) over pink mucosa without consolidated keratinized layers. (F) Greasy coating: Filiform papillae merge into continuous keratinized sheets with absent interpapillary spaces and yellowish-white debris covering.
2.4 Statistical analysis
Statistical analyses and visualizations were conducted using R (version 3.6.3) and Python with the scikit-learn library (version 0.22.1). Normally distributed continuous variables are expressed as mean ± standard deviation (SD), and non-normally distributed variables are presented as median (interquartile range). Categorical data are presented as frequencies and percentages. For group comparisons, the independent-samples t-test was used for normally distributed continuous variables, while the Mann–Whitney U test (Wilcoxon rank-sum test) was used for non-normally distributed variables. Categorical variables were compared using the chi-squared (χ2) test. For variables with <20% missing values, multiple imputation was conducted using the Multivariate Imputation by Chained Equations (MICE) package (version 3.16.0) in R to improve completeness and reduce bias from missing data.
Multivariate logistic regression (LR) analyses were performed to evaluate the predictive capacity of two models for RA disease activity. Before model development, key predictors were identified using the Boruta feature selection algorithm, which ranks variables by importance (Kursa and Rudnicki, 2010). Effect sizes for each variable were expressed as odds ratios (ORs) with 95% confidence intervals (CIs).
Receiver operating characteristic (ROC) curves were plotted using R software, and the area under the curve (AUC) was calculated to evaluate model discrimination. Differences in AUCs between models were assessed using the non-parametric DeLong test (Zou et al., 2024). Clinical utility was further examined using Decision Curve Analysis (DCA) with the rmda package (version 1.6) in R, which quantifies net benefit across clinically relevant threshold probabilities to guide risk-benefit decisions. Model calibration was evaluated using calibration curves generated in Python’s scikit-learn library (version 0.22.1) to illustrate the agreement between predicted probabilities and observed outcomes. The dataset was split via random sampling, with 30% allocated to an independent test set and 70% used for model development and validation. The latter subset underwent 10-fold cross-validation, with iterative training on nine folds and validation on the tenth. A learning curve was plotted to evaluate model performance. RA disease activity status for each patient was predicted from model-generated risk scores and compared with actual clinical outcomes. Sensitivity, specificity, positive predictive value (PPV), and negative predictive value (NPV) were calculated for both models. Net reclassification improvement (NRI) and integrated discrimination improvement (IDI) were calculated to quantify improvements in discriminative performance, reflecting improvements in correctly classifying individuals into appropriate categories (Mayaud et al., 2013; Cook and Paynter, 2011). For the multivariate logistic regression models, a nomogram was constructed to visualize the contribution of each predictor to the overall risk estimation. An online interactive web-based risk calculator was generated using an R Shiny-based web application, allowing users to enter variables and receive individualized, real-time risk predictions (RStudio Team, 2023). All statistical analyses were two-sided, with p < 0.05 indicating statistical significance.
3 Results
3.1 Analysis of cohort clinical characteristics
This study included 227 patients, with a mean DAS28 of 4.07 ± 1.57 (mean ± SD) for the entire cohort. Among them, 75 patients (33.04%) were classified as having remission or low disease activity, and 152 (66.96%) as having moderate to high disease activity. Table 1 summarizes the baseline demographic and clinical characteristics of the two groups.
TABLE 1
| Variables | Total sample size (n = 227) | Remission/low activity (n = 75) | Moderate/high activity (n = 152) | P value▲ |
|---|---|---|---|---|
| Age (years, ± s) | 58.75 ± 13.65 | 57.44 ± 15.63 | 59.39 ± 12.57 | 0.347 |
| BMI(kg/m2) | 22.47 ± 3.45 | 22.13 ± 3.29 | 22.63 ± 3.52 | 0.307 |
| WBC(109/L) | 5.87 ± 1.82 | 5.20 ± 1.53 | 6.19 ± 1.86 | 0.001** |
| RBC(1012/L) | 4.04 ± 0.54 | 4.04 ± 0.57 | 4.03 ± 0.53 | 0.951 |
| HGB (g/L) | 117.43 ± 16.92 | 121.47 ± 18.18 | 115.44 ± 15.96 | 0.011* |
| PLT (109/L) | 250.48 ± 85.13 | 223.01 ± 57.87 | 264.04 ± 92.98 | 0.001** |
| Female, n (%) | 172 (75.8) | 57 (76) | 115 (75.7) | 0.955 |
| Alcohol history, n (%) | 24 (10.6) | 6 (8.0) | 18 (11.8) | 0.378 |
| Smoking history, n (%) | 27 (11.89) | 6 (8.0) | 21 (13.8) | 0.170 |
| Duration (years,P25,P75) | 8 (3,15) | 7 (2,15) | 8.5 (3,16.75) | 0.266 |
| RF(IU/mL,P25,P75) | 89 (23,388) | 73 (21,309) | 102.5 (27,438.5) | 0.196 |
| anti-CCP(U/mL,P25,P75) | 546 (49,1667) | 598 (78,1724) | 525.5 (41.75,1637.5) | 0.426 |
| IgA(mg/dL,P25,P75) | 271 (196,368) | 225 (173,314) | 293 (217.75,385.5) | 0.001** |
| IgM(mg/dL,P25,P75) | 117 (81,153) | 117 (78,151) | 118 (85.25,154) | 0.66 |
| IgG (mg/dL,P25,P75) | 1,320 (1100,1630) | 1,280 (1100,1520) | 1,340 (1,097.5,1647.5) | 0.208 |
| Complement 3 (mg/dL,P25,P75) | 88.4 (76.8,102) | 82.3 (72.2,95.3) | 90.4 (78.93,106.75) | 0.013* |
| Complement 4 (mg/dL,P25,P75) | 19 (15.9,23.4) | 18.2 (15.5,22.6) | 19.3 (15.9,24.45) | 0.179 |
Baseline data of remission/low disease activity and moderate-to-high disease activity groups.
Values are presented mean ± SD., median (IQR) or percent. BMI, body mass index; WBC, white blood cell; RBC, red blood cell; HGB, hemoglobin; PLT, platelet; RF, rheumatoid factor; anti-CCP, anti-cyclic peptide containing citrulline; IgA, Immunoglobulin A; IgM, Immunoglobulin M; IgG, Immunoglobulin G; C3, complement C3; C4, complement C4.
▲ Differences between the remission/low activity and moderate-to-high activity groups were analyzed, *P < 0.05,**P < 0.01.
3.2 Analysis of cohort tongue features
Table 2 shows the tongue characteristics between groups. Significant group differences were observed in the distribution of tongue color, texture, coating color, coating thickness, greasy coating, and degree of sublingual varicosity (P < 0.05).
TABLE 2
| Tongue features | Total sample size (n = 227) | Grouping | Chi-square test | ||
|---|---|---|---|---|---|
| Remission/low activity (n = 75) | Moderate/high activity (n = 152) | X2 value | P value▲ | ||
| Color of tongue body | |||||
| Red | 111 (48.90%) | 28 (37.33%) | 83 (54.61%) | 12.859 | 0.002** |
| Light red | 90 (39.65%) | 42 (56%) | 48 (31.58%) | ||
| Cyanotic | 26 (11.45%) | 5 (6.67%) | 21 (13.81%) | ||
| Shape of tongue body | |||||
| Normal | 171 (75.33%) | 63 (84%) | 108 (71.05%) | 5.09 | 0.078 |
| Thin | 22 (9.69%) | 6 (8%) | 16 (10.53%) | ||
| Enlarged | 34 (14.98%) | 6 (8%) | 28 (18.42%) | ||
| Dorsal tongue mucosa | |||||
| Hyperkeratinized | 101 (44.49%) | 20 (26.67%) | 81 (53.29%) | 14.413 | 0.001** |
| Hypokeratinized | 126 (55.51%) | 55 (73.33%) | 71 (46.71%) | ||
| Teeth marks on tongue edges | |||||
| Absence | 157 (69.16%) | 58 (77.33%) | 99 (65.13%) | 3.506 | 0.061 |
| Presence | 70 (30.84%) | 17 (22.67%) | 53 (34.87%) | ||
| Fissured tongue | |||||
| Absence | 193 (85.02%) | 64 (85.33%) | 129 (84.87%) | 0.009 | 0.926 |
| Presence | 34 (14.98%) | 11 (14.67%) | 23 (15.13%) | ||
| Color of coating | |||||
| Yellow fur | 88 (38.77%) | 19 (25.33%) | 69 (45.39%) | 8.514 | 0.004** |
| White fur | 139 (61.23%) | 56 (74.67%) | 83 (54.61%) | ||
| Thickness of coating | |||||
| Thin fur | 150 (66.08%) | 60 (80%) | 90 (59.21%) | 9.684 | 0.002** |
| Thick fur | 77 (33.92%) | 15 (20%) | 62 (40.79%) | ||
| Moistness of coating | |||||
| Moist fur | 199 (87.67%) | 65 (86.67%) | 134 (88.16%) | 0.103 | 0.748 |
| Dry fur | 28 (12.33%) | 10 (13.33%) | 18 (11.84%) | ||
| Greasy coating | |||||
| No | 122 (53.74%) | 56 (74.67%) | 66 (43.42%) | 19.722 | 0.001** |
| Yes | 105 (46.26%) | 19 (25.33%) | 86 (56.58%) | ||
| Coverage of coating | |||||
| Normal | 188 (82.82%) | 64 (85.33%) | 124 (81.58%) | 0.497 | 0.481 |
| Below normal | 39 (17.18%) | 11 (14.67%) | 28 (18.42%) | ||
| Extent of sublingual varicosity | |||||
| 0 | 98 (43.17%) | 53 (70.67%) | 45 (29.61%) | 35.344 | 0.001** |
| Ⅰ | 93 (40.97%) | 19 (25.33%) | 74 (48.68%) | ||
| Ⅱ | 33 (14.54%) | 3 (4%) | 30 (19.74%) | ||
| Ⅲ | 3 (1.32%) | 0 (0%) | 3 (1.97%) | ||
Detailed information of cohort tongue features.
▲ Differences between the remission/low activity and moderate-to-high activity groups were analyzed, *P < 0.05,**P < 0.01.
3.3 Development of laboratory indicator-based model
3.3.1 Prioritization of laboratory indicators
Eleven laboratory indicators were analyzed: WBC, RBC, HGB, PLT, RF, ACCP, IgA, IgM, IgG, C3, and C4. The Boruta algorithm was used to rank these indicators based on their importance in the RA cohort, ultimately selecting four for model development in descending order: WBC, HGB, IgA, and PLT (Figure 3).
FIGURE 3
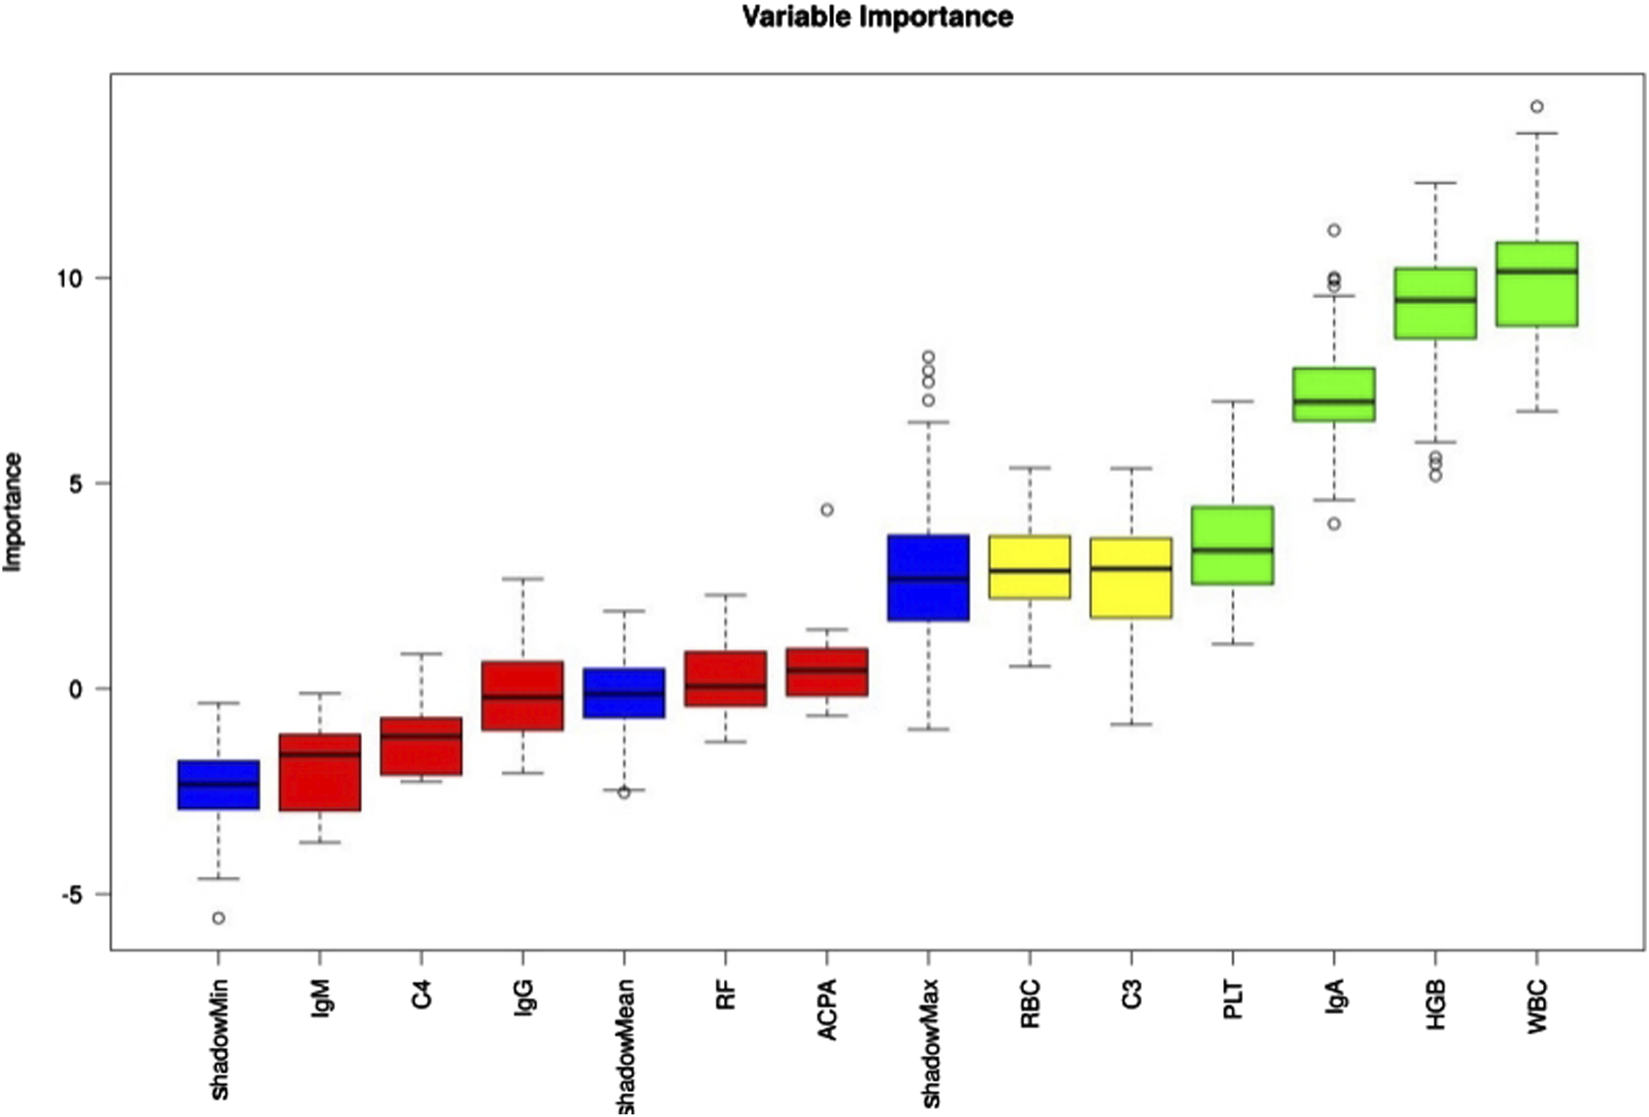
Laboratory indicator importance was assessed using the Boruta algorithm, with results color-coded as follows: green = confirmed, yellow = tentative, red = rejected.
3.3.2 Laboratory indicators interpretation and development of laboratory indicator-based model
A laboratory indicator-based model (Model 1) was constructed using WBC, HGB, IgA, and PLT as predictive factors. Table 3 presents their independent association with patient outcomes. WBC (OR: 1.409, 95% CI: 1.134–1.751) and IgA (OR: 1.003, 95% CI: 1.000–1.006) were risk factors for higher disease activity in patients with RA (P < 0.05 for both), while HGB (OR: 0.976, 95% CI: 0.957–0.996) was a protective factor against high disease activity (P < 0.05).
TABLE 3
| Covariate | Regression coefficient | Standard error | Wald χ2 | Odds ratio (95% CI) | P-value |
|---|---|---|---|---|---|
| WBC (109/L) | 0.343 | 0.111 | 9.569 | 1.409 (1.134,1.751) | 0.002** |
| HGB (g/L) | −0.024 | 0.010 | 5.637 | 0.976 (0.957,0.996) | 0.018* |
| PLT (109/L) | 0.005 | 0.003 | 3.841 | 1.005 (1.000,1.010) | 0.050 |
| IgA (mg/dL) | 0.003 | 0.001 | 4.697 | 1.003 (1.000,1.006) | 0.030* |
Multivariate logistic regression analysis of laboratory indicators associated with RA Moderate-to-high disease activity.
Model 1, developed using multivariate logistic regression, was evaluated through multiple validation metrics, including the AUC, calibration curves, learning curves, and DCA. Figures 4A–C shows that the AUC of Model 1 was 0.737 (95% CI: 0.650–0.824), 0.699 (95% CI: 0.409–0.963), and 0.736 (95% CI: 0.613–0.860) in the training, validation, and testing sets, respectively, indicating moderate discrimination across datasets. The calibration curve is closely aligned with the 45° diagonal line, suggesting good calibration (Figure 4D). As training size increased, the AUC values for the training and validation sets gradually stabilized. The convergence of AUC values indicated that Model 1 had reached its asymptotic performance. The AUC values eventually stabilized around 0.75, reflecting satisfactory discrimination and consistent generalization without overfitting or underfitting (Figure 4E). DCA further confirmed the clinical applicability of the model (Figure 4F).
FIGURE 4
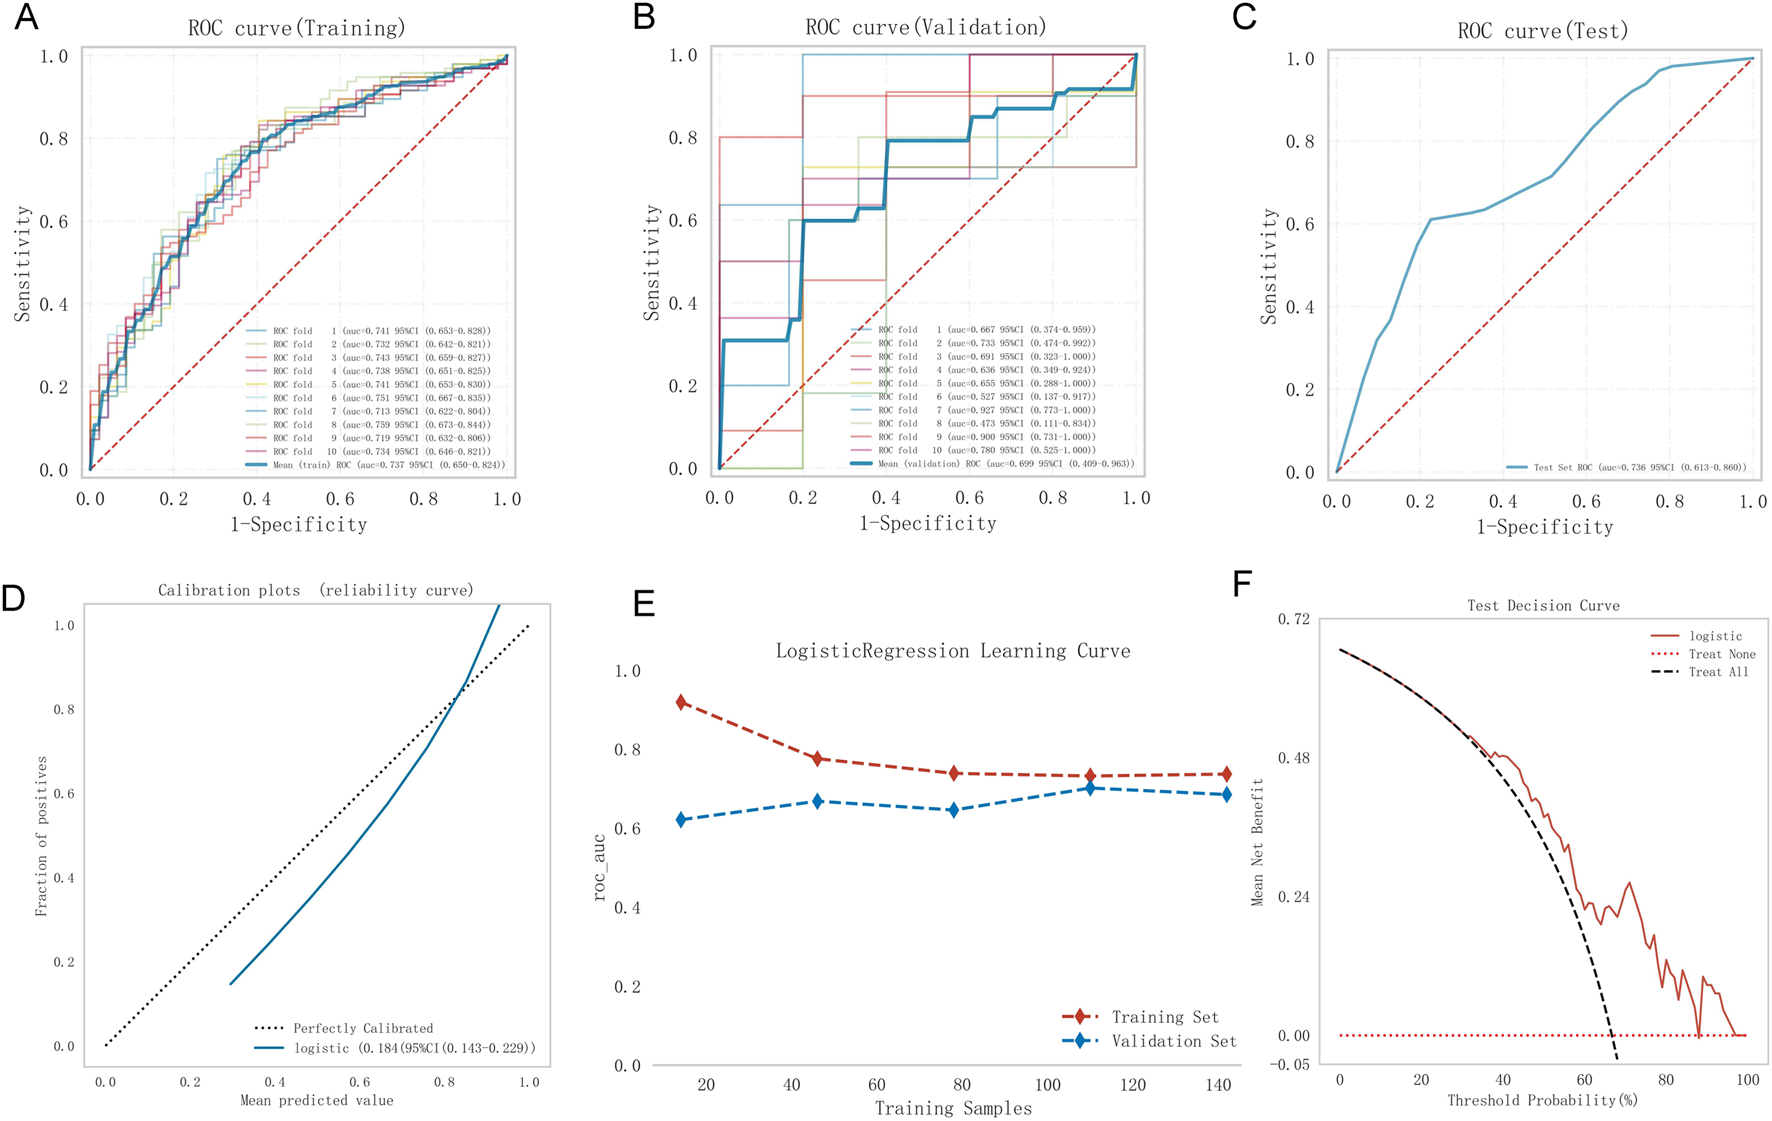
Model 1 performance. (A) Training ROC, (B) validation ROC, (C) test ROC, (D) calibration plot, (E) learning curves (training data: red dashed; validation data: blue dashed), (F) test DCA. ROC, receiver operating characteristic curve; DCA, decision curve analysis.
3.4 Development of tongue feature-based model
Model 2, the tongue feature-based model, was developed by adding tongue features to Model 1. These features included tongue color and shape, dorsal mucosa, teeth marks on tongue edges, fissures, color, thickness, moistness, greasy coating, coating coverage, and extent of sublingual varicosity. After feature selection, four predictors remained: WBC, HGB, greasy coating, and extent of sublingual varicosity. Table 4 shows that WBC (OR: 1.484, 95% CI: 1.185–1.858), greasy coating (OR: 2.721, 95% CI: 1.362–5.435), and extent of sublingual varicosity (OR: 3.813, 95% CI: 2.182–6.665) were significant risk factors for high disease activity in patients with RA (P < 0.05), while HGB (OR: 0.970, 95% CI: 0.951–0.990) was a protective factor (P < 0.05).
TABLE 4
| Covariate | Regression coefficient | Standard error | Wald χ2 | Odds ratio (95% CI) | P-value |
|---|---|---|---|---|---|
| Greasy coating | 1.001 | 0.353 | 8.040 | 2.721 (1.362,5.435) | 0.005** |
| Extent of sublingual varicosity | 1.338 | 0.285 | 22.069 | 3.813 (2.182,6.665) | 0.000* |
| WBC (109/L) | 0.395 | 0.115 | 11.845 | 1.484 (1.185,1.858) | 0.001** |
| HGB (g/L) | −0.03 | 0.10 | 8.517 | 0.970 (0.951,0.990) | 0.004** |
Multivariate logistic regression analysis of laboratory indicators and tongue features associated with RA Moderate-to-high disease activity.
Figures 5A–C shows the performance of Model 2. The AUC was 0.813 (95% CI: 0.738–0.887), 0.794 (95% CI: 0.548–0.987), and 0.846 (95% CI: 0.740–0.951) for the training, validation, and test sets, respectively, indicating good discrimination. The calibration curve closely matched the ideal calibration line, with slight underestimation at probabilities >0.8 (Figure 5D). The Hosmer–Lemeshow test yielded 0.723 (>0.05), confirming a good fit. In the learning curve, the training set AUC stabilized at approximately 0.81 as the sample size increased, with no signs of overfitting (Figure 5E). DCA showed favorable clinical utility (Figure 5F).
FIGURE 5
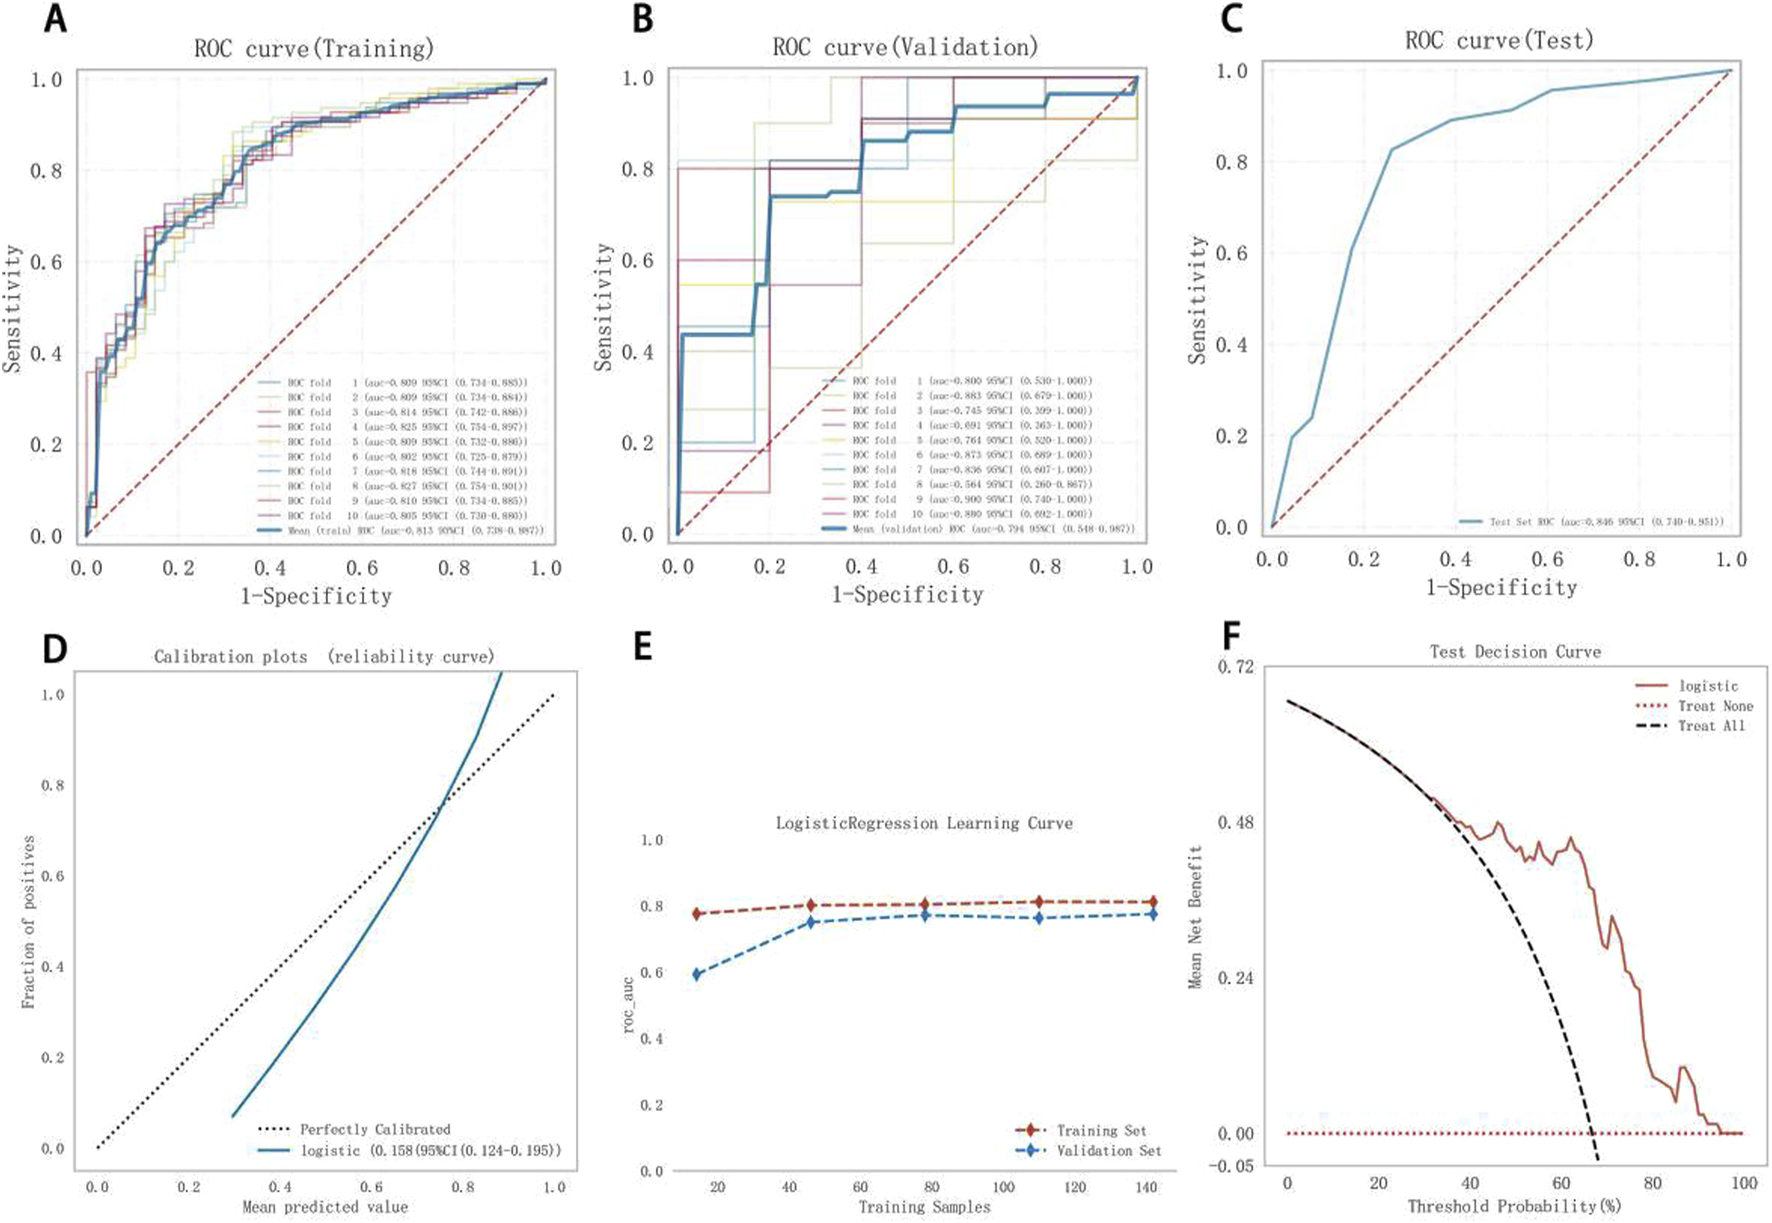
Model 2 performance. (A) Training ROC, (B) validation ROC, (C) test ROC, (D) calibration plot, (E) learning curves (training data: red dashed; validation data: blue dashed), (F) test DCA. ROC, receiver operating characteristic curve; DCA, decision curve analysis.
3.5 Model comparison
The predictive performance of both models was systematically assessed across the training, validation, and test sets using the cutoff value, sensitivity, specificity, PPV, NPV, F1 score, and AUC (Table 5). Model 2 achieved a higher PPV than Model 1, though both models exhibited relatively low NPVs in the test set. The AUC values of Model 2 in the validation and test sets were higher than those of Model 1, indicating better discriminatory accuracy. DeLong’s test confirmed a statistically significant difference between the ROC AUCs of Models 1 and 2 (P = 0.014). According to the IDI formula: IDI = . Since IDI >0, Model 2 demonstrated significantly improved disease activity discrimination compared to Model 1. The NRI was calculated as: , reflecting a marked improvement in classification capacity.
TABLE 5
| Model | Groups | AUC (95%CI) | Cutoff | Accuracy | Sensitivity | Specificity | PPV | NPV | F1 score |
|---|---|---|---|---|---|---|---|---|---|
| Model 1 | Training set | 0.737 (0.650–0.824) | 0.616 | 0.715 | 0.735 | 0.673 | 0.823 | 0.563 | 0.773 |
| Validation set | 0.699 (0.409–0.963) | 0.616 | 0.670 | 0.705 | 0.593 | 0.801 | 0.558 | 0.728 | |
| Test set | 0.736 (0.613–0.860) | 0.587 | 0.652 | 0.739 | 0.478 | 0.739 | 0.478 | 0.739 | |
| Model 2 | Training set | 0.813 (0.738–0.887) | 0.644 | 0.755 | 0.742 | 0.780 | 0.877 | 0.611 | 0.800 |
| Validation set | 0.794 (0.548–0.987) | 0.644 | 0.704 | 0.705 | 0.687 | 0.833 | 0.560 | 0.753 | |
| Test set | 0.846 (0.740–0.951) | 0.7 | 0.696 | 0.63 | 0.826 | 0.879 | 0.528 | 0.734 |
Models’ performance in predicating high disease activity of RA patients.
3.6 Model presentation and application
To visualize the variable contributions in the modified Model 2, a color nomogram was developed (Figure 6) (Iasonos et al., 2008; Wang R. et al., 2022). The scoring system of this nomogram, derived from the multivariate logistic regression results, assigns each predictor a score proportional to its regression coefficient, indicating its effect on the risk of high RA disease activity. These scores reflect the relative influence of each predictor on the risk of high RA disease activity, with stronger effects represented by deeper colors.
FIGURE 6
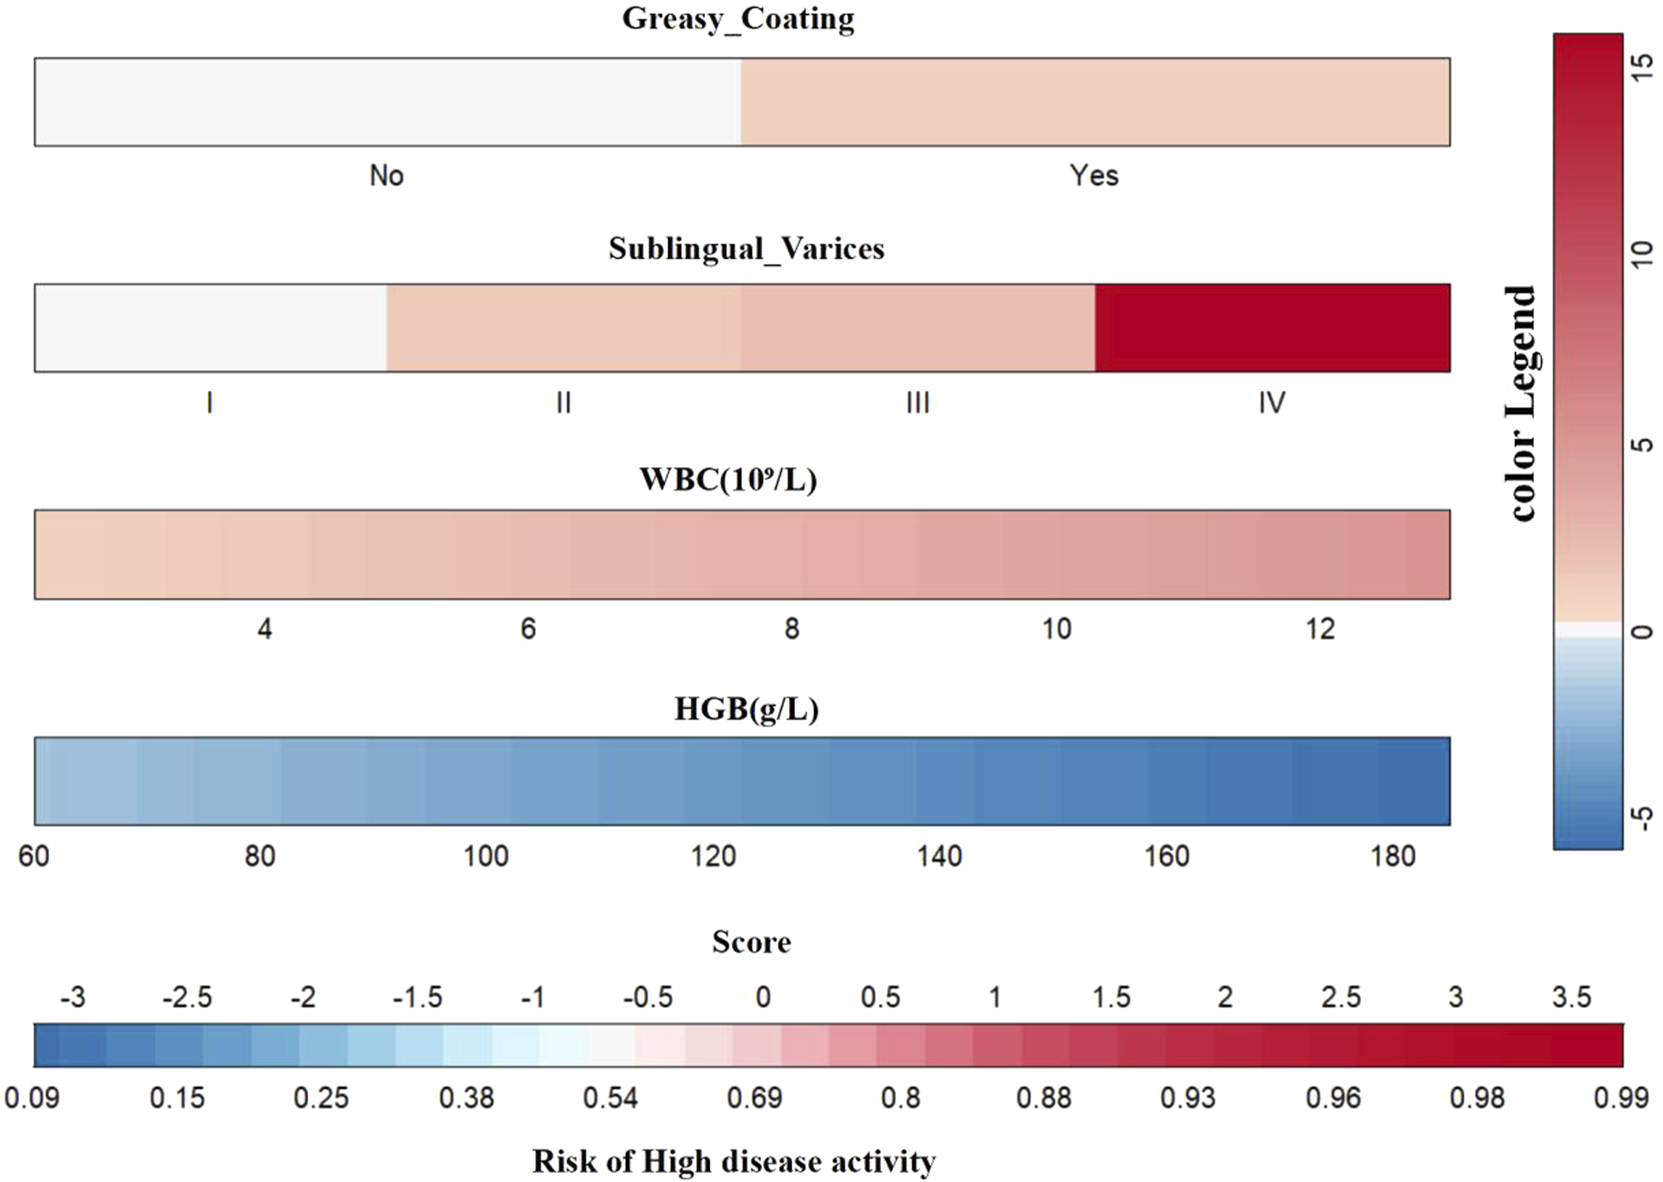
Multicolored gradient nomogram showing RA high disease activity risk scores.
An online risk calculator based on the multivariate logistic regression model was developed using the R Shiny platform (https://wangzihanprediction.shinyapps.io/WZH_Disease_activity/). By entering predictive factor values, the tool estimates the risk of high RA disease activity. For instance, for a patient with WBC = 6 × 10⁹/L, PLT = 250 × 109/L, HGB = 117 g/L, greasy coating = Yes, and sublingual varicosity grade I, the calculated probability of moderate-to-high disease activity is 65.7% (Figure 7).
FIGURE 7
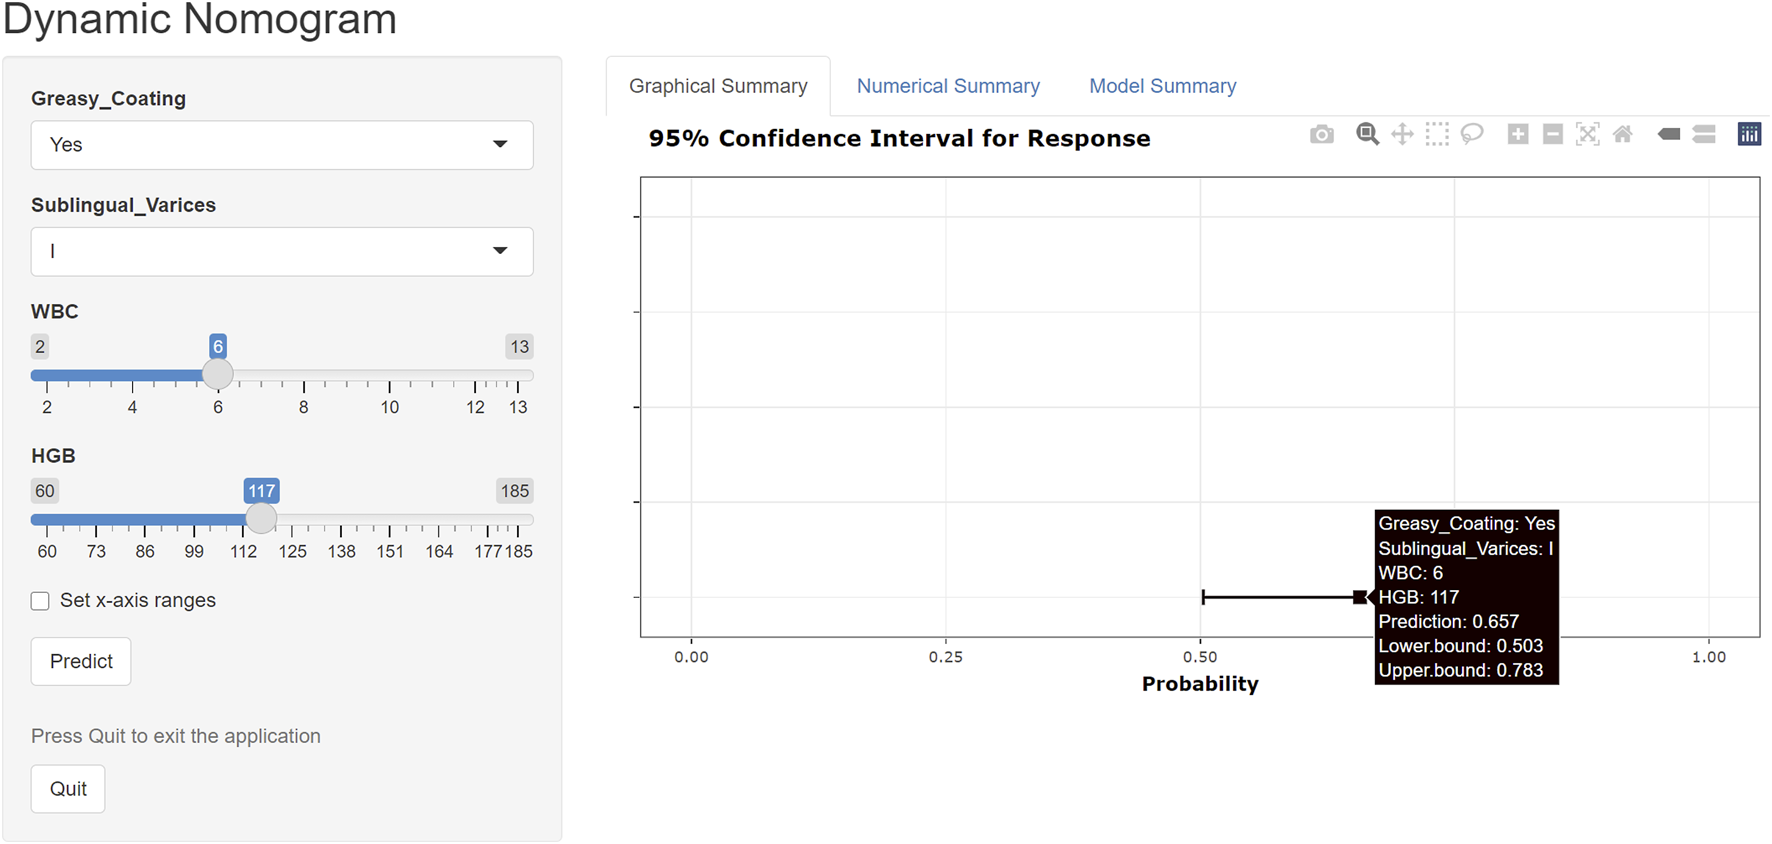
Online risk calculator created using the R Shiny platform.
4 Discussion
Assessing RA disease activity is central to the T2T strategy. However, the ACR-recommended multidimensional evaluation system, which requires professional joint counts and complex metrics, is difficult to implement in primary care settings and for patient self-monitoring. This study integrated easily accessible tongue features, such as sublingual varicosity and greasy coating, with routine clinical indicators to develop a predictive model for RA disease activity. The integrated model (Model 2) outperformed the laboratory-only model (Model 1), suggesting that tongue features can complement traditional biomarkers and provide an auxiliary screening tool for primary care. Such a tool could help identify patients needing specialist referral, thereby optimizing referral decision-making.
Feature selection was conducted using the Boruta algorithm, a proven method for identifying robust predictors in high-dimensional datasets with multicollinearity, previously applied in cardiovascular risk assessment and oncology prognosis models (Li et al., 2025; Lin et al., 2023). Four clinical variables were identified as key contributors to the RA patient cohort model, ranked based on importance as WBC, HGB, IgA, and PLT. In patients with moderate-to-high disease activity, elevated WBC and IgA levels and reduced HGB were significant risk factors, aligning with findings from a cross-sectional study of 779 patients (Scholz et al., 2019). The underlying mechanism may involve chronic inflammation-induced hepcidin upregulation and erythropoietin inhibition, collectively lowering HGB levels. Smith et al. (Smith et al., 1992) also attribute RA-related anemia to inflammation-driven iron metabolism dysregulation and cytokine-mediated erythropoiesis suppression. Boilard et al. (2012) report that platelets, beyond mediating hemostasis, actively participate in RA-related inflammation, with activation/apoptosis dynamics closely linked to disease activity. In the final model, the ORs for PLT and IgA were near 1, and the lower bounds of their 95% CIs approached 1.000, suggesting weak statistical significance. This likely reflects the small measurement units of PLT and IgA, where significant biological effects require large cumulative changes, as well as potential attenuation of effect size from the limited sample size. However, their inclusion in the model is warranted, as Boilard et al. (2012) confirm that platelet activation drives the RA synovial inflammatory cascade by releasing pro-inflammatory mediators, correlating positively with disease activity. Elevated IgA levels are associated with specific RA subtypes (Jorgensen et al., 1992), potentially reflecting mucosal immune abnormalities that contribute to disease heterogeneity. Therefore, including PLT and IgA in the model is consistent with the algorithm screening results and the biological basis of RA inflammatory activity.
Tongue features have been recognized for over 3,000 years in China as indicators of internal health and pathophysiological states. Standard tongue features include color, dorsal mucosa, coating moistness, and sublingual varicosity extent (Wang et al., 2020). Tongue color is primarily influenced by vascularization of the lingual papillae, while the coating, composed of keratinized filiform papillae tips and exfoliated epithelial cells, is modulated by factors such as oral microbiota composition, blood-borne metabolites, and the secretory activity of mucosal and serous salivary glands (Washio et al., 2005). As a non-invasive and cost-effective diagnostic method, tongue feature analysis has recently been applied in predictive models for various diseases. For example, Li et al. developed an AI-driven deep learning diagnostic model using tongue features to differentiate patients with gastric cancer from those with non-gastric cancer, achieving superior diagnostic accuracy for early gastric cancer and precancerous lesions compared with traditional blood biomarkers (Yuan et al., 2023). Similarly, Zhuang et al. (2022) used a convolutional neural network to extract tongue features for a health assessment model, while Jiang et al. (2021) combined quantitative tongue image features, demographic data, and serological indicators in multiple machine learning algorithms to diagnose non-alcoholic fatty liver disease. Research shows that morphological and functional changes in the tongue mucosa are associated with the pathological status of various systemic conditions (Ye et al., 2014). In this study, sublingual varicosity and greasy tongue coating were independent predictors. Tongue coating thickness is regulated by the balance between epithelial cell proliferation and apoptosis, microbial community composition, and regulatory networks involving epidermal growth factor and cadherins, while tortuous dilation of sublingual veins is closely associated with vascular remodeling mediated by vascular endothelial growth factor (Li et al., 2012). These findings highlight tongue features as biological indicators of circulatory and metabolic dysregulation. Incorporating tongue features extends assessment beyond conventional biomarkers, providing intuitive and visually grounded supplementary evidence for assessing RA disease activity.
The DAS28 is a core tool in specialized clinical practice, essential for accurate disease assessment after diagnosis. However, it requires specialist-performed joint examinations and laboratory markers such as ESR or CRP, which may be difficult to obtain in primary care, rural, or resource-limited settings. In contrast, our model is convenient and of low cost, making it suitable for dynamic disease monitoring in primary care and during follow-up, thereby facilitating referrals to higher-level specialists. Future developments could include mobile applications enabling patients to capture standardized tongue images at home for upload and analysis. Combined with other indicators, this approach could support preliminary RA monitoring by primary care physicians or patients themselves. As such, this tongue image-based assessment model can effectively complement the current gold standard, DAS28. Compared with thermography-based or proteomic prediction models (Moralis-Ivorra et al., 2022; O'Neil et al., 2021), our approach delivers comparable or superior predictive performance by incorporating tongue image features while avoiding reliance on expensive equipment, thereby improving cost-effectiveness and public health applicability. However, the model demonstrated moderate NPV in the test set, suggesting caution when using it for exclusionary diagnosis. Future research should focus on further optimizing model performance by integrating additional low-cost, easily accessible multidimensional data to improve its ability to support referral decisions.
In previous research, a series of RA-specific predictive models were developed using laboratory indicators such as blood glucose, lipids, autoantibodies, and plasma metabolites to forecast clinical outcomes such as cardiovascular risk and X-ray-assessed bone destruction, all with strong clinical applicability (Wang Z. et al., 2022; Wang et al., 2025). Building on clinical indicators, this study incorporated tongue feature parameters to develop a multimodal predictive model integrating imaging omics, offering a more comprehensive approach to RA assessment. An interpretable nomogram quantified the contributions of sublingual varices and greasy coating, thereby enhancing model credibility. However, this study has limitations. First, the single-center, cross-sectional design may introduce racial or regional bias due to a geographically homogeneous patient population, limiting model generalizability. Second, as the model is still in its preliminary developmental phase, its validity has not been externally verified using independent datasets. Finally, despite applying strict exclusion criteria to control known confounders, residual interference from undiagnosed comorbidities affecting tongue features or predictive outcomes cannot be excluded. Future research should increase the sample size and incorporate multicenter, multi-regional, and multi-ethnic cohorts for external validation to strengthen model robustness and clinical applicability.
5 Conclusion
We developed and validated a clinical predictive model for assessing disease activity in patients with RA, using robust statistical methods that combined objective phenotypic data from standardized tongue imaging with laboratory indices. Subsequently, we implemented the model as an interactive, web-based risk calculator using the R/Shiny framework. This tool shows promise as an auxiliary resource in primary healthcare, supporting tiered diagnosis by identifying patients with RA requiring timely referral to rheumatology specialists for systematic evaluation.
Statements
Data availability statement
The original contributions presented in the study are included in the article/supplementary material, further inquiries can be directed to the corresponding author.
Ethics statement
The studies involving humans were approved by China-Japan Friendship Hospital Clinical Research Ethics Committee. The studies were conducted in accordance with the local legislation and institutional requirements. The participants provided their written informed consent to participate in this study. Written informed consent was obtained from the individual(s) for the publication of any potentially identifiable images or data included in this article.
Author contributions
YH: Data curation, Formal Analysis, Resources, Software, Validation, Writing – original draft, Visualization. ZW: Data curation, Formal Analysis, Methodology, Software, Validation, Writing – original draft. ML: Data curation, Investigation, Validation, Writing – original draft. YB: Data curation, Software, Validation, Writing – original draft. GC: Data curation, Software, Writing – original draft. JA: Data curation, Writing – original draft. HW: Data curation, Investigation, Writing – original draft. WL: Data curation, Writing – original draft. QT: Resources, Supervision, Writing – review and editing. YX: Resources, Supervision, Writing – review and editing. JW: Conceptualization, Funding acquisition, Project administration, Resources, Supervision, Writing – review and editing.
Funding
The author(s) declare that financial support was received for the research and/or publication of this article. Supported by the National Natural Science Foundation of China (No. 82074223 and 8207141673), The Fifth Batch of National Training Programme for Clinical Excellence in Chinese Medicine in 2022 (No. Chinese medicine official letter of instruction (2022) 178).
Acknowledgments
We extend gratitude to rheumatologists at the Department of Traditional Chinese Medicine Rheumatology, China-Japan Friendship Hospital for clinical data acquisition and analysis.
Conflict of interest
The authors declare that the research was conducted in the absence of any commercial or financial relationships that could be construed as a potential conflict of interest.
The reviewer WH declared a shared affiliation with the authors YH, ML, YB, GC, JA, HW, WL to the handling editor at the time of review.
Generative AI statement
The author(s) declare that no Generative AI was used in the creation of this manuscript.
Any alternative text (alt text) provided alongside figures in this article has been generated by Frontiers with the support of artificial intelligence and reasonable efforts have been made to ensure accuracy, including review by the authors wherever possible. If you identify any issues, please contact us.
Publisher’s note
All claims expressed in this article are solely those of the authors and do not necessarily represent those of their affiliated organizations, or those of the publisher, the editors and the reviewers. Any product that may be evaluated in this article, or claim that may be made by its manufacturer, is not guaranteed or endorsed by the publisher.
Abbreviations
RA, Rheumatoid arthritis; T2T, Treat-to-target; ACR, American College of Rheumatology; DAS28, Disease Activity Score using 28-joint counts; SDAI, Simplified Disease Activity Index; CDAI, Clinical Disease Activity Index; PAS, Patient Activity Scale; RAPID-3, Routine Assessment of Patient Index Data 3; TJC, Tender joint count; SJC, Swollen joint count; WBC, White blood cell; HGB, Hemoglobin; PLT, Platelets; ESR, Erythrocyte sedimentation rate; RF, Rheumatoid factor; ACCP, Anti-cyclic citrullinated peptide antibody; MICE, Multivariate Imputation by Chained Equations; SD, Standard deviation; CIs, Confidence intervals; ROC, Receiver operating characteristic; AUC, Area under the curve; DCA, Decision Curve Analysis; PPV, Positive predictive value; NPV, Negative predictive value; NRI, Net reclassification improvement; IDI, Integrated discrimination improvement.
References
1
Aletaha D. Neogi T. Silman A. J. Funovits J. Felson D. T. Bingham C. O. 3rd et al (2010). 2010 rheumatoid arthritis classification criteria: an American college of rheumatology/european league against rheumatism collaborative initiative. Arthritis rheumatism62 (9), 2569–2581. 10.1002/art.27584
2
Anderson J. Caplan L. Yazdany J. Robbins M. L. Neogi T. Michaud K. et al (2012). Rheumatoid arthritis disease activity measures: American college of rheumatology recommendations for use in clinical practice. Arthritis care and Res.64 (5), 640–647. 10.1002/acr.21649
3
Baker J. F. Ostergaard M. Emery P. Hsia E. C. Lu J. Baker D. G. et al (2014). Early MRI measures independently predict 1-year and 2-year radiographic progression in rheumatoid arthritis: secondary analysis from a large clinical trial. Ann. rheumatic Dis.73 (11), 1968–1974. 10.1136/annrheumdis-2013-203444
4
Boilard E. Blanco P. Nigrovic P. A. (2012). Platelets: active players in the pathogenesis of arthritis and SLE. Nat. Rev. Rheumatol.8 (9), 534–542. 10.1038/nrrheum.2012.118
5
Collins G. S. Reitsma J. B. Altman D. G. Moons K. G. (2015). Transparent reporting of a multivariable prediction model for individual prognosis or diagnosis (TRIPOD): the TRIPOD statement. BMJ Clin. Res. ed.350, g7594. 10.1136/bmj.g7594
6
Cook N. R. Paynter N. P. (2011). Performance of reclassification statistics in comparing risk prediction models. Biometrical J. Biometrische Zeitschrift53 (2), 237–258. 10.1002/bimj.201000078
7
Duan M. Mao B. Li Z. Wang C. Hu Z. Guan J. et al (2024). Feasibility of tongue image detection for coronary artery disease: based on deep learning. Front. Cardiovasc. Med.11, 1384977. 10.3389/fcvm.2024.1384977
8
Gandjbakhch F. Foltz V. Mallet A. Bourgeois P. Fautrel B. (2011). Bone marrow oedema predicts structural progression in a 1-year follow-up of 85 patients with RA in remission or with low disease activity with low-field MRI. Ann. rheumatic Dis.70 (12), 2159–2162. 10.1136/ard.2010.149377
9
Hassen N. Lacaille D. Xu A. Alandejani A. Sidi S. Mansourian M. et al (2024). National burden of rheumatoid arthritis in Canada, 1990-2019: findings from the global burden of disease study 2019 - a GBD collaborator-led study. RMD open10 (1), e003533. 10.1136/rmdopen-2023-003533
10
Iasonos A. Schrag D. Raj G. V. Panageas K. S. (2008). How to build and interpret a nomogram for cancer prognosis. J. Clin. Oncol.26 (8), 1364–1370. 10.1200/JCO.2007.12.9791
11
Jiang T. Guo X. J. Tu L. P. Lu Z. Cui J. Ma X. X. et al (2021). Application of computer tongue image analysis technology in the diagnosis of NAFLD. Comput. Biol. Med.135, 104622. 10.1016/j.compbiomed.2021.104622
12
Jin S. Li M. Fang Y. Li Q. Liu J. Duan X. et al (2017). Chinese registry of rheumatoid arthritis (CREDIT): II. prevalence and risk factors of major comorbidities in Chinese patients with rheumatoid arthritis. Arthritis Res. and Ther.19 (1), 251. 10.1186/s13075-017-1457-z
13
Jorgensen C. Anaya J. M. Cognot C. Sany J. (1992). Rheumatoid arthritis associated with high levels of immunoglobulin A: clinical and biological characteristics. Clin. Exp. rheumatology10 (6), 571–575.
14
Kursa M. B. Rudnicki W. R. (2010). Feature selection with the boruta package. J. Stat. Softw.36 (11), 1–13. 10.18637/jss.v036.i11
15
Li F. T. Zhao J. Pang X. Y. (2012). Zhongguo zhong xi Yi jie He za zhi zhongguo Zhongxiyi jiehe zazhi = Chinese journal of integrated traditional and Western medicine. Beijing, China: Zhongguo Zhongxi Jiehe Zazhi, 1331–1335.
16
Li J. Chen Q. Hu X. Yuan P. Cui L. Tu L. et al (2021). Establishment of noninvasive diabetes risk prediction model based on tongue features and machine learning techniques. Int. J. Med. Inf.149, 104429. 10.1016/j.ijmedinf.2021.104429
17
Li X. H. Yang X. L. Dong B. B. Liu Q. (2025). Predicting 28-day all-cause mortality in patients admitted to intensive care units with pre-existing chronic heart failure using the stress hyperglycemia ratio: a machine learning-driven retrospective cohort analysis. Cardiovasc. Diabetol.24 (1), 10. 10.1186/s12933-025-02577-z
18
Lin Y. Jing X. Chen Z. Pan X. Xu D. Yu X. et al (2023). Histone deacetylase-mediated tumor microenvironment characteristics and synergistic immunotherapy in gastric cancer. Theranostics13 (13), 4574–4600. 10.7150/thno.86928
19
Littlejohn E. A. Monrad S. U. (2018). Early diagnosis and treatment of rheumatoid arthritis. Prim. care45 (2), 237–255. 10.1016/j.pop.2018.02.010
20
Mayaud L. Lai P. S. Clifford G. D. Tarassenko L. Celi L. A. Annane D. (2013). Dynamic data during hypotensive episode improves mortality predictions among patients with sepsis and hypotension. Crit. care Med.41 (4), 954–962. 10.1097/CCM.0b013e3182772adb
21
Morales-Ivorra I. Narváez J. Gómez-Vaquero C. Moragues C. Nolla J. M. Narváez J. A. et al (2022). Assessment of inflammation in patients with rheumatoid arthritis using thermography and machine learning: a fast and automated technique. RMD open8 (2), e002458. 10.1136/rmdopen-2022-002458
22
O'Neil L. J. Hu P. Liu Q. Islam M. M. Spicer V. Rech J. et al (2021). Proteomic approaches to defining remission and the risk of relapse in rheumatoid arthritis. Front. Immunol.12, 729681. 10.3389/fimmu.2021.729681
23
RStudio Team (2023). Shiny: web application framework for R (computer software). Available online at: https://shiny.rstudio.com/(Accessed May 9, 2025).
24
Scholz G. A. Leichtle A. B. Scherer A. Arndt U. Fiedler M. Aeberli D. et al (2019). The links of hepcidin and erythropoietin in the interplay of inflammation and iron deficiency in a large observational study of rheumatoid arthritis. Br. J. Haematol.186 (1), 101–112. 10.1111/bjh.15895
25
Smith M. A. Knight S. M. Maddison P. J. Smith J. G. (1992). Anaemia of chronic disease in rheumatoid arthritis: effect of the blunted response to erythropoietin and of interleukin 1 production by marrow macrophages. Ann. rheumatic Dis.51 (6), 753–757. 10.1136/ard.51.6.753
26
Wang Z. C. Zhang S. P. Yuen P. C. Chan K. W. Chan Y. Y. Cheung C. H. et al (2020). Intra-rater and inter-rater reliability of tongue coating diagnosis in traditional Chinese medicine using smartphones: quasi-delphi study. JMIR mHealth uHealth8 (7), e16018. 10.2196/16018
27
Wang R. Dai W. Gong J. Huang M. Hu T. Li H. et al (2022a). Development of a novel combined nomogram model integrating deep learning-pathomics, radiomics and immunoscore to predict postoperative outcome of colorectal cancer lung metastasis patients. J. Hematol. and Oncol.15 (1), 11. 10.1186/s13045-022-01225-3
28
Wang Z. Lan T. Zhang L. Luo J. Wang J. Li L. et al (2022b). Predictive value of the TyG index and rheumatoid factor for cardiovascular disease risk in a rheumatoid arthritis population: data from a survey of 418 patients. Lipids Health Dis.21 (1), 122. 10.1186/s12944-022-01735-6
29
Wang Z. Lan T. Jiao Y. Wang X. Yu H. Geng Q. et al (2025). Early prediction of bone destruction in rheumatoid arthritis through machine learning analysis of plasma metabolites. Arthritis Res. and Ther.27 (1), 111. 10.1186/s13075-025-03576-x
30
Washio J. Sato T. Koseki T. Takahashi N. (2005). Hydrogen sulfide-producing bacteria in tongue biofilm and their relationship with oral malodour. J. Med. Microbiol.54 (Pt 9), 889–895. 10.1099/jmm.0.46118-0
31
Wells G. Becker J. C. Teng J. Dougados M. Schiff M. Smolen J. et al (2009). Validation of the 28-joint disease activity score (DAS28) and european league against rheumatism response criteria based on C-reactive protein against disease progression in patients with rheumatoid arthritis, and comparison with the DAS28 based on erythrocyte sedimentation rate. Ann Rheum Dis.68 (6), 954–960. 10.1136/ard.2007.084459
32
Yan L. Lin M. Ye X. Li W. Xu J. Fang Y. et al (2025). Prediction model for bone erosion in rheumatoid arthritis based on musculoskeletal ultrasound and clinical risk factors. Clin. Rheumatol.44 (1), 143–152. 10.1007/s10067-024-07219-5
33
Ye J. Cai X. Cao P. (2014). Problems and prospects of current studies on the microecology of tongue coating. Chin. Med.9 (1), 9. 10.1186/1749-8546-9-9
34
Yuan L. Yang L. Zhang S. Xu Z. Qin J. Shi Y. et al (2023). Development of a tongue image-based machine learning tool for the diagnosis of gastric cancer: a prospective multicentre clinical cohort study. EClinicalMedicine57, 101834. 10.1016/j.eclinm.2023.101834
35
Zhuang Q. Gan S. Zhang L. (2022). Human-computer interaction based health diagnostics using ResNet34 for tongue image classification. Comput. Methods Programs Biomed.226, 107096. 10.1016/j.cmpb.2022.107096
36
Zou L. Choi Y. H. Guizzetti L. Shu D. Zou J. Zou G. (2024). Extending the DeLong algorithm for comparing areas under correlated receiver operating characteristic curves with missing data. Statistics Med.43 (21), 4148–4162. 10.1002/sim.10172
Summary
Keywords
disease activity, rheumatoid arthritis, tongue characteristics, laboratory indexes, clinical predictive model
Citation
Han Y, Wang Z, Lan M, Bian Y, Chen G, Ao J, Wu H, Li W, Tao Q, Xu Y and Wang J (2025) Tongue feature-based model for assessing disease activity in patients with rheumatoid arthritis. Front. Pharmacol. 16:1651557. doi: 10.3389/fphar.2025.1651557
Received
22 June 2025
Accepted
01 September 2025
Published
23 September 2025
Volume
16 - 2025
Edited by
Runyue Huang, Guangzhou University of Chinese Medicine, China
Reviewed by
Gong Xun, China Academy of Chinese Medical Sciences, China
Wang Hailong, Beijing University of Chinese Medicine, China
Halit Kızılet, Adnan Menderes University, Türkiye
Updates
Copyright
© 2025 Han, Wang, Lan, Bian, Chen, Ao, Wu, Li, Tao, Xu and Wang.
This is an open-access article distributed under the terms of the Creative Commons Attribution License (CC BY). The use, distribution or reproduction in other forums is permitted, provided the original author(s) and the copyright owner(s) are credited and that the original publication in this journal is cited, in accordance with accepted academic practice. No use, distribution or reproduction is permitted which does not comply with these terms.
*Correspondence: Jianming Wang, doctorwangjm@sina.com
†These authors have contributed equally to this work and share first authorship
Disclaimer
All claims expressed in this article are solely those of the authors and do not necessarily represent those of their affiliated organizations, or those of the publisher, the editors and the reviewers. Any product that may be evaluated in this article or claim that may be made by its manufacturer is not guaranteed or endorsed by the publisher.