Abstract
Background:
Sonchus arvensis L. is a traditional Chinese food and medicine, and the primary plant metabolites are polysaccharides (SAP). In this study, we aimed to investigate the protective effect of SAP in a colitis model and the potential underlying molecular mechanisms.
Methods:
C57BL/6 mice were randomly assigned to three groups: the negative control, model, and SAP treatment groups. The influence of SAP on ulcerative colitis (UC) was evaluated by water and food intake, body weight change, diarrhea, bloody stool, colon length, histological analysis, disease activity index, and immune parameters. The effects of SAP on the gut microbiota (GM) were investigated using 16S rRNA sequencing. The impact of SAP on metabolites was evaluated using non-targeted metabolomics analysis.
Results:
SAP attenuated colitis and modified immune parameters. 16S rRNA sequencing showed that the abundance of Akkermansia, Rikenella, Rikenellaceae_RC9_gut_group, and unidentified_Clostridia_vadinBB60_group in the model mice was remarkably reversed after SAP treatment. The correlation analysis of GM and the metabolites showed that SAP could regulate five metabolites correlated with GM.
Conclusion:
The protective effect of SAP on the model mice may be related to GM diversity and metabolites.
1 Introduction
Digestive system diseases can severely impact the patients’ ability to study, work, and carry out daily life activities (Guindi and Riddell, 2004). Ulcerative colitis (UC) is a chronic inflammatory disease of the gastrointestinal tract (Seoane-Viaño et al., 2021; Khor et al., 2011) that is prone to relapses and is difficult to treat. Numerous reports suggest that the incidence and prevalence of UC have been increasing globally over the past few decades (Molodecky et al., 2012). In addition to the developed countries, recent studies in newly industrialized countries have demonstrated that UC prevalence has also increased in Asia, Africa, and South America (Kaplan and Ngm, 2017). Epidemiological findings have shown that the severity and duration of UC also increase the risk of colon cancer in patients (Cosnes et al., 2011; Terzic et al., 2010).
The primary pathological mechanisms underlying UC remain unknown. The specific etiology of UC involves multiple factors, including genes, immune function, intestinal microbiota, lifestyle, and environmental factors. Several studies showed that dysbiosis of the gut microbiota (GM) is associated with inflammatory bowel disease (IBD) (Nishida et al., 2018). Therefore, GM dysbiosis is considered the primary pathological mechanism of UC. Increasing evidence suggests that the microbiota composition of UC patients differs from that of healthy people (Andoh et al., 2007; Fujimoto et al., 2013; Sartor and Wu, 2017; Takahashi et al., 2016). Biodiversity and species richness in UC patients have decreased (Nishida et al., 2018).
Furthermore, changes in bacterial composition may alter the metabolite levels, which may contribute to the specific etiology of UC. Metabolomics analysis has revealed a correlation between bacterial composition and metabolic pathways (Wishart et al., 2007). Changes in bacterial metabolic pathways occur in approximately 12% of individuals compared with healthy individuals.
Many studies have indicated that dietary polysaccharides can modulate the gut microbiota (Cai et al., 2019). Polysaccharides are one of the four fundamental biomolecules of life and are natural biological macromolecules widely found in microorganisms, plants, and animals. Many polysaccharides and their derivatives have been reported to possess critical bioactive functions, such as anti-inflammatory, anti-aging, anti-oxidation, antiviral, anti-radiation, anti-tumor, anti-thrombosis, and hypolipidemic effects; immunoregulation; and regulation of the gut microbial composition (Miani et al., 2004; Kouakou et al., 2013; Wu et al., 2014; Bahorun et al., 2003; Kao et al., 2005). Polysaccharides have attracted significant attention from researchers due to their remarkable properties, including prominent pharmacological activity, fewer toxic side effects, and easy absorption ability (Li et al., 2017). Polysaccharides are also vital plant metabolites in traditional Chinese medicine, and more than 300 polysaccharide metabolites have been extracted from them (Luo et al., 2016). Traditional Chinese medicine plays an essential role in the treatment of diseases worldwide (Lu et al., 2022). The U.S. FDA has approved many plant-derived medicines. Therefore, studying the pharmacological activities of polysaccharides is of great significance for their development and application.
Many drugs to used treat UC have numerous side effects (Rahimi and Abdollahi, 2010; Tao and Siew, 2018). A natural product derived from traditional Chinese food and medicine has been developed as a vital complementary approach for ulcerative disease (Gilardi et al., 2014). Many reports suggest that polysaccharides have an anti-inflammatory effect in colitis mice (Zhang et al., 2020; Zou et al., 2020; Xiang et al., 2021; Yang et al., 2021). Polysaccharides are a vital metabolite of Sonchus arvensis. Our previous study confirmed that Sonchus arvensis L. extract had a protective effect in a UC model in mice, which may be related to gut microbiota diversity (Ren et al., 2023). Taken together, we hypothesized that Sonchus arvensis L. polysaccharide (SAP) may be an important metabolite of Sonchus arvensis L. extract that inhibits colitis and shapes the composition of the gut microbiota. Consequently, this study was designed to investigate whether polysaccharides can ameliorate colitis and explore the potential underlying molecular mechanisms.
2 Materials and methods
2.1 Materials
Sonchus arvensis L. was purchased from a local market. We verified the morphological characteristics of Sonchus arvensis L. using the pattern specimen. Our research team preserved the voucher specimens. DSS was purchased from MP Biomedicals (Irvine, CA). Millipore (Burlington, MA, United States) supplied all other chemicals.
2.2 Animals
In vivo experiments were performed in accordance with the ARRIVE guidelines. The Ethics Committee of Harbin Medical University and Heilongjiang Bayi Agricultural University approved the study protocol. Male C57BL/6 mice weighing 21 g–23 g were purchased from Charles River Laboratories (Beijing, China). A specific pathogen-free environment was provided for the house mice. During the investigation, no animals were sacrificed. The mice were euthanized by cervical dislocation at the end of the trial.
2.3 Preparation of the polysaccharide
Whole plants of Sonchus arvensis L. were cut into small pieces, which were soaked in 95% alcohol and then ultrasonicated for 0.5 h at 40 °C three times, and ethanol was removed in a ventilated kitchen. The pre-processed Sonchus arvensis L. sample was macerated for 2 hours with 23 mL of distilled water and then extracted for 1.8 h at 92 °C twice in a thermostatic water bath. The supernatant was collected and concentrated to 1 g/mL, anhydrous ethanol was then added four times, and the mixture was incubated at 4 °C overnight. The mixture was centrifuged, the supernatant was removed, and the precipitate was collected. Then, the precipitate was washed with anhydrous ethanol, acetone, and ether. The precipitate was dried in a drying cabinet at 40 °C and stored at −20 °C. The extraction yield was 10.13% ± 0.73%, and the total polysaccharide content in 100 mg of the extract was 35.27 ± 1.89 mg.
2.4 Establishment of the colitis model and treatment
An animal colitis model was established by intragastric administration of 0.2 mL of 0.6 g/mL DSS daily for seven consecutive days, as previously reported (Heng et al., 2017). All C57BL/6 mice were randomly grouped into three groups: the control group (CL), administered with physiological saline (NS) for 21 days continuously; the DSS model group (ML), administered with NS for 14 days and then treated with DSS for 7 days; and the SAP (1.26 g/kg) + DSS group (PS), treated with SAP for 21 days and then treated with SAP and DSS for 7 days. The SAP dosage was determined according to the previous study. Figure 1a shows the experimental timelines and grouping of all C57BL/6 mice.
FIGURE 1
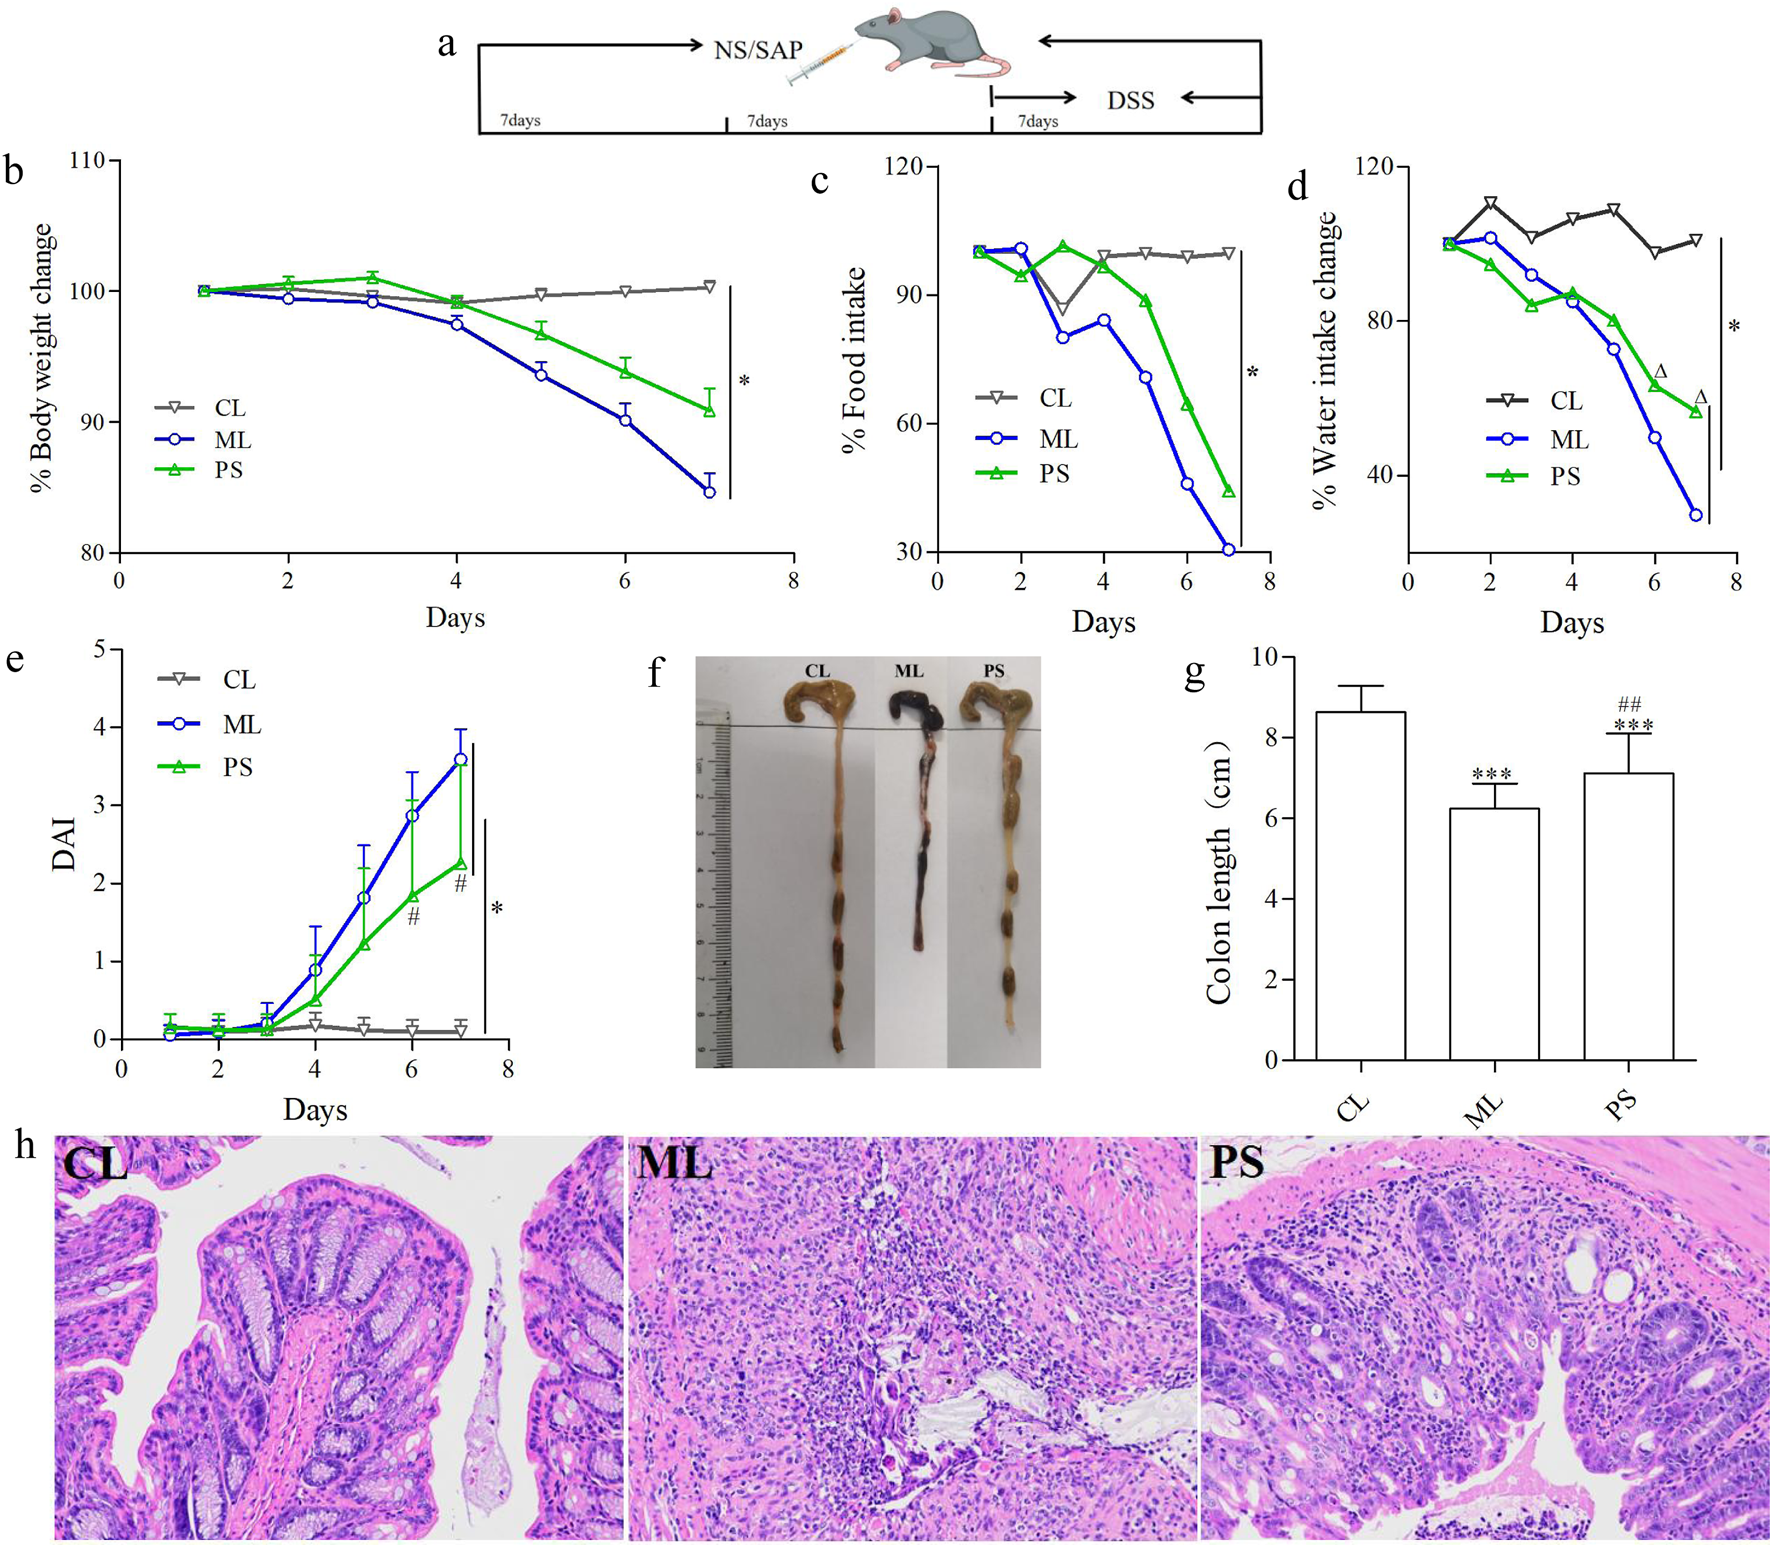
SAP decreased DSS-induced colitis in C57BL/6 mice. (a) Experimental design for evaluating the effects of SAP on DSS-induced colitis in mice. (b) Body weight change in each group. (c) Food intake change in each group. (d) Water intake change in each group. (e) Disease activity index (DAI). (f,g) Lengths of colons of mice in each group. (h) Colons from each experimental group were processed for histological evaluation (H&E staining ×200). Data were indicated as the means ± SD (n = 5) and were analyzed using the Student’s t-test; *p < 0. 05 and ***p < 0.001 vs. mice in the CL group, △p < 0.05 vs. mice in the ML group, ##p < 0.05 vs. mice in the PS group.
2.5 Clinical scoring and histological analysis
The water intake, food intake, and body weight change of the animals were measured daily during the experiment. Diarrhea and rectal bleeding were monitored by observing the levels of water and blood in the feces. The disease activity index (DAI) was calculated based on previous reports (Ni et al., 2019). At the end of the experiment, all animals were sacrificed, and their colons were removed from the cecum to 1 cm above the anus. The colon length was measured, and the colon tissues were fixed in 4% paraformaldehyde. The hematoxylin and eosin (HE)-stained colon tissue sections were prepared by embedding colon tissue specimens in paraffin blocks, and the sections were observed using an optical microscope.
2.6 Immune organ index determination
At the end of the experiment, all the animals in all groups were weighed. The spleen and thymus were dissected, placed on filter paper to dry, and then weighed. The organ index formula is as follows:
Immune organ index (mg/g) = immune organ index (mg)/body weight (g).
2.7 ELISA test
At the end of the experiment, we collected blood samples from the retro-orbital sinus and allowed them to stand at room temperature for 2 h. The blood samples were centrifuged to obtain serum. IgA, IgG, and IgM levels were determined using ELISA kits.
2.8 Measurement of blood routine
At the end of the experiment, we collected blood samples from the retro-orbital sinus. Then, routine blood tests were performed using a BC-5500 fully automatic blood cell analyzer. During the measurements, red blood cells, platelets, white blood cells, and hemoglobin levels were recorded.
2.9 Gut microbiota analysis
We collected the cecal contents 7 days after DSS administration. Total genomic DNA was extracted from all samples using the CTAB method. Specific primers with barcodes were used to amplify the 16S rRNA genes from distinct regions. Then, we purified and quantified the products. The TruSeq® DNA PCR-Free Sample Preparation Kit was used to generate sequencing libraries, and index codes were added. Sequence analysis was performed using UPARSE software. The same OTUs were defined as those with ≥97% similarity. Further annotation was performed by screening a representative sequence from each OTU. A standard sequence number corresponding to the sample with the least number of sequences was used to normalize OTU abundance information. The output-normalized data were used to analyze alpha and beta diversity.
2.10 Non-targeted metabolomics analysis
We collected the cecal contents 7 days after DSS administration. Samples (50 mg) were added to 200 μL H2O and 800 µL MeOH/ACN, vortexed for 30 s, sonicated at 4 °C for 10 min, incubated at −20 °C for 60 min, and then centrifuged at 17,000 rpm. The supernatant was dried under vacuum, dissolved in 200 µL acetonitrile/water, vortexed, sonicated, and centrifuged, and the resulting supernatant was collected. A UHPLC-Q-TOF system was used to analyze the supernatant. An ACQUITY UPLC HSS T3 (1.8 μm; 2.1 × 100 mm) chromatographic column was used; the mobile phase was composed of A (0.1% formic acid in acetonitrile) and B (0.1% formic acid in water). The gradient elution was 5% A for 1 min, changing to 10% B within 1 min, then to 95% A within 12 min and held for 2 min, and finally to 5% A within 1 min and held for 3 min. The analytical column temperature was 35 °C, and the autosampler temperature was 4 °C. A 5 μL sample was used for each run.
Chromatographic data were analyzed using MS-DIAL 3.82 software. Key metabolites and metabolic pathways were identified using the KEGG, HMDB, MassBank, and METLIN databases.
2.11 Statistical analysis
Results are presented as the mean ± standard deviation (SD). GraphPad Prism was used to analyze the significance of the difference. p < 0.05 was considered statistically significant. QIIME software was used to analyze the alpha and beta diversity of microbiota. Progenesis QI V2.3 analyzed the LC–MS data. The groups in the data were analyzed by one-way ANOVA. Differential metabolite was selected with VIP >1.0 and p < 0.05.
3 Results
3.1 SAP attenuates DSS-induced colitis in C57BL/6 mice
The influence of SAP on UC was estimated using a DSS-induced colitis model in C57BL/6 mice. Body weight was significantly reduced in the ML and PS groups, especially in the ML group, compared to that of the control group (Figure 1b). However, SAP attenuated body weight loss compared to the ML group (Figure 1b). To determine whether the change in body weight was related to water or food intake, the average water and food intake were measured. The average water or food intake was slightly lower in the PS group than in the CL group (Figures 1c,d); however, it was clearly decreased in the ML group (Figures 1c,d). These findings suggest that SAP could markedly improve body weight loss in DSS-induced UC mice by attenuating appetite suppression.
The DAI displays the severity of the body weight change, diarrhea, and bloody stool. As shown in Figure 1e, the DAI scores of all groups showed a noticeable increase compared to those of the CL group; however, they were lower in the PS group than in the ML group (Figure 1e). Moreover, the colonic length was differently shortened in the ML group; nevertheless, this phenomenon was significantly ameliorated in the PS group (Figures 1f,g). HE analysis was used to further estimate the severity of colonic inflammation (Figure 1h). The ML group showed mucosal epithelial cell degeneration and necrosis, with a significant reduction in the number of intestinal glands, gland epithelial degeneration and shedding, interstitial edema, and extensive inflammatory cell infiltration. However, the pathological changes were significantly improved after SAP was administered to the DSS-induced UC mice. These results suggest that SAP may attenuate colitis in model mice.
3.2 SAP modifies immune parameters in mice with DSS-induced colitis
The spleen index and thymus index reflect essential immune functions. Organ indices were calculated as the ratio of the organ to body weight. Figure 2a shows that the thymus index was not significantly different between the CL and PS groups; however, it increased dramatically in the ML group compared with those of the CL and PS groups. For spleen indices, although significant increases were observed in the ML and PS groups compared with those in the CL group, spleen indices decreased more in the PS group than in the ML group (Figure 2b).
FIGURE 2
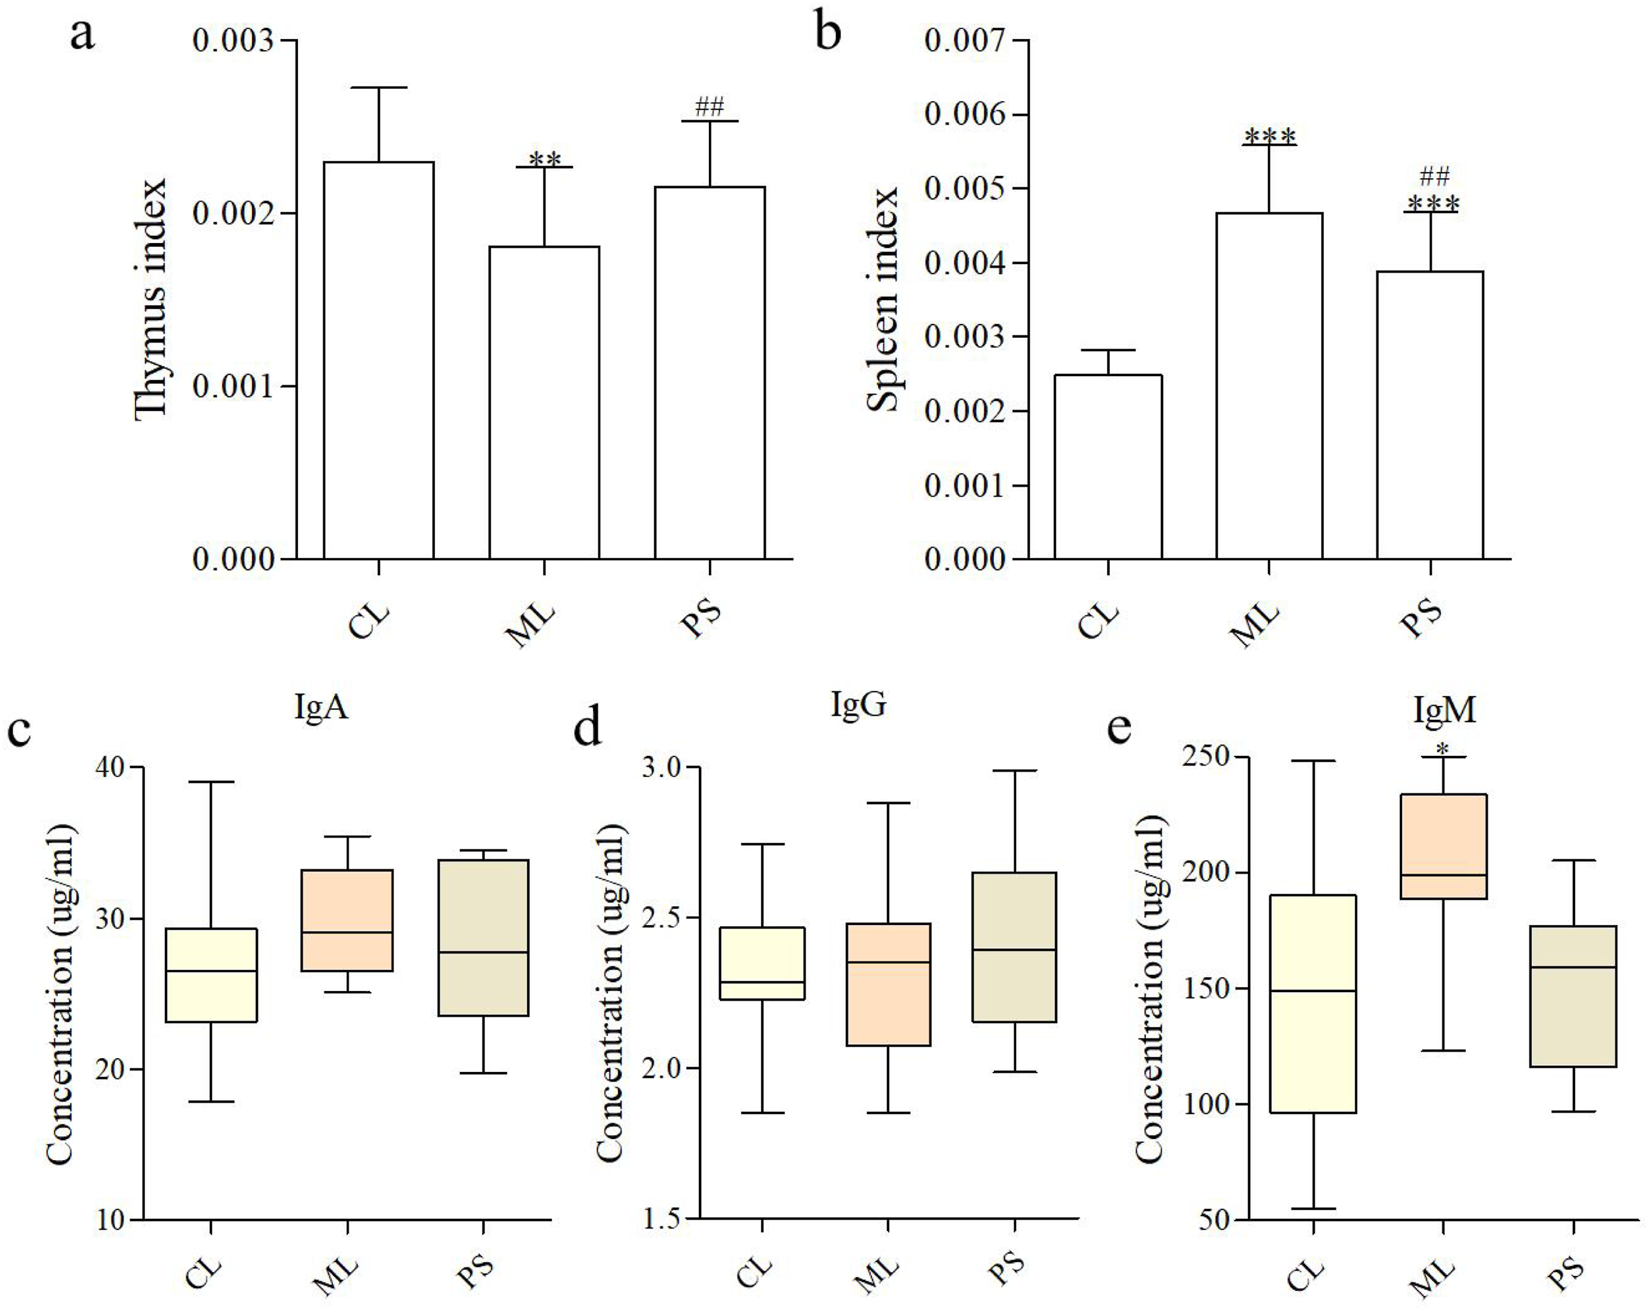
SAP modifies immune parameters. (a,b) Effects of SAP on the thymus index and spleen index. Effects of SAP on IgA (c), IgM (d), and IgG (e) in the serum of mice. Data were indicated as the means ± SD (n = 5) and were analyzed using the Student’s t-test; *p < 0. 05 and **p < 0.01 vs. mice in the CL group, ##p < 0.05 vs. mice in the ML group.
B cells secrete immunoglobulins that participate in systemic humoral immunity. The major immunoglobulins are IgA, IgG, and IgM, which play an essential role in neutralizing pathogens and toxins. The effects of SAP on serum immunoglobulins are shown in Figures 2c–e. No significant difference in the IgA levels was observed between the groups. The IgM level was clearly higher in the ML group than in the CL and PS groups, indicating that DSS enhanced immunoglobulin secretion. The findings revealed that SAP plays a more effective role in immunoregulation by producing immunoglobulins.
We then determined the routine blood parameters in all groups, and the results are presented in Table 1. Almost all routine blood parameters showed statistically significant differences in the ML group compared with those in the CL group, whereas only a few parameters showed significant differences in the PS group (Neu%, Lym%, RBC, HCT%, HGB, and MPV). However, compared with those in the ML group, most parameters (Neu, Neu%, Lym%, RBC, HCT, MCV, RDW-SD, HGB, PLT, MPV, PDW, and PCT) were significantly different in the PS group. The findings suggest that SAP improved routine blood parameters in model mice.
TABLE 1
| Detection index | CL | ML | PS |
|---|---|---|---|
| WBC (109个/L) | 6.99 ± 1.51 | 17.01 ± 13.31 | 6.98 ± 2.43 |
| Neu (109个/L) | 1.02 ± 0.24 | 6.33 ± 4.81** | 1.54 ± 0.50# |
| Neu% (%) | 14.67 ± 2.59 | 39.83 ± 14.37*** | 21.96 ± 7.47*## |
| Lym (109个/L) | 5.96 ± 1.33 | 10.64 ± 8.96 | 5.43 ± 2.22 |
| Lym% (%) | 85.18 ± 2.64 | 59.88 ± 14.34*** | 79.39 ± 5.44*### |
| RBC (1012个/L) | 10.14 ± 0.51 | 5.13 ± 2.67*** | 9.19 ± 0.61*## |
| HCT (%) | 42.90 ± 1.94 | 22.84 ± 10.62*** | 39.15 ± 2.22*## |
| MCV (fL) | 42.32 ± 0.67 | 45.90 ± 3.05** | 42.66 ± 0.78# |
| RDW-CV | 16.20 ± 1.23 | 17.14 ± 1.50* | 15.53 ± 1.19 |
| RDW-SD (fL) | 29.63 ± 2.42 | 33.14 ± 4.50** | 28.31 ± 2.28# |
| HGB (g/L) | 143.60 ± 7.45 | 73.90 ± 36.01*** | 129.75 ± 7.77*## |
| MCH (pg) | 14.18 ± 0.19 | 14.70 ± 0.72* | 14.12 ± 0.23 |
| MCHC (g/L) | 334.50 ± 5.16 | 321.1 ± 16.39* | 331.88 ± 3.14 |
| PLT (109个/L) | 1162.8 ± 240.90 | 761.2 ± 277.44*** | 1237.9 ± 167.56## |
| MPV (fL) | 5.04 ± 0.13 | 6.37 ± 0.77*** | 5.30 ± 0.11**## |
| PDW | 14.92 ± 0.07 | 14.70 ± 0.09*** | 14.86 ± 0.10## |
| PCT (%) | 0.59 ± 0.12 | 0.47 ± 0.13** | 0.66 ± 0.09## |
Levels of blood routine results in all the groups.
*p < 0.05, **p < 0.01, and ***p < 0.001 vs. CL; #p < 0.05, ##p < 0.01, and ###p < 0.001 vs. ML.
3.3 SAP ameliorates gut microbial dysbiosis in mice with DSS-induced colitis
16S rRNA sequence analysis of the cecal samples was performed on the Illumina NovaSeq platform to evaluate the regulatory effect of PS on gut microbiota. The Venn diagram showed that 536 OTUs were shared among all the groups. In comparison, the CL and ML groups shared 734 OTUs, and the CL and PS groups shared 568 OTUs. The ML and PS groups shared 734 OTUs (Figure 3a). Furthermore, 120 unique OTUs were found in the CL group, 241 unique OTUs were found in the ML group, and 81 unique OTUs were found in the PS group (Figure 3a). According to the weighted UniFrac distance, PCoA showed different clustering of microbiota constituents among the CL, ML, and PS groups (Figure 3b). NMDS is a suitable ranking method for ecological research based on the Bray–Curtis distance. It also indicated distinct clustering of microbiota composition among the CL, ML, and PS groups (Figure 3c). The PCoA and NMDS results suggested that SAP induced a significant change in gut microbiota composition. As shown in Figure 3g, MRPP and ANOVA were utilized to detect further differences among the groups. The results of the MRPP and ANOVA analyses suggested that compositional variation in the GM among the three groups was significant (p < 0.05).
FIGURE 3
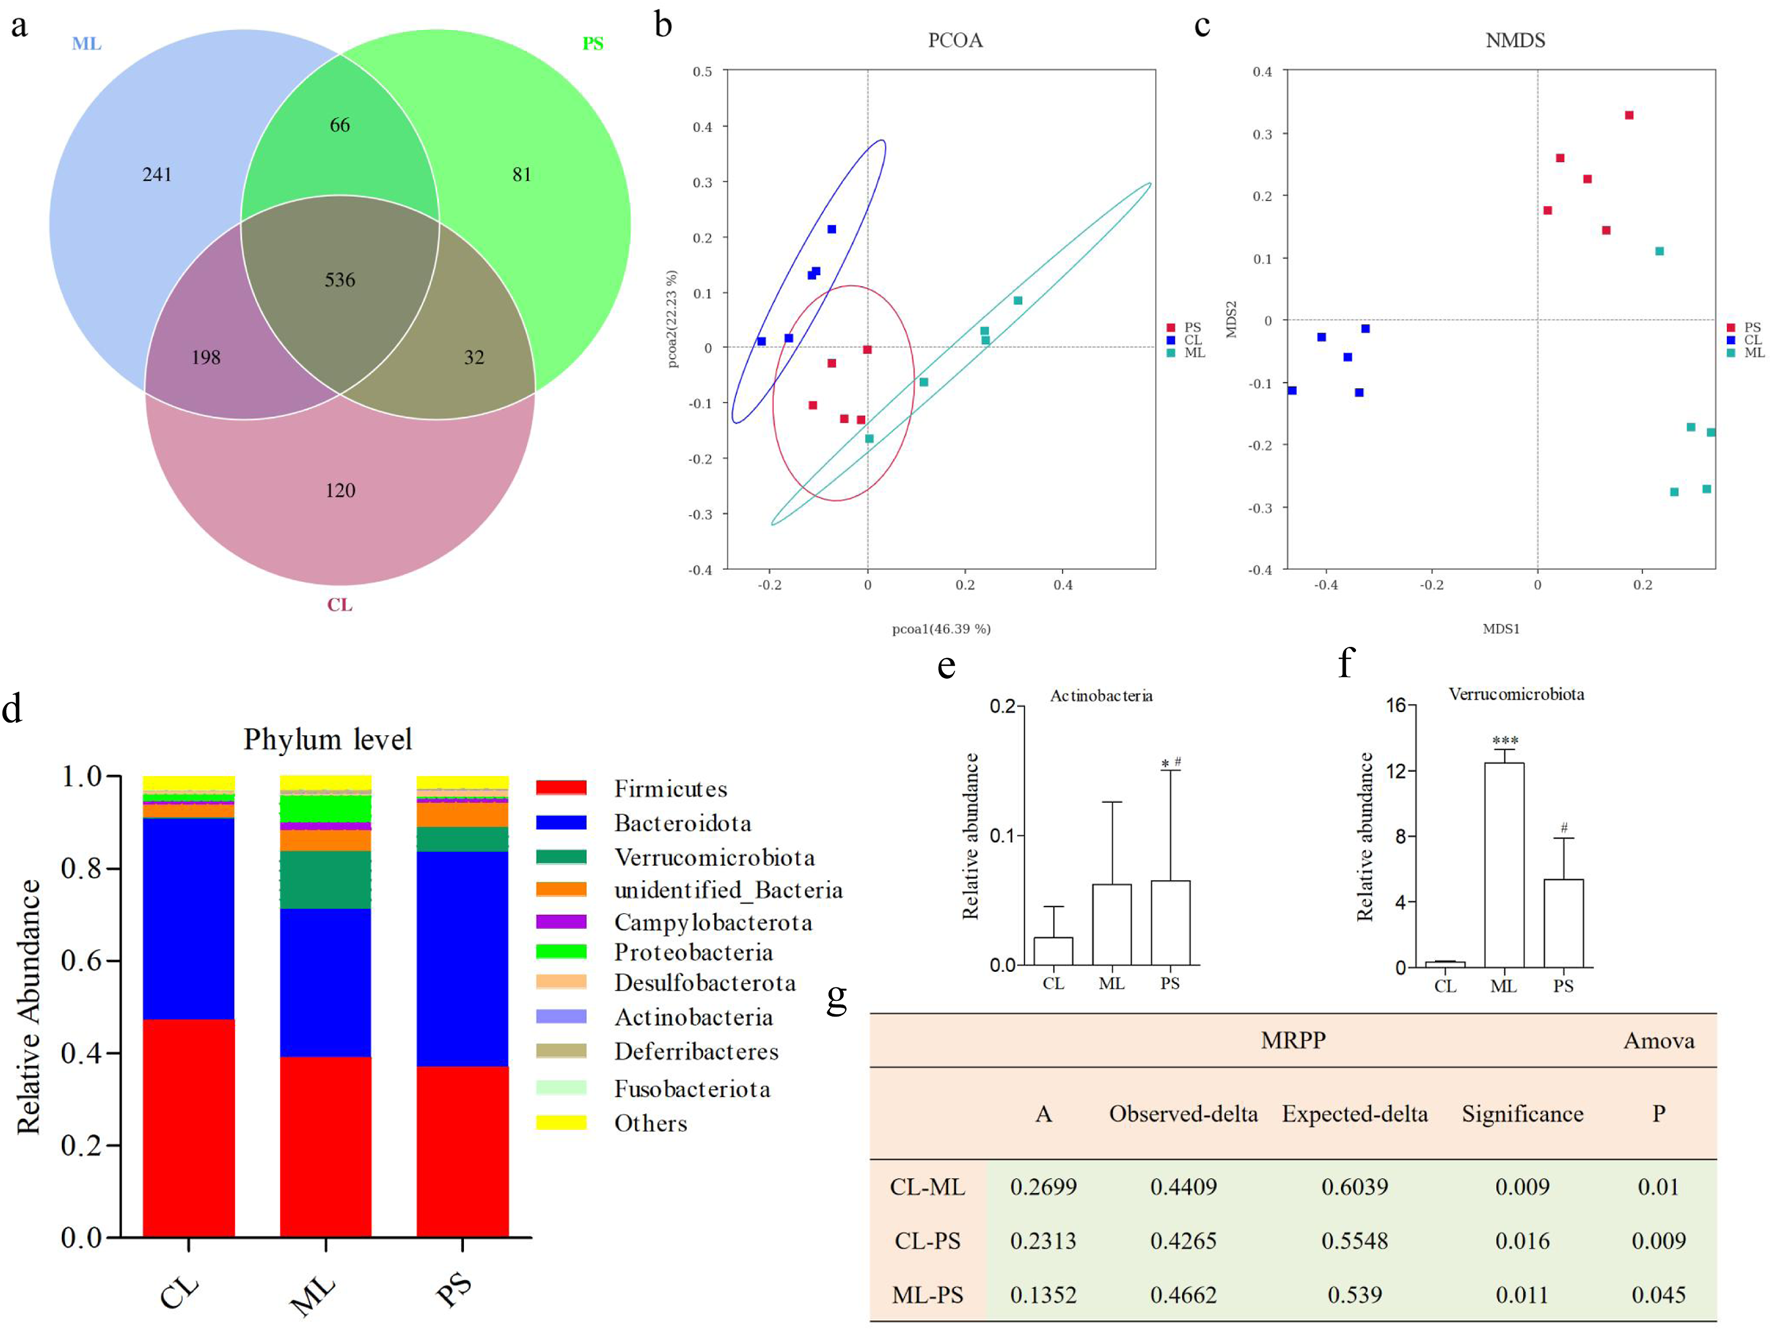
Effects of SAP on gut microbial dysbiosis. (a) Venn diagrams indicate the numbers of OTUs in the CL, ML, and PS groups. (b) Weighted UniFrac PCoA analysis of gut microbiota based on the OTU data of three groups. (c) Bray–Curtis NMDS analysis of gut microbiota based on the OTU data of three groups. (d) Relative abundance of gut microbiota from the cecal contents of all the groups at the phylum levels, classified by the representation of the top 10 species with the maximum abundance. Relative abundance of (e) Actinobacteria and (f) Verrucomicrobiota in cecal microbiota in the CL, ML, and PS groups. (g) Analysis of MRPP and AMOVA of gut microbiota among the CL, ML, and PS groups.
The structure of the bacterial community across the different groups was further assessed by analyzing the top 10 species with the highest phylum-level abundances. As shown in Figure 3d, the two most abundant phyla were Bacteroidetes and Firmicutes across all the groups. Relative abundances of Firmicutes and Bacteroidota were 47.28% ± 6.65% and 43.50% ± 7.22% in the CL group, 39.23% ± 13.05% and 32.00% ± 15.61% in the ML group, and 37.16% ± 7.59% and 46.49% ± 6.37% in the PS group, respectively. The following genera were identified: Verrucomicrobiota, unidentified_Bacteria, Campylobacterota, Proteobacteria, Desulfobacterota, Actinobacteria, Deferribacteres, and Fusobacteriota. It is worth noting that Verrucomicrobiota abundance was significantly increased in the model group. However, this increase was remarkably reversed after SAP treatment (Figure 3f). Moreover, Actinobacteria abundance was significantly higher in the PS group (Figure 3e). Overall, these findings indicate that SAP can alter GM abundance.
We further analyzed the degree of taxonomic similarity among the different groups at the genus level. As shown in Figure 4, the taxa heatmap indicated that the CL and SP groups clustered well at the genus level and were clearly separated from the ML group. This suggests that the gut microbiota composition of mice in the PS group was closer to that of the CL group.
FIGURE 4
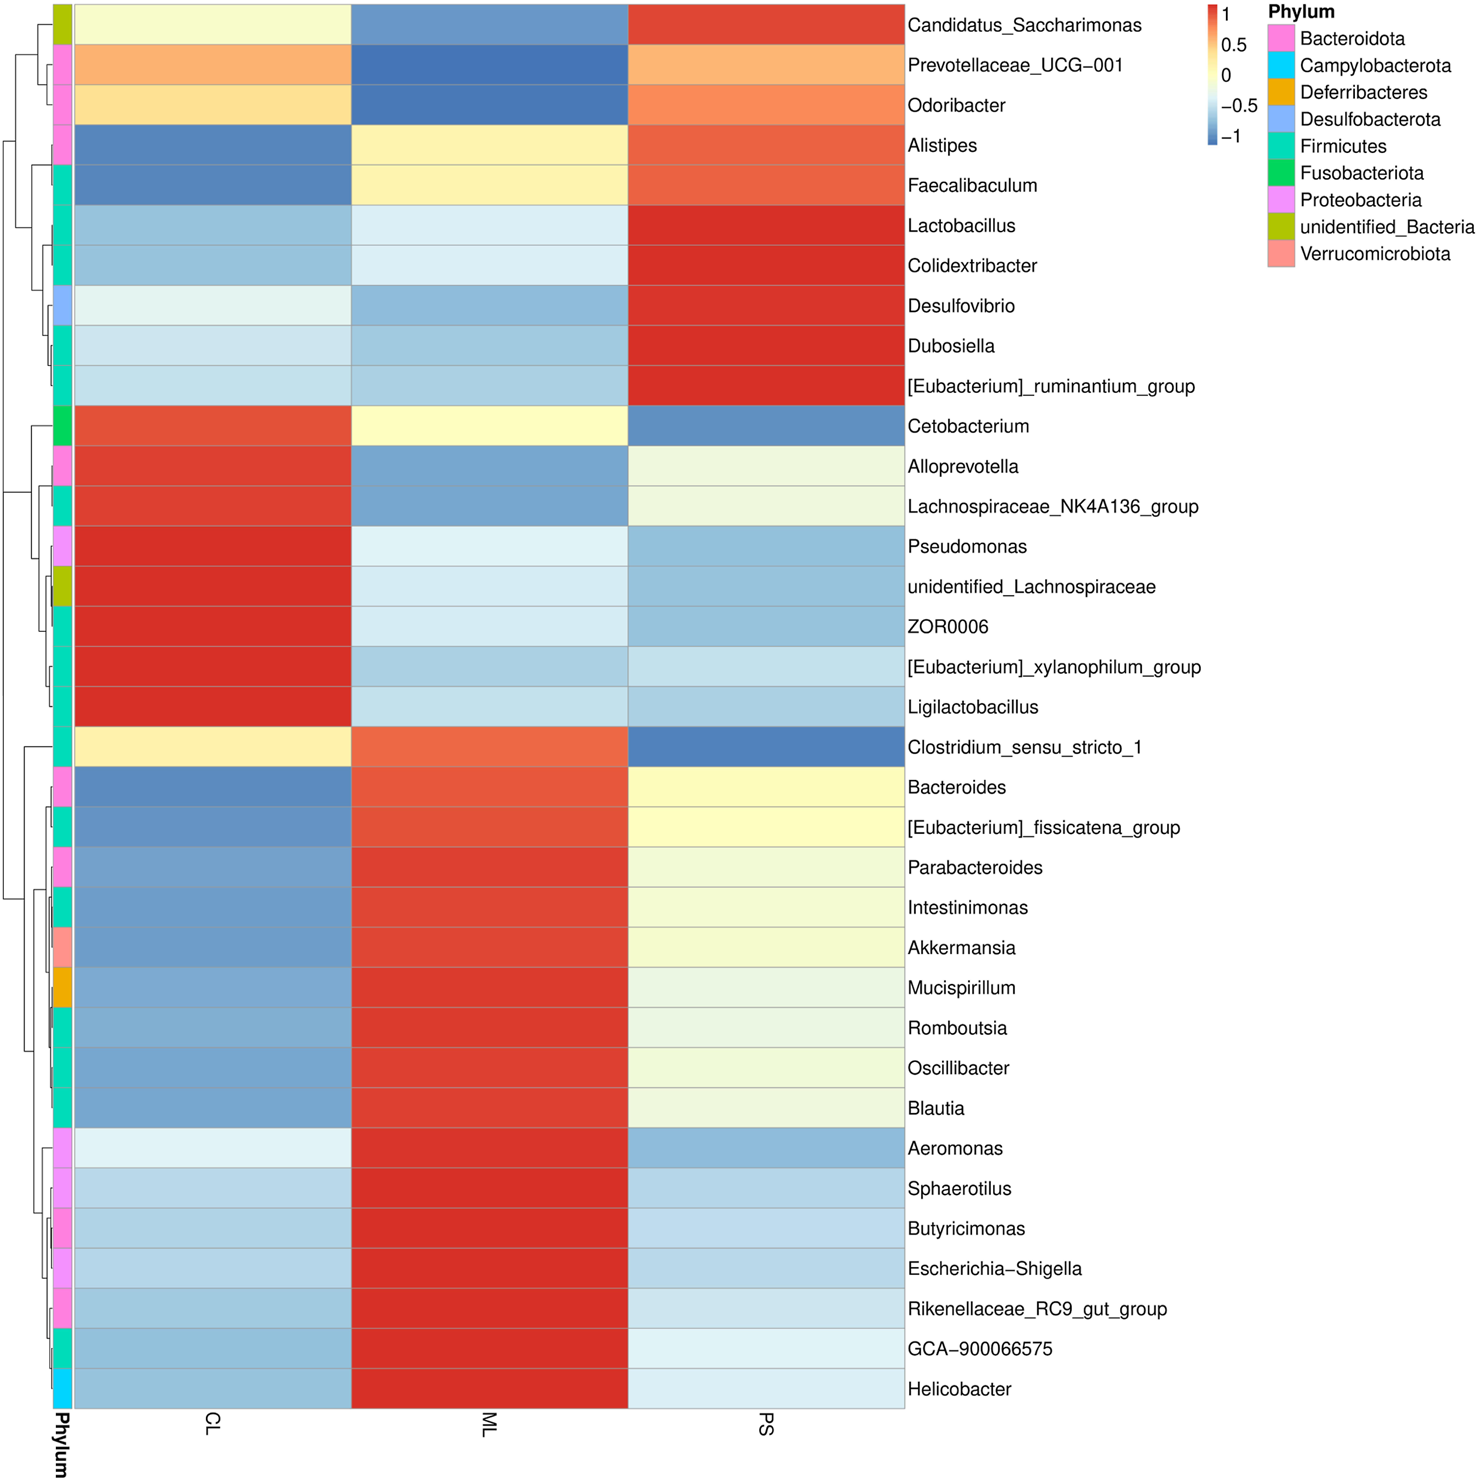
Heatmap of microbial distributions at genus level in the CL, ML, and PS groups. Blocks in red and blue indicate the high and low z-score values of OUT sizes, respectively.
To search for differences across species, we also conducted t-tests at the genus level. Figures 5a–c show the differentially exhibited microbiota between the groups at the genus level. It is worth noting that there were no significant differences in the abundances of Akkermansia, Rikenella, Rikenellaceae_RC9_gut_group, and unidentified_Clostridia_vadinBB60_group between the CL and PS groups. In contrast, their abundance was clearly increased in model mice; however, this alteration was remarkably reversed after PS administration (Figures 5d–g). They were attached to three phyla (Verrucomicrobiota, Bacteroidota, and Firmicutes), three classes (Verrucomicrobiae, Bacteroidia, and Clostridia), three orders (Verrucomicrobiales, Bacteroidales, and Clostridia_vadinBB60_group), three families (Akkermansiaceae, Rikenellaceae, and unidentified Clostridia_vadinBB60_group), and four genus levels. We also performed LEfSe analysis to determine the detailed composition of the GM. As indicated in Figure 5h, compared with the CL group, the Verrucomicrobiota phylum, Verrucomicrobiae class, Verrucomicrobiales order, Akkermansiaceae family, and Akkermansia genus were significant biomarkers after DSS-induced UC in mice; however, the biomarker levels changed after SAP treatment, which was similar to the results of the T-test. Overall, DSS induced microbial dysbiosis in mice, whereas SAP could regulate GM dysbiosis to restore intestinal homeostasis.
FIGURE 5
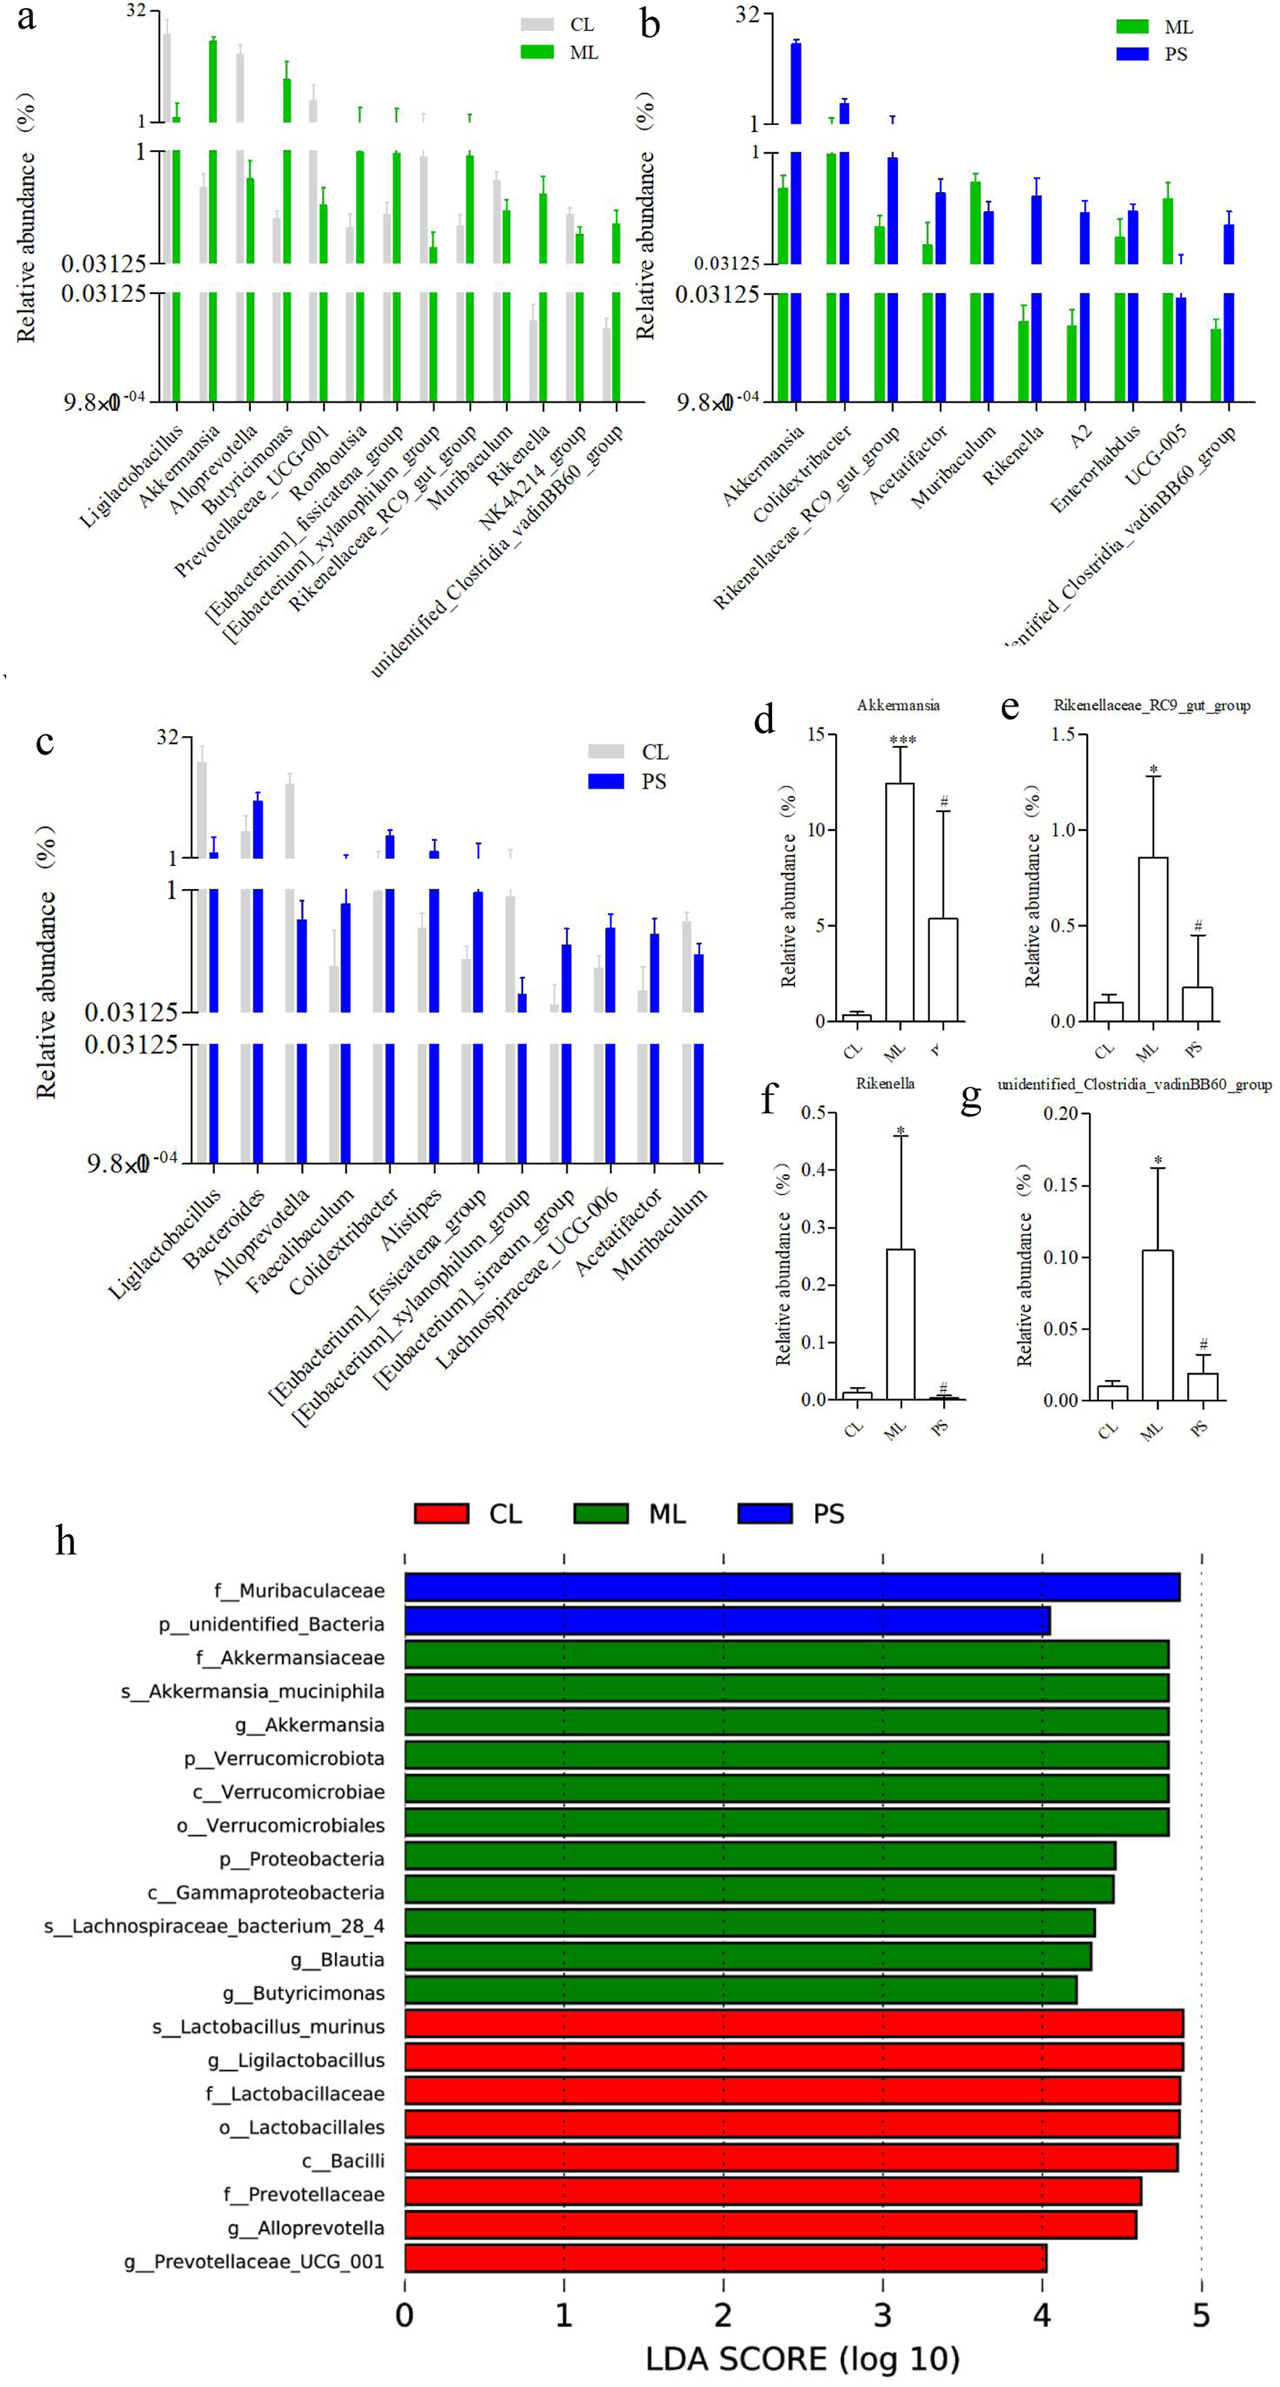
Categories of species that are obviously different between the two groups at the genus level: (a) CL group vs. ML group, (b) CL group vs. PS group, and (c) ML group vs. PS group. Relative abundance of (d) Akkermansia, (e) Rikenellaceae_RC9_gut_group, (f) Rikenella, and (g) unidentified_Clostridia_vadinBB60_group in cecal microbiota in the CL, ML, and PS groups. (h) LEfSe analysis of the gut microbiota differed among CL, ML, and PS groups. The statistical test was performed using the LDA effect size method.
3.4 SAP regulates metabolites in mice with DSS-induced colitis
The gut microbiota is involved in host metabolism and, in turn, affects metabolite production. The effects of SAP on metabolites were studied using metabolomics. UPLC-QTOF-MS/MS was used to detect 1,219 metabolites in the cecal contents of mice. As indicated in Figures 6a,b, clear metabolic differentiation was observed among the groups. There were 97 different metabolites in the groups (Figure 6c). Further data analysis found that the levels of the 19 metabolites was decreased in the ML group compared to those in the CL group, while SAP treatment could restore these changes (Figure 6d); meanwhile, compared with the CL group, DSS administration increased the amount of 25 metabolites, while these changes were remarkably reversed after PS treatment (Figure 6e). Overall, these findings displayed that the effect of SAP on UC is mediated by metabolic modification.
FIGURE 6
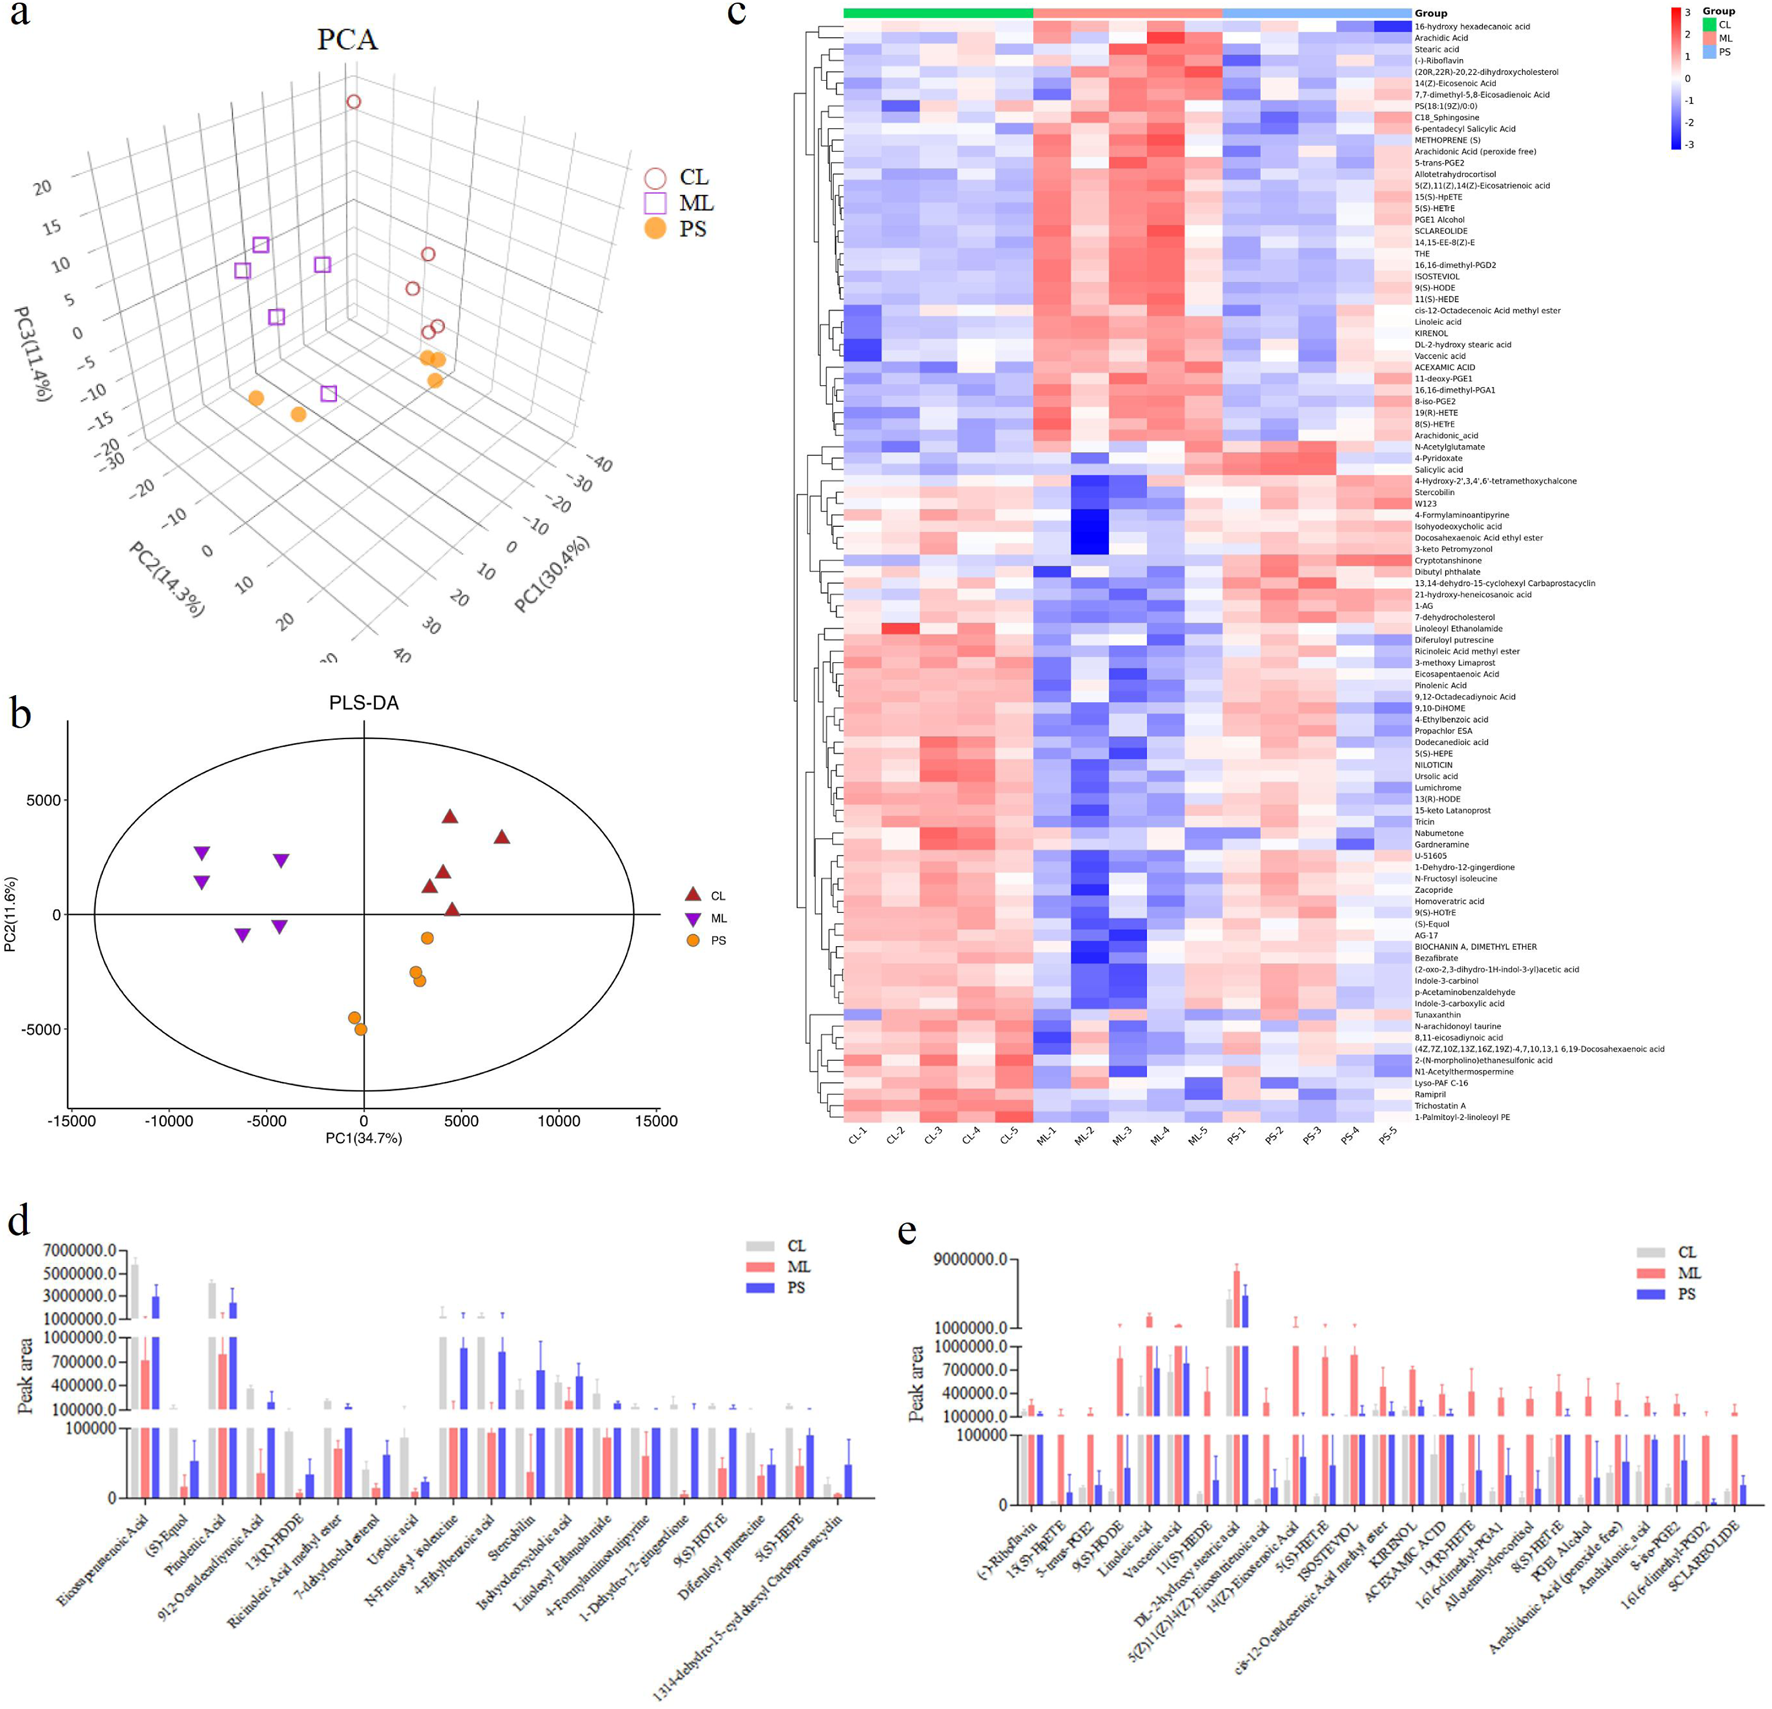
Effects of SAP on the metabolites. (a) Principal component analysis (PCA) plot showing clustering between the groups. (b) PLS-DA model predicting the differences between the samples. (c) Differential metabolites analysis by heatmap in the CL, ML, and PS groups. (d,e) Differences in the metabolites amount; the amount of all the metabolites is significantly different between the CL and ML groups (p < 0.05).
Metabolic pathway enrichment analysis was carried out for differentially expressed metabolites using the KEGG database. The linoleic acid metabolism and the biosynthesis of the unsaturated fatty acids pathway were mainly affected after SAP treatment compared with other metabolic pathways (Figure 7). In these two metabolic pathways, the levels of the four metabolites (linoleic acid, DL-2-hydroxy stearic acid, arachidonic acid, and 9(S)-HODE) were distinctly increased in the colitis model mice compared to those in the CL group, and SAP recovered the levels of these four metabolites (Figure 6e). Moreover, in the linoleic acid metabolism pathway, the level of the metabolite (13(R)-HODE) was obviously decreased in the ML group compared to that in the CL group. At the same time, this alteration was remarkably reversed after PS treatment (Figure 6d).
FIGURE 7
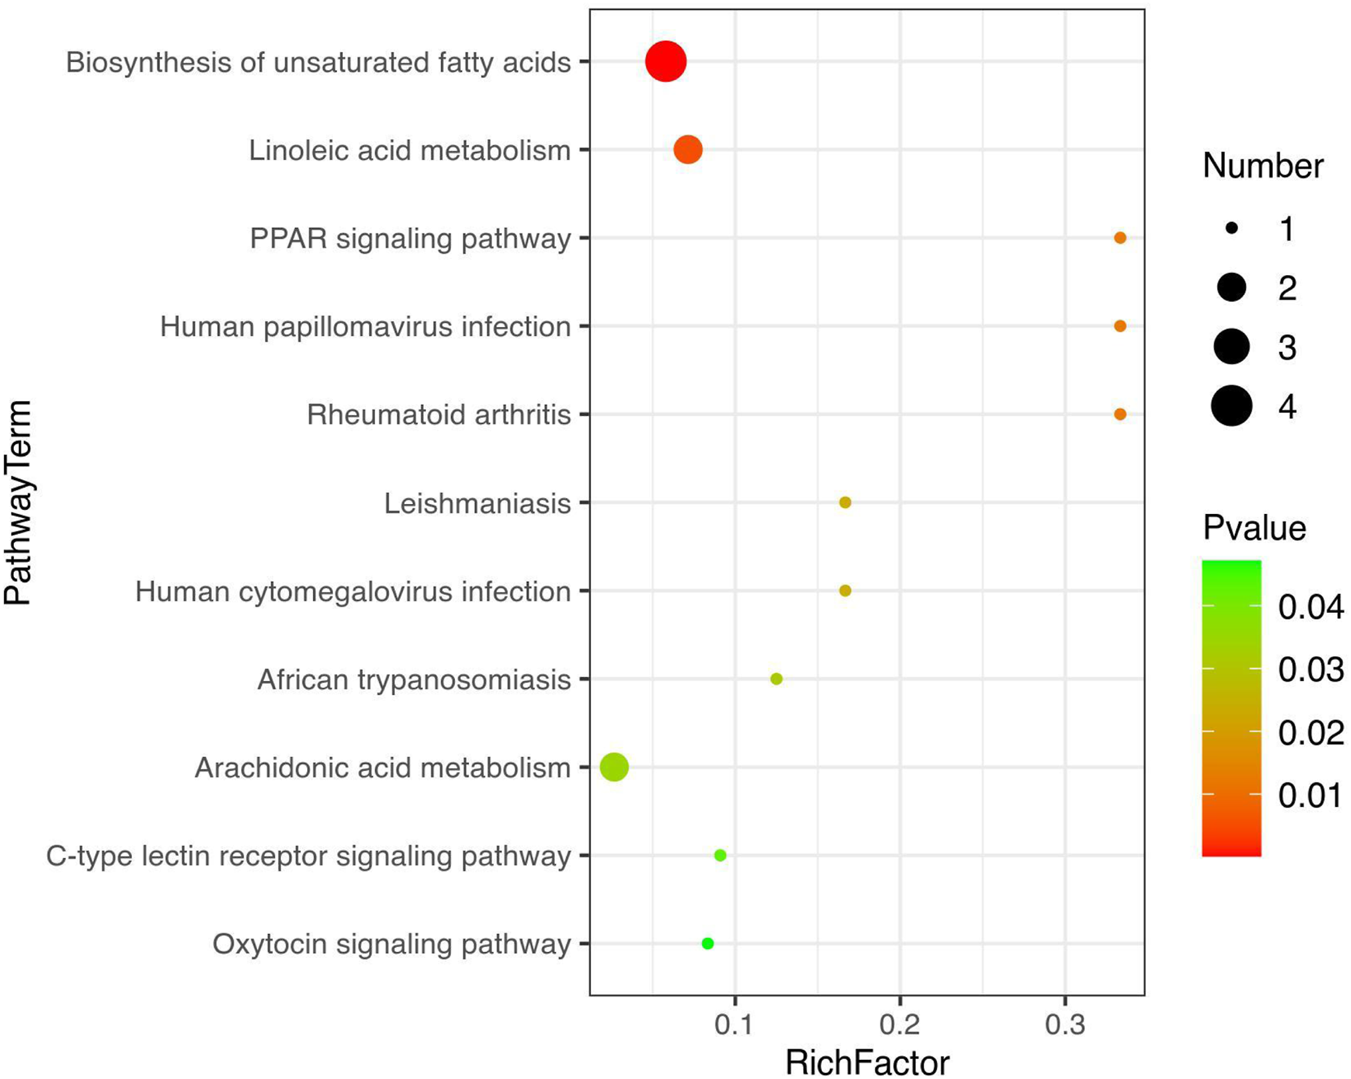
Metabolic pathway enrichment analysis was performed for the differential metabolites by the KEGG database.
3.5 Correlation analysis of gut microbiota and metabolites
We conducted Pearson’s rank correlation analysis on the altered metabolites to investigate the influence of SAP on metabolites (Figure 8a). The findings displayed that 10 metabolites were significantly correlated with linoleic acid, and four metabolites (kirenol, DL-2-hydroxy stearic acid, vaccenic acid, and acexamic acid) were significantly positively correlated with linoleic acid. In comparison, six metabolites (U-51605, 4-ethylbenzoic acid, 9,10-DiHOME, eicosapentaenoic acid, pinolenic acid, and 9,12-octadecadiynoic acid) showed a clear negative correlation with linoleic acid (Figure 8a). For DL-2-hydroxy stearic acid, the related metabolites were similar to those for linoleic acid, except for kirenol. Our findings demonstrated that nine metabolites were clearly correlated with 9(S)-HODE; three metabolites (arachidonic acid (peroxide free), 5(S)-HETrE, and PGE1 alcohol) were significantly positively correlated with 9(S)-HODE, while six metabolites (8,11-eicosadiynoic acid, (2-oxo-2,3-dihydro-1H-indol-3-yl) acetic acid, U-51605, eicosapentaenoic acid, pinolenic acid, and 9,12-octadecadiynoic acid) displayed a significant negative correlation with 9(S)-HODE (Figure 8a). For arachidonic acid, two metabolites (19(R)-HETE) and 8(S)-HETrE) were positively correlated, whereas six metabolites (8,11-eicosadiynoic acid, U-51605, 4-ethylbenzoic acid, eicosapentaenoic acid, pinolenic acid, and 9,12-octadecadiynoic acid) showed a markedly negative correlation (Figure 8a). However, as shown in Figure 8a, no metabolites correlated with 13(R)-HODE.
FIGURE 8
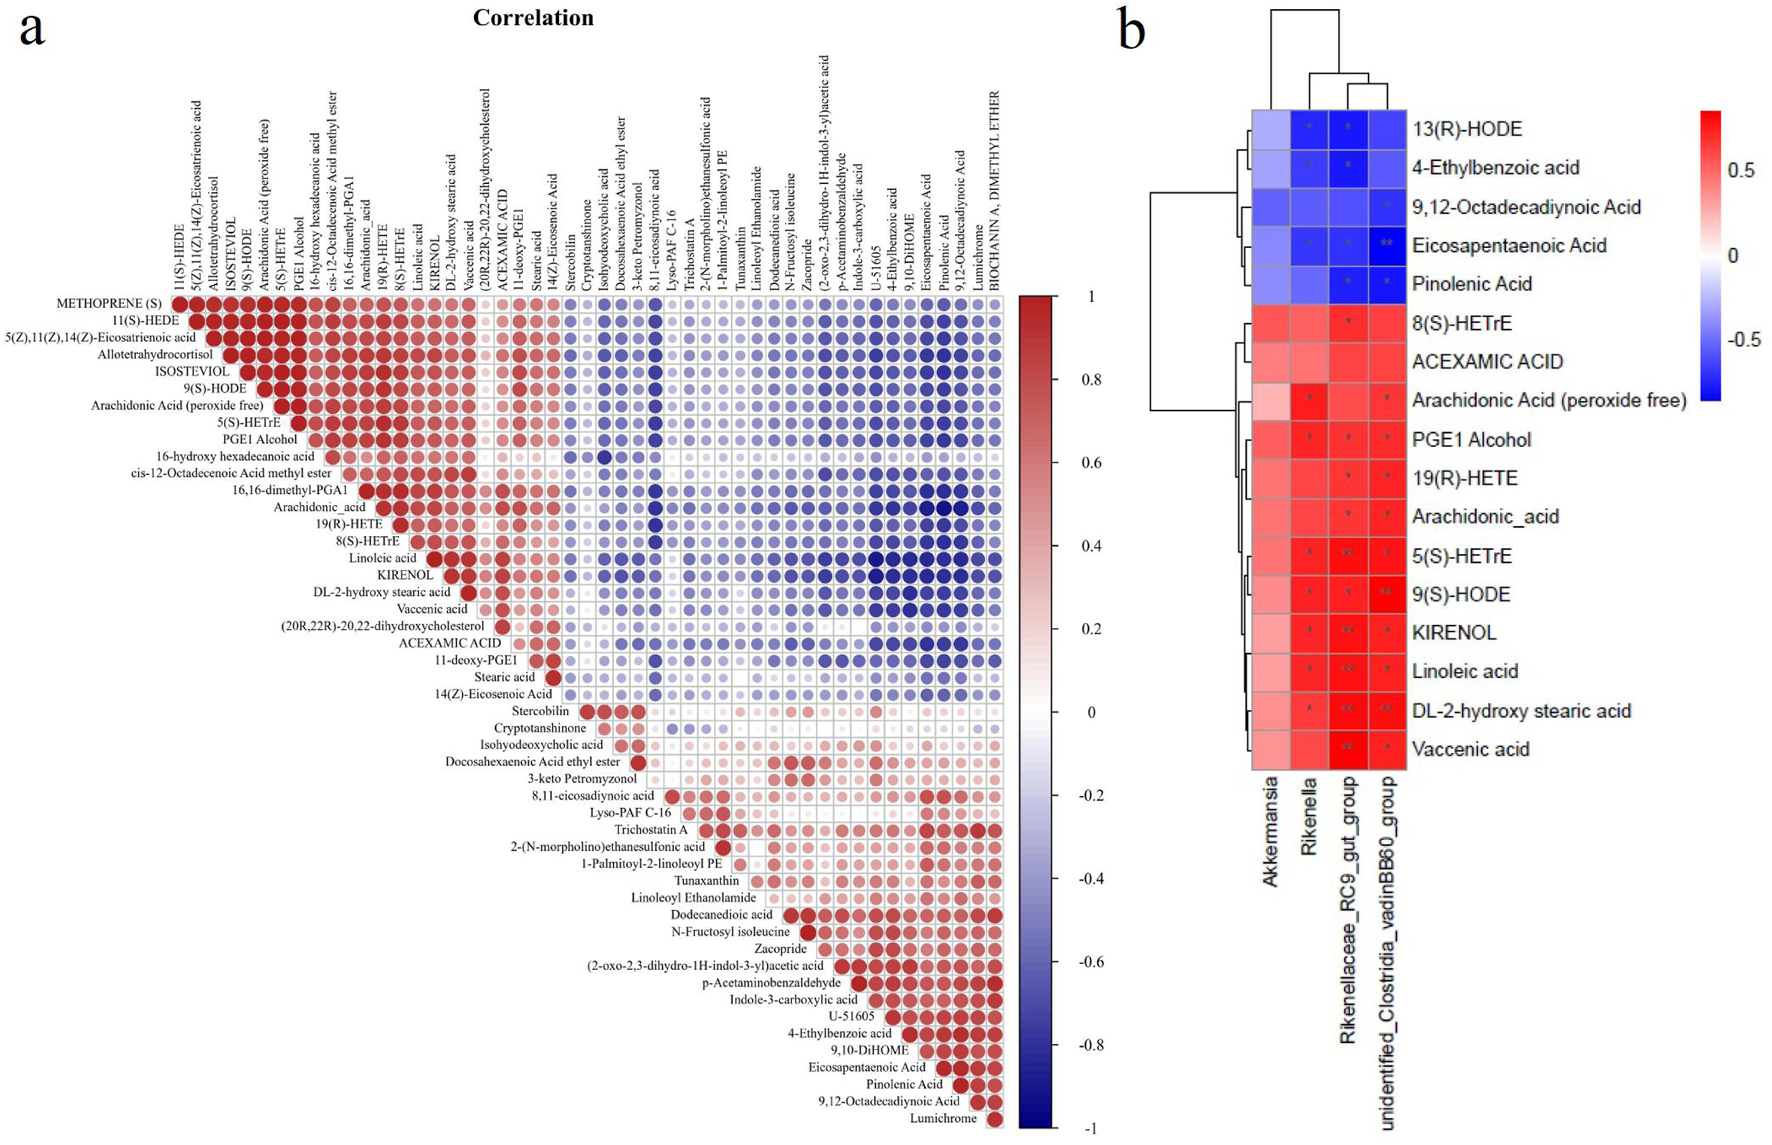
Correlation analysis of gut microbiota and metabolites. (a) Pearson’s rank correlation analysis on altered metabolites to investigate the effects of SAP on metabolites. (b) Spearman’s rank correlation analysis detecting the association between the 4 altered gut microbiota and 17 altered metabolites. Red and blue indicate the positive and negative correlations, respectively, and *p < 0.05 and **p < 0.01.
Spearman’s rank correlation analysis was performed to examine the relationships between the 4 altered GM and 17 altered metabolites, clarifying how changes in GM abundance are associated with the altered metabolites (Figure 8b). The findings revealed that three altered GM taxa showed a clear positive or negative correlation with 16 altered metabolites (Figure 8b). The relative abundance of Rikenella was positively correlated with seven metabolites (arachidonic acid (peroxide free), PGE1 alcohol, 5(S)-HETrE, 9(S)-HODE, kirenol, linoleic acid, and DL-2-hydroxy stearic acid) and negatively correlated with three metabolites (13(R)-HODE, 4-ethylbenzoic acid, and eicosapentaenoic acid). For the relative abundance of Rikenellaceae_RC9_gut_group, it showed a positive correlation with the contents of 10 metabolites (8(S)-HETrE, PGE1 alcohol, 19(R)-HETE, arachidonic acid, 5(S)-HETrE, 9(S)-HODE, kirenol, linoleic acid, DL-2-hydroxy stearic acid, and vaccenic acid) and a negative correlation with the contents of four metabolites (13(R)-HODE, 4-ethylbenzoic acid, pinolenic acid, and eicosapentaenoic acid). Moreover, unidentified_Clostridia_vadinBB60_group abundance was positively correlated with 10 metabolites (arachidonic acid (peroxide free), PGE1 alcohol, 19(R)-HETE, arachidonic acid, 5(S)-HETrE, 9(S)-HODE, kirenol, linoleic acid, DL-2-hydroxy stearic acid, and vaccenic acid). It was negatively associated with three metabolites (9,12-octadecadiynoic acid, eicosapentaenoic acid, and pinolenic acid).
4 Discussion
Ulcerative disease is a chronic inflammatory condition (Khor et al., 2011) that severely affects patients’ daily lives, studies, and work (Guindi and Riddell, 2004). However, many drugs used to treat UC have numerous side effects (Rahimi and Abdollahi, 2010; Tao and Siew, 2018). A natural product derived from traditional Chinese food and medicine has been developed as a vital complementary approach for ulcerative disease (Gilardi et al., 2014). In the present study, SAP, the polysaccharide from Sonchus arvensis L., effectively attenuated DSS-induced colitis, as demonstrated by body weight changes, DAI, and HE in model mice after 1 week of treatment. Yang et al. (2021) reported that Fuzhuan brick tea polysaccharide improved colitis, Mytilus coruscus polysaccharide has an anti-inflammatory effect in colitis mice (Xiang et al., 2021), Ficus carica polysaccharide attenuates DSS-induced colitis in C57BL/6 mice (Zou et al., 2020), and polysaccharides from Flammulina velutipes improve colitis (Zhang et al., 2020). Our findings are similar to those of the studies mentioned above. Because our research is an early-stage, single-dose study, the 4R rules (reduce, refine, replace, and responsibility) are used.
Polysaccharides play a crucial pharmacological role in non-specific and specific immunity (Shao et al., 2006). It can activate immune cells, increase antibody levels, promote cytokine release, and activate the complement system (Schepetkin et al., 2013; Sheu et al., 2013). The spleen index and thymus index reflect essential immune functions. Therefore, we first determined the spleen index and thymus index, and the results showed that SAP reversed thymic atrophy induced by DSS. This finding is consistent with those of previous reports (Wang et al., 2011). Immunoglobulins (IgGs) are involved in systemic humoral immunity. The major immunoglobulins are IgA, IgG, and IgM, and they play an essential role in neutralizing pathogens and toxins, making pathogens more susceptible to phagocytosis by various phagocytic cells (Ollila and Vihinen, 2005). Our results showed that SAP played a more effective role in immune regulation, as evidenced by its effect on immunoglobulin production.
Neutrophils are the most abundant immune cells in the body and play a vital role in the immune response. Neutrophils recognize molecular receptors on the microbial surface at the site of infection, activate signaling pathways, ultimately prolong cell survival, promote adhesion and phagocytosis, and enhance cytokine production, which supports the immune response (Lauvau et al., 2014). Lymphocytes participate in immune reactions through cellular and humoral regulation. It was found that patients with UC had altered lymphocytes (Jorgensen and Miao, 2015). Platelets can promote hemostasis, repair endothelial tissue, and participate in the body’s inflammatory response. In the presence of inflammation, platelet counts can change, and some inflammatory diseases use PLR as a clinical indicator of disease severity (Park et al., 2013; Do Carmo et al., 2014). Anemia is a common complication of inflammatory bowel disease that responds to disease severity to some extent. The most common anemia in IBD is iron deficiency anemia (Gomollon and Gisbert, 2009; Oustamanolakis et al., 2011), which is associated with PLT. Therefore, routine blood parameters were determined for all groups. As shown in Table 1, SAP reversed most routine blood parameters in the UC model mice.
The gut microbiota is a micro-ecosystem that parasitizes the human body and plays a vital role in maintaining human health (Nishida et al., 2018). It has been reported that the composition of gut microbiota is altered in patients with inflammatory bowel diseases compared to that in healthy humans (Sartor and Wu, 2017; Takahashi et al., 2016). Therefore, GM is a possible target for UC treatment. Exposure to intestinal microbes is unavoidable after the oral administration of traditional Chinese medicine. It is well-known that digestion in the stomach or small intestine does not degrade or absorb natural polysaccharides (EI Kaoutari et al., 2013). However, polysaccharides can be metabolized by the microflora in the large intestine to exert their physiological functions. Thus, we hypothesized that the intestinal microflora may be responsible for SAP’s anti-inflammatory effect. Therefore, 16S rRNA amplicon sequencing was performed to investigate whether SAP could regulate gut microbiota dysbiosis in UC and restore intestinal homeostasis. Our study indicated that SAP treatment remarkably reversed the increase in the abundance of Akkermansia, Rikenella, Rikenellaceae_RC9_gut_group, and unidentified_Clostridia_vadinBB60_group in DSS-induced UC mice (Figure 5). This finding is similar to those of previous reports (Guo et al., 2020), which suggest that regulating these bacterial communities may be a common characteristic of polysaccharides exerting probiotic effects.
Compared to other metabolic pathways, SAP treatment mainly affected linoleic acid metabolism and the biosynthesis of unsaturated fatty acids (Figure 7). The biosynthesis of unsaturated fatty acids is mediated by arachidonic acid (Lillo-Carmona et al., 2020). In this study, many arachidic acid derivatives were found to be important for SAP treatment of UC. In addition, these metabolites are associated with perturbations in linoleic acid metabolism. These metabolite changes may alter linoleic acid metabolism in the host. It has been reported that the disease is caused by perturbation of linoleic acid metabolism (Li et al., 2017). The three polyunsaturated fatty acids (PUFAs), namely, eicosapentaenoic acid, pinolenic acid, and 9,12-octadecadiynoic acid, have anti-inflammatory effects (Richards et al., 2020; Wu et al., 2019), and humans need to consume PUFAs, which are indispensable for cell survival (Lee et al., 2019; Stoffel et al., 2020). 4-Ethylbenzoic acid is a phenolic acid produced during colon fermentation that regulates inflammatory signaling molecules (Bessonneau et al., 2021). 13(R)-HODE inhibits IL-6 release from monocytes, which suggests that the lipids may play a vital role in controlling inflammatory responses (Rolin et al., 2014). In summary, Figures 5d–g, 6d,e, 8 show that five metabolites (eicosapentaenoic acid, pinolenic acid, 9,12-octadecadiynoic acid, 4-ethylbenzoic acid, and 13(R)-HODE) were key to UC treatment, and SAP could regulate these five metabolites.
Despite the promising results, several limitations of this study should be acknowledged. First, the DSS-induced colitis model, while well-established, primarily represents an acute injury and repair mechanism. It may not fully recapitulate the chronic, relapsing nature of human ulcerative colitis, which involves complex, dysregulated immune responses over a long period. Therefore, the therapeutic efficacy of SAP should be further validated in chronic colitis models or other genetic models to better assess its long-term benefits and potential to maintain remission.
5 Conclusion
SAP improved the DAI score and colonic length in DSS-induced colitis in mice and reduced pathologic damage, suggesting that SAP has a protective effect in this model. Moreover, SAP treatment modified immune parameters in colitis mice. 16S rRNA sequencing revealed that the abundance of Akkermansia, Rikenella, Rikenellaceae_RC9_gut_group, and unidentified_Clostridia_vadinBB60_group in the UC model mice was remarkably reversed after PS treatment. The results of the correlation analysis of GM and the metabolites demonstrated that SAP could regulate five metabolites (eicosapentaenoic acid, pinolenic acid, 9,12-octadecadiynoic acid, 4-ethylbenzoic acid, and 13(R)-HODE), which are correlated with GM. The protective effect of SAP on the model mice may be related to GM diversity and metabolites.
Statements
Data availability statement
The original contributions presented in the study are publicly available. This data can be found at the NCBI repository, accession number PRJNA1391682, available at: https://www.ncbi.nlm.nih.gov/sra/PRJNA1391682.
Ethics statement
The animal study was approved by Heilongjiang Bayi Agricultural University. The study was conducted in accordance with the local legislation and institutional requirements.
Author contributions
YR: Software, Investigation, Writing – review and editing, Writing – original draft, Resources, Funding acquisition, Visualization, Formal analysis, Validation, Data curation, Methodology, Supervision, Conceptualization, Project administration. SH: Investigation, Conceptualization, Writing – original draft, Data curation, Methodology. GC: Validation, Data curation, Writing – original draft, Methodology. YZ: Project administration, Visualization, Validation, Supervision, Writing – review and editing.
Funding
The authors declare that financial support was received for the research and/or publication of this article. This work was supported by the National Natural Science Foundation of China (81703426), the Heilingjiang Bayi Agriculture University Startup Program (XYB202511), the Heilongjiang Province “Double First-class” Discipline Collaborative Innovation Achievement Project (LJGXCG2021-F07), and the Heilongjiang University Students Innovation and Entrepreneurship Training Project (202310223018 and 202410223122).
Acknowledgments
The authors thank Shanghai OE Biotech Co., Ltd. (Shanghai, China) and Shanghai Luming Biological Technology Co., Ltd. (Shanghai, China) for their enthusiastic support for this metabolomics analysis.
Conflict of interest
The authors declare that the research was conducted in the absence of any commercial or financial relationships that could be construed as a potential conflict of interest.
Generative AI statement
The authors declare that no Generative AI was used in the creation of this manuscript.
Any alternative text (alt text) provided alongside figures in this article has been generated by Frontiers with the support of artificial intelligence and reasonable efforts have been made to ensure accuracy, including review by the authors wherever possible. If you identify any issues, please contact us.
Publisher’s note
All claims expressed in this article are solely those of the authors and do not necessarily represent those of their affiliated organizations, or those of the publisher, the editors and the reviewers. Any product that may be evaluated in this article, or claim that may be made by its manufacturer, is not guaranteed or endorsed by the publisher.
References
1
Andoh A. Sakata S. Koizumi Y. Mitsuyama K. Fujiyama Y. Benno Y. (2007). Terminal restriction fragment length polymorphism analysis of the diversity of fecal microbiota in patients with ulcerative colitis. Inflamm. Bowel. Dis13, 955–962. 10.1002/ibd.20151
2
Bahorun T. Aumjaud E. Ramphul H. Rycha M. Luximon-Ramma A. Trotin F. et al (2003). Phenolic constituents and antioxidant capacities of Crataegus monogyna (hawthorn) callus extracts. Nahrung3, 191–198. 10.1002/food.200390045
3
Bessonneau V. Gerona R. R. Trowbridge J. Grashow R. Lin T. Buren H. et al (2021). Gaussian graphical modeling of the serum exposome and metabolome reveals interactions between environmental chemicals and endogenous metabolites. Sci. Rep.11, 7607. 10.1038/s41598-021-87070-9
4
Cai Y. Liu W. Lin Y. Zhang S. Zou B. Xiao D. et al (2019). Compound polysaccharides ameliorate experimental colitis by modulating gut microbiota composition and function. J. Gastroenterol. Hepatol.34, 1554–1562. 10.1111/jgh.14583
5
Cosnes J. Gower-Rousseau C. Seksik P. Cortot A. (2011). Epidemiology and natural history of inflammatory bowel diseases. Gastroenterol.140, 1785–1794. 10.1053/j.gastro.2011.01.055
6
Do Carmo A. M. Santos F. M. Ortiz-Agostinho C. L. Nishitokukado I. Frota C. S. Gomes F. U. et al (2014). Cytomegalovirus infection ininflammatory bowel disease is not associated with worsening of intestinalinflammatory activity. PLoS. One.9, e111574. 10.1371/journal.pone.0111574
7
Ei Kaoutari A. Armougom F. Gordon J. I. Raoult D. Henrissat B. (2013). The abundance and variety of carbohydrate-activeenzymes in the human gut microbiota. Nat. Rev. Microbiol.11, 497–504. 10.1038/nrmicro3050
8
Fujimoto T. Imaeda H. Takahashi K. Kasumi F. Bamba S. Fujiyama Y. et al (2013). Decreased abundance of Faecalibacterium prausnitzii in the gut microbiota of Crohn’s disease. J. Gastroenterol. Hepatol.28, 613–619. 10.1111/jgh.12073
9
Gilardi D. Fiorino G. Genua M. Allocca M. Danese S. (2014). Complementary and alternative medicine in inflammatory bowel diseases: what is the future in the field of herbal medicine?Expert. Rev. Gastroenterol. Hepatol.8, 835–846. 10.1586/17474124.2014.917954
10
Gomollon F. Gisbert J. P. (2009). Anemia and inflammatory bowel diseases. World J. Gastroenterol.15, 4659–4665. 10.3748/wjg.15.4659
11
Guindi M. Riddell R. H. (2004). Indeterminate colitis. J. Clin. Pathol.57, 1233–1244. 10.1136/jcp.2003.015214
12
Guo N. Zhou L. X. Meng N. Shi Y. P. (2020). Associations of oral and intestinal florae and serum inflammatory factors with pathogenesis of oral cancer. Eur. Rev. Med. Pharmacol. Sci.24, 11090–11095. 10.26355/eurrev_202011_23595
13
Heng Y. Li X. Sun T. Zhang Y. Yang P. (2017). Comparison of ulcerative colitis models respectively induced by free drinking and intragastric administration of dextran sodium sulfate in mice. China Pharm.20, 603–606.
14
Jorgensen I. Miao E. A. (2015). Pyroptotic cell death defends against intracellularpathogens. Immunol. Rev.265, 130–142. 10.1111/imr.12287
15
Kao E. S. Wang C. J. Lin W. L. Yin Y. F. Wang C. P. T. H. (2005). Tseng Anti-inflflammatory potential of flflavonoid contents from dried fruit of crataegus pinnatififida in vitro and in vivo. J. Agric. Food Chem.2, 430–436. 10.1021/jf040231f
16
Kaplan G. G. Ngm S. C. (2017). Understanding and preventing the global increase of inflammatory bowel disease. Gastroenterol.152, 313–321.e2. 10.1053/j.gastro.2016.10.020
17
Khor B. Gardet A. Xavier R. J. (2011). Genetics and pathogenesis of inflammatory bowel disease. Nature474, 307–317. 10.1038/nature10209
18
Kouakou K. Schepetkin I. A. Yapi A. Kirpotina L. N. Jutila M. A. Quinn M. T. (2013). Immunomodulatory activity of polysaccharides isolated from Alchornea cordifolia. J. Ethnopharmacol.146, 232–242. 10.1016/j.jep.2012.12.037
19
Lauvau G. Chorro L. Spaulding E. Soudja S. M. (2014). Inflammatory monocyte effector mechanisms. Cell Immunol.291, 32–40. 10.1016/j.cellimm.2014.07.007
20
Lee K. R. Kim K. H. Kim J. B. Hong S. B. Jeon I. Kim H. U. et al (2019). High accumulation of γ-linolenic acid and stearidonic acid in transgenic perilla (Perilla frutescens var. frutescens) seeds. BMC Plant Biol.19, 120. 10.1186/s12870-019-1713-2
21
Li J. Zhao P. Yang L. Li Y. Tian Y. Li S. et al (2017). Integrating 3-omics data analyze rat lung tissue of COPD states and medical intervention by delineation of molecular and pathway alterations. Biosci. Rep.37, BSR20170042. 10.1042/BSR20170042
22
Lillo-Carmona V. Espinoza A. Rothkegel K. Rubilar M. Nilo-Poyanco R. Pedreschi R. et al (2020). Identification of metabolite and lipid profiles in a segregating peach population associated with mealiness in Prunus persica (L.) batsch. Metabolites10, 154. 10.3390/metabo10040154
23
Lu P. Li J. Liu C. Yang J. Peng H. Xue Z. et al (2022). Salvianolic acid B dry powder inhaler for the treatment of idiopathic pulmonary fibrosis. Asian J. Pharm. Sci.17, 447–461. 10.1016/j.ajps.2022.04.004
24
Luo L. Zheng S. S. Huang Y. F. Qin T. Xing J. Niu Y. L. et al (2016). Preparation and characterization of Chinese yam polysaccharide PLGA nanoparticles and their immunological activity. Int. J. Pharm.511, 140–150. 10.1016/j.ijpharm.2016.06.130
25
Miani M. Gianni R. Liut G. Rizzo R. Toffanin R. Delben F. (2004). Gel beads from novel ionic polysaccharides. Carbohyd. Polym.55, 163–169.
26
Molodecky N. A. Soon I. S. Rabi D. M. Ghali W. A. Ferris M. Chernoff G. et al (2012). Increasing incidence and prevalence of the inflammatory bowel diseases with time, based on systematic review. Gastroenterol.46–54. 10.1053/j.gastro.2011.10.001
27
Ni Y. Liu M. Yu H. Chen Y. Liu Y. Chen S. et al (2019). Desmethylbellidifolin from gentianella acuta ameliorate TNBS-induced ulcerative colitis through antispasmodic effect and anti-inflammation. Front. Pharmacol.10, 1104. 10.3389/fphar.2019.01104
28
Nishida A. Inoue R. Inatomi O. Bamba S. Naito Y. Andoh A. (2018). Gut microbiota in the pathogenesis of inflammatory bowel disease. Clin. J. Gastroenterol.11, 1–10. 10.1007/s12328-017-0813-5
29
Ollila J. Vihinen M. B. cells. (2005). B cells. Int. J. Biochem. Cell Biol.37, 518–523. 10.1016/j.biocel.2004.09.007
30
Oustamanolakis P. Koutroubakis I. E. Messaritakis I. Kefalogiannis G. Niniraki M. Kouroumalis E. A. (2011). Measurement ofreticulocyte and red blood cell indices in the evaluation of anemia ininflammatory bowel disease. J. Crohns. Colitis.5, 295–300. 10.1016/j.crohns.2011.02.002
31
Park S. H. Yang S. K. Hong S. M. Park S. K. Kim J. W. Lee H. J. et al (2013). Severe disease activity and cytomegaloviruscolitis are predictive of a nonresponse to infliximab in patients with ulcerativecolitis. Dig. Dis. Sci.58, 3592–3599. 10.1007/s10620-013-2828-1
32
Rahimi R. Abdollahi M. (2010). A review of the efficacy of traditional Iranian medicine for inflammatory bowel disease. World J. Gastroenterol.16, 4504–4514. 10.3748/wjg.v16.i36.4504
33
Ren Y. Hou S. Sui Y. Chang N. Zhou Y. Sun C. (2023). Sonchus arvensis L. water extract attenuates dextran sulfate sodium-induced colitis by adjusting gut microbiota. Heliyon9, e14168. 10.1016/j.heliyon.2023.e14168
34
Richards J. Arensberg M. B. Thomas S. Kerr K. W. Hegazi R. Bastasch M. (2020). Impact of early incorporation of nutrition interventions as a component of cancer therapy in adults: a review. Nutrients12, 3403. 10.3390/nu12113403
35
Rolin J. Vego H. Maghazachi A. A. (2014). Oxidized lipids and lysophosphatidylcholine induce the chemotaxis, up-regulate the expression of CCR9 and CXCR4 and abrogate the release of IL-6 in human monocytes. Toxins (Basel).6, 2840–2856. 10.3390/toxins6092840
36
Sartor R. B. Wu G. D. (2017). Roles for intestinal bacteria, viruses, and fungi in pathogenesis of inflammatory bowel diseases and therapeutic approaches. Gastroenterol.152, 327–339.e4. 10.1053/j.gastro.2016.10.012
37
Schepetkin I. A. Kouakou K. Yapi A. Kirpotina L. N. Jutila M. A. Quinn M. T. (2013). Immunomodulatory and hemagglutinating activities of acidic polysaccharides isolated from Combretum racemosum. Int. Immunopharmacol.15, 628–637. 10.1016/j.intimp.2013.01.015
38
Seoane-Viaño I. Ong J. J. Luzardo-Álvarez A. González-Barcia M. Basit A. W. Otero-Espinar F. J. et al (2021). 3D printed tacrolimus suppositories for the treatment of ulcerative colitis. Asian J. Pharm. Sci.16, 110–119. 10.1016/j.ajps.2020.06.003
39
Shao P. Zhao L. H. Chen Z. Pang J. P. (2006). Regulation on maturation and function of dendritic cells by Astragalus mongholicus polysaccharides. Int. Immunopharmacol.6, 1161–1166. 10.1016/j.intimp.2006.02.009
40
Sheu S. C. Lyu Y. Lee M. S. Cheng J. H. (2013). Immunomodulatory effects of polysaccharides isolated from Hericium erinaceus on dendritic cells. Process. Biochem.48, 1402–1408. 10.1016/j.procbio.2013.06.012
41
Stoffel W. Schmidt-Soltau I. Binczek E. Thomas A. Thevis M. Wegner I. (2020). Dietary ω3-and ω6-Polyunsaturated fatty acids reconstitute fertility of juvenile and adult Fads2-Deficient mice. Mol. Metab.36, 100974. 10.1016/j.molmet.2020.100974
42
Takahashi K. Nishida A. Fujimoto T. Fujii M. Shioya M. Imaeda H. et al (2016). Reduced abundance of butyrate-producing bacteria species in the fecal microbial community in Crohn’s disease. Digestion93, 59–65. 10.1159/000441768
43
Tao Z. Siew C. (2018). The gut microbiota in the pathogenesis and therapeutics of inflammatory bowel disease. Front. Microbiol.11, 1–10. 10.3389/fmicb.2018.02247
44
Terzic J. Grivennikov S. Karin E. Karin M. (2010). Inflammation and colon cancer. Gastroenterol.13, 2101–2114. 10.1053/j.gastro.2010.01.058
45
Wang H. Wang M. Chen J. Tang Y. Dou J. Yu J. et al (2011). A polysaccharide from Strongylocentrotus nudus eggs protects against myelosuppression and immunosuppression in cyclophosphamide-treated mice. Int. Immunopharmacol.1, 1946–1953. 10.1016/j.intimp.2011.06.006
46
Wishart D. S. Tzur D. Knox C. Eisner R. Guo A. C. Young N. et al (2007). HMDB: the human metabolome database. Nucleic. Acids. Res.35, 521–526. 10.1093/nar/gkl923
47
Wu J. Peng W. Qin R. Zhou H. (2014). Crataegus pinnatifida: chemical constituents, pharmacology, and potential applications. Molecules19, 1685–1712. 10.3390/molecules19021685
48
Wu P. K. Yeh S. C. Li S. J. Kang Y. N. (2019). Efficacy of polyunsaturated fatty acids on inflammatory markers in patients undergoing dialysis: a systematic review with network meta-analysis of randomized clinical trials. Int. J. Mol. Sci.20, 3645. 10.3390/ijms20153645
49
Xiang X. W. Wang R. Yao L. W. Zhou Y. F. Sun P. L. Zheng B. et al (2021). Anti-inflammatory effects of mytilus coruscus polysaccharide on RAW264.7 cells and DSS-induced colitis in mice. Mar. Drugs.19, 468. 10.3390/md19080468
50
Yang W. Ren D. Zhao Y. Liu L. Yang X. (2021). Fuzhuan brick tea polysaccharide improved ulcerative colitis in association with gut microbiota-derived tryptophan metabolism. J. Agric. Food Chem.69, 8448–8459. 10.1021/acs.jafc.1c02774
51
Zhang R. Yuan S. Ye J. Wang X. Zhang X. Shen J. et al (2020). Polysaccharide from flammuliana velutipes improves colitis via regulation of colonic microbial dysbiosis and inflammatory responses. Int. J. Biol. Macromol.149, 1252–1261. 10.1016/j.ijbiomac.2020.02.044
52
Zou Q. Zhang X. Liu X. Li Y. Tan Q. Dan Q. et al (2020). Ficus carica polysaccharide attenuates DSS-induced ulcerative colitis in C57BL/6 mice. Food Funct.11, 6666–6679. 10.1039/d0fo01162b
Summary
Keywords
Sonchus arvensis L., polysaccharide, colitis, gut microbiota, non-targeted metabolomics analysis
Citation
Ren Y, Hou S, Chen G and Zhou Y (2026) The role of total polysaccharides from Sonchus arvensis L. in the prevention and treatment of colitis via regulation of gut microbiota and metabolites. Front. Pharmacol. 16:1657918. doi: 10.3389/fphar.2025.1657918
Received
02 July 2025
Revised
21 November 2025
Accepted
25 November 2025
Published
12 January 2026
Volume
16 - 2025
Edited by
Li Cui, Shanghai Jiao Tong University, China
Reviewed by
Qu Linghang, Hubei University of Chinese Medicine, China
Rong Chen, Shanghai Jiao Tong University, China
Updates
Copyright
© 2026 Ren, Hou, Chen and Zhou.
This is an open-access article distributed under the terms of the Creative Commons Attribution License (CC BY). The use, distribution or reproduction in other forums is permitted, provided the original author(s) and the copyright owner(s) are credited and that the original publication in this journal is cited, in accordance with accepted academic practice. No use, distribution or reproduction is permitted which does not comply with these terms.
*Correspondence: Yulong Zhou, zhouyulong1980@163.com
†These authors have contributed equally to this work
Disclaimer
All claims expressed in this article are solely those of the authors and do not necessarily represent those of their affiliated organizations, or those of the publisher, the editors and the reviewers. Any product that may be evaluated in this article or claim that may be made by its manufacturer is not guaranteed or endorsed by the publisher.