 Michelle Elias
 Matthias König
- Faculty of Life Science, Institute for Biology, Systems Medicine of the Liver, Humboldt-Universität zu Berlin, Berlin, Germany
Introduction: Optimizing glimepiride therapy for type 2 diabetes (T2DM) is challenged by pronounced inter-individual variability in pharmacokinetics.
Methods: We developed a whole-body physiologically based pharmacokinetic (PBPK) model as a digital twin of glimepiride, enabling systematic evaluation of how patient-specific factors influence drug disposition. Using curated data from 20 clinical studies, the digital twin mechanistically simulates glimepiride’s absorption, distribution, metabolism, and excretion (ADME). It accounts for key determinants of variability including renal and hepatic function, CYP2C9 genotype, and bodyweight.
Results: The model accurately reproduced observed pharmacokinetics and quantified these factors’ impact on drug exposure. Increased glimepiride exposure was predicted in individuals with hepatic dysfunction or specific CYP2C9 variants, highlighting substantial genetic and physiological effects.
Discussion: This digital twin provides mechanistic insights into pharmacokinetic variability and serves as an in silico platform for exploring individualized dosing and patient stratification strategies, laying the foundation for clinical decision support tools to improve T2DM management.
1 Introduction
The global burden of type 2 diabetes mellitus (T2DM) has reached critical levels, which poses substantial health and economic challenges (American Diabetes Association Professional Practice Committee, 2024; Institute for Health Metrics and Evaluation (IHME), 2024). However, a major challenge in T2DM management is optimizing treatment, as standardized drug dosing approaches can lead to inadequate glycemic control and increase the risk of adverse events like hypoglycemia (Douros et al., 2017). To address this, personalized dosing strategies, integrating patient-specific data, are increasingly recognized as vital for improving therapeutic effect and safety (Hartmanshenn et al., 2016).
Glimepiride, a second-generation sulfonylurea, is widely used in the management of type 2 diabetes mellitus (McCall, 2001; Langtry and Glimepiride, 1998). It primarily acts by binding to the sulfonylurea receptor 1 (SUR1) subunit of ATP-sensitive potassium channels in pancreatic
Despite its widespread use, glimepiride exhibits notable inter-individual variability in its pharmacokinetic (PK) and pharmacodynamic (PD) response (Yoo et al., 2011). This variability is largely driven by factors such as genetic polymorphisms in the metabolizing enzyme CYP2C9, as well as common comorbidities in T2DM including renal and hepatic impairment (Yoo et al., 2011; Langtry and Glimepiride, 1998; U.S. Food and Drug Administration (FDA), 1995). CYP2C9 genetic variants, particularly *2 (Arg144Cys) and *3 (Ile359Leu) alleles, greatly reduce enzymatic activity compared to the wild-type *1, with carriers demonstrating up to 2.5-fold increased glimepiride exposure and heightened hypoglycemia risk (Suzuki et al., 2006; Yoo et al., 2011). Similarly, renal dysfunction can lead to accumulation of glimepiride metabolites, particularly the active M1 metabolite, potentially prolonging hypoglycemic effects, while hepatic impairment shows minimal impact in mild-moderate cases but may compromise CYP2C9 activity in severe dysfunction (Rosenkranz, 1996; Rosenkranz et al., 1996). Additional factors including bodyweight (Shukla et al., 2004) and varying CYP2C9 allele frequencies across populations further contribute to variability. Consequently, reliably predicting patient response and selecting optimal, safe glimepiride doses remains a clinical difficulty.
While empirical glimepiride pharmacokinetics models have explored aspects like genetic polymorphisms (Yoo et al., 2011), PK-PD relationships (Yun et al., 2006), diabetes-induced physiological changes (Li et al., 2015), or obesity effects (Berton et al., 2023), they address individual factors without modeling their collective effect on glimepiride pharmacokinetics. While each provides important insights, without integrated modeling they offer limited utility for dose optimization across diverse patient populations.
Physiologically based pharmacokinetic (PBPK) modeling provides a potentially powerful framework to address this challenge (Sager et al., 2015; Hartmanshenn et al., 2016; Berton et al., 2023). Unlike traditional empirical pharmacokinetic methods, PBPK simulates drug absorption, distribution, metabolism and excretion based on drug specific properties integrated with physiological systems (Hartmanshenn et al., 2016; Khalil and Läer, 2011). This allows the integration of patient-specific factors (e.g., genetics, organ function) to predict individual drug exposure (Hartmanshenn et al., 2016; Sager et al., 2015). This enables the development of a digital twin, a validated computational replica designed to mirror the drug’s behavior within specific patient populations or individuals, facilitating in silico pharmacokinetic prediction and personalized simulation of dosing outcomes.
This study details the development and evaluation of a whole-body PBPK model serving as a digital twin for glimepiride. Incorporating key determinants of patient variability, the model demonstrates strong predictive performance against clinical data from diverse patient groups. This digital twin serves as a quantitative tool for exploring individual therapeutic scenarios, enabling patient stratification, and laying the foundation for future clinical decision support tools.
2 Results
2.1 Glimepiride database
Clinical pharmacokinetic data from 20 studies (Table 1) were systematically curated to develop the glimepiride digital twin, encompassing diverse patient populations, dosing regimens, and physiological conditions. The workflow for the study selection is illustrated in the Supplementary Figure S1. Each study received a unique PK-DB identifier linked to its PubMed ID for traceability, and the curated dataset was made publicly available to promote transparency and reproducibility.
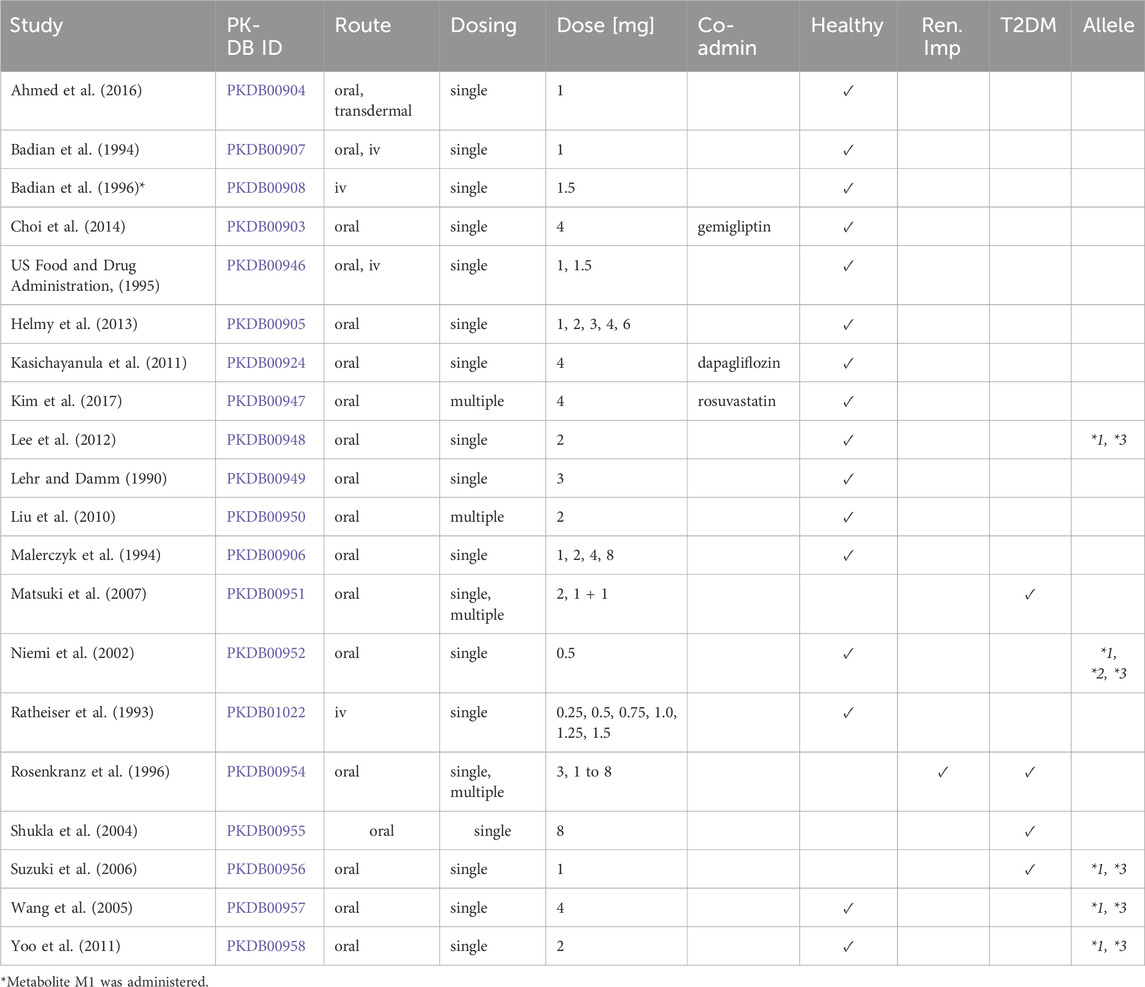
Table 1. Summary of studies for modeling. Overview of study identifiers, PK-DB IDs, administration routes, dosing regimens, doses (mg), co-administered drugs (Co-admin.), and participant characteristics, including health status, renal impairment (Ren. imp.), type 2 diabetes mellitus (T2DM), and the studied genotypes/alleles (Allele).
2.2 Computational model
A whole-body physiologically based pharmacokinetic (PBPK) model was developed to serve as a digital twin of glimepiride, integrating key determinants of inter-individual pharmacokinetic variability (Figure 1). The model comprises key organs involved in glimepiride pharmacokinetics: gastrointestinal tract (dissolution and absorption), liver (CYP2C9-mediated metabolism to metabolites M1 and M2), and kidneys (metabolite excretion), connected via the systemic circulation. Visualizations of the submodels are provided in the supplements (Supplementary Figure S2). The digital twin incorporates patient-specific factors known to influence glimepiride pharmacokinetics: CYP2C9 genotype variants (*1, *2, *3) through enzyme activity scaling (fcyp2c9), renal function impairment via glomerular filtration rate scaling (frenal_function), hepatic dysfunction through Child-Turcotte-Pugh score-based scaling (fcirrhosis), and anthropometric characteristics including bodyweight. Food effects on absorption are captured through bioavailability (fabsorption). Model parameters were optimized against a subset of the curated clinical dataset, achieving good agreement between predictions and observed data across diverse patient populations and dosing scenarios (see Supplementary Table S1; Supplementary Figure S3 for optimized parameters). This framework enables systematic exploration of how genetic polymorphisms, organ dysfunction, and physiological characteristics influence drug exposure, providing a foundation for personalized dosing strategies. Mathematical descriptions of the model equations and ODEs for all submodels are provided in the supplements (Supplementary Section S3). Further study simulations can be found in the supplements (Supplementary Figures S9–S33).
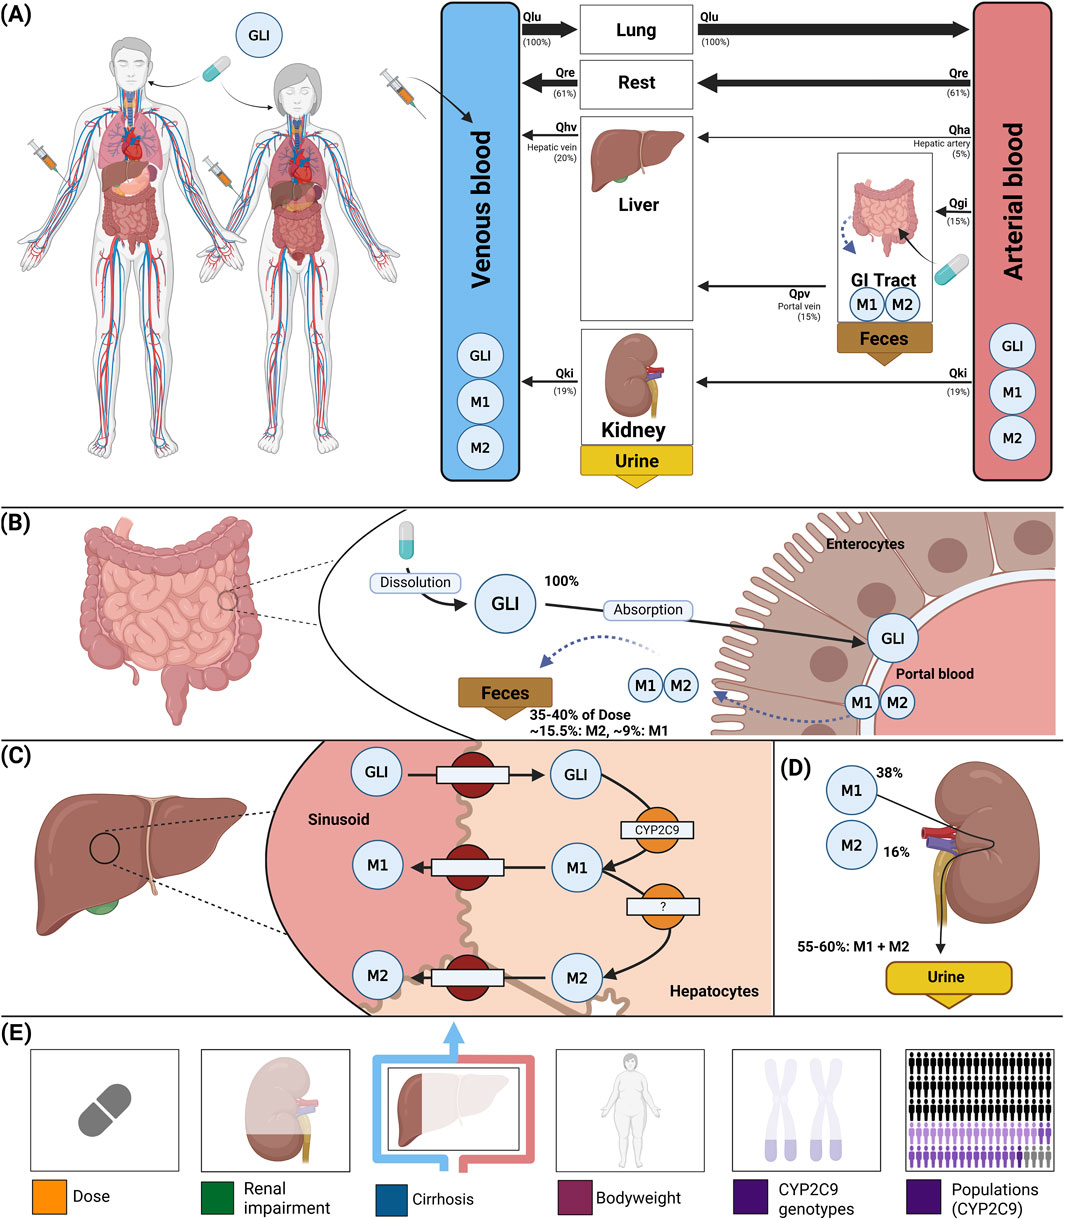
Figure 1. Whole-body PBPK model of glimepiride and key factors influencing its disposition. (A) Whole-body model illustrating glimepiride (GLI) administration (oral and intravenous), its systemic circulation via venous and arterial blood, and the key organs (liver, kidney, GI tract) involved in GLI metabolism, distribution, and excretion. (B) Intestinal model showing dissolution and absorption of GLI by enterocytes. No enterohepatic circulation of M1 and M2 is assumed, but reverse transport via enterocytes is included. (C) Hepatic model depicting CYP2C9-mediated metabolism of GLI to M1 and M2. (D) Renal model highlighting the elimination of M1 and M2 via urine; unchanged GLI is not excreted renally. (E) Key factors influencing glimepiride disposition accounted for by the model: administered dose, renal impairment, liver function (cirrhosis), bodyweight, and CYP2C9 genotypes.
2.3 Dose dependency
The model confirmed dose-proportional pharmacokinetics within the therapeutic dose range (1–8 mg), with Cmax and AUC showing linear increases while Tmax and half-life remained consistent across doses (Figure 2). Specifically, glimepiride Cmax increased linearly from approximately 100 ng/mL at 1 mg to 700 ng/mL at 8 mg, while AUC increased proportionally from 500 to 4,000 ng*hr/mL. Tmax remained stable at 2.0–2.5 h and half-life at approximately 4 h across all doses, confirming linear pharmacokinetics. Metabolites M1 and M2 demonstrated similar dose-proportional behavior. Simulations showed good agreement with clinical data from both Helmy 2013 (Helmy et al., 2013) and Malerczyk 1994 (Malerczyk et al., 1994) for plasma concentrations, with the model also accurately predicting cumulative urinary excretion of metabolites from Malerczyk 1994 (Malerczyk et al., 1994) (reaching about 7 μmol by 48 h for the 8 mg dose). See Supplementary Figure S4 for additional dose dependency simulations.
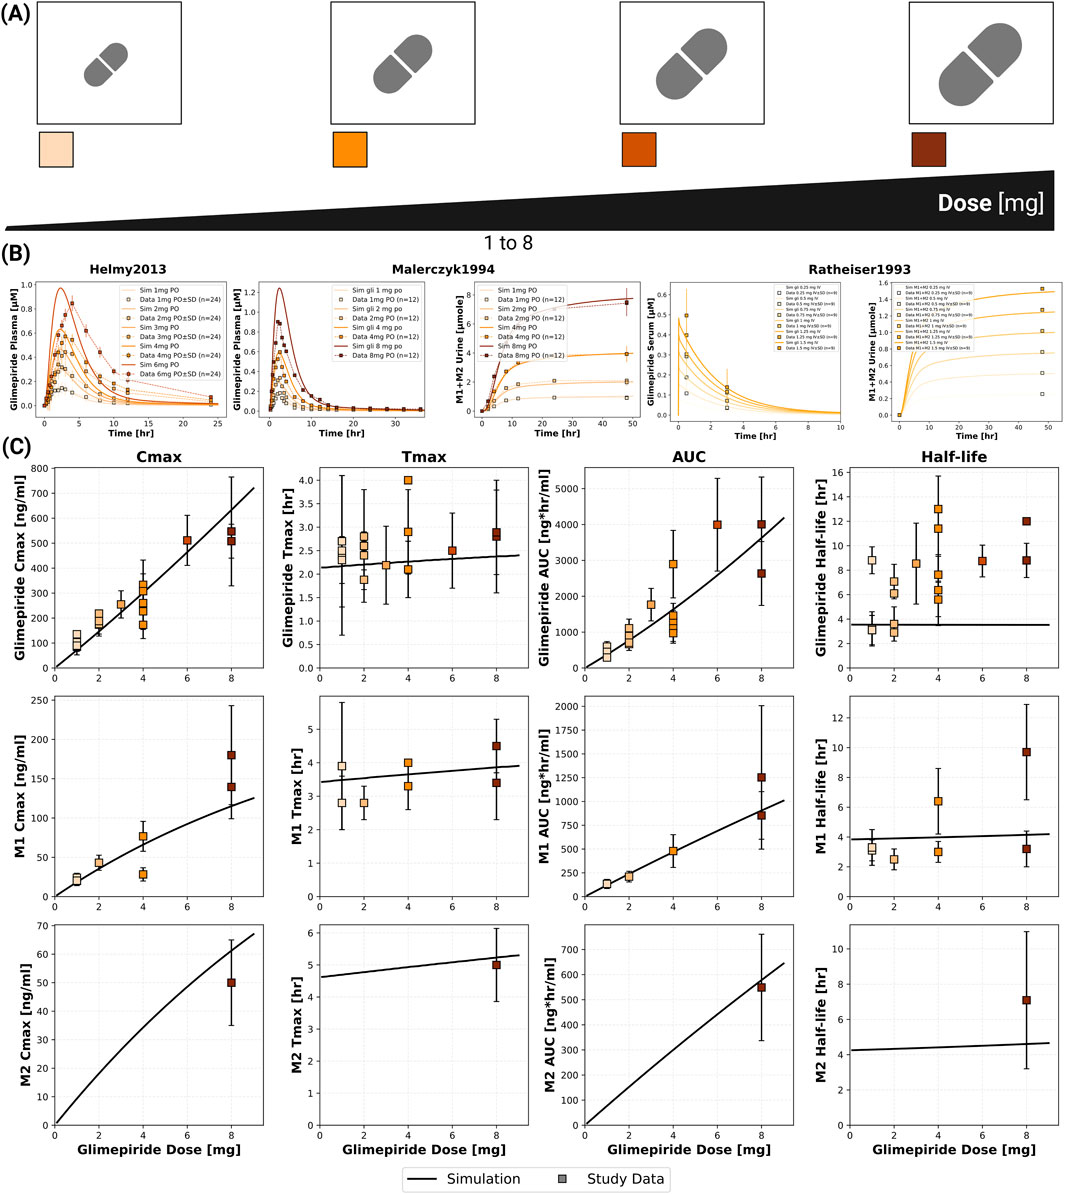
Figure 2. Dose dependent pharmacokinetics of glimepiride and its metabolites. (A) Illustration of the glimepiride oral dose range (1–8 mg) evaluated in the simulations. (B) Simulated (solid lines) versus observed (squares connected by dashed lines) plasma concentration-time profiles of glimepiride from Helmy et al. (2013), glimepiride plasma concentrations and cumulative M1+M2 urinary excretion from (Malerczyk et al., 1994 and Ratheiser et al., 1993) across various oral doses. Observed data are presented as mean or mean
2.4 Renal impairment
The model incorporated four categories of renal function based on glomerular filtration rate [mL/min/1.73 m2]: normal (
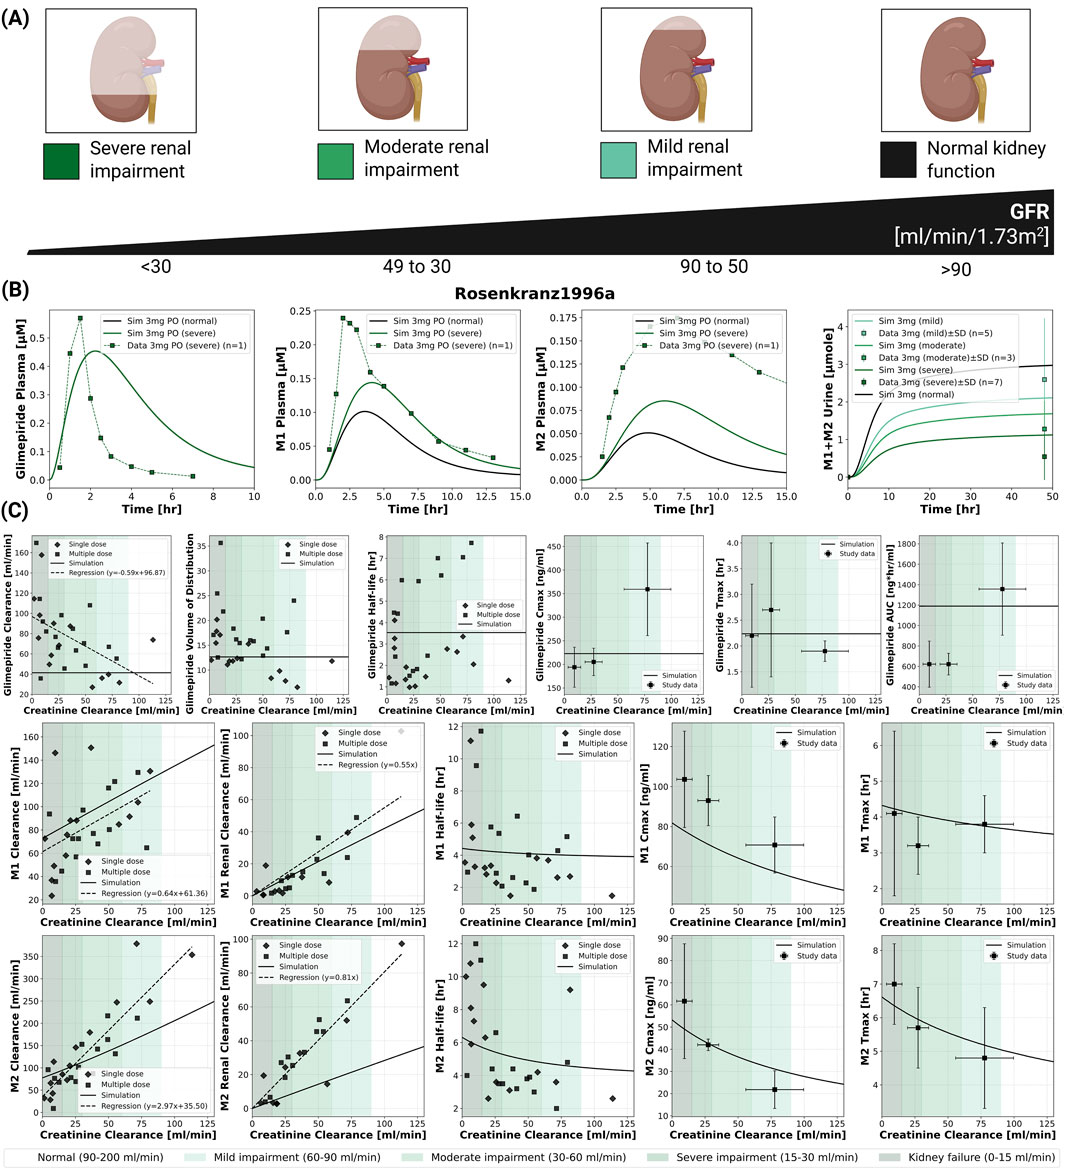
Figure 3. Impact of renal function on the pharmacokinetics of glimepiride and its metabolites. (A) Classification of renal function based on glomerular filtration rate (GFR), illustrating normal function, mild, moderate, and severe renal impairment. (B) Simulated (solid lines) versus observed (squares connected by dashed lines) plasma concentration-time profiles for glimepiride, M1, and M2, and cumulative M1+M2 urinary excretion, following a 3 mg oral dose in subjects with varying degrees of renal function. Observed data from (Rosenkranz et al., 1996). (C) Relationship between creatinine clearance and key pharmacokinetic parameters for glimepiride, M1, and M2, following a 3 mg oral dose. Simulation results (solid lines) are compared with observed clinical data (symbols; dashed lines: regression fits where applicable) from (Rosenkranz et al., 1996).
2.5 Hepatic impairment
The model incorporated Child-Turcotte-Pugh (CTP) classifications: CTP A (mild cirrhosis, 5–6 points), CTP B (moderate cirrhosis, 7–9 points), and CTP C (severe cirrhosis, 10–15 points) (Child and Turcotte, 1964; Infante-Rivard et al., 1987). Hepatic dysfunction demonstrated a strong impact on parent drug exposure (Figure 4). Model predictions matched limited clinical data, showing progressive increases in glimepiride concentrations with worsening liver function. Cmax nearly doubled from 75 ng/mL in normal function to 125 ng/mL in severe cirrhosis, while AUC increased even more substantially by approximately 3.5-fold. Conversely, metabolite concentrations decreased greatly, reflecting reduced CYP2C9-mediated metabolism due to liver impairment. Comparison with limited clinical data from Rosenkranz 1996 (Rosenkranz, 1996) showed reasonable agreement. These findings strongly support dose reduction recommendations in hepatic impairment. See Supplementary Figure S6 for additional hepatic impairment simulations.
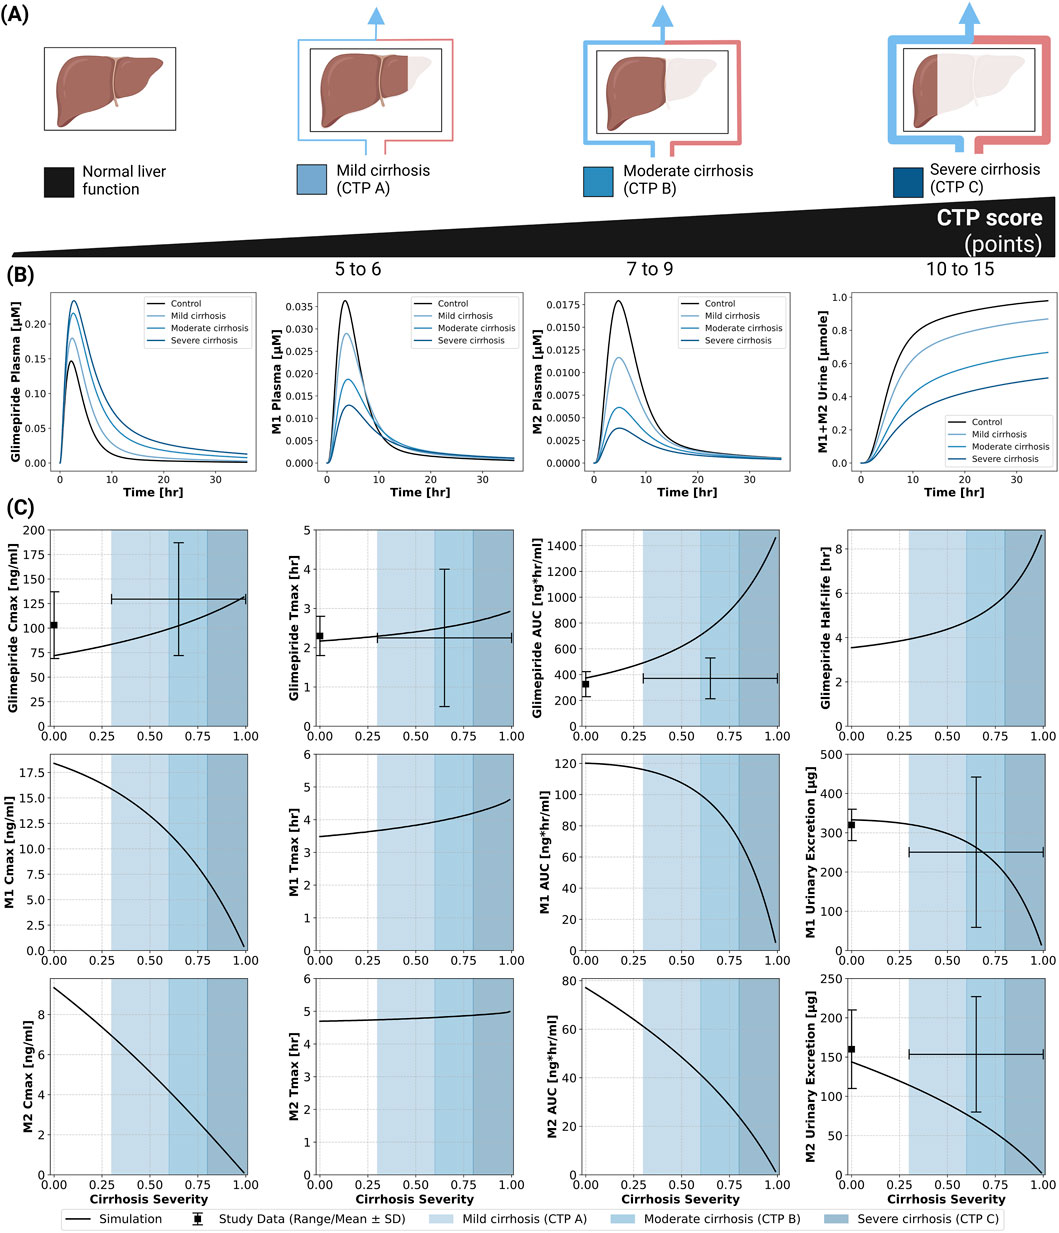
Figure 4. Impact of hepatic function (cirrhosis) on the pharmacokinetics of glimepiride and its metabolites. (A) Classification of liver function based on the Child-Turcotte-Pugh (CTP) score, illustrating normal function, mild cirrhosis (CTP A), moderate cirrhosis (CTP B), and severe cirrhosis (CTP C). (B) Simulated plasma concentration-time profiles for glimepiride, M1, and M2, and cumulative M1+M2 urinary excretion, following a 1 mg oral dose in subjects with varying degrees of cirrhosis severity (control, mild, moderate, severe). (C) Relationship between cirrhosis severity and key pharmacokinetic parameters for glimepiride, M1, and M2, following a 1 mg oral dose. Simulation results (solid lines) are compared with observed clinical data (symbols with error bars where available, representing range/mean
2.6 Bodyweight dependency
An inverse relationship between bodyweight and systemic exposure was confirmed through simulations across a wide weight range (40–170 kg) and compared against clinical studies (Figure 5). Glimepiride Cmax decreased from 1,000 ng/mL at 40 kg to 300 ng/mL at 170 kg, while AUC declined from 6,000 to approximately 2,000 ng*hr/mL. Despite these exposure changes, Tmax and half-life remained stable across the weight range. Model predictions accurately captured observed differences between normal-weight and morbidly obese patients in (Shukla et al., 2004), with peak concentrations of 1.4
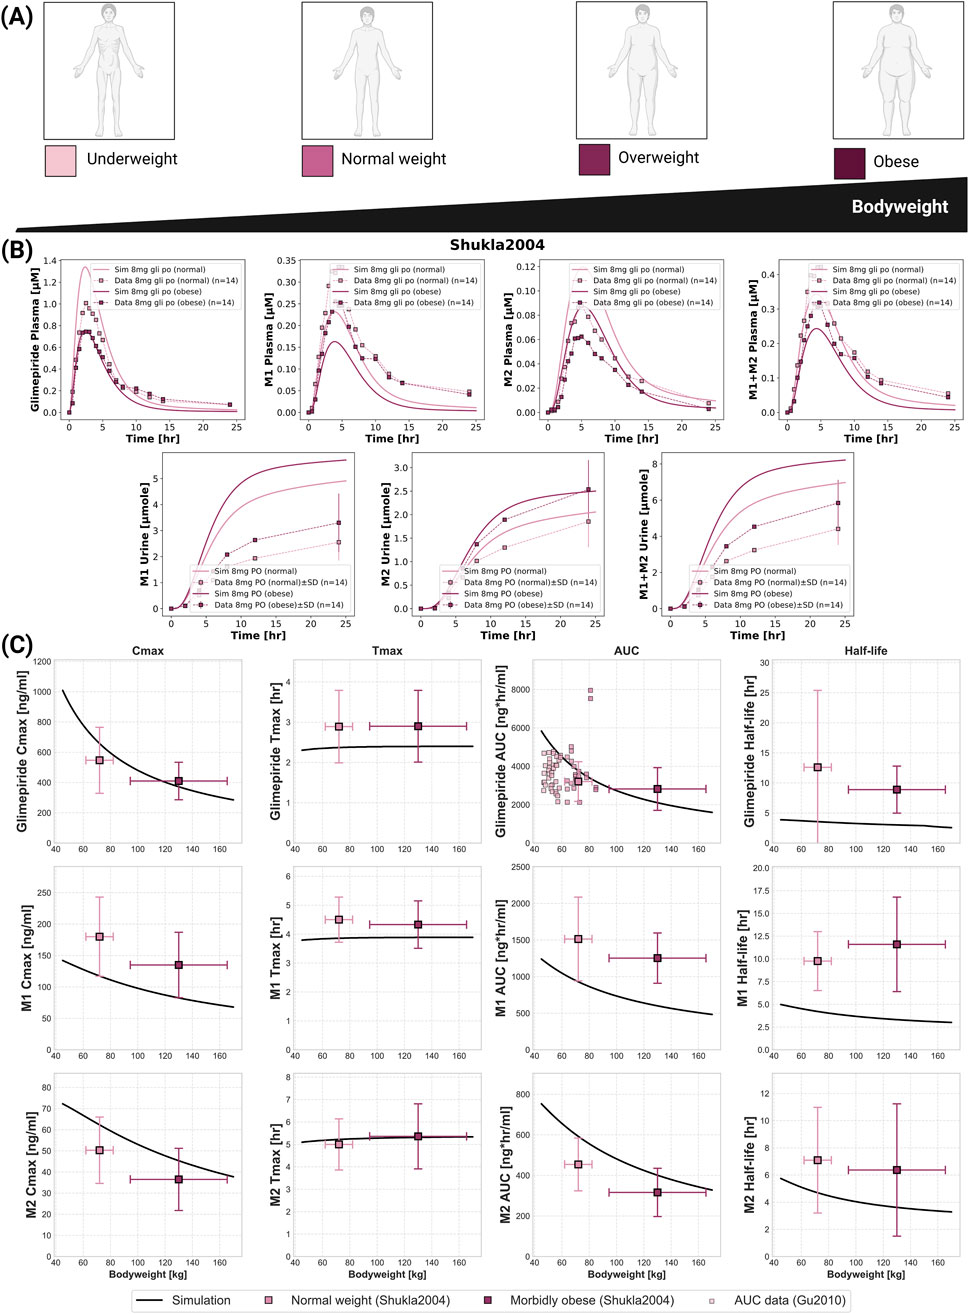
Figure 5. Impact of bodyweight on the pharmacokinetics of glimepiride and its metabolites. (A) Illustration of bodyweight categories: underweight, normal weight, overweight, and obese. (B) Simulated (solid lines) versus observed (squares connected by dashed lines) plasma concentration-time profiles and cumulative urinary excretion for glimepiride, M1, and M2, following an 8 mg oral dose in normal weight and morbidly obese individuals. Observed data from (Shukla et al., 2004). (C) Relationship between bodyweight and key pharmacokinetic parameters for glimepiride, M1, and M2, following a 8 mg oral dose. Simulation results (solid lines) are compared with observed clinical data (mean
2.7 CYP2C9 polymorphisms
CYP2C9 genetic polymorphisms showed the most pronounced impact on individual pharmacokinetics (Figure 6). The model incorporated allele-specific enzyme activities (*1 = 100%, *2 = 68%, *3 = 23%), resulting in diplotype activities of 100% (*1/*1), 84% (*1/*2), 62% (*1/*3), and 23% (*3/*3). Supplementary Table S2 contains all CYP2C9 allele activities derived from literature. Simulations accurately captured substantially increased glimepiride exposure in carriers of reduced-function alleles with *3/*3 homozygotes showing up to 2.5-fold higher AUC compared to wild-type carriers. Metabolites displayed inverse patterns, with reduced formation and excretion in poor metabolizers. Model predictions demonstrated good agreement across five clinical studies (Lee et al., 2012; Yoo et al., 2011; Niemi et al., 2002; Suzuki et al., 2006; Wang et al., 2005) with doses ranging from 0.5 to 4 mg. See Supplementary Figure S8 for additional CYP2C9 polymorphism simulations. A probabilistic modeling approach incorporating lognormal distributions of enzyme activity within genotypes captured inter-individual variability more realistically than fixed scaling factors. Supplementary Tables S3,S4 summarize the intrinsic clearance data and the fitted lognormal distribution used in the probabilistic modeling approach. This approach successfully reproduced the observed variability in pharmacokinetic parameters across genotypes. Supplementary Table S5–8 summarize the probabilistically sampled CYP2C9 allele activities, and genotype-specific glimepiride, M1 and M2 pharmacokinetics.
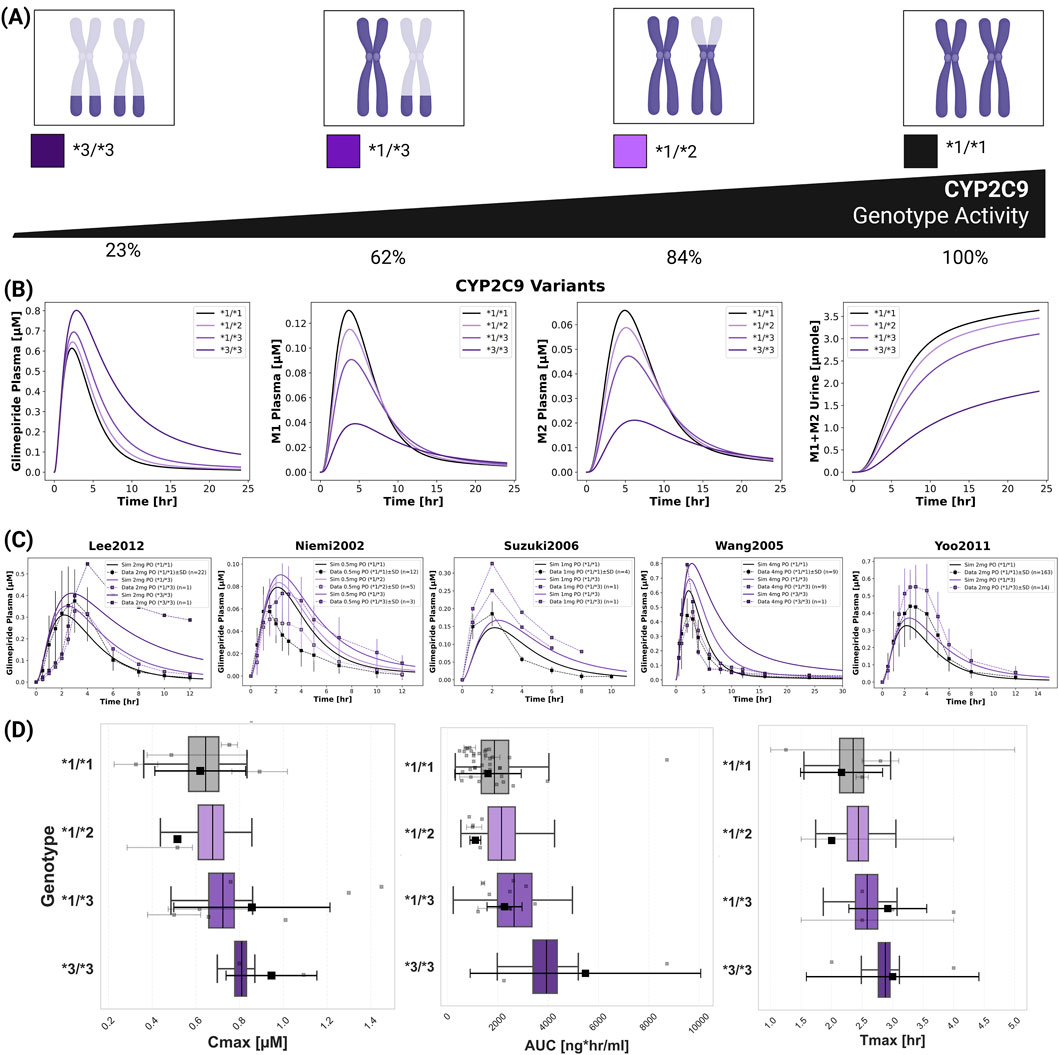
Figure 6. Impact of CYP2C9 genetic variants on glimepiride pharmacokinetics. (A) Illustration of key CYP2C9 genotypes (*1/*1, *1/*2, *1/*3, *3/*3) and their corresponding enzymatic activities. (B) Simulated pharmacokinetic profiles of glimepiride, M1, M2, and cumulative M1+M2 urinary excretion, following a 4 mg oral dose, based on fixed enzyme activity values for different CYP2C9 genotypes. (C) Comparison of simulated (solid lines, using fixed CYP2C9 activity values) versus observed (symbols connected by dashed lines) glimepiride plasma concentrations in individuals with different CYP2C9 genotypes across five clinical studies (Lee et al., 2012; Niemi et al., 2002; Suzuki et al., 2006; Wang et al., 2005 and Yoo et al., 2011). (D) Boxplots comparing simulated glimepiride pharmacokinetic parameters derived from the probabilistic sampling approach (colored boxplots) with observed clinical data (grey squares: individual data points; black squares: weighted arithmetic mean) across different CYP2C9 genotypes. Simulations correspond to a 4 mg oral dose. Observed data was aggregated from the clinical studies cited and dose-scaled to 4 mg where necessary.
2.8 Populations
Population-level simulations incorporating known genotype frequencies across biogeographical groups revealed modest differences in average CYP2C9 activity and pharmacokinetic parameters between populations, despite varying genotype frequencies (Figure 7). The *2 allele showed highest frequencies in European (12.7%) and Central/South Asian (11.4%) populations, while the *3 allele was most prevalent in Central/South Asians (11.0%). Mean CYP2C9 activity ranged from 0.88 in Central/South Asian to 0.98 in Oceanian populations. Despite these differences in genetic makeup, ridgeline plots of AUC distributions showed substantial overlap across all populations. While Kolmogorov-Smirnov testing identified statistically significant differences between certain population pairs (e.g., Central/South Asian and Oceanian, Near Eastern and Oceanian, European and Oceanian; all p
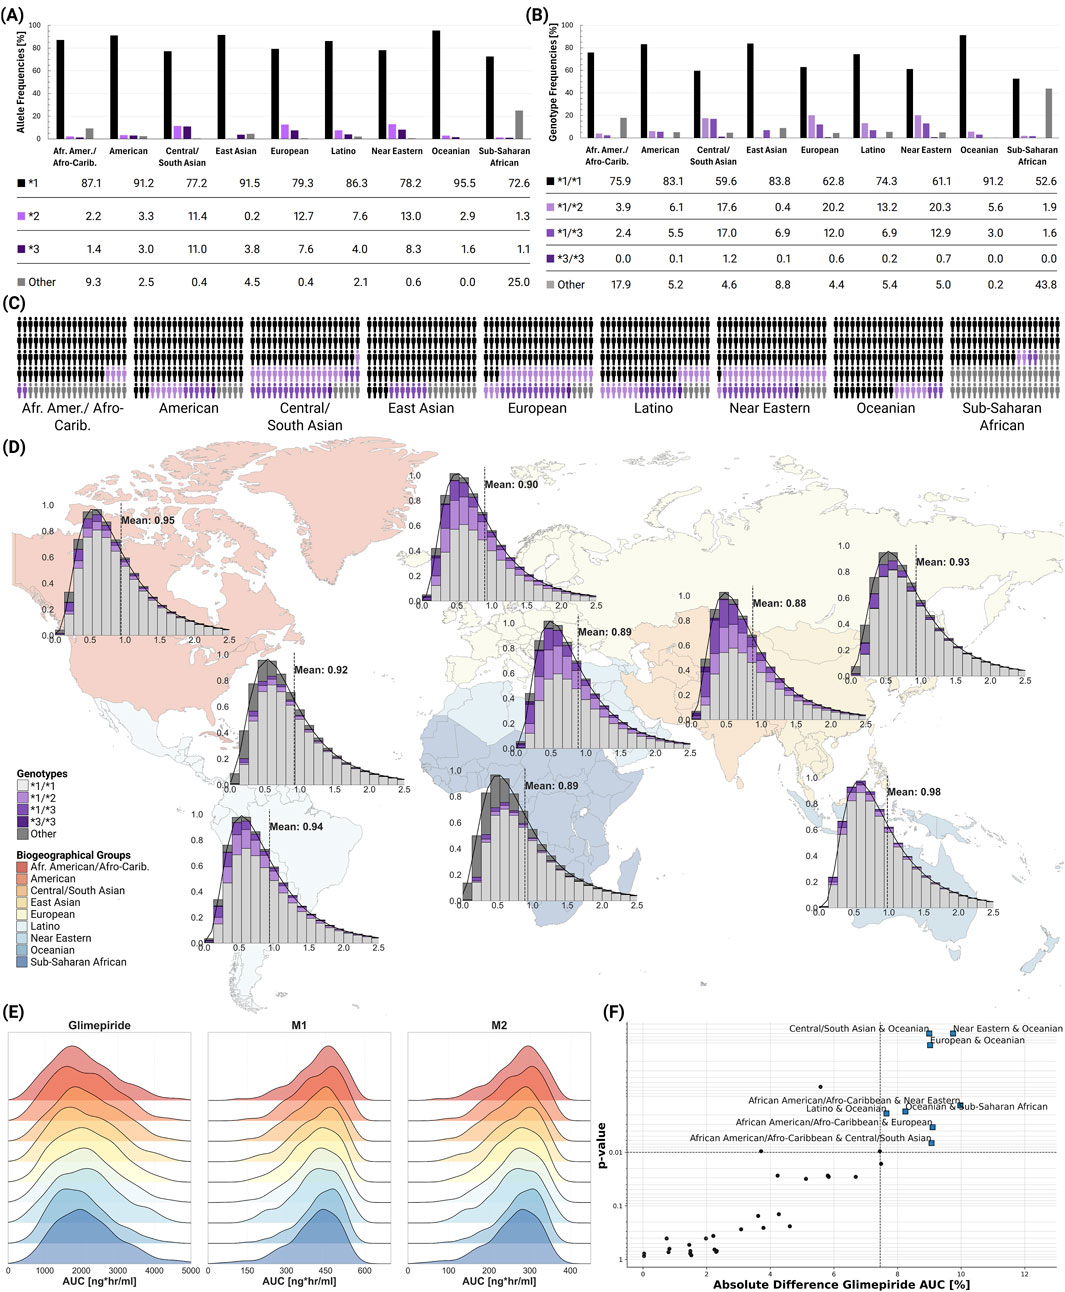
Figure 7. Global CYP2C9 genetic variability and population-level impact on glimepiride pharmacokinetics. (A) CYP2C9 allele frequencies across biogeographical groups (ClinPGx, 2025), showing the distribution of key alleles. (B) CYP2C9 genotype frequencies across biogeographical groups (ClinPGx, 2025), showing the distribution of key genotypes. (C) Individual genetic variability representation within each biogeographical group. (D) World map displaying population-specific CYP2C9 activity distributions derived from allele frequencies, with kernel density estimation (KDE) curves and mean enzymatic activity values shown for each biogeographical group. (E) Ridgeline plots comparing glimepiride, M1, and M2 AUC distributions across biogeographical populations. (F) Statistical comparison of population pairs showing the relationship between significance and magnitude of pharmacokinetic differences, with some comparisons showing statistically significant but clinically modest differences in glimepiride AUC.
2.9 Web application
The web application of the digital twin enables real-time simulation and visualization of plasma concentration-time profiles for glimepiride and its metabolites (M1, M2) based on individual patient characteristics (Figure 8). Users can simulate personalized pharmacokinetic profiles by adjusting clinically relevant parameters and accessing calculated values for Cmax, Tmax, AUC, and half-life. Freely accessible at https://glimepiride.de, the tool supports interactive exploration of model-informed variability in drug exposure.
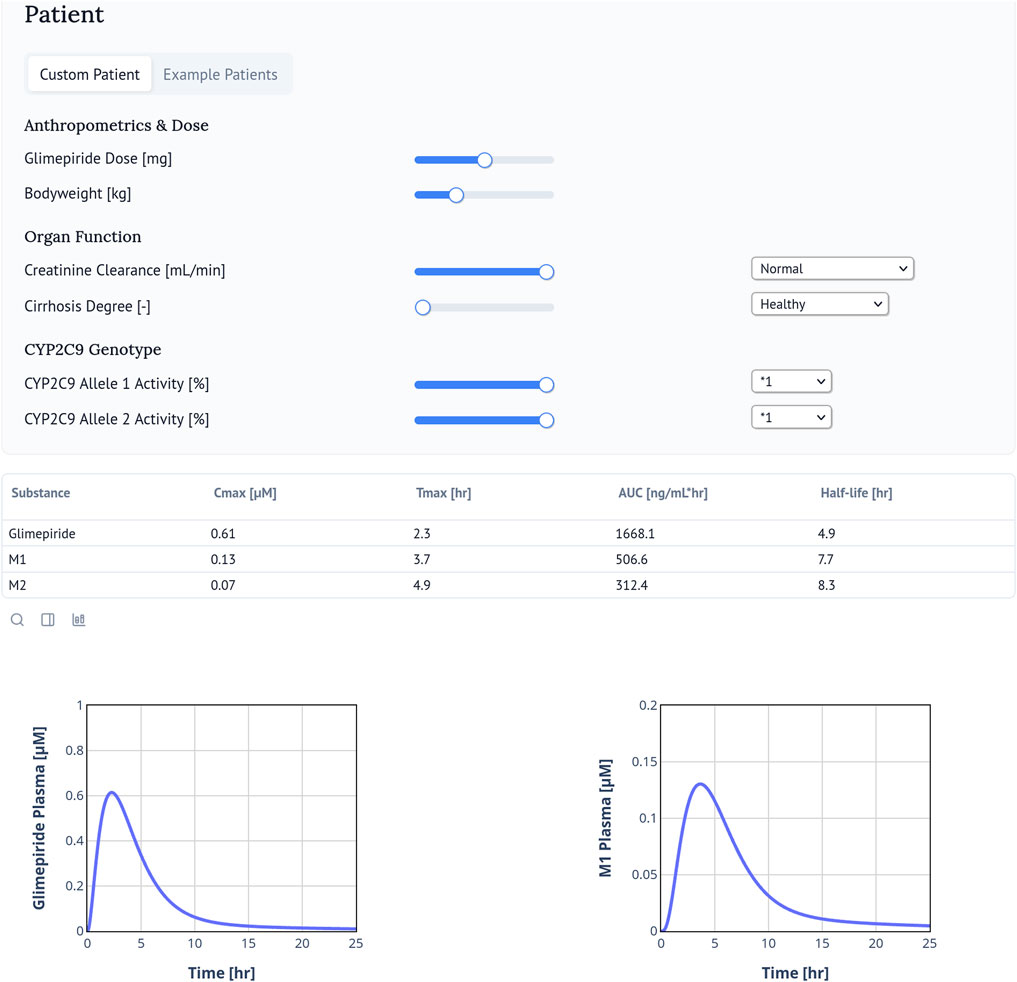
Figure 8. Glimepiride Web Application. The glimepiride digital twin web application simulates the pharmacokinetics of glimepiride using the PBPK model. Users can input patient-specific parameters such as bodyweight, renal or hepatic impairment, and CYP2C9 genotype. The web application visualizes individual drug time-course profiles and calculates and displays key pharmacokinetic parameters including
3 Discussion
In this study, we developed a whole-body PBPK model as a digital twin for glimepiride, integrating key patient-specific factors like organ function, bodyweight, and CYP2C9 genetics. The model accurately reproduced glimepiride pharmacokinetics across diverse clinical scenarios, providing a quantitative framework to explore the drivers of variability and support personalized dosing strategies for type 2 diabetes.
The digital twin quantifies the influence of various patient factors, enabling patient stratification. It provides a quantitative platform that guides the personalization of glimepiride therapy and supports clinical decisions on initial dosing to ensure patient safety. A key strength of this PBPK approach is its ability to integrate multiple patient factors simultaneously. Unlike traditional studies that often isolate single variables, our integrated model more accurately reflects the complex clinical reality where patients present with multiple conditions affecting drug disposition. This framework is especially valuable for evaluating pharmacokinetic risks in underrepresented populations or complex scenarios where clinical evidence is lacking, providing a robust platform to support dosing decisions.
While our model confirms that glimepiride exposure is unaffected by renal impairment, it highlights the clinical significance of metabolite accumulation. The progressive buildup of the active M1 metabolite, which retains approximately 30% of the parent compound’s hypoglycemic activity, suggests a risk of prolonged adverse effects in patients with severe renal dysfunction. Rosenkranz et al. (1996) reported an apparent increase in glimepiride clearance with declining renal function, which may be explained by reduced albumin binding in chronic kidney disease. Lower albumin levels, structural modifications, and competing uremic toxins could increase the unbound drug fraction available for hepatic metabolism (Reidenberg and Drayer, 1984; Gibaldi, 1977; Gibson, 1986). Our model does not yet account for these protein binding changes, representing an area for future refinement. Therefore, although glimepiride dose adjustments may not be required, enhanced glycemic monitoring is warranted in this population. The model’s characterization of metabolite disposition was constrained by limited public data on elimination pathways and the specific enzymes responsible for M1-to-M2 conversion, with the M2 hepatic export parameter reaching its optimization boundary, yet provided physiologically reasonable predictions across diverse renal function states.
In contrast to renal function, hepatic impairment substantially increased glimepiride exposure by hindering its CYP2C9-mediated metabolism, with a progressive increase in plasma concentrations corresponding to worsening cirrhosis severity. This was accompanied by reduced metabolite formation, an inverse relationship that directly reflects impaired hepatic drug metabolism. Standard doses in patients with moderate to severe cirrhosis could lead to a significant risk of hypoglycemia. Current clinical guidelines are qualitative, only advising caution. Our digital twin provides a quantitative tool that addresses this issue by enabling in silico evaluation of dose adjustments needed to maintain safety in this vulnerable population.
The model demonstrated an inverse relationship between bodyweight and glimepiride exposure, with both Cmax and AUC decreasing with increasing bodyweight while elimination kinetics remained constant. This suggests bodyweight predominantly influences volume of distribution rather than clearance, aligning with clinical observations in obese patients. This understanding supports the current clinical practice, where this level of variability is effectively managed by titrating the dose according to a patient’s glycemic response, rather than adhering to weight-based protocols.
CYP2C9 genetic polymorphism substantially influences glimepiride exposure, with carriers of the *3/*3 genotype exhibiting approximately two-fold higher AUC compared to wild-type individuals. Despite lacking glimepiride-specific enzyme kinetic data, the model successfully leveraged CYP2C9 clearance data from related substrates to predict genotype effects, demonstrating a key strength of mechanistic PBPK approaches. Those with reduced-function alleles are at a higher risk of experiencing adverse events from a standard dose. However, our analysis shows substantial pharmacokinetic variability even within the same genotype group, with considerable overlap between different genotypes. This indicates that genotype alone is not a good predictor of patient response. Furthermore, although genotype effects were evident at the individual level, the model predicted only modest differences in pharmacokinetics across biogeographical populations. Therefore, ethnicity alone provides limited value for guiding dosing decisions. A targeted genotyping strategy focusing on patients with poor glycemic control or adverse effects may be more cost-effective than universal screening.
This digital twin of glimepiride successfully quantifies the impact of genetics, organ function, and physiology on pharmacokinetic variability and lays the basis for future clinical decision support tools that can guide personalized initial dosing, especially for patients with high-risk profiles. To facilitate clinical translation and educational use, we deployed the model as an interactive web application that enables real-time simulation of patient-specific pharmacokinetic profiles. This tool allows clinicians and researchers to explore how different patient characteristics influence drug exposure, providing immediate visual feedback for various clinical scenarios. While the specific parameters and pathways are unique to glimepiride, the modeling framework and approach demonstrated here could inform the development of similar digital twins for other medications where inter-patient variability poses clinical challenges, particularly other sulfonylureas that share CYP2C9-mediated metabolism and similar organ function dependencies. Future work should focus on refining the model using larger population studies and expanding its application to include pharmacodynamics between drug exposure and glycemic response. However, this requires dedicated clinical studies that simultaneously capture detailed PK profiles and glycemic outcomes–data that are currently limited in the literature. Another potential refinement would be to incorporate sex-specific physiological differences. Currently, our mean model does not differentiate between sex because most glimepiride clinical pharmacokinetics studies were conducted in male or mixed cohorts without reporting sex-stratified results. Although the FDA label (U.S. Food and Drug Administration (FDA), 1995) reports no sex-related differences in glimepiride pharmacokinetics after adjusting for bodyweight, more balanced datasets would allow future modeling efforts to address potential sex-related effects. As precision medicine advances, such digital twin approaches have clear potential to become valuable tools for optimizing drug therapy in complex diseases like type 2 diabetes.
4 Methods
4.1 Systematic literature research and data curation
A systematic literature search was conducted for studies reporting glimepiride pharmacokinetic data. PubMed was searched using the keywords glimepiride AND pharmacokinetics, and the PKPDAI database (Gonzalez Hernandez et al., 2021) was queried on 2024–08–30. Inclusion criteria focused on clinical trials involving healthy volunteers or patients with T2DM, and studies investigating the effects of renal impairment, hepatic impairment, bodyweight variations, or CYP2C9 genotypes on glimepiride pharmacokinetics. Studies involving pediatric populations, non-human subjects, or with insufficiently reported pharmacokinetic data were excluded. The systematic review also included in vitro studies providing kinetic parameters (particularly CYP2C9 activity) required for PBPK model development. The literature review process yielded 20 clinical studies for analysis.
Data from these selected studies were systematically curated and uploaded to the open pharmacokinetics database PK-DB (Grzegorzewski et al., 2021). Patient-specific information (e.g., age, sex, comorbidities, dosing regimens, pharmacokinetic profiles) was extracted following established curation protocols (Grzegorzewski et al., 2021). Figure-based pharmacokinetic data were digitized using WebPlotDigitizer (Rohatgi, 2024), while tabular and textual data were reformatted according to standardized guidelines (Grzegorzewski et al., 2021). Curated data encompassed cohort characteristics, individual-level data, intervention details, time-course concentration profiles of glimepiride and its metabolites, and reported pharmacokinetic/pharmacodynamic parameters. This dataset formed the basis for PBPK model development, calibration, and validation, and is publicly accessible via PK-DB to ensure transparency and reproducibility.
4.2 Computational model
The PBPK model and tissue-specific submodels were developed using the Systems Biology Markup Language (SBML) (Hucka et al., 2019; Keating et al., 2020). Programming and visualization of the models were performed using the sbmlutils (König, 2024) and cy3sbml (König et al., 2012) libraries. Numerical solutions for the ordinary differential equations (ODEs) underlying the model were computed using sbmlsim (König, 2021), powered by the high-performance SBML simulation engine libRoadRunner (Welsh et al., 2023; Somogyi et al., 2015).
The developed model comprises a whole-body framework with submodels for the intestine, liver, and kidney to characterize glimepiride’s ADME processes. Key processes include oral dissolution and first-order absorption in the intestine, CYP2C9-mediated hepatic metabolism of glimepiride to M1 followed by further metabolism to M2, and renal excretion of M1 and M2. The mathematical descriptions and ODEs for all submodels are provided in Supplementary Equations S1.1–S1.3. The model and all associated materials (simulation scripts, parameters, and documentation) are publicly available in SBML format under a CC-BY 4.0 license at https://github.com/matthiaskoenig/glimepiride-model, version 0.6.1 (Elias and König, 2025a).
The model was designed to incorporate several key factors influencing inter-individual pharmacokinetic variability. Renal impairment was addressed using the parameter frenal_function (1.0 for normal function), with scaling factors for mild (0.69), moderate (0.32), and severe (0.19) impairment derived from KDIGO guidelines (Stevens et al., 2024) and the approach of (Mallol et al., 2023). This parameter directly scales M1 and M2 metabolite renal excretion rates. Hepatic impairment was implemented via the fcirrhosis parameter (ranging from 0.0 for normal function to 1.0 for severe impairment), with values mapped to the Child-Turcotte-Pugh (CTP) classification (Child and Turcotte, 1964; Infante-Rivard et al., 1987; Köller et al., 2021). This parameter modifies the fraction of functional liver parenchyma and the extent of blood shunting around the liver. Tissue distribution of glimepiride and its metabolites was described via the parameters ftissuegli (rate of tissue distribution) and Kpgli (tissue-plasma partition coefficient), assuming similar distribution properties for the parent drug and metabolites to reduce model complexity. Bodyweight effects were incorporated by scaling organ volumes, blood flows, and metabolic rates according to allometric relationships. CYP2C9 genetic variability was modeled based on allele-specific scaling factors for the common alleles *1 (wild-type, activity 1.0), *2 (activity 0.68), and *3 (activity 0.23), derived from in vitro data (Yang et al., 2018; Maekawa et al., 2009; Dai et al., 2014). Genotype-specific activities were calculated as the mean of the two constituent allele activities. These genetic factors were implemented via the parameter fcyp2c9, which modulates the maximal velocity
4.3 Model parameterization
Key model parameters related to glimepiride’s absorption, distribution, metabolism, and excretion were optimized by minimizing a weighted sum of squared residuals between model predictions and a curated dataset from clinical studies in healthy, fasted subjects. This optimization utilized multiple (n = 100) runs of a local optimization algorithm. The cost function incorporated weights accounting for study size and measurement variance, ensuring larger studies and more precise measurements had appropriate influence on the optimization. The model was optimized using a subset of the curated clinical data (healthy and fasted), achieving successful convergence and demonstrating good predictive performance across the datasets (see Supplementary Figure S2). The optimized model successfully captured glimepiride pharmacokinetics with satisfactory goodness-of-fit, though some inter-study variability was observed, likely reflecting differences in study design and population characteristics. Final optimized parameters are provided in the Supplementary Table S1. The final parameter set (Supplementary Table S1) was used consistently across all simulations in this study without refitting for each study. Following parameterization, the model’s predictive performance was evaluated across diverse physiological and pathological conditions.
4.4 Pharmacokinetic parameters
Standard pharmacokinetic parameters (Cmax, Tmax, AUC, half-life, Cl/F) were calculated from simulated and observed concentration-time profiles using non-compartmental analysis with trapezoidal integration and terminal phase extrapolation. Simulated profiles and derived PK parameters were then compared against the curated experimental data from all 20 clinical studies.
4.5 Web application development
To enable real-time simulations, we deployed the glimepiride digital twin as a web application using the Marimo framework. The interface allows users to adjust clinically relevant parameters such as dose, bodyweight, renal and hepatic function, and CYP2C9 genotype, which are incorporated into the model through the corresponding scaling factors (frenal_function, fcirrhosis, fcyp2c9). Pharmacokinetic parameters (Cmax, Tmax, AUC, half-life) are calculated and displayed alongside the concentration–time profiles. The interface is designed for intuitive use with immediate visual feedback and includes pre-configured example patients for demonstration purposes. The web application is available at https://glimepiride.de, with the code available at https://github.com/matthiaskoenig/glimepiride-app.
Data availability statement
The datasets presented in this study can be found in online repositories. The names of the repository/repositories and accession number(s) can be found below: All curated pharmacokinetic data are publicly available in the PK-DB database (https://pk-db.com) with unique study identifiers.
Author contributions
ME: Conceptualization, Data curation, Formal Analysis, Investigation, Methodology, Resources, Software, Validation, Visualization, Writing – review and editing, Writing – original draft. MK: Conceptualization, Data curation, Formal Analysis, Investigation, Methodology, Resources, Software, Validation, Visualization, Writing – review and editing, Funding acquisition, Project administration, Supervision.
Funding
The author(s) declare that financial support was received for the research and/or publication of this article. Matthias König (MK) was supported by the Federal Ministry of Education and Research (BMBF, Germany) within ATLAS by grant number 031L0304B and by the German Research Foundation (DFG) within the Research Unit Program FOR 5151 “QuaLiPerF (Quantifying Liver Perfusion-Function Relationship in Complex Resection - A Systems Medicine Approach)” by grant number 436883643 and by grant number 465194077 (Priority Programme SPP 2311, Subproject SimLivA). This work was supported by the BMBF-funded de.NBI Cloud within the German Network for Bioinformatics Infrastructure (de.NBI) (031A537B, 031A533A, 031A538A, 031A533B, 031A535A, 031A537C, 031A534A, 031A532B).
Acknowledgments
Figures were created in BioRender. König, (2024) https://BioRender.com/l01pcwd. The world map was created with https://www.mapchart.net/.
Conflict of interest
The authors declare that the research was conducted in the absence of any commercial or financial relationships that could be construed as a potential conflict of interest.
Generative AI statement
The author(s) declare that no Generative AI was used in the creation of this manuscript.
Any alternative text (alt text) provided alongside figures in this article has been generated by Frontiers with the support of artificial intelligence and reasonable efforts have been made to ensure accuracy, including review by the authors wherever possible. If you identify any issues, please contact us.
Publisher’s note
All claims expressed in this article are solely those of the authors and do not necessarily represent those of their affiliated organizations, or those of the publisher, the editors and the reviewers. Any product that may be evaluated in this article, or claim that may be made by its manufacturer, is not guaranteed or endorsed by the publisher.
Supplementary material
The Supplementary Material for this article can be found online at: https://www.frontiersin.org/articles/10.3389/fphar.2025.1686415/full#supplementary-material
References
Ahmed, T. A., El-Say, K. M., Aljaeid, B. M., Fahmy, U. A., and Abd-Allah, F. I. (2016). Transdermal glimepiride delivery system based on optimized ethosomal nano-vesicles: preparation, characterization, in vitro, ex vivo and clinical evaluation. Int. J. Pharm. 500, 245–254. doi:10.1016/j.ijpharm.2016.01.017
American Diabetes Association Professional Practice Committee (2024). Diagnosis and classification of diabetes: Standards of Care in diabetes—2024. Diabetes Care 47 (Suppl. 1), S20–S42. doi:10.2337/dc24-S002
Ashcroft, F. (1996). Mechanisms of the glycaemic effects of sulfonylureas. Hormone Metabolic Res. 28, 456–463. doi:10.1055/s-2007-979837
Badian, M., Korn, A., Lehr, K. H., Malerczyk, V., and Waldhäusl, W. (1994). Absolute bioavailability of glimepiride (Amaryl) after oral administration. Drug metabolism drug Interact. 11, 331–339. doi:10.1515/dmdi.1994.11.4.331
Badian, M., Korn, A., Lehr, K. H., Malerczyk, V., and Waldhäusl, W. (1996). Pharmacokinetics and pharmacodynamics of the hydroxymetabolite of glimepiride (Amaryl) after intravenous administration. Drug metabolism drug Interact. 13, 69–85. doi:10.1515/dmdi.1996.13.1.69
Berton, M., Bettonte, S., Stader, F., Battegay, M., and Marzolini, C. (2023). Physiologically based pharmacokinetic modelling to identify physiological and drug parameters driving pharmacokinetics in obese individuals. Clin. Pharmacokinet. 62, 277–295. doi:10.1007/s40262-022-01194-3
Child, C. G., and Turcotte, J. G. (1964). Surgery and portal hypertension. Major Problems Clin. Surg. 1, 1–85.
Choi, H. Y., Kim, Y. H., Kim, M. J., Lee, S. H., Bang, K., Han, S., et al. (2014). Evaluation of pharmacokinetic drug interactions between gemigliptin (dipeptidylpeptidase-4 inhibitor) and glimepiride (sulfonylurea) in healthy volunteers. Drugs R&D 14, 165–176. doi:10.1007/s40268-014-0054-8
ClinPGx (2025). Gene-specific information Tables for CYP2C9. Available online at: https://www.clinpgx.org/page/cyp2c9RefMaterials (2001-2025).
Dai, D. P., Wang, S. H., Geng, P. W., Hu, G. X., and Cai, J. P. (2014). In vitro assessment of 36 CYP2C9 allelic Isoforms found in the Chinese population on the metabolism of glimepiride. Basic and Clin. Pharmacol. and Toxicol. 114, 305–310. doi:10.1111/bcpt.12159
Douros, A., Yin, H., Yu, O. H. Y., Filion, K. B., Azoulay, L., and Suissa, S. (2017). Pharmacologic differences of sulfonylureas and the risk of adverse cardiovascular and hypoglycemic events. Diabetes Care 40, 1506–1513. doi:10.2337/dc17-0595
Elias, M., and König, M. (2025a). Physiologically based pharmacokinetic (PBPK) model of glimepiride. Geneva, Switzerland: Zenodo. doi:10.5281/zenodo.15189579
Elias, M., and König, M. (2025b). Reproducibility of a digital twin of glimepiride for personalized and stratified diabetes treatment. Physiome. doi:10.36903/physiome.28379193
Gibaldi, M. (1977). Drug distribution in renal failure. Am. J. Med. 62, 471–474. doi:10.1016/0002-9343(77)90399-0
Gibson, T. P. (1986). Renal disease and drug metabolism: an overview. Am. J. Kidney Dis. 8, 7–17. doi:10.1016/S0272-6386(86)80148-2
Gonzalez Hernandez, F., Carter, S. J., Iso-Sipilä, J., Goldsmith, P., Almousa, A. A., Gastine, S., et al. (2021). An automated approach to identify scientific publications reporting pharmacokinetic parameters. Wellcome Open Res. 6, 88. doi:10.12688/wellcomeopenres.16718.1
Grzegorzewski, J., Brandhorst, J., Green, K., Eleftheriadou, D., Duport, Y., Barthorscht, F., et al. (2021). PK-DB: pharmacokinetics database for individualized and stratified computational modeling. Nucleic Acids Res. 49, D1358–D1364. doi:10.1093/nar/gkaa990
Gu, N., Kim, B. H., Rhim, H., Chung, J. Y., Kim, J. R., Shin, H. S., et al. (2010). Comparison of the bioavailability and tolerability of fixed-dose combination glimepiride/metformin 2/500-mg tablets versus separate tablets: a single-dose, randomized-sequence, open-label, two-period crossover study in healthy Korean volunteers. Clin. Ther. 32, 1408–1418. doi:10.1016/j.clinthera.2010.07.012
Hartmanshenn, C., Scherholz, M., and Androulakis, I. P. (2016). Physiologically-based pharmacokinetic models: approaches for enabling personalized medicine. J. Pharmacokinet. Pharmacodynamics 43, 481–504. doi:10.1007/s10928-016-9492-y
Helmy, S. A., El Bedaiwy, H. M., and Mansour, N. O. (2013). Dose linearity of glimepiride in healthy human Egyptian volunteers. Clin. Pharmacol. drug Dev. 2, 264–269. doi:10.1002/cpdd.20
Hucka, M., Bergmann, F. T., Chaouiya, C., Dräger, A., Hoops, S., Keating, S. M., et al. (2019). The systems Biology Markup Language (SBML): language specification for level 3 version 2 core release 2. J. Integr. Bioinforma. 16, 20190021. doi:10.1515/jib-2019-0021
Infante-Rivard, C., Esnaola, S., and Villeneuve, J. P. (1987). Clinical and statistical validity of conventional prognostic factors in predicting short-term survival among cirrhotics. Hepatology 7, 660–664. doi:10.1002/hep.1840070408
Institute for Health Metrics and Evaluation (IHME) (2024). “Global burden of disease 2021: findings from the GBD 2021 study,”. Seattle, WA: Institute for Health Metrics and Evaluation.
Kasichayanula, S., Liu, X., Shyu, W. C., Zhang, W., Pfister, M., Griffen, S. C., et al. (2011). Lack of pharmacokinetic interaction between dapagliflozin, a novel sodium-glucose transporter 2 inhibitor, and metformin, pioglitazone, glimepiride or sitagliptin in healthy subjects. Diabetes, Obes. and Metabolism 13, 47–54. doi:10.1111/j.1463-1326.2010.01314.x
Keating, S. M., Waltemath, D., König, M., Zhang, F., Dräger, A., Chaouiya, C., et al. (2020). SBML Level 3: an extensible format for the exchange and reuse of biological models. Mol. Syst. Biol. 16, e9110. doi:10.15252/msb.20199110
Khalil, F., and Läer, S. (2011). Physiologically based pharmacokinetic modeling: methodology, applications, and limitations with a focus on its role in pediatric drug development. BioMed. Res. Int. 2011, 907461. doi:10.1155/2011/907461
Kim, C. O., Oh, E. S., Kim, H., and Park, M. S. (2017). Pharmacokinetic interactions between glimepiride and rosuvastatin in healthy Korean subjects: does the SLCO1B1 or CYP2C9 genetic polymorphism affect these drug interactions? Drug Des. Dev. Ther. 11, 503–512. doi:10.2147/DDDT.S129586
Köller, A., Grzegorzewski, J., Tautenhahn, H. M., and König, M. (2021). Prediction of survival after partial hepatectomy using a physiologically based pharmacokinetic model of indocyanine green liver function tests. Front. Physiology 12, 730418. doi:10.3389/fphys.2021.730418
König, M. (2024). Sbmlutils: Python utilities for SBML. Geneva, Switzerland: Zenodo. doi:10.5281/zenodo.13325770
König, M., Dräger, A., and Holzhütter, H. G. (2012). CySBML: a Cytoscape plugin for SBML. Bioinformatics 28, 2402–2403. doi:10.1093/bioinformatics/bts432
Langtry, H. D., and Glimepiride, B. J. A. (1998). A review of its use in the management of type 2 diabetes mellitus. Drugs 55, 563–584. doi:10.2165/00003495-199855040-00007
Lee, H. W., Lim, Ms, Lee, J., Jegal, M. Y., Kim, D. W., Lee, W. K., et al. (2012). Frequency of CYP2C9 variant alleles, including CYP2C9*13 in a Korean population and effect on glimepiride pharmacokinetics. J. Clin. Pharm. Ther. 37, 105–111. doi:10.1111/j.1365-2710.2010.01238.x
Lehr, K. H., and Damm, P. (1990). Simultaneous determination of the sulphonylurea glimepiride and its metabolites in human serum and urine by high-performance liquid chromatography after pre-column derivatization. J. Chromatogr. 526, 497–505. doi:10.1016/s0378-4347(00)82531-1
Li, J., Guo, H. F., Liu, C., Zhong, Z., Liu, L., and Liu, X. D. (2015). Prediction of drug disposition in diabetic patients by means of a physiologically based pharmacokinetic model. Clin. Pharmacokinet. 54, 179–193. doi:10.1007/s40262-014-0192-8
Liu, Y., Zhang, Mq, Zhu, Jm, Jia, Jy, Liu, Ym, Liu, Gy, et al. (2010). Bioequivalence and pharmacokinetic evaluation of two formulations of glimepiride 2 mg: a single-dose, randomized-sequence, open-label, two-way crossover study in healthy Chinese male volunteers. Clin. Ther. 32, 986–995. doi:10.1016/j.clinthera.2010.04.016
Maekawa, K., Harakawa, N., Sugiyama, E., Tohkin, M., Kim, S. R., Kaniwa, N., et al. (2009). Substrate-dependent functional alterations of seven CYP2C9 variants found in Japanese subjects. Drug Metabolism Dispos. Biol. Fate Chem. 37, 1895–1903. doi:10.1124/dmd.109.027003
Malerczyk, V., Badian, M., Korn, A., Lehr, K. H., and Waldhäusl, W. (1994). Dose linearity assessment of glimepiride (Amaryl) tablets in healthy volunteers. Drug metabolism drug Interact. 11, 341–357. doi:10.1515/dmdi.1994.11.4.341
Mallol, B. S., Grzegorzewski, J., Tautenhahn, H. M., and König, M. (2023). Insights into intestinal P-glycoprotein function using talinolol: a PBPK modeling approach. doi:10.1101/2023.11.21.568168
Matsuki, M., Matsuda, M., Kohara, K., Shimoda, M., Kanda, Y., Tawaramoto, K., et al. (2007). Pharmacokinetics and pharmacodynamics of glimepiride in type 2 diabetic patients: compared effects of once-versus twice-daily dosing. Endocr. J. 54, 571–576. doi:10.1507/endocrj.k06-052
McCall, A. L. (2001). Clinical review of glimepiride. Expert Opin. Pharmacother. 2, 699–713. doi:10.1517/14656566.2.4.699
Niemi, M., Cascorbi, I., Timm, R., Kroemer, H. K., Neuvonen, P. J., and Kivistö, K. T. (2002). Glyburide and glimepiride pharmacokinetics in subjects with different CYP2C9 genotypes. Clin. Pharmacol. Ther. 72, 326–332. doi:10.1067/mcp.2002.127495
Ratheiser, K., Korn, A., Waldhäusl, W., Komjati, M., Vierhapper, H., Badian, M., et al. (1993). Dose relationship of stimulated insulin production following intravenous application of glimepiride in healthy man. Arzneim. 43, 856–858.
Reidenberg, M. M., and Drayer, D. E. (1984). Alteration of drug-protein binding in renal disease. Clin. Pharmacokinet. 9, 18–26. doi:10.2165/00003088-198400091-00003
Rohatgi, A. (2024). WebPlotDigitizer. Version 5.2. Available online at: https://automeris.io.
Rosenkranz, B. (1996). Pharmacokinetic basis for the safety of glimepiride in risk groups of NIDDM patients. Hormone Metabolic Res. 28, 434–439. doi:10.1055/s-2007-979833
Rosenkranz, B., Profozic, V., Metelko, Z., Mrzljak, V., Lange, C., and Malerczyk, V. (1996). Pharmacokinetics and safety of glimepiride at clinically effective doses in diabetic patients with renal impairment. Diabetologia 39, 1617–1624. doi:10.1007/s001250050624
Sager, J. E., Yu, J., Ragueneau-Majlessi, I., and Isoherranen, N. (2015). Physiologically based pharmacokinetic (PBPK) modeling and simulation approaches: a systematic review of published models, applications, and model verification. Drug Metabolism Dispos. 43, 1823–1837. doi:10.1124/dmd.115.065920
Shukla, U. A., Chi, E. M., and Lehr, K. H. (2004). Glimepiride pharmacokinetics in obese versus non-obese diabetic patients. Ann. Pharmacother. 38, 30–35. doi:10.1345/aph.1C397
Somogyi, E. T., Bouteiller, J. M., Glazier, J. A., König, M., Medley, J. K., Swat, M. H., et al. (2015). libRoadRunner: a high performance SBML simulation and analysis library. Bioinformatics 31, 3315–3321. doi:10.1093/bioinformatics/btv363
Stevens, P. E., Ahmed, S. B., Carrero, J. J., Foster, B., Francis, A., Hall, R. K., et al. (2024). KDIGO 2024 clinical practice guideline for the evaluation and management of chronic kidney disease. Kidney Int. 105, S117–S314. doi:10.1016/j.kint.2023.10.018
Suzuki, K., Yanagawa, T., Shibasaki, T., Kaniwa, N., Hasegawa, R., and Tohkin, M. (2006). Effect of CYP2C9 genetic polymorphisms on the efficacy and pharmacokinetics of glimepiride in subjects with type 2 diabetes. Diabetes Res. Clin. Pract. 72, 148–154. doi:10.1016/j.diabres.2005.09.019
US Food and Drug Administration (FDA) (1995). Glimepiride drug label – FDA approved information. Rockville, MD: U.S. Department of Health and Human Services.
Wang, R., Chen, K., Wen, S., Li, J., and Wang, S. (2005). Pharmacokinetics of glimepiride and cytochrome P450 2C9 genetic polymorphisms. Clin. Pharmacol. Ther. 78, 90–92. doi:10.1016/j.clpt.2005.03.008
Welsh, C., Xu, J., Smith, L., König, M., Choi, K., and Sauro, H. M. (2023). libRoadRunner 2.0: a high performance SBML simulation and analysis library. Bioinformatics 39, btac770. doi:10.1093/bioinformatics/btac770
Yang, J., He, M. M., Niu, W., Wrighton, S. A., Li, L., Liu, Y., et al. (2012). Metabolic capabilities of cytochrome P450 enzymes in Chinese liver microsomes compared with those in Caucasian liver microsomes. Br. J. Clin. Pharmacol. 73, 268–284. doi:10.1111/j.1365-2125.2011.04076.x
Yang, F., Xiong, X., Liu, Y., Zhang, H., Huang, S., Xiong, Y., et al. (2018). CYP2C9 and OATP1B1 genetic polymorphisms affect the metabolism and transport of glimepiride and gliclazide. Sci. Rep. 8, 10994. doi:10.1038/s41598-018-29351-4
Yoo, H. D., Kim, M. S., Cho, H. Y., and Lee, Y. B. (2011). Population pharmacokinetic analysis of glimepiride with CYP2C9 genetic polymorphism in healthy Korean subjects. Eur. J. Clin. Pharmacol. 67, 889–898. doi:10.1007/s00228-011-1035-2
Yun, H. Y., Park, H. C., Kang, W., and Kwon, K. I. (2006). Pharmacokinetic and pharmacodynamic modelling of the effects of glimepiride on insulin secretion and glucose lowering in healthy humans. J. Clin. Pharm. Ther. 31, 469–476. doi:10.1111/j.1365-2710.2006.00766.x
Keywords: digital twin, diabetes, glimepiride, PBPK, physiologically based pharmacokinetic model, pharmacokinetics, personalized medicine
Citation: Elias M and König M (2025) A digital twin of glimepiride for personalized and stratified diabetes treatment. Front. Pharmacol. 16:1686415. doi: 10.3389/fphar.2025.1686415
Received: 15 August 2025; Accepted: 16 September 2025;
Published: 08 October 2025.
Edited by:
Youssef Daali, University of Geneva, SwitzerlandReviewed by:
Mubara Azhar, Bakhtawar Amin Medical and Dental College, PakistanDaniel Kirouac, Metrum Research Group, United States
Copyright © 2025 Elias and König. This is an open-access article distributed under the terms of the Creative Commons Attribution License (CC BY). The use, distribution or reproduction in other forums is permitted, provided the original author(s) and the copyright owner(s) are credited and that the original publication in this journal is cited, in accordance with accepted academic practice. No use, distribution or reproduction is permitted which does not comply with these terms.
*Correspondence: Matthias König, a29lbmlnbXhAaHUtYmVybGluLmRl; Michelle Elias, ZWxpYXNtaWNAaHUtYmVybGluLmRl