 Sreemanti Dey1,2
 Daniel Ebanks
 Sarah Hashash
 R. Michael Alvarez
- 1Division of Humanities and Social Sciences, California Institute of Technology, Pasadena, CA, United States
- 2Department of Computer Science, Princeton University, Princeton, NJ, United States
- 3Institute for Computational & Mathematical Engineering, Harvard University, Cambridge, MA, United States
- 4Department of Government, Stanford University, Palo Alto, CA, United States
The 2020 presidential election saw election officials experience physical and social media threats, harassment, and animosity. Although little research exists regarding animosity toward US election officials, observers noted a sharp increase in 2020 in animosity toward US election officials. The harassment of election officials hindered their work in administering a free and fair election and may have generated doubts about electoral integrity. Our study: (1) Proposes a unique measurement and modeling strategy applicable across many social media networks to study toxicity directed at officials, institutions, or groups; (2) Collects a novel dataset of social media conversations about election administration in the 2020 election; (3) Uses joint sentiment-topic modeling to identify toxicity from the reactions of the public and election officials, and uses dynamic vector autoregression models to determine the temporal structure of the toxic conversations directed at election officials; (4) Finds that the level of animosity toward election officials spikes immediately after the election, that hostile topics overall make up about a quarter of the discussion share during this period, increasing to about 60% following the election, and that hostile topics come from left- and right-wing partisans. Our article concludes by discussing how similar data collection and topic modeling approaches could be deployed in future elections to monitor trolling and harassment of election officials, and to mitigate similar threats to successful election administration globally.
1 Introduction
Researchers have long argued tha for proper functioning, democracies require free and fair elections (Bjornlund, 2004). Although these twin concepts of freedom and fairness with respect to election administration are often used together, they are typically not well defined. Thus, it can be difficult to quantitatively determine whether an election has been conducted freely and fairly (Elklit and Svensson, 1997). With characteristic bluntness, political scientist V.O. Key provided some clarity regarding a quantifiable definition of free and fair elections, arguing that “If a democratic regime is to work successfully it must be generally agreed that contestants for power will not shoot each other and that ballots will be counted as cast” (Key, 1984, 443).
While scholars studying American politics may have long assumed that “contestants for power will not shoot each other ...” that assumption was tested in the immediate aftermath of the 2020 presidential election. During the 2020 general election there were unprecedented efforts to undermine and cast doubt on the integrity of American electoral institutions and the election officials in charge of administering the election (Bowden and Teague, 2022). And on January 6th, 2023, when a mob attacked the Capitol Building when the US Congress was working to certify the results of the election, many realized that the United States may have come quite close to not having a free and fair election with a smooth and peaceful transfer of power from the losing party to the winning party (Schiff, 2023).
The 2020 US presidential election was not particularly close: Biden won 51.31% of the popular vote and 56.88% of the Electoral College vote, while Trump won 48.86% of the popular vote and 43.12% of the Electoral College vote.1 Despite these margins of victory, the 2020 US presidential election was unique as the Republican losing candidate and his supporters were very vocal with countless claims of election fraud, none of which were found to have merit in detailed analyses by scholars (Eggers et al., 2021). The 2020 US presidential election was also unique, as those tasked with administering the elections across the country, whether at the state or local levels, whether paid or volunteer, were criticized, threatened, trolled, and in some cases physically attacked (Bowden and Teague, 2022). A 2022 survey of local American election officials (LEOs) sponsored by the Brennan Center for Justice found that 17% of local election officials polled reported that they had been threatened because of their job: among those threatened, 73% said the threats had come by phone, 53% said they were in person, 37% received them through social media, and 25% had been threatened by mail.2 To the extent that these threats affect the behavior of officials in their capacity of ensuring the proper functioning of electoral institutions, these threats themselves pose risks to American democracy.
In this article we develop a methodology for measuring and modeling online criticism, animosity, and toxicity directed at American election officials. Of course, our social media perspective does not necessarily include the full array of ways that election officials were threatened or attacked in that election (especially physical threats and attacks), but these data provide us with important measures of the timing and nature of the threat environment facing election officials. The social media data contain a vast array of information regarding the online conversation about the 2020 election: detailing the negative information that was being directed at election officials while also providing a perspective on the how election officials were responding. Our data also contains other information from neutral or supportive social media users, giving us the ability to examine the information environment on Twitter in the fall of 2020.
Our method is also widely applicable due to its flexibility. Thus, in addition to analyzing hostility toward election officials in 2020, our method can be used to measure and model any type of organized online conversations, whether positive or negative, that are directed at political institutions, public officials, or other groups. While we used Twitter data, our method is general and can be used with any form of text-based social media data (since the collection of our data, Twitter became X, and we will refer to the source of our data as Twitter in this article).
Our article proceeds as follows. In the next section we discuss past research on election administration and try to situate our analysis in that research. We then present the methods we used to collect, preprocess, and analyze our data (additional details are provided in the appendices). Then we present our key results and conclude with a discussion of the implications of our work for future elections.
2 Animosity toward American election officials
Despite what many assume, political violence is not unusual in American political history. For example, there was significant political violence in the years leading to the American Civil War (Kalmoe, 2020), including within the US Congress (Freeman, 2018). Violence and threats have continued into more recent American political history, for example the Civil Rights movement (Branch, 1989). Scholars have noted that with political extremism in the United States today, the potential for political violence continues, though scholars debate how widespread this potential may be (Kalmoe and Mason, 2022; Westwood et al., 2022). Finally, the history of election administration in the United States has many examples of violence and threats at polling places, with violence and threats often seeking to disenfranchise certain groups (Bensel, 2004; Keyssar, 2009).
While political violence and threats during the election process (including harassment of local election officials) are not a new phenomenon in the United States, there is limited existing research that studies the dynamics, origins, and content of threats and harassment of election officials. As mentioned in the previous section of our article, survey research showed a clear increase in threats and harassment against LEOs in 2020 compared to previous elections, and that LEOs feared animosity against themselves and colleagues more than in the past (Edlin and Baker, 2022). This trend has continued through 2022, in fact, LEOs believe that the 2020 election served as a tipping point for starting a trend of markedly increased animosity toward electoral institutions (Edlin and Baker, 2022). In fact, these trends have been further supported through hands-on quantitative studies of social media data (Gross et al., 2023). Finally, some have argued that more might be done by law enforcement to investigate those who harass LEOs (So and Szep, 2021).
This research speaks to important questions in the literature, with far-reaching implications for American electoral democracy. First, direct threats and harassment directed at election officials impede their ability to administer an election efficiently. If they are fearful for their personal safety and the safety of their families and coworkers, they may need to take protective actions, steps that distract or deter them from effective work during an election. In fact, this may be the intention of some of those threatening election officials, as threats and harassment can constitute a type of denial of service attack on election administration in a jurisdiction. Detecting and deterring these threats can help election officials stay focused on their important and time-sensitive work during the election season.
As the threats, harassment, and general animosity toward election officials that we are studying occur on social media, they can have broader political and social implications. In particular they may serve to inspire broader doubt and animosity from the electorate on the integrity of the work of election administrators. Those viewing these negative and threatening posts on social media may lose confidence and trust in the published outcome of the election (especially if they are on the losing side). If concerns about election integrity go viral on social media, these threats and negativity can have serious and lasting consequences for trust and confidence in the election process and published outcomes for stakeholders and citizens. Understanding the origins and content of election threats, harassment, and negativity is thus consequential for understanding why many in America may lack confidence in the current election administration process.
Distrust in disfavored electoral outcomes is not a new phenomenon. There were large partisan gaps in confidence in election administration in 2000, 2004, and 2012 (Sances and Charles Stewart III, 2015). In 2004, 59 percent of Democrats did not believe Republican George W. Bush fairly won the election (Sances and Charles Stewart III, 2015); comparable to the 52 and 50 percent of Republicans who expressed confidence in the outcome in 2012 and 2020, respectively. It is well studied that voters of a losing party during an election tend to distrust the winning party, while rationalizing the loss through various avenues, including distrust of the electoral process (Craig et al., 2006) (Hansen et al., 2019).
The 2020 election was contentious and emotionally charged, which could have amplified the loser effect (Daniller, 2016). Of course, distrust of the electoral process can easily be directed toward distrust of the local officials running the elections. This is convenient for political elites on the losing side–it leads the option of bad faith agenda setting open, and the direction of the discussion space turned toward animosity of LEOs (Gilardi et al., 2022; Fazekas et al., 2021).
The loser's effect may have produced higher levels of LEO harassment. There are at least two different mechanisms that may be responsible for this. First, the eventual winner of the 2016 election continued to doubt the outcome of that election (despite winning that election), resulting in a smaller gap in faith in the election, as the loser of that election had telegraphed faith in the electoral process prior to losing (Sinclair et al., 2018). But second, in 2020, social media platforms have been used as a coordination mechanism, with Republican elites actively casting doubt on the electoral process both before and after the election. Moreover, unlike in 2000 and 2004, the losing candidate did not ultimately concede that he lost a fair election.
We argue that the combination of these two factors likely resulted in the animus directed toward election officials on social media. Political elites strategically attempted to set the agenda for discussion surrounding the election, in this case by amplifying messages that encouraged animosity toward the LEOs. To cast distrust, these officials use falsehoods and exaggerations to propagate their narrative. In order to reassure the public about the integrity of the election, local election officials (LEOs) took to Twitter to placate growing mistrust in electoral institutions from a wide range of the ideological spectrum. In this article, we argue that the manifestation of the loser's effect is amplified by prominent partisan elites (in the case of the 2020 election, the President of the United States). This is based on existing theories that suggest that distrust in election outcomes is associated with the loser's effect and elite messaging (Sinclair et al., 2018).
While the literature so far on voter confidence and the loser's effect has focused on survey evidence, in our article we take a different and novel approach. We collected a large high-frequency dataset (5,747,858 tweets) of social media posts directed at election officials. After pre-processing our data, we then used a semi-supervised natural language processing method that estimates both the topics (issues) discussed in the posts and their sentiment (negative, neutral or positive). We then model the predicted magnitude of the influence of online discussion by LEOs on the public, and vice versa, using vector autoregression.
Sentiment analysis in political science is a topic of great interest due to the inherent importance of sentiment in political rhetoric public behavior. Sentiment analysis of text tends to be a subset of the more general problem of text content analysis (Grimmer et al., 2022). These methods are divided into classification and scaling problems, and classification problems are further divided into methods for known and unknown categories. With known categories for content classification, there are numerous supervised approaches, including machine learning (Thelwall et al., 2011) and nonparametric methods (Hopkins and King, 2010). However, due to the dynamic nature of election cycles and the granularity of content changes online during salient periods, hand-designing classification categories inherently constrains data according to the authors' interpretations. Instead, our work required the second type of method: classification with unknown categories. For this type of problem, single-membership clustering and mixed membership approaches exist (Grimmer and King, 2011; Airoldi et al., 2014). Again, for our problem, there is no need to restrict tweets to one classification, so we choose mixed membership. Within mixed membership, it is clear that tweet-level, that is, document-level, analysis is necessary, leading us to topic models and LDA derived approaches in particular. Thus, although a plethora of methods for sentiment analysis are applicable to political science, our context naturally directs us to topic modeling.
Our innovation is to exploit the temporal nature of dynamic streaming data to examine how LEOs and the public interact on social media before, during, and after the election. Previous research using social media data to study election administration does not exploit the temporal nature of dynamic streaming data. So, while topic-based analyses and time-dependent sentiment analyses of Twitter data exist separately, to the best of our knowledge, these approaches have not been combined. We will bring these topic modeling and dynamic analysis together, to observe changes in hostility toward LEOs over time.
Thus, our sentiment-topic estimates provide measurements of distrust in election administration and of the animosity aimed at election officials. Our approach allows us to study the real-time dynamics of mistrust in officials, and we find evidence that although election officials had control of the discussion agenda related to election administration in the lead-up to the election, LEOs lost control of the social media conversation around electoral procedures, while becoming targets of threats and harassment.
There are other approaches that have been used to study the dynamics of public opinion measured in social media data. One version of this analysis simply uses conventional frequency measurements of topics over time; that is, they isolate topics to search for on Twitter, and then measure their presence in the discussion space over time (Giachanou and Crestani, 2016). While this approach can be effective in certain cases, it is not sufficient for holistically observing political trends, since manually picking topics unnaturally distorts the representation of the discussion space. In order to avoid doing this, another type of method can be used: collecting the entire discussion space around an issue and then training classifiers based on the sentiments that are being extracted. For example, researchers have studied the change in opinion toward gay marriage before and after the Obergefell vs. Hodges decision, by training models for binary classification of sentiments in tweets (Adams-Cohen, 2020). Still, this method necessitates supervised learning and thus some amount of hand-labeling tweet sentiments. Recently, researchers have developed unsupervised methods to analyze voter behavior using topic discovery, opinion mining, and emotion analysis on social media data (Belcastro et al., 2022). Although these techniques are valuable for identifying topics that generate animosity, the reliance on static hashtags and word-based modeling for data collection can distort the discussion space and present challenges for real-time application.
3 Research design
Voter turnout in the 2020 presidential election was the largest in recent American history, resulting in intense social media participation and the generation of millions of tweets. This period provides us with a plethora of data regarding the sentiments of the public regarding the electoral process, yet provides a unique challenge due to the sheer amount of social media information generated. In this section, we discuss the development of a novel data collection method to analyze sentiment and animosity during the 2020 election. To obtain the discussion space closest to the electoral officials, a multi-level network of connectivity was created utilizing Twitter accounts with the accounts of the election officials at the core of this network. For the analysis of this network, we develop a dynamic aggregate measure of animosity toward local election officials exhibited by social media users, and use it to show that the salience of the election is correlated with increases in animosity online, but mostly after the election already occurs. To further generalize, we use this method to observe latent trends of animosity toward the electoral system at large. In the next sections of the article we provide a detailed description of our methodology.
3.1 Data collection
We use data collection methods that maintain a multilevel structural connectivity between election officials, political activists, and the general public. Rather than use keywords to query the Twitter API, we developed a data collection architecture to identify the multi-level networks of connectivity among LEOs, political activists, and the general public. The basis of the network collected is a list of 98 election officials Twitter handles collected by NASS and an expert who works closely with election officials in the US. These election official Twitter accounts include the state election offices as well as personal and professional Twitter accounts of election directors and secretaries of state.
The selection of election officials as the basis of our data collection social media data provides us with distinct advantages over other data collection methodologies. Social media data, in particular from Twitter, was chosen over participant observation and surveys because it can be used to continuously monitor the sentiment of the discussion space before, during, and after the election. In particular, these tweets contain real-time raw responses and reactions that are extremely hard to gather due to the illegal and harmful nature of rendering threats to election officials. Thus the influence of the observer's effect is minimized since the generation of tweets occur without the influence of researchers.
This collection methodology is an important innovation, because we need to understand the dynamics of the behavior of the online trolls, the political leaders encouraging the trolls, and the local election officials who were the targets of the trolling. Previous studies of voter anger and the winner/loser effect rely on high quality survey evidence. This evidence offers key insights into the psychology of voters immediately preceding an election and in the aftermath of an election; however, to better understand the real time dynamics of voter anger, we need real-time measurements of all the relevant voters. To this end, our collection methodology captures the relevant actors based on their social media interactions, and Twitter itself was the platform where much of the protest and collective movement that grew into the January 6th insurrection was organized. So, we argue, these Twitter interactions are an important data source for understanding how the January 6th movement developed and to test how political elites encouraged or discouraged this anti-Democratic behavior. While we select Twitter as the social media network of choice for our research it should be stressed that the methodology utilized is applicable to any text-based social media.
The foundation of our data collection starts with the establishment of the network between the LEOs. To collect these data we utilized an initial seed list of the official and personal accounts of 86 election officials obtained from subject-matter experts. After determining a collection time period that encompassed both the 2020 summer presidential campaigns and post-election events we collected all tweets generated from the LEOs' accounts to determine institutional messaging and agenda.
Next, we collected the users who amplified and spread the LEO messaging by retweeting them. Lastly, to capture the general discussion among non-LEO users about the LEOs we collected all tweets that mentioned the LEOs accounts. This results in 608,968 total accounts and 5,747,858 total tweets. This is a comprehensive dataset that we believe captures the vast majority of discussion directed at local election officials before, during, and after the 2020 election. The dataset was collected using a multi-level network method detailed in Kann et al. (2023). This method allows for the collection of a large, topically relevant dataset without hand-selecting topics or searching for keywords, both of which are prone to introducing bias and are generally inflexible. It also retrieves a larger discussion space than solely relying on interactions with LEOs, since discussion relevant to election administration could well occur without direct LEO involvement. This allows observation of larger hostility trends, and a more comprehensive view on topical trends.
Our data collection method results in a rich and large dataset that, when analyzed, contains topics of interest as well as a background of general activity, making it well-suited for estimating the topical mix surrounding LEOs.
3.2 Measurement
3.2.1 Measurement strategy
To identify the discussion space and construct our measures of animosity, we used the joint sentiment-topic model (JST), and applied it across the period of time surrounding the 2020 election. We used JST estimates of the topical content of these online conversations to label documents with topics and their sentiment orientations. In this way, we are able to gauge the relative animosity toward election officials per topic. By further grouping the tweets by date and averaging relative probabilities across taxonomies of topics, we are able to show that animosity spikes during the period following an election. PCA is then used to visualize the resulting topic mixtures in an intuitive 2-dimensional space, shown in Figure 1, in which the proximity of certain topic types to each other can be observed directly. Last, we used vector autoregression (VAR) to further quantify interactions between LEOs and non-LEOs in our dataset. Our approach contributes a new application using this framework to study the dynamics of social media discourse, adding to a literature that has studied the dynamics of social media discourse in other substantive areas (Barbera et al., 2019; Debnath et al., 2023; Ebanks et al., 2025).
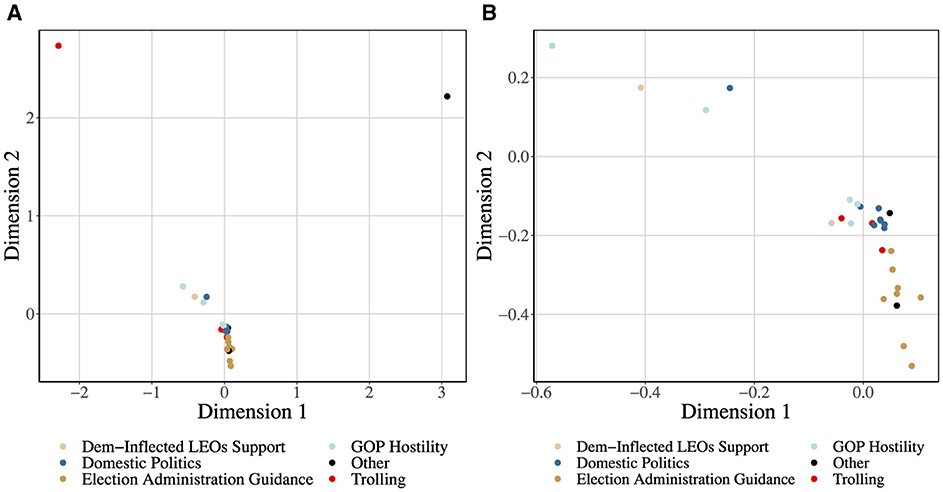
Figure 1. Discussion space for election-official mediated discussion: this figure shows a PCA reduction of the topical mixtures uncovered by topic modeling (JST). The topics are categorized by their overall relevance to LEO-related discussion. (A) shows the entire space, whereas (B) highlights the most densely populated part of the space. We see that “Trolling” is distant from the dense cluster of other political topics, suggesting that it is quantitatively distinct.
3.2.2 Justification of measurement
The JST method was developed with this particular use case in mind–since we wanted to study topics with negative sentiment (topics that contain toxic and highly negative language) (Lin and He, 2009; Lin et al., 2012). Thus, other topic modeling approaches like the Latent Dirichlet Allocation (LDA) model, or word-embedding models like the Bidirectional Encoder Representations from Transformers (BERT) model were ill-suited for our study as they do not simultaneously estimate sentiment and topics.
Importantly, JST is an extension of LDA, but the latter is insufficient for this use case. The use of LDA resulted in mostly time-invariant clustering of tweets that had muddy topical separation at best, making animosity nearly impossible to clearly observe in the resultant discussion space. The lack of clear topical separation was likely due to additional underlying structure in the data, including the latent factors of sentiment and partisanship. The necessity of accounting for another layer of latent factors in the data thus became a clear motivation for using JST, which is a modification of LDA for exactly that purpose.
Another popular class of language models, word embeddings, are also not well-suited to this application for a number of reasons. The first of these is that document-based models are easier to interpret than word-based ones, which is useful for a substantive problem like measuring tweet animosity. For example, the JST approach lends itself to clear interpretation through observation of emblematic tweets for each topic and sentiment, the top words in each topic, etc.
Furthermore, word-embedding based methods require labeled data, while our method is unsupervised. The unsupervised approach is advantageous firstly because it does not require hand-labeling, which is costly and time-consuming, as well as commonly subject to bias in the assigned labels. Labeling is also not part of our novel data collection method, which is better for the study of animosity toward LEOs due to the dynamic discussion space about the electoral process on social media. Common data collection methods from the TwitterAPI include querying for specific keywords and hashtags. However, reliance on keywords results in a lack of granularity since we would be unable to capture the overall messaging of the LEOs as well the discussion directed toward them. Additionally, we would have to keep an ever-growing corpus of keywords to reflect specific new topics that emerge due to events such as the January 6th Capitol riots. Instead by using the election official handles as a seed list for data collection we are able to capture all of the institutional messaging as well as the evolving reactions and discussions amongst political activists and the general public.
An additional reason word-embedding based models are not well-suited for this use case is their lack of flexibility. Using these language models or supervised learning methods would require hand-labeling large datasets, which is infeasible given the volume of data and dynamic nature of political discussion. The JST/PCA approach we use here does not require hand-labeling of training data, and it allows the flexible estimation of changes in the topic distribution as context or environment changes.
Another popular method for sentiment analysis involves using pretrained large language models (LLMs) such as Perspective API.3 However, there are a number of issues regarding the use of LLMs (especially proprietary LLMs) for a research project of this nature (Linegar et al., 2023; Palmer and N.A. Smith, 2024). First, in our application we desire strong topical transparency. That is, utilizing LLMs adds opaqueness to classification results of trolling and non-trolling. Our approach also allows for a more flexible and domain-specific definition of toxicity. Instead of relying on a notion of toxicity learned from a large selection of mixed text data, our toxicity classification, and topics in general, are specific to the context of the particular data we are interested in. Additionally, we want to employ a methodology that can readily be used by researchers, election officials, and stakeholders—a methodology that does not require access to an LLM API nor the expense of using one. Finally, as the data we want to topically label are from human subjects, we prefer to avoid using public LLMs to comply with data use and human subjects policies.4
Finally, the most prominent measure traditionally used for this purpose is survey-based, and our approach, both in data collection and model-wise, avoids many traditional pitfalls involved with the use of survey data. One of the most clear advantages of using tweets directly is that we are able to obtain much more granular information about the political discussion space leading up to an election than most surveys would reasonably get. This allows for a much more detailed understanding of animosity toward LEOs during elections, rather than observing long-term political trends. Another advantage of social media data over surveys is that we avoid reliance on possibly ambiguous survey responses. Sources of ambiguity in survey responses include common response biases, as well as the notion of asking participants to classify their own emotions. Our data, in contrast, is much more organic, and thus represents the discussion space around LEOs in a more realistic way.
3.2.3 Validation
To validate our measurement, we use several approaches to ensure that the topics we estimate make sense. We do this by examining the top ten words associated with each topic, the emblematic tweets for each topic, and finally, a measure of the relative vulgarity of the language used in each topic.
We first label each sentiment-topic pair, which we call senTopics, by the portion of the discussion space that they represent. The result of this labeling is given in Table 1. A number of different methods were used to label the senTopics. One method was isolating the top 10 word stems that have the highest estimated parameter values per senTopic. The top words and representative tweets helped us label each topic; for example, word stems such as elect, genr, inform, process, office, gener_elect and elect_process are thus among the top words of Topic1Sent1 which we call the “Election Administration Guidance” topic. A comprehensive list of senTopics and their top word stems is given in Supplementary Table S4.
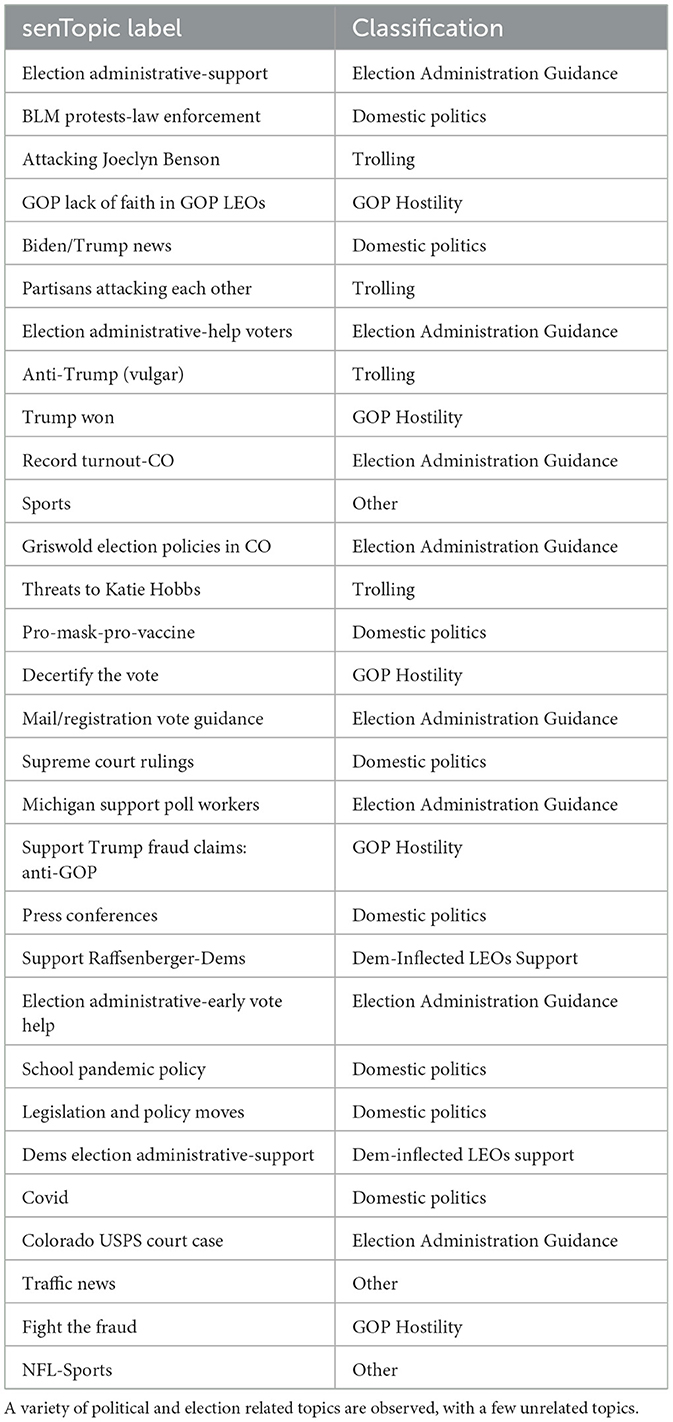
Table 1. Author generated senTopic content labels and discussion space classification.
Further confirmation of our labels comes from observing the emblematic tweets of each topic. The emblematic tweets of a topic are those tweets that have the highest score for belonging to a particular topic, and can be interpreted as representative of their classification. For example, the tweet that repeats “Election Officials are Heroes” is quite clearly in support of poll workers and other LEOs, in Topic6Sent3. Other emblematic tweets are also noticeably typical of their senTopics. All emblematic tweets are given in Supplementary Table 5.
Finally, we also compare the vulgarity of language used in each senTopic. This was accomplished by using the word-level senTopic scores, and isolating only what we considered vulgar language. We then summed the vulgarity scores for each word for each topic, and compared the resulting comparative vulgarity between topics. We observe from Figure 2 that the classes we consider to have high animosity toward LEOs, namely ‘Trolling' and ‘GOP Hostility', have high vulgarity scores–such as “Decertify the Vote” and “Trump Won”.
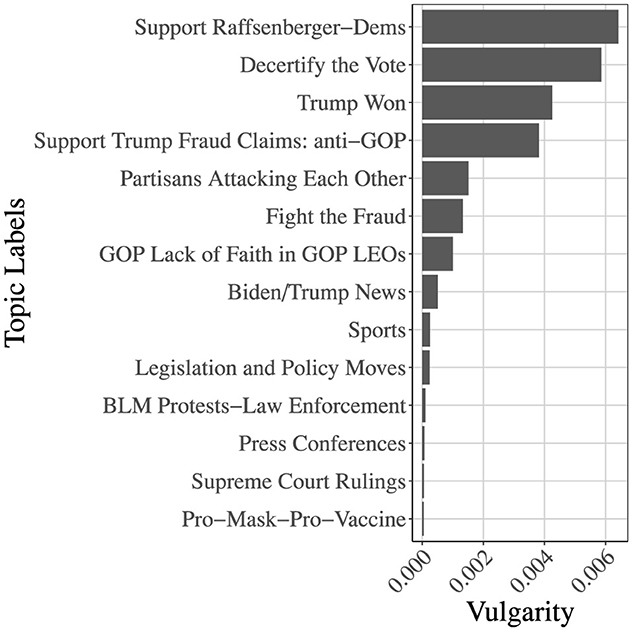
Figure 2. Vulgarity scores for each senTopic. Only senTopics with nontrivial vulgarity scores are shown–other topics had negligible scores. Highly controversial topics, such as “Decertify the Vote” have observably higher vulgarity scores.
4 Results
We begin by identifying our key results. We first find that animosity toward election officials does not increase consistently pre-election, but rather spikes post-election, when results begin to be contested. This phenomenon can be seen in Figures 3, 4. Following the election, we observe a distinct uptick in the amount of vitriol shown by Republican leaning users toward election officials, based on voter fraud and vote miscounting claims. We observe an accompanying increase in Democratic leaning defense of electoral institutions (Figure 5), but at a lower magnitude, i.e. Republican leaning users have most of the share of discourse about the election process after an election that turned in favor of Democrats. Furthermore, we find that the election very clearly acts as a focal point of activity for election officials (Figure 6 illustrates this), however, by the time animosity increases following an election, officials tend to lose control of the narrative. Figure 7 shows the total volume of tweets per day, with spikes in activity in particular on Election day, post-election period, and during certification. As seen in Figure 8, the timeline shows that election officials increase activity until an election, while trolls, displeased politically active social media users, and LEO supporters increase activity after the results of an election become known.
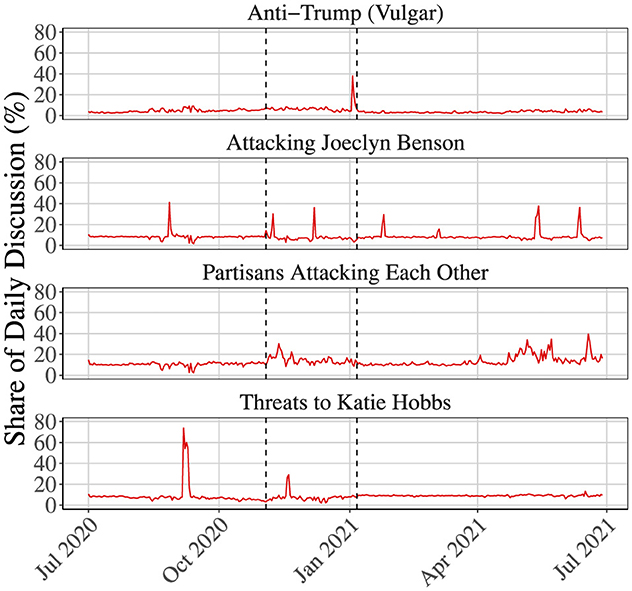
Figure 3. Trolling against LEOs: this figure shows the share of daily discussion composed of troll-inflected hostility toward specific election officials (i.e., Katie Hobbs (D) and Jocelyn Benson (D)) as well as other trolling topics. The dashed lines indicate the 2020 Presidential Election and the January 6th Certification, respectively. Note that the animosity toward the specific election officials spike post-election.
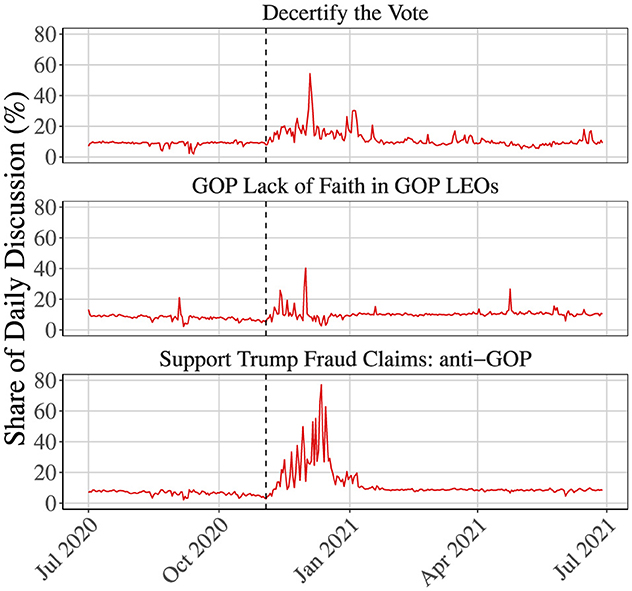
Figure 4. GOP animosity toward electoral institutions: this figure shows the share of daily discussion composed of GOP-inflected hostility toward American Electoral Institutions. The dashed line indicates the 2020 Presidential Election. The claims of election fraud have an increasingly larger share of the discussion space (nearly 80 %) post-election. The spikes in all three topics following the election support the notion of the loser's effect.
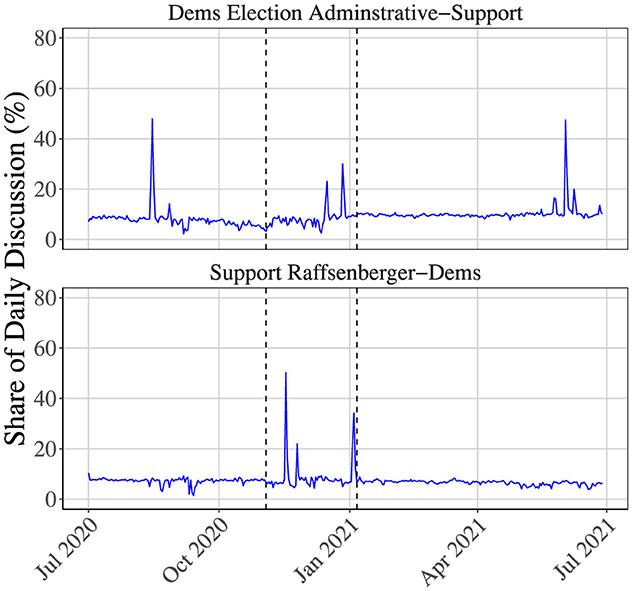
Figure 5. Democratic-inflected support for LEOs: this figure shows the share of daily discussion composed of Democratic-inflected support for LEOs, including cross-partisans in Georgia and Arizona. The dashed lines indicate the 2020 Presidential Election and the January 6th certification, respectively. Spikes of support seem to occur prior salient dates, but are not present following them, suggesting that support does not counteract post-election hostility.
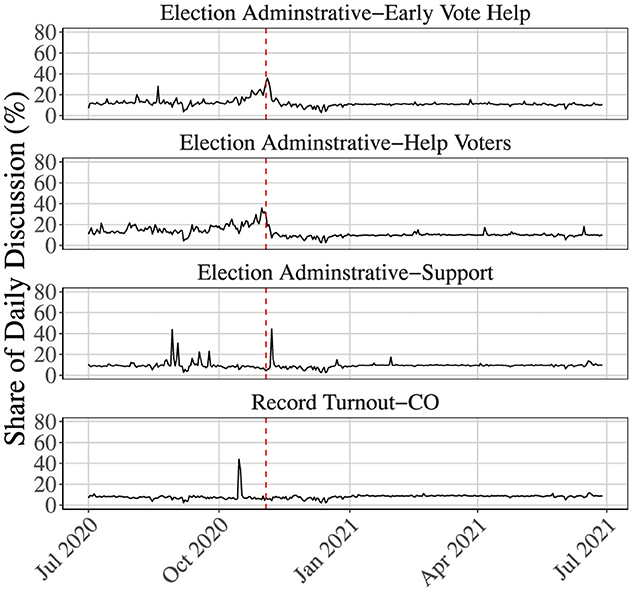
Figure 6. LEOs guidance to voters: this figure shows the share of daily discussion composed of neutral guidance provided by LEOs to the American public related to election administration. The dashed line indicates the 2020 Presidential Election. LEO activity slowly build up pre-election, however, LEO activity largely ceases following the election, suggesting that they lose narrative control of election discussion.
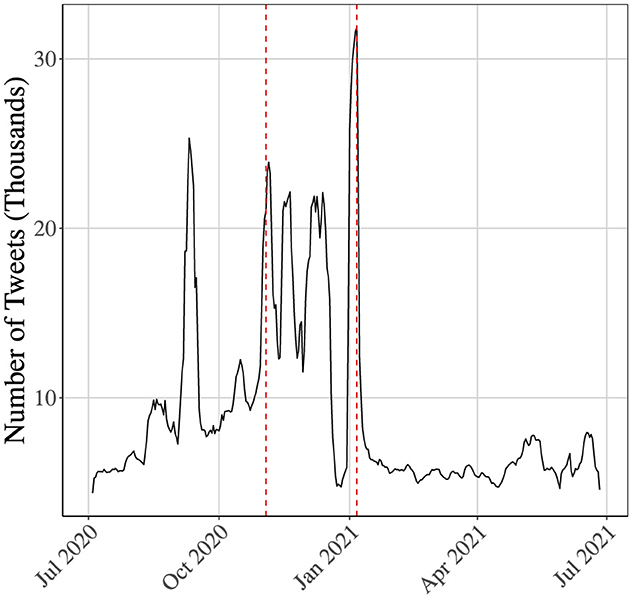
Figure 7. Total volume of tweets per day: this figure shows the daily volume of tweets present in our dataset, on a time frame surrounding the 2020 election. The number of tweets steadily increases toward the election date and spikes several times afterwards. Before the certification date, there is a significant dip, followed by a spike in activity larger than any previously observed, coinciding with renewed interest around the certification. The dashed lines represent the election and certification, respectively.

Figure 8. Moving average of discussion share: this figure shows a 14-day moving average of tweet discussion share across the various tweet classifications, with the date of the election marked with a black line. GOP Hostility has by far the largest share of discussion space following the election, and trolling also spikes at this time. LEO activity, which is mostly comprised of Election Administration Guidance, occupies a small topical share at the time of hostility spikes. Thus, hostility dominates the discussion space after the election.
To further quantify the trends in LEO and public interaction that were observed with the time-varying topic model approach, we used a vector autoregression (VAR) model (Freeman et al., 1989). VARs take groups of endogenous variables and predict the effects of a hypothetical shock to one variable on the other variables in the group. With these models, it is possible to predict how LEOs and the public interact topically. We do so by choosing three major LEO topics, three major hostile-toward-LEOs topics, and observing the effects of each.
In Figure 9, we observe hypothetical interactions that support the takeaways from our animosity measure. Figure 9 has two columns of results. The left column provides the estimated magnitude of the influence on online discussion by LEOs of each representative topic on the public (black error bars), while the right column provides the estimated magnitude of the influence on online discussion by the public on each representative topic on LEOs (right error bars). Each subplot in Figures 9A–F gives the results for a representative topic.
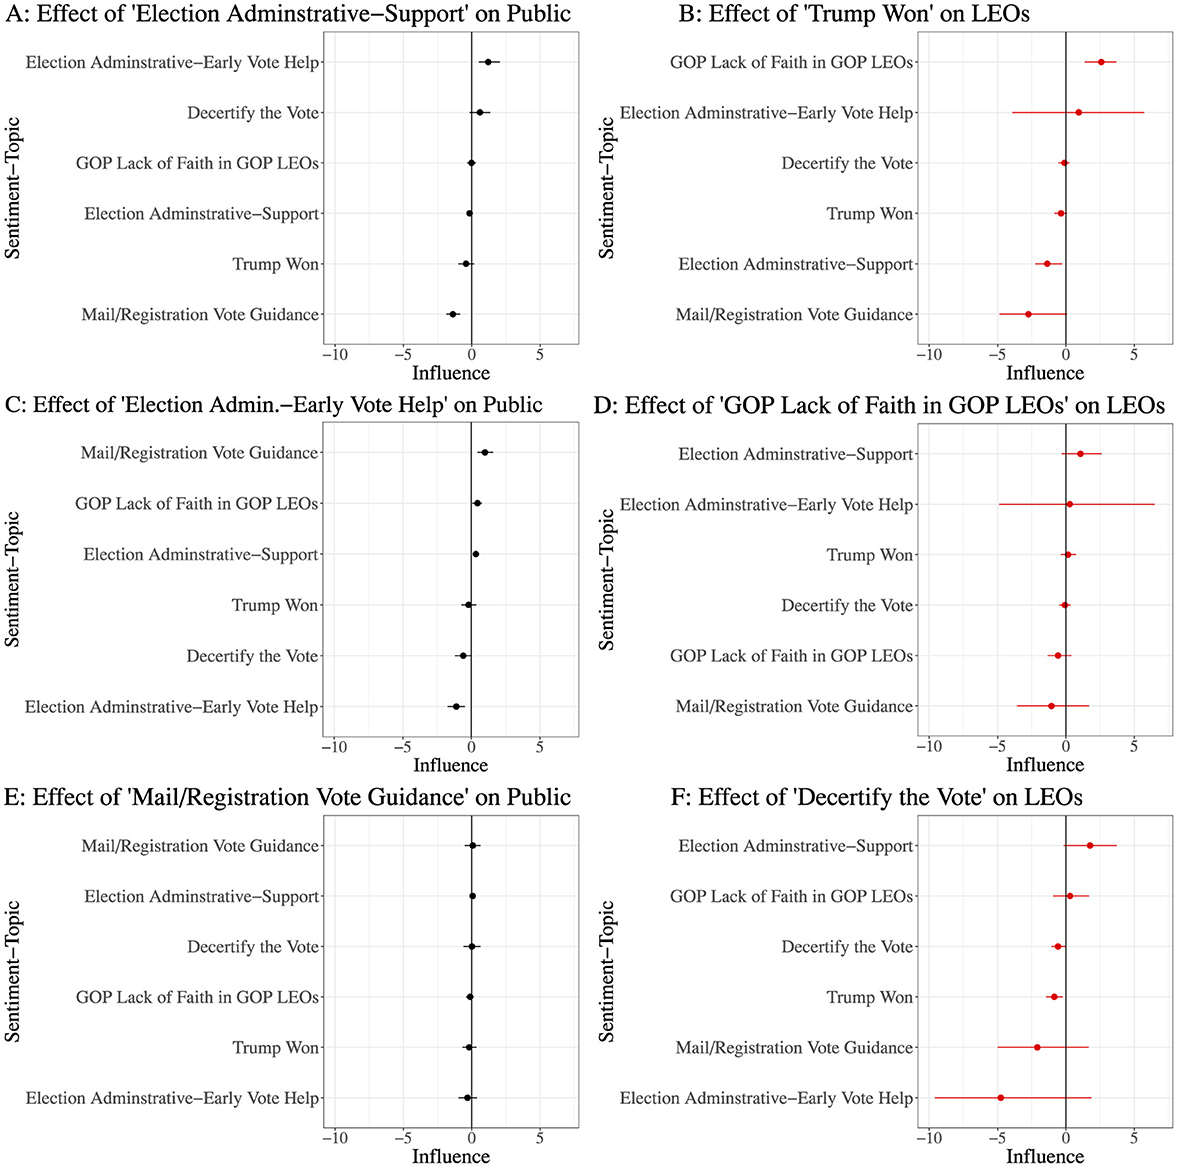
Figure 9. A summary of predicted VAR interactions between LEOs and non-LEOs, on a small set of representative topics for each group and a lag of 1 day. In the left column are the magnitudes of the influence on online discussion as measured by the predicted impulse responses by LEOs on the public, and in the right are the predicted magnitudes of influence on online discussion by the public on LEOs. (A–F) provides a results for different topics. In general, LEOs have a small predicted effect on the public, and while the public tends to have a larger effect on LEOs, their predicted responses are still mainly comprised of neutral administration topics. This supports two ideas: one, that hostility comes from external agenda setting and not LEO activity, and secondly that LEO responses do not effectively counter hostile narratives.
We can see that LEOs have a very low expected effect on the public, and the effects that they are expected to have are mostly relegated to inspiring the public to share information about voting. However, the public has a more noticeable effect on LEOs in some cases, as seen in Figures 9B, D, F. Both directions of these interactions support our findings. The fact that LEOs are not predicted to have significant effects on the public is expected, as they have a much smaller topical share than the public at any given time. This also suggests that something else catalyzes harassment and animosity toward them, namely, election dates. From the other direction, we observe a predicted failure in agenda-correction from LEOs; despite responding with a countering topic in Figures 9B, D, F, we observe that they are predicted to double down on neutral election help.
5 Discussion
The topical measures of animosity developed in this article capture the nuances of the discussion space surrounding LEOs in the period of an election. In order to keep a detailed pulse on hostility toward LEOs, we developed a methodology that is more granular and organic than previously known methods for measuring political anger.
In order to best capture hostility close to LEOs while still getting an accurate picture of the general discussion space around an election, we utilized a novel data collection method involving seeding with election official accounts and exploiting the inherent layered structure of retweet networks. In this way, we can detect active hostility against LEOs while it occurs, as opposed to through keyword searching after the fact. Thus, one way our approach advances the research literature on hostile social media conversations is our novel data collection method.
Then, application of JST to the entire discussion space allows us to understand the prevalence and position of different kinds of topics over time. We directly observe when hostility spikes, as well as the discussion share of the other topics in general. This is far more reliable than using survey data to measure hostility–we can gauge discussion share that is actually related to LEOs, as well as observing the true prevalence of certain topics and emotions rather than what participants claim or judge themselves.
Our approach also provides a more sophisticated and data-driven approach for analyzing hostile social media attacks on public officials. For example, a recent similar study started by picking accounts and replies, which may constrain the discussion space (Gross et al., 2023). They then used a dictionary keyword method to classify social media conversations into topics, then also used a sentiment classification method (VADER) on their data. Finally they used regression methods to analyze the trends in their data.
In contrast, our method starts by collecting a wider array of tweets that are still highly relevant to the election. We then estimate sentiment and topic jointly and simultaneously, which allows the data to identify the topics in the conversations. This makes it less likely that we will miss topics that may not appear in a keyword dictionary, most importantly. Furthermore, we use vector autoregression to analyze the trends in the sentiment topics we estimate, thus allowing a better approach for estimating dynamics than ordinary-least squares regression.
The following constitute some of the main insights our animosity measure offers regarding discussion space surrounding the 2020 election. Our most important finding is that the level of animosity toward LEOs spikes immediately after the election. The higher share of discussion on topics of trolling and animosity appear after the elections, as seen in Figure 8. This indicates that intense trolling and threats are more likely to occur at these periods compared to other times. This observation allows us to better identify emerging threats toward election officials by focusing on that time period, and by closely watching topics classified as hostile.
We also make the observation that hostile topics generally tend to account for about a quarter of the discussion share in the period we monitored, and that this share becomes about 60% following the election. Thus, animosity toward LEOs is usually present, but unlikely to be very harmful during most times. We also find that hostile topics are composed of both left and right wing partisans, making it important to monitor both of these angles of attack–even though different ideologies will frame their attacks from different perspectives and likely about different aspects of the election, we understand that both sides have open potential to harass LEOs.
These results strongly suggest that the loser's effect was in action during this election cycle. In the weeks and months following the election, many contested districts swung Democratic, and our results show that this period coincided with an uptick in GOP-inflected hostility toward LEOs. Of course, this suggests the loser's effect–by assigning blame to LEOs for the results, the GOP could rationalize the unexpectedly stark loss.
In addition to the loser's effect, the effects of agenda-setting by political elites could be in action in 2020. After all, in a democracy, losses are generally accepted by the losing party despite some political aggression. In this case, though, active mistrust of the electoral process was undeniably heightened by Trump himself, and various other GOP elites, causing the accusations of fraud to be far more widespread than in other elections. This in turn should cause animosity against LEOs to be far greater than the usual result of the loser's effect, which is consistent with observations during the election season.
Since our results also show that LEOs maintain a smaller share of the total discussion space following the election, dissatisfaction toward the electoral process seems to have free reign of the discussion space, with the pro-LEO agenda either relatively weakly present or not at all. Without strong reactive narrative changes by LEOs, the erosion of trust in democracy is accelerated since blaming losses on the electoral process seems both commonplace and largely not refuted by election officials.
In general, our study fits into the growing literature on political incivility on social media, in particular political incivility by political elites (Ballard et al., 2022; Heseltine and Dorsey, 2022; Heseltine, 2024; Kountouri and Kollias, 2023). Much of that interesting and important work has focused on incivility by political elites, against political elites. Our work contributes to this literature by developing methodologies to collect and analyze social media conversations by non-elites about and targeted at elites. We believe that more research needs to focus on how non-elites are using social media to criticize and harass political elites.
Our article also fits into the growing and large research literature that uses social media to study the 2020 election. Much of the existing research uses social media data to study voter opinions and behavior, using the prism of social media to understand the 2020 election (Allcott et al., 2024; Nyhan et al., 2023; Guess et al., 2023b,a; González-Bailón et al., 2023; Chen et al., 2022; Belcastro et al., 2022; Ferrara et al., 2020). Others have used social media data from 2020 to study the effects of the moderation of political content (Chowdhury et al., 2022; Li et al., 2023; Sanderson et al., 2021). Our article complements this literature, as we study how social media was used to attack and harass election officials in the 2020 election. However, in contrast to past research we use a novel means of collecting Twitter data and analyze these unique data with a different natural language processing method than generally used in the literature (the joint-sentiment topic model) (Lin and He, 2009; Lin et al., 2012). By jointly estimating sentiment and topics in social media data we can obtain a better understanding of topics such as negativity and animosity toward election officials.
We close by discussing some limitations of our approach. The first regards Twitter's content moderation policies during the 2020 election. Their removal of the vilest speech hampers our ability to analyze the most dangerous of trolling and threats. On the other hand, Twitter's policy is a positive for our research as they scores of fake accounts and bot farms, which increases the likelihood of our dataset properly capturing credible threats from real individuals. We suspect that with the fake accounts in play we may have seen a spike of animosity before the election due to potential bot farms attempting to rile up social media users. Without the extra noise of the fake accounts, it is more likely that we can more quickly focus on credible threats toward LEOs. We also note that the Twitter/X content algorithm and moderation policies have changed since 2022. As far as is publicly known, Twitter/X may have reduced or eliminated election-related content moderation. For the purposes of academic study, future research on online harassment of US election officials is less likely to suffer from this censored-data problem. In terms of future data collection, although Twitter has shut down their public research API, the company still provides access to their API at cost.
A second potential limitation of our study was our use of a snowball sampling technique to identify LEOs on Twitter. Standard practice for employing a snowball sample emphasizes the importance of a high-quality start list, justifiable collection procedure, and the verification of potential respondents (Biernacki and Waldorf, 1981). For our start list, we had a verified seed list of 93 LEOs, whose identities were easily verified. We then used our snowball algorithm to collect a list of potential LEOs, whose identities were then manually verified. We are certain we did not misclassify any non-LEOs as LEOs, but there is the potential that we did not collect the full population of local election officials who were active online (particularly if they never engaged with other LEOs online). At the time of writing, there were no verified lists of US local election officials, and so one of our goals is to capture a maximal number of LEOs at a hyperlocal level, and quantify their online activity. Given that we are studying how LEOs interact online, this alleviates concerns arising from the largest potential source of bias, LEOs not engaging with other LEOs online, and thus are not covered by the scope of this study.
6 Conclusion
In this article, we have found evidence that election officials attempted to control the narrative surrounding the 2020 election, but their social media activity was eclipsed by distrustful political commentary, as well as personal attacks and trolling. The methods developed in this article are applicable to real time monitoring of online vitriol toward election officials, which we again expect to increase with the onset of the 2026 midterms and subsequent federal elections. We further expect that topical analysis on social media will be made more effective by using our degrees of engagement data collection scheme, which is able to more clearly show topical relevance. Our approach to collecting our multi-level network eliminates the need to wait for previous levels to be collected and therefore reduces the loss of potential data. Another benefit of the real time collection will be the ability to keep abreast of all new topical discussion that emerge nearly instantaneously and utilize our animosity measurement as a way to detect potentially dangerous threats directed toward election officials.
Data availability statement
Materials necessary to reproduce the analyses reported in the paper are available at https://github.com/hashs-c/LEOs_Animosity.
Ethics statement
The studies involving humans were approved by California Institute of Technology, Institutional Review Board. The studies were conducted in accordance with the local legislation and institutional requirements. Written informed consent was not required, for either participation in the study or for the publication of potentially/indirectly identifying information, in accordance with the local legislation and institutional requirements. The social media data was accessed and analyzed in accordance with the platform's terms of use and all relevant institutional/national regulations.
Author contributions
SD: Conceptualization, Methodology, Writing – original draft, Writing – review & editing, Investigation, Software, Validation, Visualization. DE: Conceptualization, Data curation, Investigation, Methodology, Project administration, Resources, Software, Supervision, Validation, Visualization, Writing – original draft, Writing – review & editing. SH: Conceptualization, Investigation, Methodology, Software, Validation, Visualization, Writing – original draft, Writing – review & editing. RA: Conceptualization, Methodology, Writing – original draft, Writing – review & editing, Funding acquisition, Project administration, Resources, Supervision.
Funding
The author(s) declare that financial support was received for the research and/or publication of this article. This research was supported by NSF Grant 2126095.
Acknowledgments
SD and SH are were undergraduate students at the California Institute of Technology when they conducted the research reported here. DE was a graduate student at the California Institute of Technology when he conducted most of the research reported here. This research was presented at the 2023 Annual Meeting of the American Political Science Association, we thank participants for their feedback and comments. We thank Michelle Shafer for her assistance.
Conflict of interest
The authors declare that the research was conducted in the absence of any commercial or financial relationships that could be construed as a potential conflict of interest.
Publisher's note
All claims expressed in this article are solely those of the authors and do not necessarily represent those of their affiliated organizations, or those of the publisher, the editors and the reviewers. Any product that may be evaluated in this article, or claim that may be made by its manufacturer, is not guaranteed or endorsed by the publisher.
Supplementary material
The Supplementary Material for this article can be found online at: https://www.frontiersin.org/articles/10.3389/fpos.2025.1488363/full#supplementary-material
Footnotes
1. ^Source: The American Presidency Project, https://www.presidency.ucsb.edu/statistics/elections/2020.
2. ^See the Brennan Center for Justice's report, “Local Election Officials Survey (March 2022)”, https://www.brennancenter.org/our-work/research-reports/local-election-officials-survey-march-2022.
3. ^We note that the Perspective API is built on BERT-based model—which is a language model built on transformer architecture (Devlin et al., 2019)—across many languages. The outputs from this training process are then synthesized into a cohesive output using Convolutional Neural Nets (CNNs). Google offers more details here, https://developers.perspectiveapi.com/s/about-the-api-model-cards?language=en_US.
4. ^At this point in time, the ethical and legal provisions regarding use of LLMs to analyze social media posts are not clear. On one hand, the terms of use that were in place when we collected our Twitter/X data allow us to only share the tweet IDs to other researchers, not the posts themselves, implying that the posts should not be shared with commercial large language models. Also, university and Institutional Review Board policies at this point note that submitting data to commercial LLMs should be considered making those data public information. Thus, given these ethical and legal concerns, the use of topic modeling methods such as JST is preferred.
References
Adams-Cohen, N. J. (2020). Policy change and public opinion: Measuring shifting political sentiment with social media data. Am. Polit. Res. 48, 612–621. doi: 10.1177/1532673X20920263
Airoldi, E. M., Blei, D. M., and Fienberg, S. E. (2014). “Introduction to mixed membership models and methods,” in Handbook of Mixed Membership Models and Their Applications (Boca Raton, FL: Chapman & Hall/CRC), 37–48.
Allcott, H., Gentzkow, M., Mason, W., Wilkins, A., Barberá, P., Brown, T., et al. (2024). The effects of Facebook and Instagram on the 2020 election: a deactivation experiment. Proc. Natl. Acad. Sci. USA. 121:e2321584121. doi: 10.1073/pnas.2321584121
Ballard, A., DeTamble, R., Dorsey, S., Heseltine, M., and Johnson, M. (2022). Incivility in congressional tweets. Am. Polit. Res. 50, 769–780. doi: 10.1177/1532673X221109516
Barbera, P., Casas, A., Nagler, J., Egan, P. J., Bonneau, R., Jost, J. T., et al. (2019). Who leads? who follows? measuring issue attention and agenda setting by legislators and the mass public using social media data. Am. Polit. Sci. Rev. 113, 883–901. doi: 10.1017/S0003055419000352
Belcastro, L., Branda, F., Cantini, R., Marozzo, F., Talia, D., and Trunfio, P. (2022). Analyzing voter behavior on social media during the 2020 US Presidential election campaign. Soc. Netw. Anal. Min. 12:83. doi: 10.1007/s13278-022-00913-9
Bensel, R. F. (2004). The American Ballot Box in the Mid-Nineteenth Century. Cambridge: Cambridge University Press.
Biernacki, P., and Waldorf, D. (1981). Snowball sampling: Problems and techniques of chain referral sampling. Sociol. Methods Res. 10, 141–163. doi: 10.1177/004912418101000205
Bjornlund, E. C. (2004). Beyond Free and Fair: Monitoring Elections and Building Democracy. Washington, DC: Woodrow Wilson Center Press with Johns Hopkins University Press.
Bowden, M., and Teague, M. (2022). The Steal: The Attempt to Overturn the 2020 Election and the People Who Stopped It. New York, NY: Atlantic Monthly Press.
Branch, T. (1989). Parting the Waters: America in the King Years, 1954-63. New York, NY: Simon and Schuster.
Chen, E., Deb, A., and Ferrara, E. (2022). #election2020: the first public twitter dataset on the 2020 US Presidential election. J. Comput. Soc. Sci. 5, 1–18. doi: 10.1007/s42001-021-00117-9
Chowdhury, F. A., Saha, D., Hasan, M. R., Saha, K., and Mueen, A. (2022). “Examining factors associated with twitter account suspension following the 2020 US Presidential election,” in Proceedings of the 2021 IEEE/ACM International Conference on Advances in Social Networks Analysis and Mining, ASONAM '21 (New York, NY: Association for Computing Machinery), 607–612.
Craig, S. C., Martinez, M. D., Gainous, J., and Kane, J. G. (2006). Winners, losers, and election context: Voter responses to the 2000 presidential election. Polit. Res. Q. 59, 579–592. doi: 10.1177/106591290605900407
Daniller, A. M. (2016). Can citizens care too much? investment in election outcomes and perceptions of electoral legitimacy. Elect. Stud. 44, 151–161. doi: 10.1016/j.electstud.2016.06.013
Debnath, R., Ebanks, D., Mohaddes, K., Roulet, T., and Alvarez, R. M. (2023). Do fossil fuel firms reframe online climate and sustainability communication? A data-driven analysis. NPJ Climate Action 2:47. doi: 10.1038/s44168-023-00086-x
Devlin, J., Chang, M.-W., Lee, K., and Toutanova, K. (2019). BERT: Pre-training of deep bidirectional transformers for language understanding. arXiv [preprint] arXiv:1810.04805. doi: 10.48550/arXiv.1810.04805
Ebanks, D., Yan, H., Alvarez, R. M., Das, S., and Sinclair, B. (2025). Legislative communication and power: measuring leadership in the U.S. House of Representatives from social media data. Eur. Polit. Sci. Rev. 17, 143–166. doi: 10.1017/S1755773924000146
Edlin, R., and Baker, T. (2022). “Poll of Local Election Officials Finds Safety Fears for Colleagues” and Themselves. New York: Brennan Center for Justice.
Eggers, A. C., Garro, H., and Grimmer, J. (2021). No evidence for systematic voter fraud: a guide to statistical claims about the 2020 election. Proc. Nat. Acad. Sci. 118:e2103519118. doi: 10.1073/pnas.2103619118
Elklit, J., and Svensson, P. (1997). The rise of election monitoring: what makes elections free and fair? J. Democracy 8, 32–46. doi: 10.1353/jod.1997.0041
Fazekas, Z., Popa, S. A., Schmitt, H., Barber, P., and Theocharis, Y. (2021). Elite-public interaction on Twitter: EU issue expansion in the campaign. Eur. J. Polit. Res. 60, 376–396. doi: 10.1111/1475-6765.12402
Ferrara, E., Chang, H., Chen, E., Muric, G., and Patel, J. (2020). Characterizing social media manipulation in the 2020 U.S. presidential election. First Monday 25:11. doi: 10.5210/fm.v25i11.11431
Freeman, J. B. (2018). The Field of Blood: Violence in Congress and the Road to Civil War. New York, NY: Farrar, Straus and Giroux.
Freeman, J. R., Williams, J. T., and Lin, T.-, m. (1989). Vector autoregression and the study of politics. Am. J. Pol. Sci. 33:842. doi: 10.2307/2111112
Giachanou, A., and Crestani, F. (2016). “Tracking sentiment by time series analysis,” in Proceedings of the 39th International ACM SIGIR conference on Research and Development in Information Retrieval, SIGIR 16 (New York, NY: Association for Computing Machinery), 1037–1040
Gilardi, F., Gessler, T., Kubli, M., and Müller, S. (2022). Social media and political agenda setting. Polit. Commun. 39, 39–60. doi: 10.1080/10584609.2021.1910390
González-Bailón, S., Lazer, D., Barber, P., Zhang, M., Allcott, H., Brown, T., et al. (2023). Asymmetric ideological segregation in exposure to political news on Facebook. Science 381, 392–398. doi: 10.1126/science.ade7138
Grimmer, J., and King, G. (2011). General purpose computer-assisted clustering and conceptualization. Proc. Nat. Acad. Sci. 108, 2643–2650. doi: 10.1073/pnas.1018067108
Grimmer, J., Roberts, M., and Stewart, B. (2022). Text as Data: A New Framework for Machine Learning and the Social Sciences. Princeton: Princeton University Press.
Gross, J., Baltz, S., Suttmann-Lea, M., Merivaki, T., and Stewart, C. III. (2023). Online hostility towards local election officials surged in 2020. SSRN Elect. J. doi: 10.2139/ssrn.4351996
Guess, A. M., Malhotra, N., Pan, J., Barber, P., Allcott, H., Brown, T., et al. (2023a). How do social media feed algorithms affect attitudes and behavior in an election campaign? Science 381, 398–404. doi: 10.1126/science.abp9364
Guess, A. M., Malhotra, N., Pan, J., Barberá, P., Allcott, H., Brown, T., et al. (2023b). Reshares on social media amplify political news but do not detectably affect beliefs or opinions. Science 381, 404–408. doi: 10.1126/science.add8424
Hansen, S. W., Klemmensen, R., and Serritzlew, S. (2019). Losers lose more than winners win: Asymmetrical effects of winning and losing in elections. Eur. J. Polit. Res. 58, 1172–1190. doi: 10.1111/1475-6765.12329
Heseltine, M. (2024). Polarizing online elite rhetoric at the federal, state, and local level during the COVID-19 pandemic. Am. Polit. Res. 52, 187–202. doi: 10.1177/1532673X231220647
Heseltine, M., and Dorsey, S. (2022). Online incivility in the 2020 congressional elections. Polit. Res. Q. 75, 512–526. doi: 10.1177/10659129221078863
Hopkins, D. J., and King, G. (2010). A method of automated nonparametric content analysis for social science. Am. J. Pol. Sci. 54, 229–247. doi: 10.1111/j.1540-5907.2009.00428.x
Kalmoe, N. (2020). With Ballots and Bullets: Partisanship and Violence in the American Civil War. Cambridge: Cambridge University Press.
Kalmoe, N. P., and Mason, L. (2022). Radical American Partisanship: Mapping Violent Hostility, Its Causes, and the Consequences for Democracy. Chicago: University of Chicago Press.
Kann, C., Hashash, S., Steinert-Threlkeld, Z., and Alvarez, R. (2023). GatherTweet: a python package for collecting social media data on online events. J. Comp. Commun. 11:2. doi: 10.4236/jcc.2023.112012
Key, V. (1984). Southern Politics in State and Nation: A New Edition. University of Tennessee Press.
Keyssar, A. (2009). The Right to Vote: The Contested History of Democracy in the United States. New York City: Basic Books.
Kountouri, F., and Kollias, A. (2023). Polarizing publics in Twitter through organic targeting tactics of political incivility. Front. Polit. Sci. 5:1110953. doi: 10.3389/fpos.2023.1110953
Li, Z., Cao, J., Adams-Cohen, N., and Alvarez, R. M. (2023). “The effect of misinformation intervention: evidence from Trump's tweets and the 2020 election,” in Disinformation in Open Online Media. MISDOOM 2023. Lecture Notes in Computer Science (Cham: Springer).
Lin, C., and He, Y. (2009). “Joint sentiment/topic model for sentiment analysis,” in Proceedings of ACM International Conference on Information and Knowledge Management (CIKM-2009) (New York, NY: Association for Computing Machinery).
Lin, C., He, Y., Everson, R., and Ruger, S. (2012). Weakly supervised joint sentiment-topic detection from text. IEEE Trans. Knowl. Data Eng. 24, 1134–1145. doi: 10.1109/TKDE.2011.48
Linegar, M., Kocielnik, R., and Alvarez, R. M. (2023). Large language models and political science. Front. Polit. Sci. 5:1257092. doi: 10.3389/fpos.2023.1257092
Nyhan, B., Settle, J., Thorson, E., Wojcieszak, M., Barberá, P., Chen, A. Y., et al. (2023). Like-minded sources on Facebook are prevalent but not polarizing. Nature 623:E9. doi: 10.1038/s41586-023-06795-x
Palmer, A., and Smith, N. A. S. (2024). Using proprietary language models in academic research requires explicit justification. Nat. Comput. Sci. 4:1. doi: 10.1038/s43588-023-00585-1
Sances, M. W., and Stewart, C. III. (2015). Partisanship and confidence in the vote count: Evidence from U.S. national elections since 2000. Electoral Stud. 40, 176–188. doi: 10.1016/j.electstud.2015.08.004
Sanderson, Z., Brown, M. A., Bonneau, R., Nagler, J., and Tucker, J. A. (2021). Twitter Flagged Donald Trump's Tweets with Election Misinformation: They Continued to Spread Both on and off the Platform. Cambridge, MA: Harvard Kennedy School Misinformation Review, 2.
Schiff, A. (2023). The January 6th Report: Findings from the Select Committee to Investigate the January 6th Attack on the United States Capitol. New York: Random House.
Sinclair, B., Smith, S. S., and Tucker, P. D. (2018). It's largely a rigged system: Voter confidence and the winner effect in 2016. Polit. Res. Q. 71, 854–868. doi: 10.1177/1065912918768006
So, L., and Szep, J. (2021). Threatened U.S. Election Workers Get Little Help From Law Enforcement. Toronto: Reuters.
Thelwall, M., Buckley, K., and Paltoglou, G. (2011). Sentiment strength detection for the social web. J. Am. Soc. Inform. Sci. Technol. 63, 163–173. doi: 10.1002/asi.21662
Keywords: election officials, topic modeling, social media, election administration, sentiment analysis
Citation: Dey S, Ebanks D, Hashash S and Alvarez RM (2025) Detecting and measuring social media attacks on American election officials. Front. Polit. Sci. 7:1488363. doi: 10.3389/fpos.2025.1488363
Received: 29 August 2024; Accepted: 15 April 2025;
Published: 26 May 2025.
Edited by:
Régis Dandoy, Universidad San Francisco de Quito, EcuadorReviewed by:
Milad Taleby Ahvanooey, Warsaw University of Technology, PolandMaud Reveilhac, University of Zurich, Switzerland
Copyright © 2025 Dey, Ebanks, Hashash and Alvarez. This is an open-access article distributed under the terms of the Creative Commons Attribution License (CC BY). The use, distribution or reproduction in other forums is permitted, provided the original author(s) and the copyright owner(s) are credited and that the original publication in this journal is cited, in accordance with accepted academic practice. No use, distribution or reproduction is permitted which does not comply with these terms.
*Correspondence: Daniel Ebanks, ZGViYW5rc0BjYWx0ZWNoLmVkdQ==