 Shaobo Guo1,2,3
 Wenhui Zhu1,2,3
 Likai Yu1,2,3,4
 Lishi Jie1,2,3,4Di Tian1,2,3,4Tianci Zhao1,3Biqing Zhao1,3
 Biao Zhang1,3*
- 1The Affiliated Hospital of Nanjing University of Chinese Medicine, Department of Geriatrics, Nanjing, China
- 2Key Laboratory for Metabolic Diseases in Chinese Medicine, First College of Clinical Medicine, Nanjing University of Chinese Medicine, Nanjing, China
- 3Jiangsu Province Hospital of Chinese Medicine, Department of Geriatrics, Nanjing, China
- 4The Affiliated Hospital of Nanjing University of Chinese Medicine, Department of Orthopedics, Nanjing, China
Background: Previous studies have shown that lifestyle was associated with depression. Thus, the aim of this study was to examine the causality between multiple lifestyles and depression by Mendelian randomization (MR) analysis.
Methods: The single-nucleotide polymorphisms (SNPs) of depression, alcoholic drinks per week, sleeplessness or insomnia, body mass index (BMI), mood swings, weekly usage of mobile phone in the last 3 months, beef intake, cooked vegetable intake, and “smoking status: never” were acquired from the Integrative Epidemiology Unit Open genome-wide association study database. Causal effects of eight exposure factors and depression were investigated using MR-Egger, weighted median, inverse variance weighted (IVW), simple mode, and weighted mode, and results were primarily referred to IVW. Subsequently, univariable MR (UVMR) analysis was performed on eight exposure factors and depression, separately. In addition, sensitivity analysis, including heterogeneity test, horizontal pleiotropy, and leave-one-out (LOO) methods, was conducted to evaluate the stability of MR results. Furthermore, multivariable MR (MVMR) analysis was carried out.
Results: UVMR analysis revealed that all eight exposure factors were causally associated with depression; alcoholic drinks per week, sleeplessness or insomnia, BMI, mood swings, weekly usage of mobile phone in the last 3 months, and cooked vegetable intake were risk factors, and beef intake and “smoking status: never” were protection factors. Heterogeneity tests revealed no heterogeneity for alcoholic drinks per week, sleeplessness or insomnia, mood swings, weekly usage of mobile phone in the last 3 months, and cooked vegetable intake. Meanwhile, there was no horizontal pleiotropy in UVMR, and LOO analysis verified that univariable analysis results were reliable. Moreover, MVMR analysis indicated that mood swings and weekly usage of mobile phone in the last 3 months were risk factors, and beef intake was a protection factor for depression when multiple factors occurred at the same time.
Conclusion: Alcoholic drinks per week, sleeplessness or insomnia, BMI, mood swings, weekly usage of mobile phone in the last 3 months, and cooked vegetable intake were risk factors, and beef intake and “smoking status: never” were protection factors. In addition, mood swings, weekly usage of mobile phone in the last 3 months, and beef intake had a direct effect on depression when multiple factors occurred simultaneously.
1 Introduction
Depression is a common illness that significantly limits social and psychological functioning and reduces the quality of life (1). More than 300 million people worldwide suffer from depression, making it a significant public health issue that imposes a global burden (2, 3). Depression was ranked as the fourth-leading cause of disease burden in 2000 (4). Mild depression manifests as persistent sadness, loss of interest or pleasure, and feelings of worthlessness. Severe depression, on the other hand, is characterized by recurrent suicidal tendencies (5).
The interplay of genes, biological factors, and the environment leads to the onset of depression (6). Compared to men, women have a higher prevalence of depression (7). Lifestyle is closely related to health; a healthy lifestyle promotes feelings of happiness and reduces feelings of displeasure and misery. Analyses of the correlation between lifestyle and the incidence of depressive symptoms suggest that lifestyle and its various dimensions are related to the onset of depressive symptoms (8). Excessive alcohol consumption increases the risk of depression (9). However, moderate drinking can mitigate or suppress the impact of stress on depression (10). Smoking increases the risk of developing depression (11). Diet and health are closely related, and healthy eating habits can reduce the risk of depression (12). Additionally, there is a close relationship between body mass index (BMI) and depression, with obese individuals being more prone to depression (13). Sleep disturbances are linked to many mental illnesses. Insomnia is a risk factor for depression (14), and sleep interventions can be beneficial in alleviating clinical depressive symptoms (15). Studies have found that frequent mobile phone use is a risk factor for adverse mental health outcomes in young people over a 1-year follow-up (16).
Mendelian randomization (MR) is a method that uses genetic instrumental variables (IVs) to assess the causal direction between exposure and outcome, and it is unaffected by confounding factors and reverse causality (17, 18). In the face of clinical research where randomized controlled trials (RCTs) are challenging to conduct, including but not limited to impractical and unethical RCT studies, MR can strengthen the inference of direct causal relationships between exposure factors and diseases, while avoiding difficult RCT studies (17). Recently, there has been a surge in MR articles related to depression, but most of the content focuses on the application of biomarkers, with few causal studies on various lifestyle factors and depression. In particular, there is a lack of multivariate MR (MVMR) research on the role of various lifestyle factors in depression (19). Therefore, this paper is devoted to study the causal relationships of various lifestyles and depression by means of univariate and multivariate methods. The univariable MR (UVMR) analysis evaluates the influence of a single predictor variable on the outcome (20). MVMR is an extension of UVMR that estimates the direct causal effect of each exposure factor on the outcome, taking into account the pleiotropy among multiple variables (21).
This study, based on single-nucleotide polymorphism (SNP) data of depression and exposure factors (eight lifestyle factors) from public databases, employed both UVMR and MVMR methods to investigate the causal relationship between different lifestyles and depression. Sensitivity analyses were conducted to assess the impact of assumptions on the study findings and to ensure the robustness of the results. From a genetic perspective, this research explored the potential roles of various lifestyles in the progression of depression.
2 Materials and methods
2.1 Source of data
The datasets of depression (finn-b-F5_ DEPRESSIO), alcoholic drinks per week (ieu-b-73), sleeplessness or insomnia (ukb-a-13), BMI (ukb-a-248), mood swings (ebi-a-GCST006944), weekly usage of mobile phone in the last 3 months (ukb-b-17999), beef intake (ukb-b-2862), cooked vegetable intake (ukb-b-8089), and “smoking status: never” (ukb-d-20116_0) were retrieved from the Integrative Epidemiology Unit (IEU) Open Genome-Wide Association Study (GWAS) database (https://gwas.mrcieu.ac.uk/). The finn-b-F5_ DEPRESSIO dataset included 16,380,457 SNPs from 215,644 samples. The ieu-b-73 dataset included 11,887,865 SNPs from 335,394 samples. The ukb-a-13 dataset included 10,894,596 SNPs from 336,965 samples. The ukb-a-248 dataset included 10,894,596 SNPs from 336,107 samples. The ebi-a-GCST006944 dataset included 10,894,596 SNPs from 329,428 samples. The ukb-b-17999 dataset included 9,851,867 SNPs from 386,626 samples. The ukb-b-2862 dataset included 9,851,867 SNPs from 461,053 samples. The ukb-b-8089 dataset included 9,851,867 SNPs from 448,651 samples. The ukb-d-20116_0 dataset included 13,586,591 SNPs from 359,706 samples. Details of the above datasets are given in Table 1.
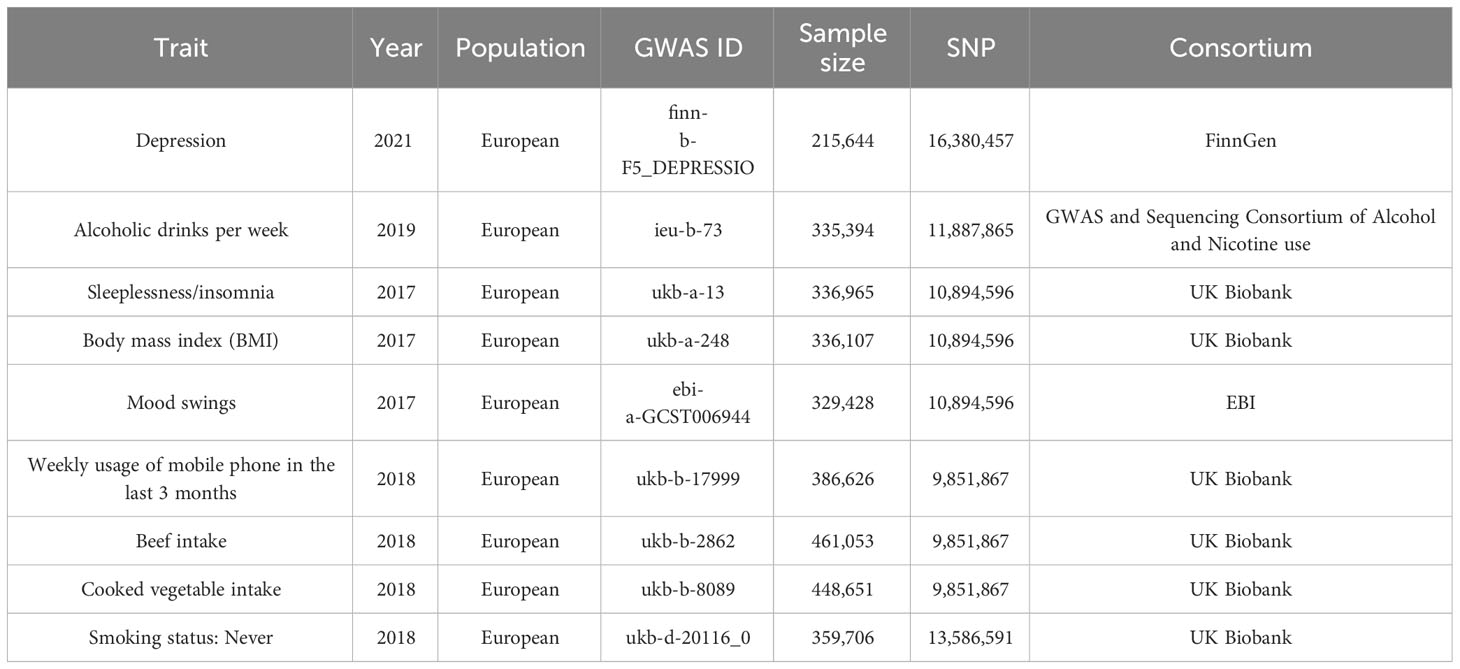
Table 1 Detailed information about the datasets.
2.2 Pre-processing of data
The adjusted p-values of the forward and reverse MR analysis results were calculated by the false discovery rate (FDR) method. The reading and filtering of exposure factors was carried out via the extract_instruments function of the TwoSampleMR package (p < 5×10⁻⁸) (22) in forward MR analysis. In the reverse MR analysis, IVs with significant correlation with exposure factors were found through p < 5×10⁻⁶. IVs were removed using linkage disequilibrium analysis (LDA) (r2 = 0.001 and kb = 10,000). Three basic premises underlie UVMR studies (1): a robust and significant correlation existed between exposures and IVs (2); IVs were not related to confounding factors; and (3) IVs could only influence outcomes through exposure and not through other channels. Three hypotheses of the MVMR require consideration of all exposures: (1) in the case of other exposures given, SNPs were strongly correlated with the remaining exposures. (2) In conditions that give all exposures, SNPs and outcomes were independent. (3) SNPs were independent of all confounding (23).
2.3 UVMR analysis and sensitivity analysis
Firstly, genetic correlation between exposure factors and outcome was calculated using the ldscr package. Then, five diverse MR methods, MR-Egger (24), weighted median (25), inverse variance weighted (IVW) (26), simple mode, and weighted mode (22, 27), were adopted to explore the causality of eight exposure factors with depression, the most important of which was IVW. In addition, odds ratio (OR) was calculated, and OR > 1 indicated that exposure factor was a risk factor, while OR < 1 revealed that exposure factor was a protection factor. Results were presented using scatter plots, forest plots, and funnel plots. Moreover, sensitivity analysis was conducted to evaluate the reliability of UVMR results. First, heterogeneity test was conducted by Cochran’s Q test. Namely, there was no heterogeneity when the p-value was greater than 0.05 in Cochran’s Q test. If there was heterogeneity (p < 0.05), the IVW test was performed for random effects. Secondly, the horizontal pleiotropy test was performed via TwoSampleMR function mr_pleiotropy_test in R, and if p > 0.05, it indicated no horizontal pleiotropy, meaning that there were no confounding factors in the study. In addition, horizontal pleiotropy was further validated using MR-Egger analysis (28). Finally, leave-one-out (LOO) analysis was conducted by gradually eliminating each SNP, and if the effect of the remaining SNPs on the outcome variable did not change significantly, this indicates that the results of MR analysis was reliable.
2.4 Multivariable MR analysis
In order to detect causal relations between eight exposure factors and depression at the multivariate level, the TwoSampleMR package was utilized to harmonize effect equivalents and effect sizes followed by MVMR analysis. Multiple exposure factor IVs were filtered by the mv_lasso_feature_selection function. Then, ORs were computed as before.
3 Results
3.1 Genetic correlation
The gene correlation between eight exposure factors and outcome was calculated. The results revealed that BMI (rg = 0.102, p < 0.001), sleeplessness_insomnia (rg = 0.372, p < 0.001), mood swings (rg = 0.318, p = 0.002), weekly usage of mobile phone in the last 3 months (rg = 0.209, p < 0.001), alcoholic drinks per week (rg = 0.118, p < 0.001), and cooked vegetable intake (rg = 0.0579, p = 0.049) and depression had positive genetic correlations, while beef intake (rg = −0.171, p < 0.001) and “smoking status: never” (rg = −0.324, p< 0.001) showed an inverse genetic association.
3.2 Eight exposure factors were significantly causally associated with depression
Following screening, 34 IVs for alcoholic drinks per week, 28 IVs for sleeplessness or insomnia, 297 IVs for BMI, 40 IVs for mood swings, 10 IVs for weekly usage of mobile phone in the last 3 months, 14 IVs for beef intake, 11 IVs for cooked vegetable intake, and 76 IVs for “smoking status: never” were obtained (Supplementary Tables 1–8). The IVW method revealed a causal relationship between alcoholic drinks per week (adj.p = 0.015, OR = 1.484), sleeplessness or insomnia (adj.p = 0.009, OR = 1.873), BMI (adj.p = 0.031, OR = 1.104), mood swings (adj.p < 0.001, OR = 2.099), weekly usage of mobile phone in the last 3 months (adj.p = 0.021, OR = 1.799), cooked vegetable intake (adj.p = 0.021, OR = 2.508), beef intake (adj.p < 0.001, OR = 0.224), and “smoking status: never” (adj.p < 0.001, OR = 0.515) and depression (Figure 1). Scatter plots for alcoholic drinks per week, sleeplessness or insomnia, BMI, mood swings, weekly usage of mobile phone in the last 3 months, and cooked vegetable intake had positive slopes, suggesting that they were risk factors, while beef intake and “smoking status: never” had negative slopes, indicating that they were protection factors for depression (Figures 2A–H). The symmetrical distribution of the samples along both sides of the IVW line in the funnel plot revealed that UVMR analysis results conforms to the second law of MR grouping (Figures 3A–H). The results of forest plots were consistent with the previous results (Figures 4A–H).
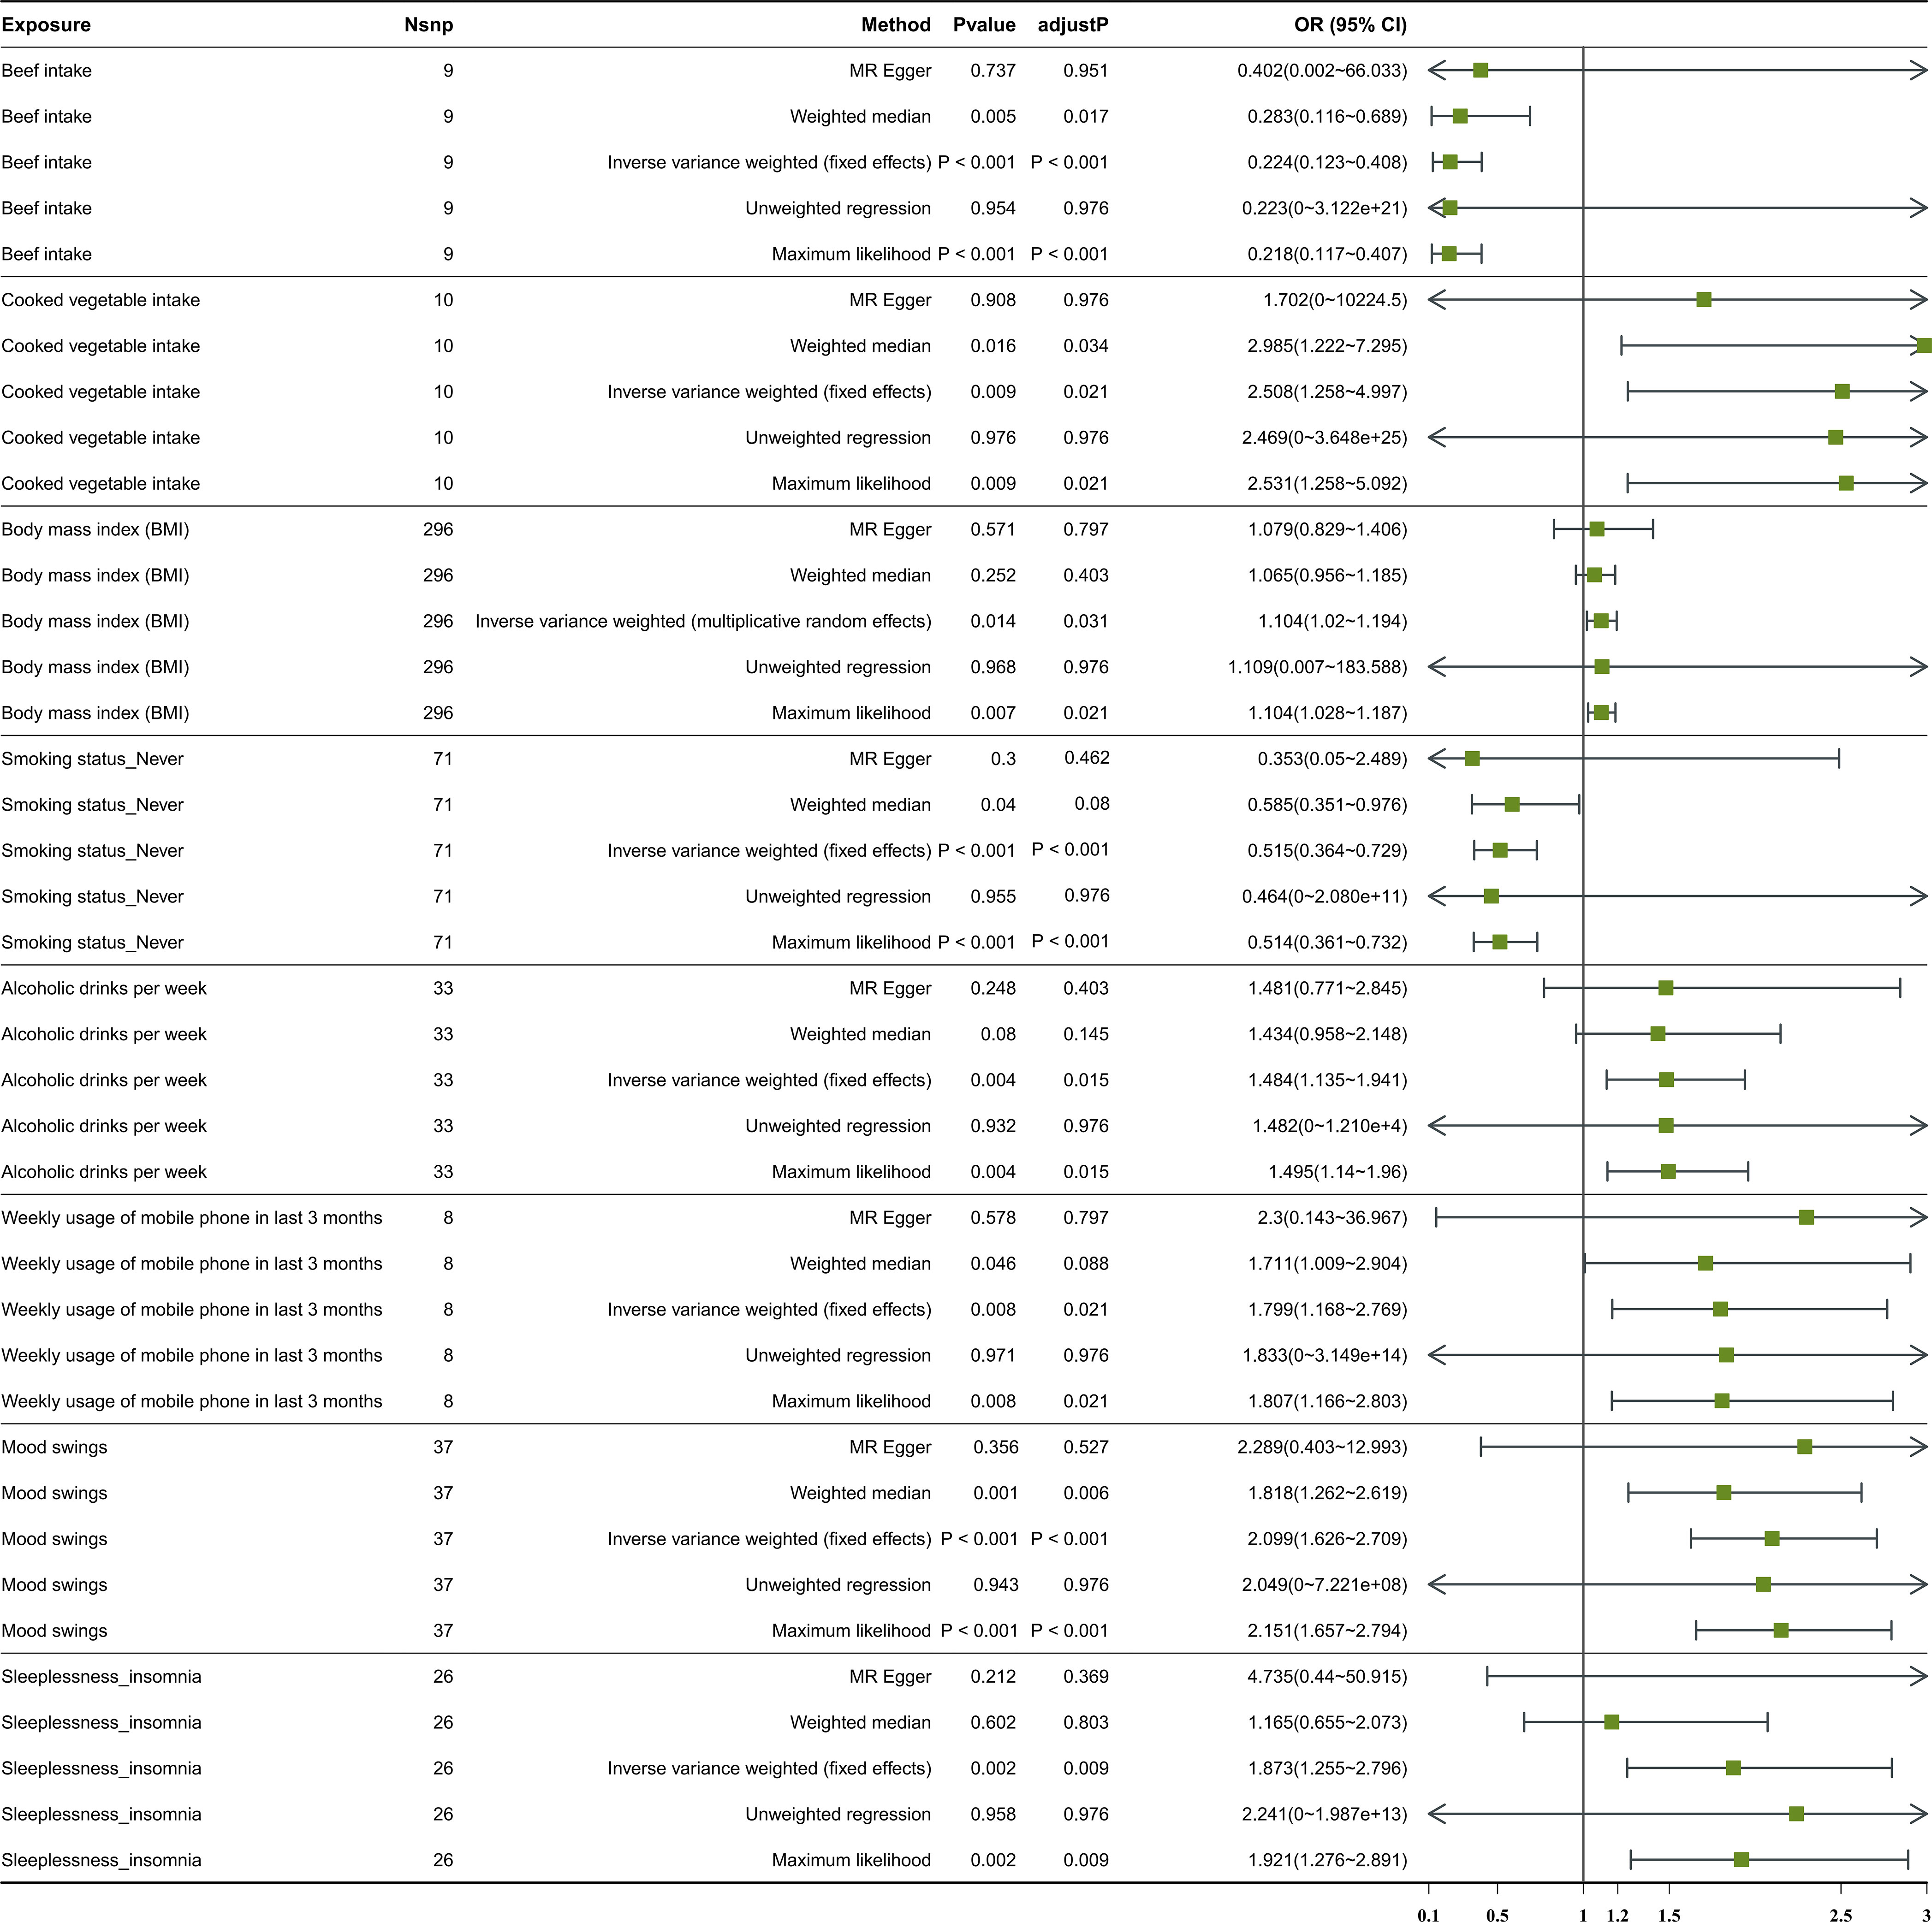
Figure 1 The forest plot of studies that evaluated the causal effect between exposures and depression using values obtained by the IVW MR method. Nsnp stands for the number of SNPs. An OR value greater than 1 indicates a risk factor, whereas a value less than 1 suggests a protective factor. This is in reference to a binary variable. IVW, inverse variance weighted; MR, Mendelian randomization; SNPs, single-nucleotide polymorphisms; OR, odds ratio; CI, confidence interval.
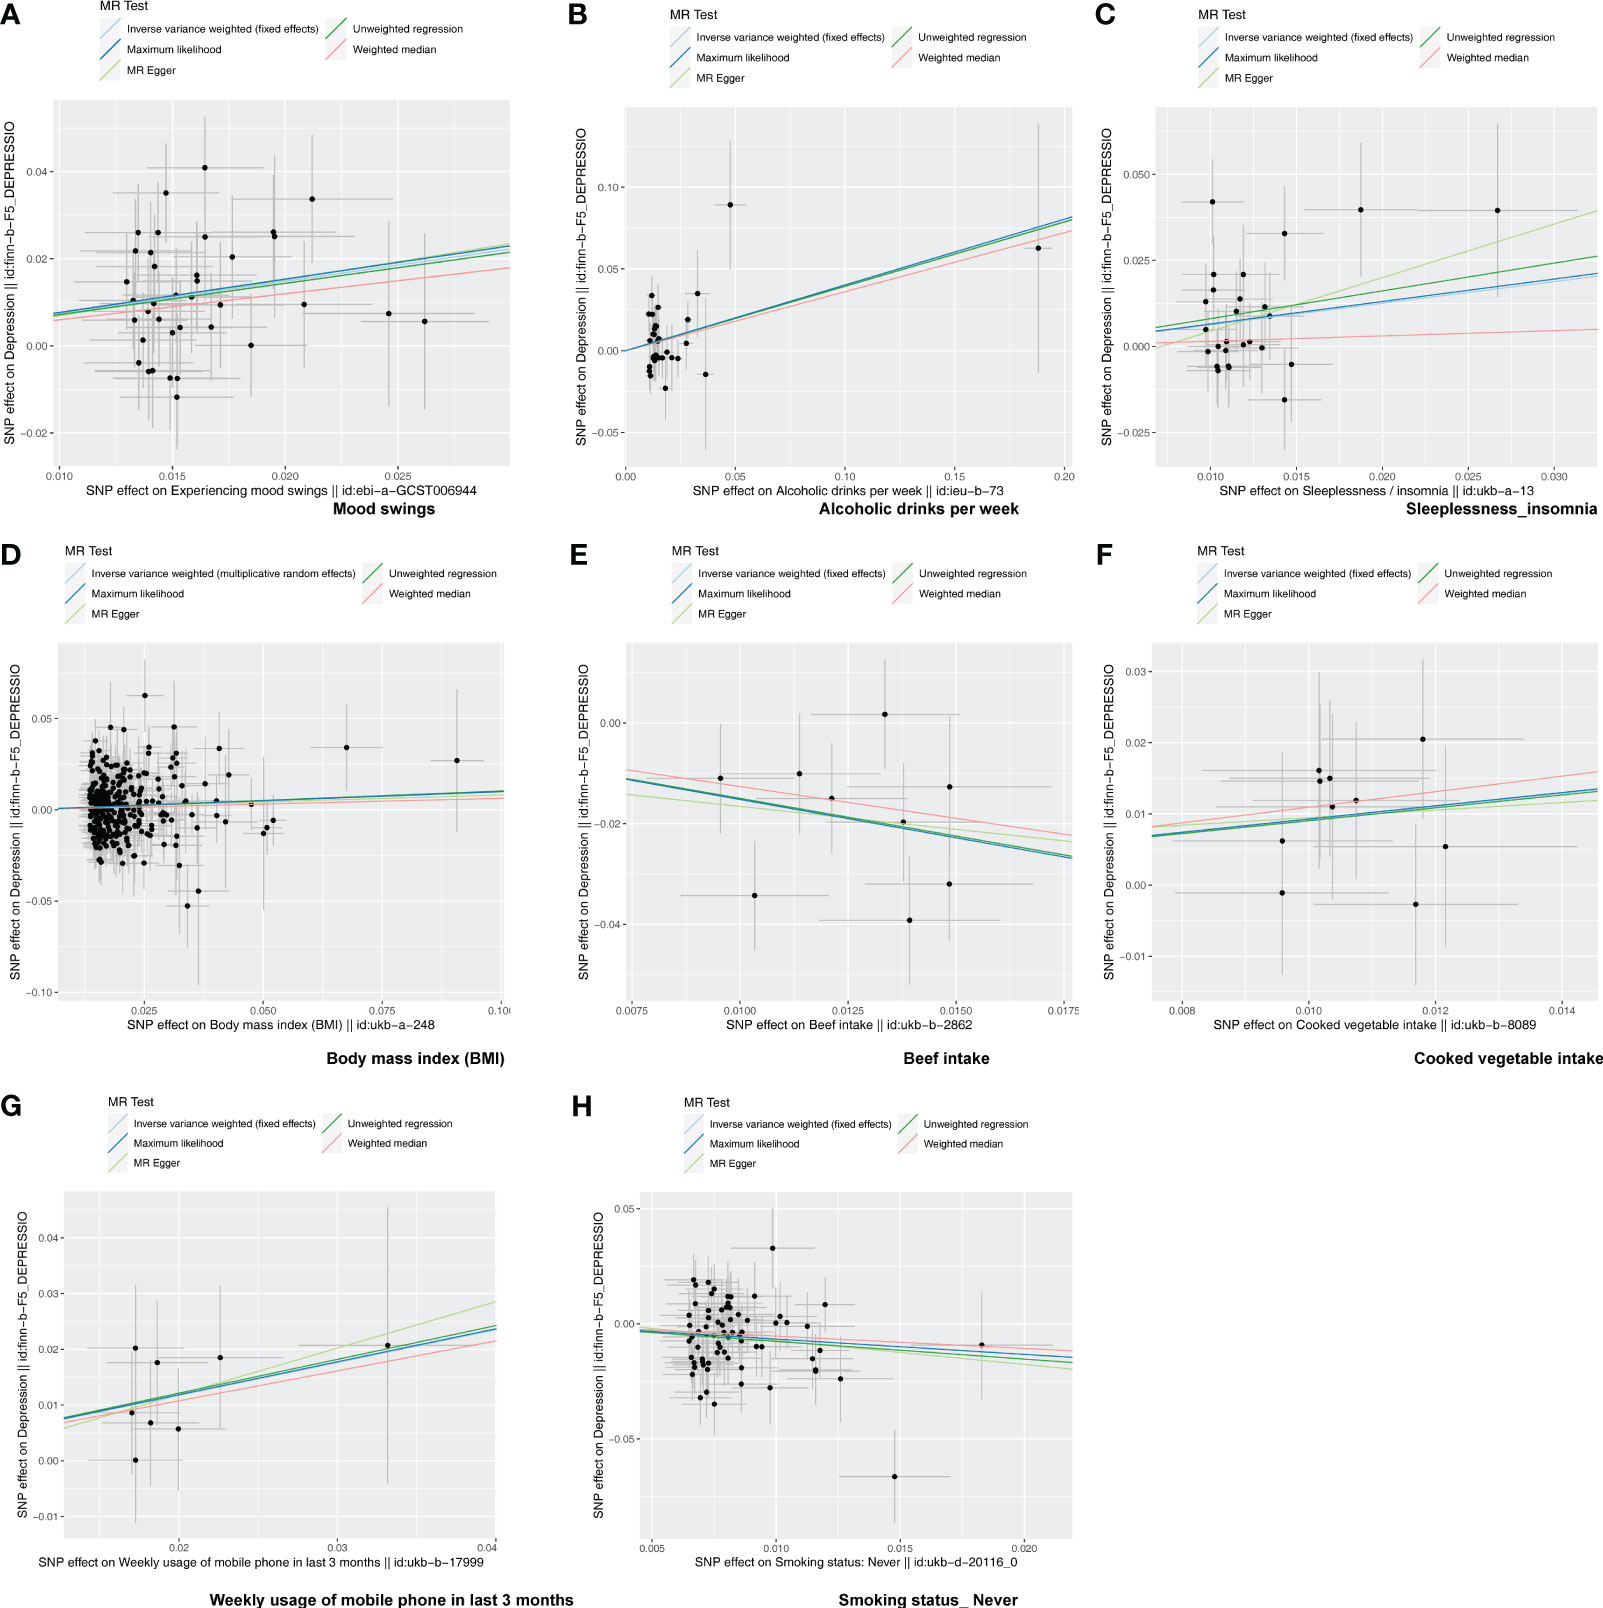
Figure 2 The scatter plot of MR analysis. (A–H) Scatter plots for the causal association between depression and mood swings (A), alcoholic drinks per week (B), sleeplessness/insomnia (C), body mass index (D), beef intake (E), cooked vegetable intake (F), weekly usage of mobile phone in the last 3 months (G), and “smoking status: never” (H). Each point on the graph represents an SNP locus. The x-axis represents the effect of the SNP on the exposure, while the y-axis represents the effect of the SNP on the outcome. The colored lines represent the fit results of different MR algorithms. A positive slope of the line indicates a risk factor, while a negative slope indicates a protective factor.
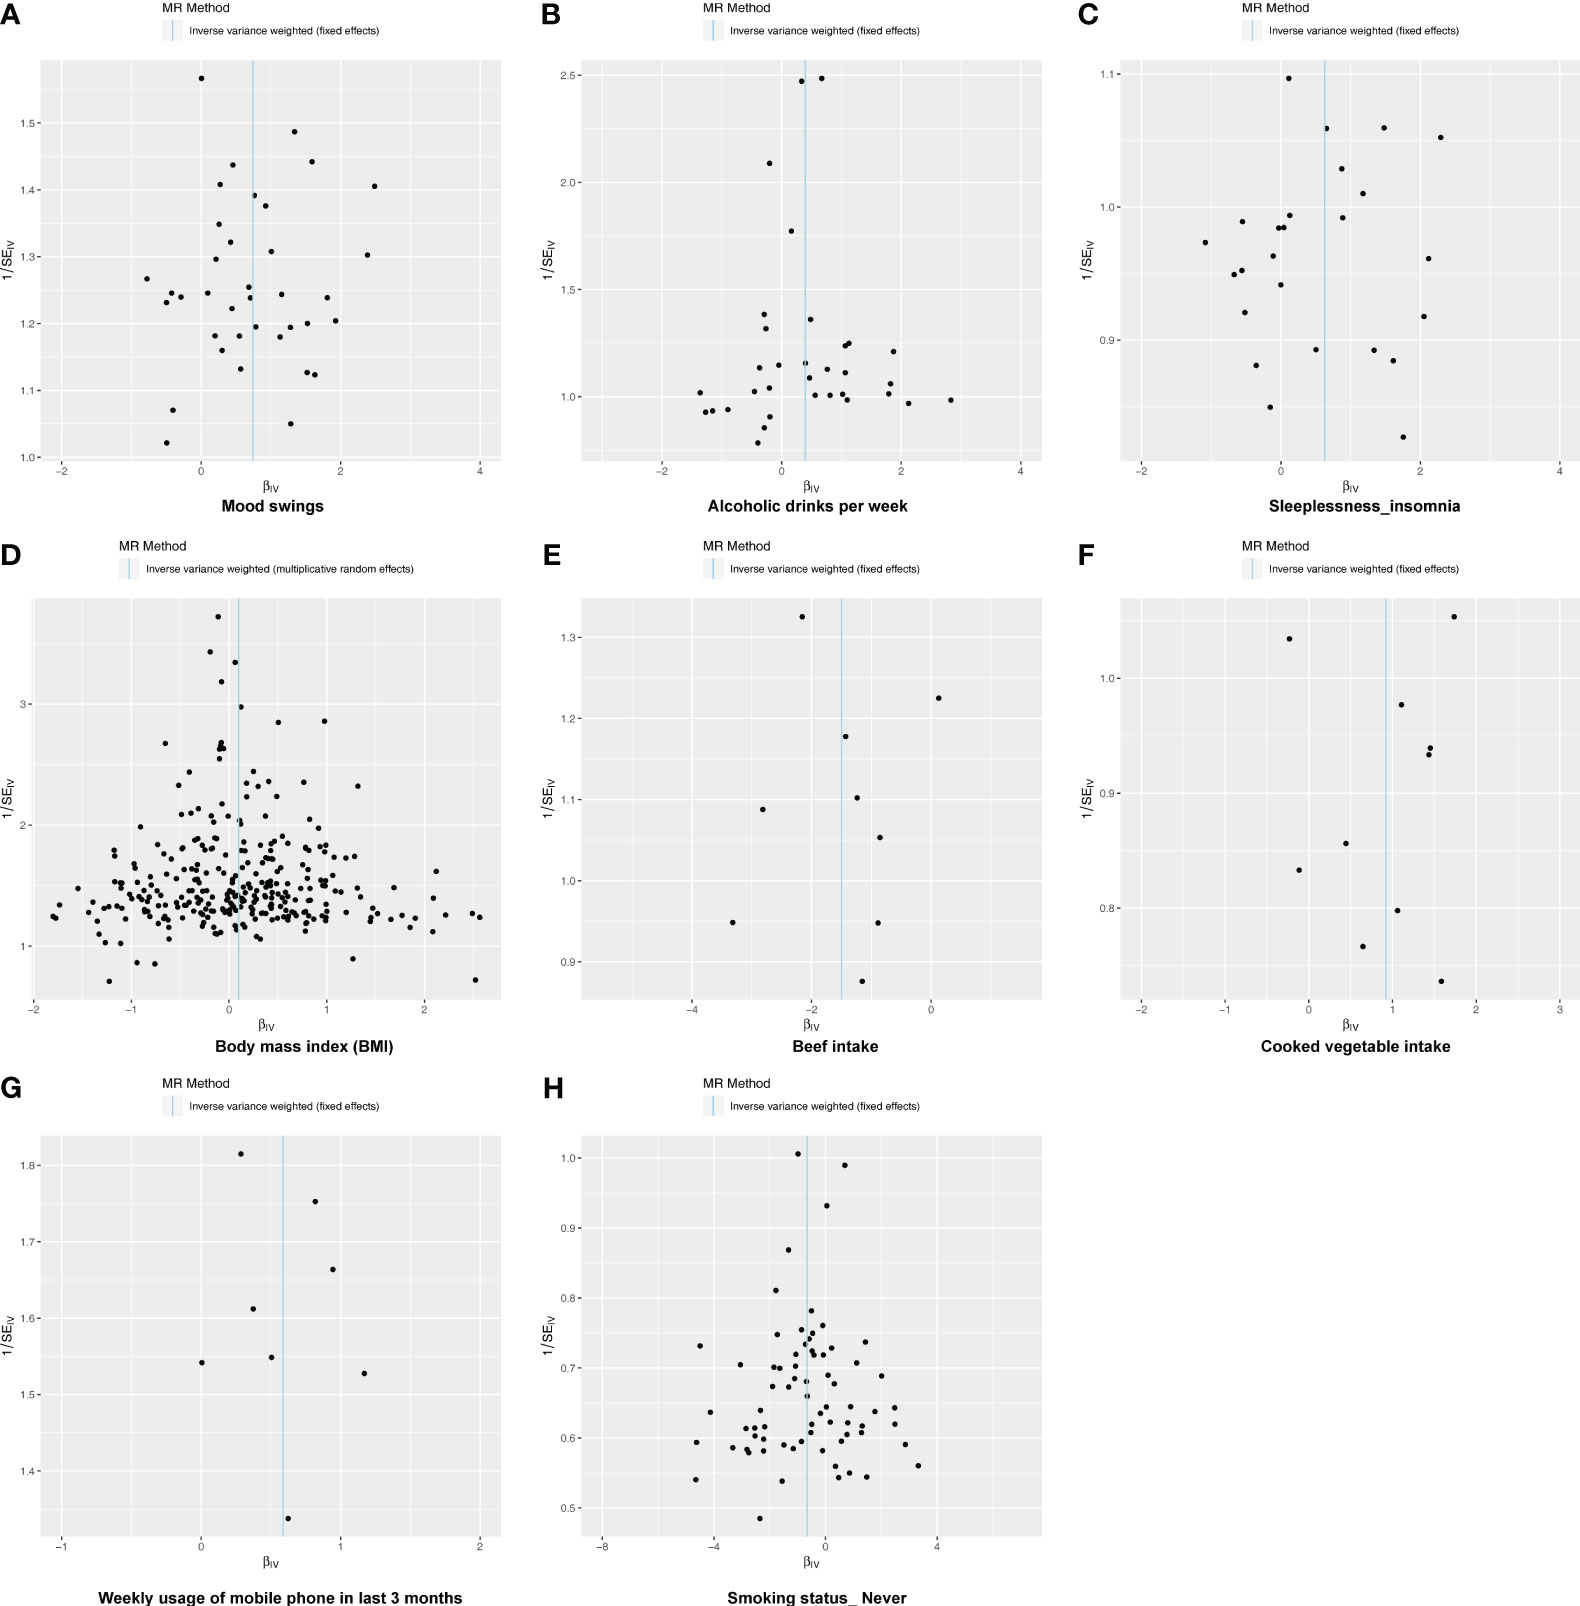
Figure 3 The funnel plot of MR analysis. (A–H) Funnel plots to show the overall heterogeneity of MR analysis for the effect of mood swings (A), alcoholic drinks per week (B), sleeplessness/insomnia (C), body mass index (D), beef intake (E), cooked vegetable intake (F), weekly usage of mobile phone in the last 3 months (G), and “smoking status: never” (H) on depression. If samples are symmetrically distributed on both sides of the IVW line, then the MR conforms to Mendel’s second law of random assortment.
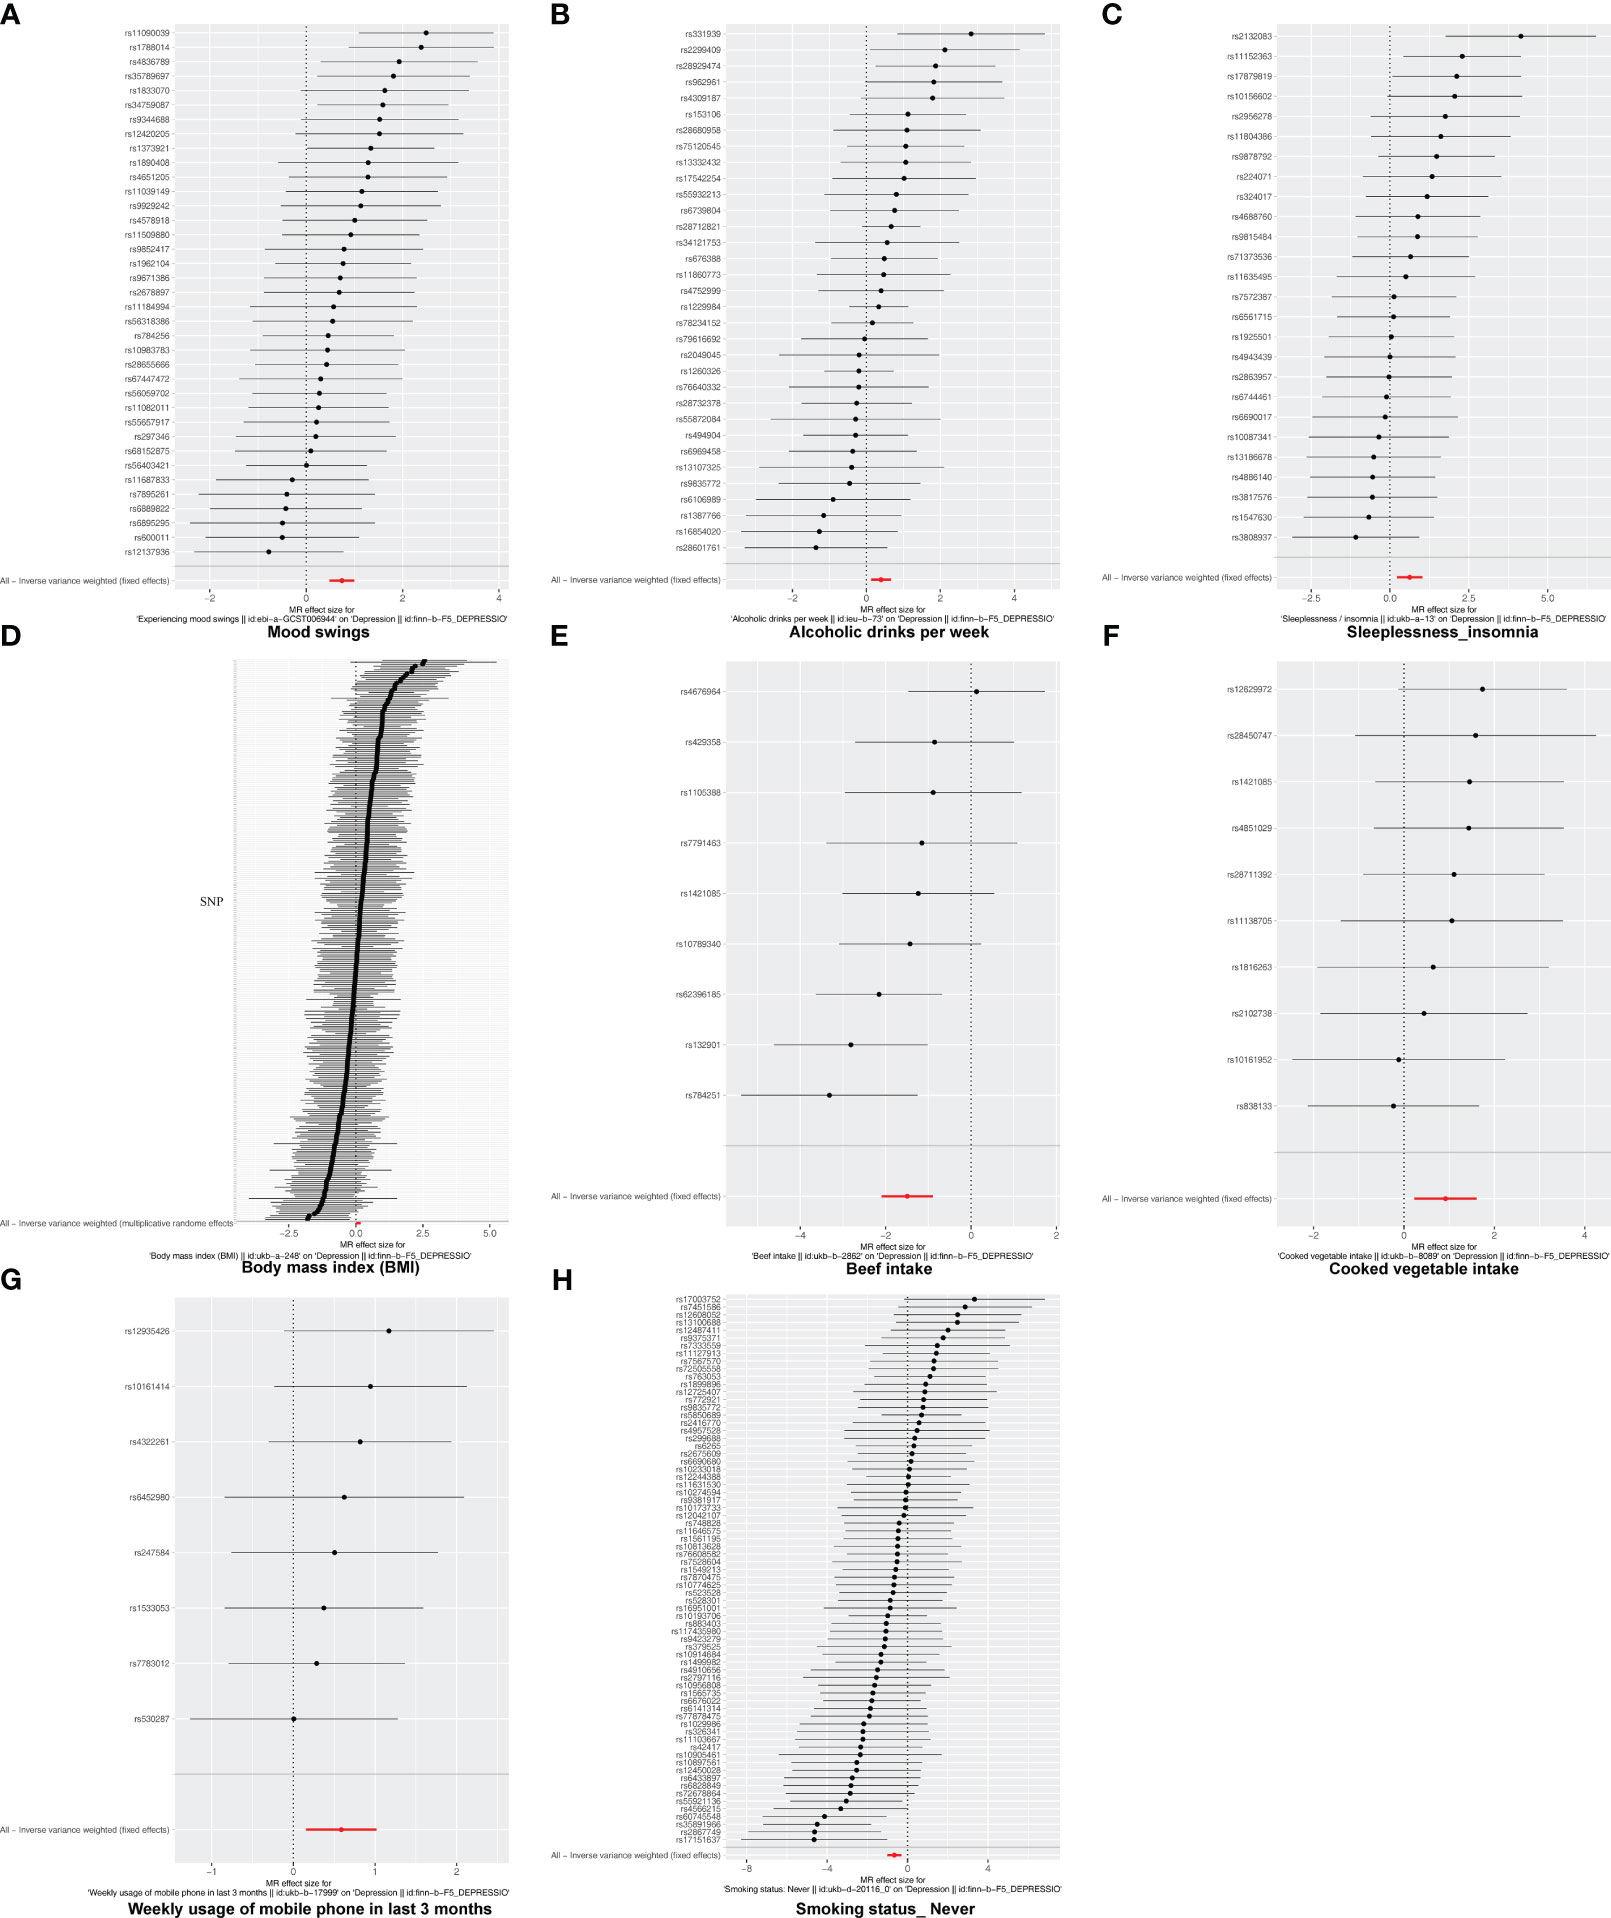
Figure 4 The forest plot of studies that determined the diagnostic efficacy between exposures and depression using values obtained by the IVW MR method. (A) Mood swings; (B) alcoholic drinks per week; (C) sleeplessness/insomnia; (D) body mass index; (E) beef intake; (F) cooked vegetable intake; (G) weekly usage of mobile phone in the last 3 months; (H) “smoking status: never”. Solid points on the left indicate a reduction, while those on the right indicate an increase.
3.3 Sensitivity analysis of eight exposure factors revealed UVMR analysis results were reliable
In this study, there was no heterogeneity for alcoholic drinks per week (p = 0.070), sleeplessness or insomnia (p = 0.106), mood swings (p = 0.129), weekly usage of mobile phone in the last 3 months (p = 0.267), and cooked vegetable intake (p = 0.902) as exposure factors, respectively (Table 2). The heterogeneity test results for BMI (p = 0.006), beef intake (p = 0.022), and “smoking status: never” (p = 0.002) showed that p was less than 0.05 in Cochran’s Q test, but p < 0.05 in IVW and so it did not affect the results (Table 1) and all p-values in MR-Egger analysis were greater than 0.05 (Figure 1). Horizontal pleiotropy showed that there was no horizontal pleiotropy between eight exposure factors and depression (p > 0.05, Table 3). Furthermore, there were no points of serious bias in the results of LOO analysis, indicating that the results were reliable (Figures 5A–H). Thus, eight exposure factors, alcoholic drinks per week, sleeplessness or insomnia, BMI, mood swings, weekly usage of mobile phone in the last 3 months, beef intake, cooked vegetable intake, and “smoking status: never”, were causally associated with the occurrence of depression.
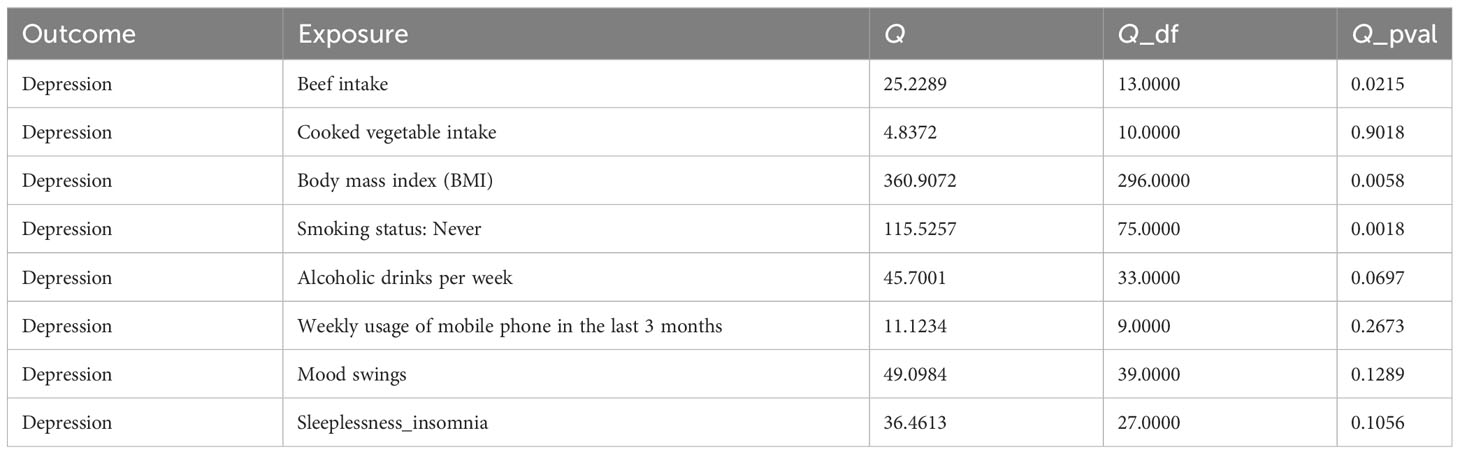
Table 2 Heterogeneity test between eight exposure factors and depression.
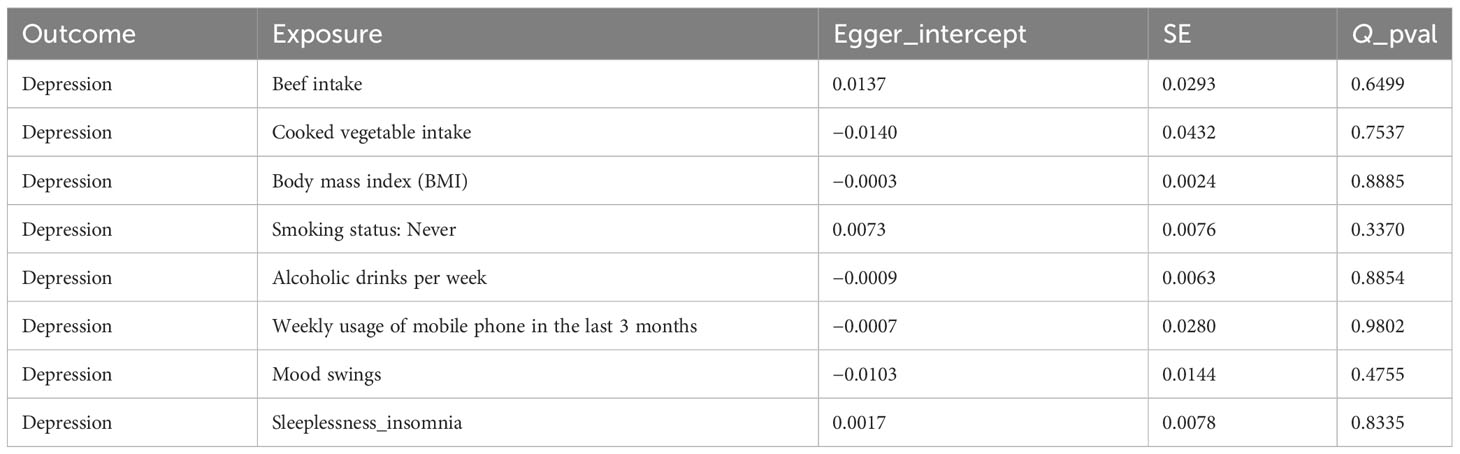
Table 3 Horizontal pleiotropy test between eight exposure factors and depression.
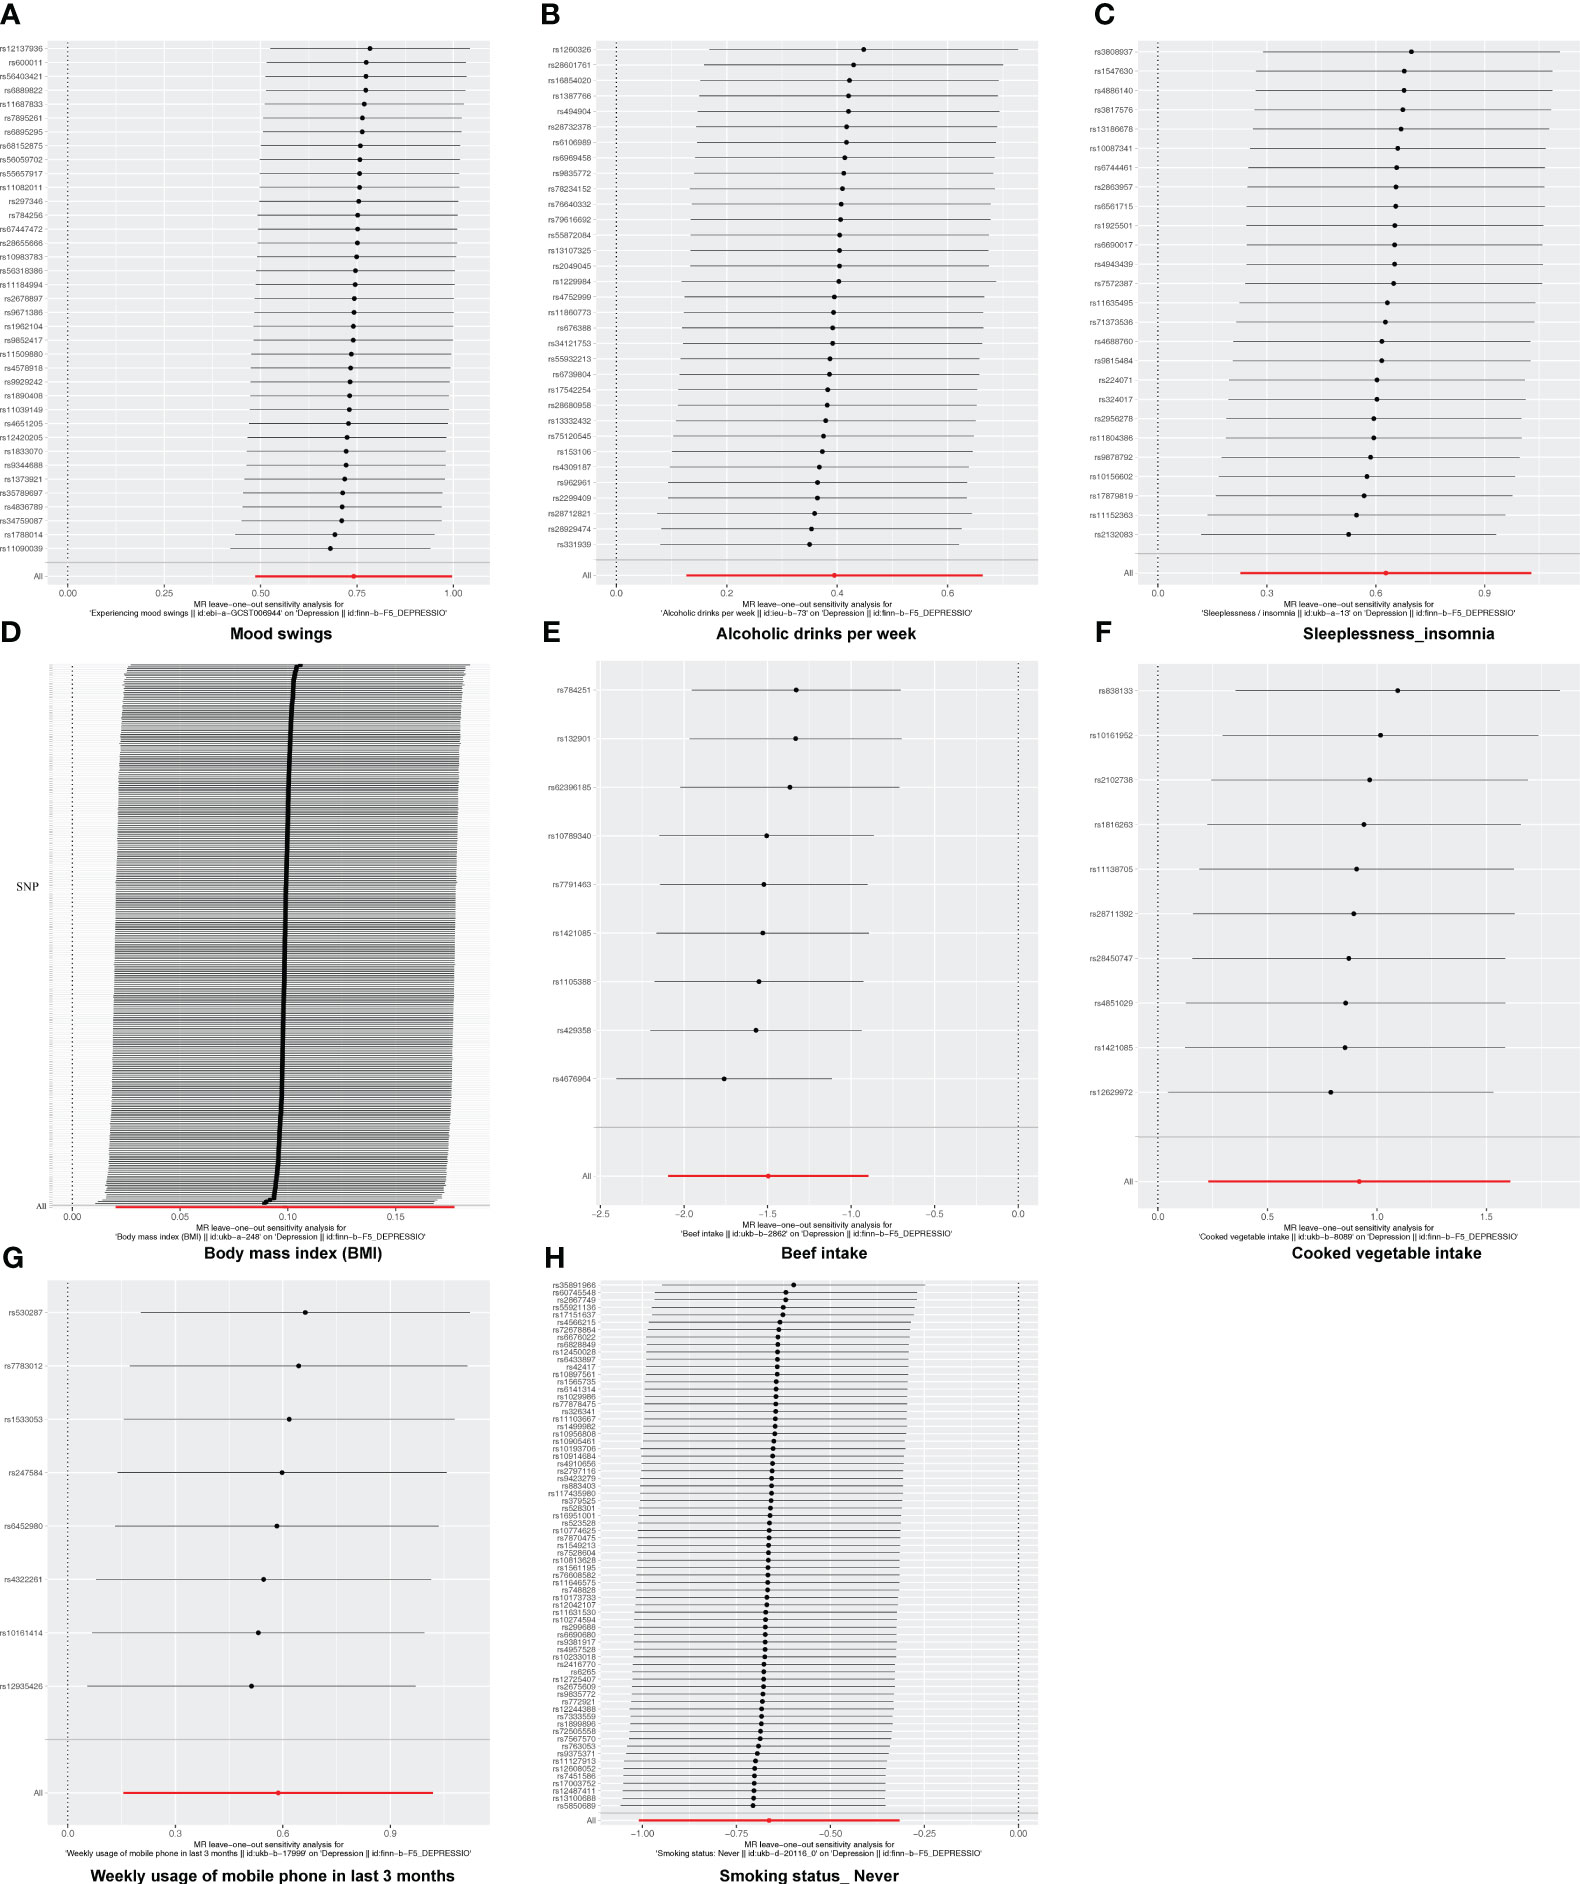
Figure 5 The leave-one-out analysis of MR analysis. (A) Mood swings; (B) alcoholic drinks per week; (C) sleeplessness/insomnia; (D) body mass index; (E) beef intake; (F) cooked vegetable intake; (G) weekly usage of mobile phone in the last 3 months; (H) “smoking status: never”.
3.4 No causal relationship between depression and eight exposure factors based on reverse MR analysis
Since the relationship between exposure factors and outcome was not one-way and may be two-way, reverse MR analysis was performed to further confirm the causal relationship between depression and eight lifestyle types. The results revealed that there was no significant causal relationship between the eight outcomes and exposure factor (depression), which further confirmed the relationship between the eight lifestyles and the risk of depression (Supplementary Figure 1).
3.5 Mood swings, weekly usage of mobile phone in the last 3 months, and beef intake had a direct effect on depression when multiple factors occurred simultaneously
Following screening, 141 SNPs from six exposure factors, alcoholic drinks per week, sleeplessness or insomnia, mood swings, weekly usage of mobile phone in the last 3 months, beef intake, and “smoking status: never”, were utilized as IVs for the MVMR analysis. MVMR analysis suggested that mood swings (p = 0.001, OR = 1.737) and weekly usage of mobile phone in the last 3 months (p = 0.013, OR = 1.619) were risk factors and beef intake (p = 0.015, OR = 0.490) was a protection factor. Moreover, mood swings, weekly usage of mobile phone in the last 3 months and beef intake had a direct effect on depression when multiple factors occurred simultaneously (Figure 6).
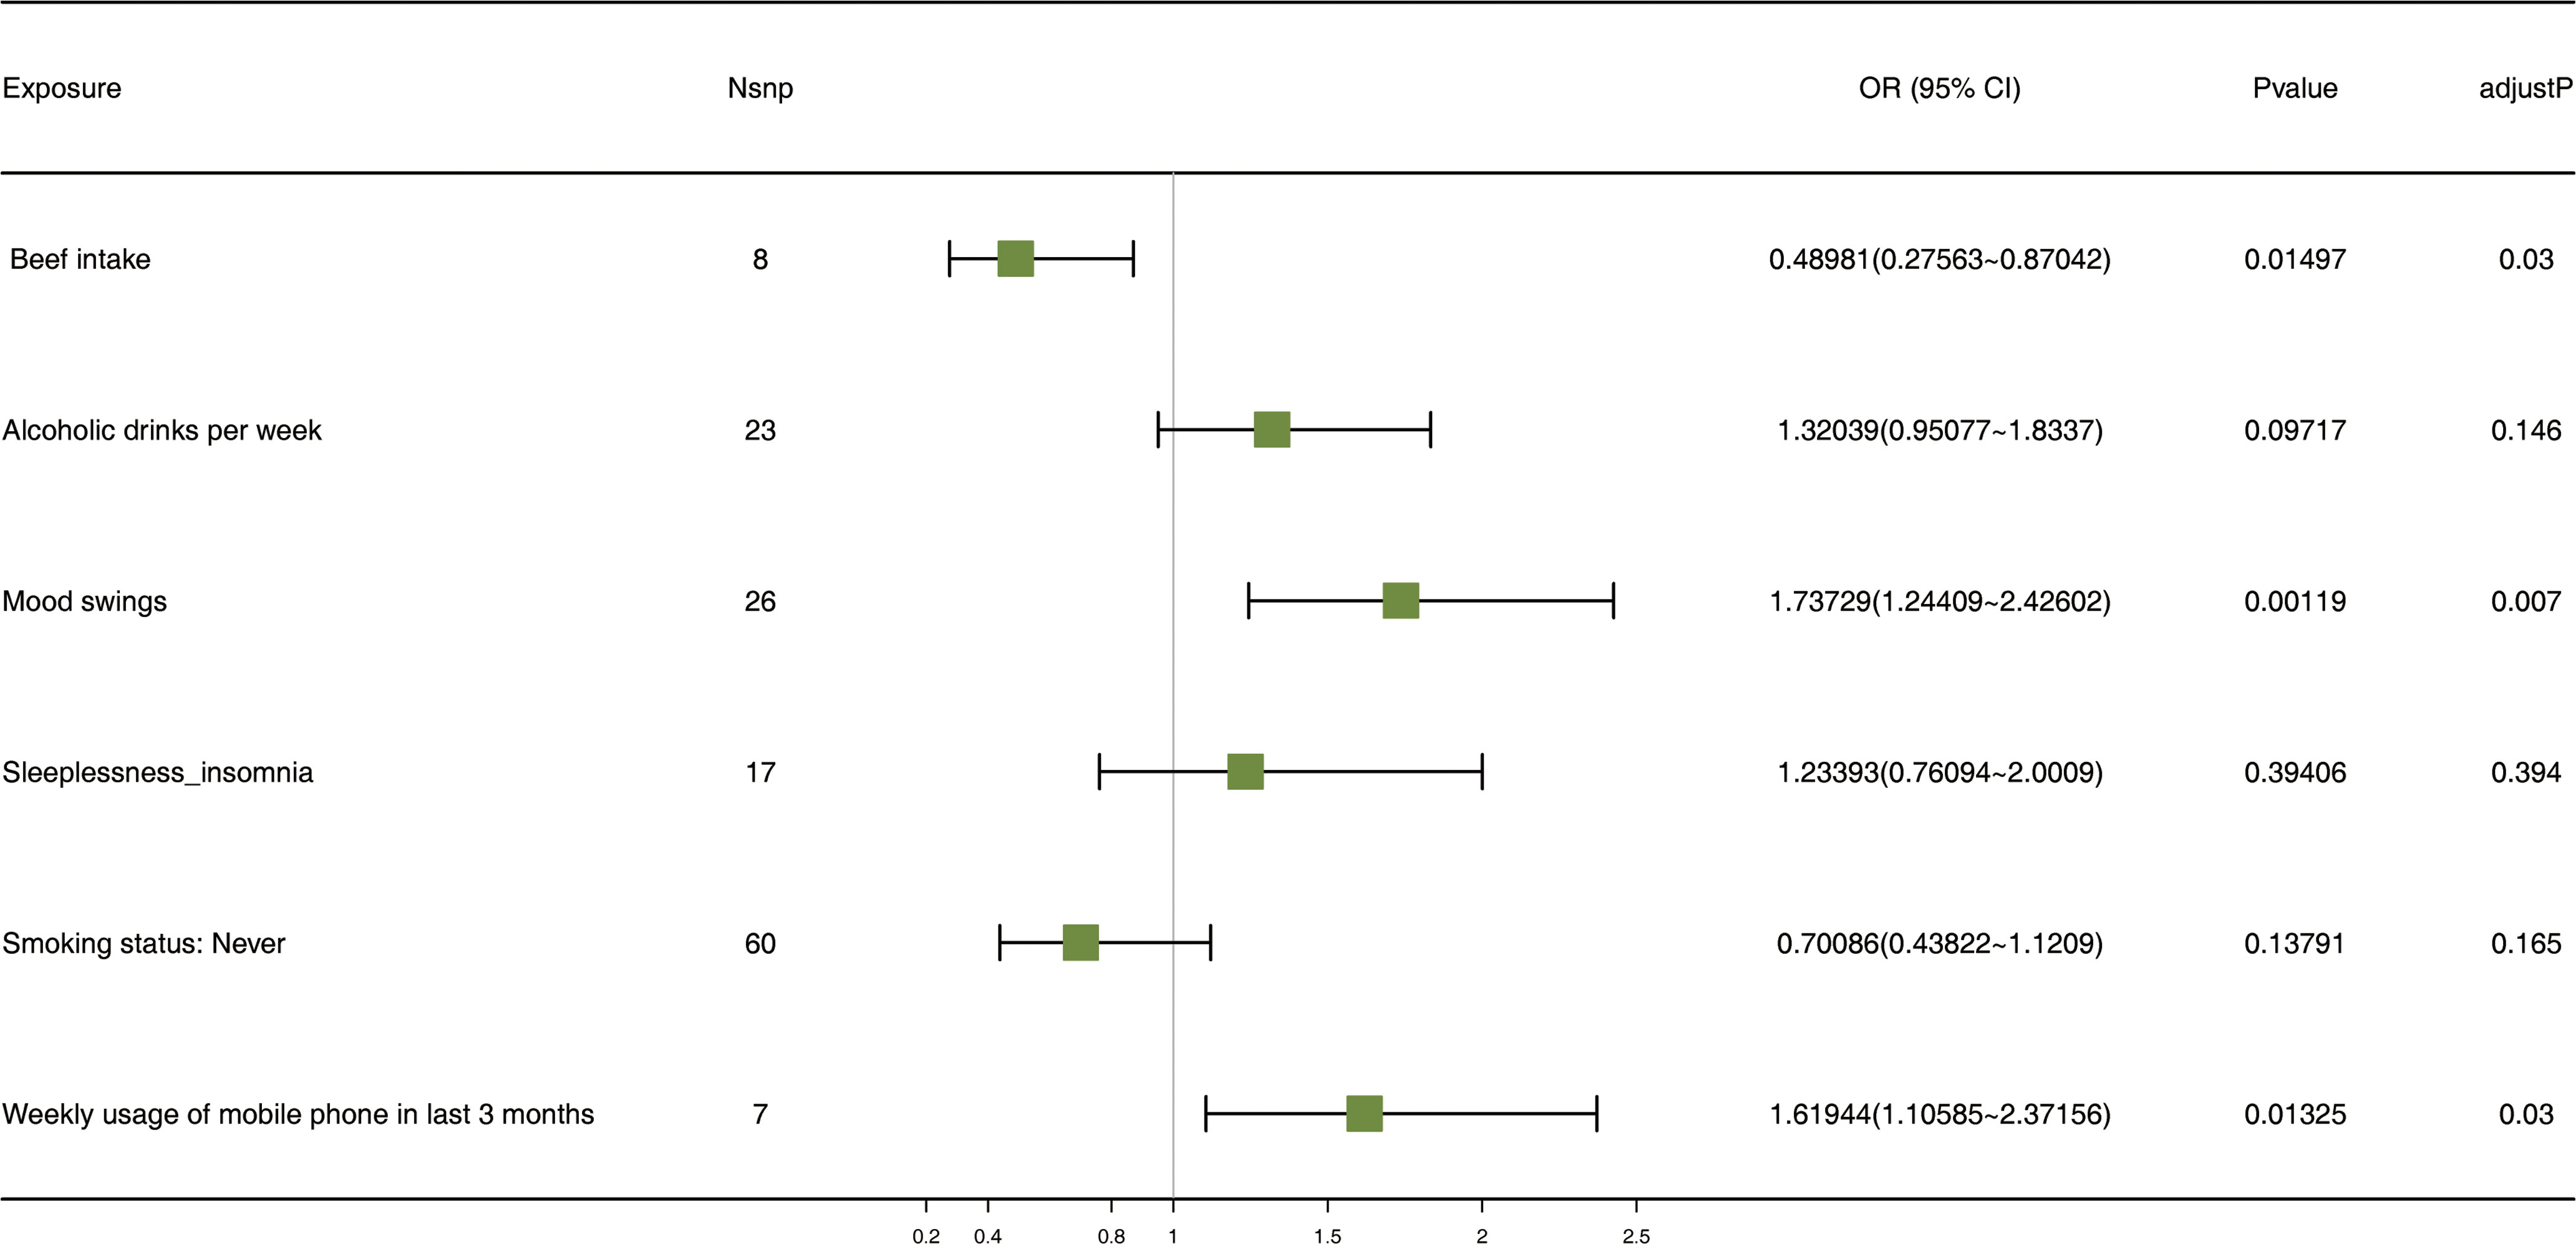
Figure 6 The forest plot of MVMR analysis. Nsnp stands for the number of SNPs. An OR value greater than 1 indicates a risk factor, whereas a value less than 1 suggests a protective factor. This is in reference to a binary variable. MVMR: multivariate Mendelian randomization; SNPs: single-nucleotide polymorphisms; OR, odds ratio; CI: confidence interval.
4 Discussion
Depression is a global disease, greatly exacerbating socio-economic burdens (1, 2, 29). Healthy lifestyle habits help reduce the risk of depression. MR treats genetic variations as natural experiments to evaluate the causal relationship between two variables (30). We assessed the causal relationship between eight different lifestyles and depression through UVMR and MVMR.
In this study, we observed a causal relationship between multiple lifestyle-related exposure factors and depression. The UVMR analysis showed that alcoholic drinks per week, sleeplessness or insomnia, BMI, mood swings, weekly usage of mobile phones in the last 3 months, and cooked vegetable intake were risk factors, while beef intake and never smoking were protective factors.
Prospective studies have shown deep connections between alcohol consumption and smoking with depression (31, 32). One study showed that alcohol consumption and headache were negatively correlated and that the comorbidity of headache with depression was common (33). A study of 6,646 ordinary people over 3 and 6 years found that reducing smoking and alcohol consumption were associated with improvements in depressive symptoms through multiple cross-sectional analyses (34). Risky drinking and alcohol abuse may increase the risk of depression (9). However, surveys indicate that moderate alcohol intake (5–15 g/day) can reduce the risk of developing depression (35, 36). Some drugs that treat depression can also treat alcohol dependence (37). SEMA3A may be a common genetic risk gene for alcohol dependence and depression (38). There is a potential bidirectional relationship between smoking and depression: smokers may have an increased risk of developing depression, and among those with depression, the smoking rate is higher than among non-smokers. Cross-sectional studies show that smokers are more likely to develop depression, and a higher proportion of people with depression smoke (31). Longitudinal studies suggest that smoking is a potential factor for developing depression (39). Recent MR studies indicate that smoking is a causal risk factor for diagnosed depression (40), and inflammation is likely involved in at least part of the connection between smoking and depression (41). Our UVMR showed a causal relationship between weekly alcohol consumption and never smoking with depression. Combined with MVMR, weekly drinking is a risk factor, while never smoking is a protective factor.
The relationship between diet and depression is profound. Healthy dietary habits and avoiding pro-inflammatory foods can prevent depression to a certain extent (12). Multiple studies suggest that the Mediterranean diet can reduce the risk of depression (12, 42, 43). The Mediterranean diet emphasizes the consumption of plant-based foods rich in fruits, vegetables, whole grains, nuts, seeds, and legumes (44). Interestingly, the intake of raw vegetables seems to have a more significant effect on mental health than cooked vegetables (45). Through a UVMR analysis, we found a direct causal relationship between cooked vegetables and depression. Intriguingly, cooked vegetables act as a risk factor for depression. This might be because cooking can destroy some beneficial components in vegetables, such as polyphenols, which are known to alleviate depression (46, 47). Meat intake is an integral part of the Mediterranean diet (44). Our UVMR and MVMR analyses indicate a direct causal relationship between beef intake and depression, with beef acting as a protective factor. Other MR studies support this viewpoint (48). Interestingly, several studies suggest that excessive beef consumption is linked to an increased risk of depression (49). It is undeniable that beef contains vitamins and minerals that have a positive effect on mood. Thus, moderate beef intake might have beneficial effects on reducing the risk of depression. The Mediterranean diet helps maintain a healthy weight range. An abnormal BMI is closely linked to depression. Individuals with metabolic health issues have a higher risk of depression than those without such issues (50, 51). A joint survey questionnaire of 18,025 participants showed that the prevalence of depression was highest among those with unhealthy metabolic obesity, accompanied by an abnormal elevation of C-reactive protein. This seems to indicate that inflammation caused by metabolic anomalies might increase the risk of depression (52). A longitudinal study also linked the inflammatory consequences of obesity to depression (53). However, through our MR analysis, there is a direct causal relationship between BMI and depression. An MR study showed that being overweight does not increase the risk of depression due to inflammation marked by an abnormal C-reactive protein caused by metabolic abnormalities. Instead, being overweight directly increases the risk of depression, fully supporting our analysis (54).
Lifestyle habits are closely linked to depression. With the increasing prevalence and frequency of smartphone use, the relationship between smartphones and depression has attracted widespread attention and research. Overuse of phones might elevate the risk of developing depression (55). Excessive smartphone use can increase transient negative emotions in users, and repeated or persistent negative emotions can heighten the risk of depression. Reducing smartphone usage might have long-term positive effects (56). Another piece of evidence suggests that frequent phone use can decrease physical activity in users, thereby raising the risk of depression (57, 58). Prolific smartphone use can also deteriorate sleep quality, indirectly increasing the risk of depression (59). A study indicates that over-reliance on smartphones might be a strategy driven by an escapist motive linked to depression (60). However, most studies focus primarily on adolescent populations, and many of the findings are indirect, which imposes certain limitations on the research methods. Our UVMR analysis indicates a direct causal relationship between excessive smartphone use and depression. Sleep-related characteristics are connected to depression. There might be a unidirectional relationship between sleep disturbances and depression, meaning that insomnia might precede depression (61). A meta-analysis suggests that sleep disturbances could be a harbinger of depression and may serve as one of its risk factors (62). The process through which insomnia affects depression might begin with alterations in the arousal system, affecting biological substrates related to emotional processing, eventually influencing cognitive systems and leading to depression (63, 64). Another piece of evidence posits that treating insomnia symptoms in depression patients can alleviate their depressive symptoms (65). A separate MR study reveals that insomnia might have a causal relationship with coronary artery disease, depressive symptoms, and subjective wellbeing (66). Diurnal mood variations, characterized by worse moods upon waking and improved moods in the evening, are a core feature of depression (67, 68). Neuroendocrine measurements have shown that depressed patients exhibit significantly elevated levels of cortisol and adrenocorticotropic hormone in the morning (69), potentially linked to the diurnal mood fluctuations seen in depression. Another finding attributes these mood fluctuations in depression to diurnal metabolic activities in areas like the ventrolateral–prefrontal, parietal, temporal, and frontal regions, as well as the cerebellum (70). Our results obtained from the UVMR analysis have further confirmed that mood swings are a significant risk factor for depression. This discovery enhances our understanding of the relationship between mood swings and depression, providing a valuable scientific basis for more in-depth research into this complex relationship.
Further MVMR analysis indicates that after considering behaviors such as alcoholic drinks per week, sleeplessness or insomnia, mood swings, weekly usage of mobile phone in the last 3 months, beef intake, and never smoking status, mood swings, weekly usage of mobile phone in the last 3 months, and beef intake have a strong causal relationship with depression. Our research findings are consistent with previous studies, which showcased the relationship between mood swings, weekly mobile phone usage in the last 3 months, and beef intake with depression (48, 55, 71). Healthy lifestyle habits can help reduce the risk of depression. Increased phone usage can lead to reduced sleep duration; hence, limiting phone usage among adolescents can help reduce insomnia, subsequently lowering the risk of depression (72). Mood swings are related to sleep duration (67), with the correlation of IL6 being significantly associated with emotional ratings (73). For those with depression, sleep deprivation is more likely to intensify diurnal mood fluctuations (74), which could further elevate the risk of depression. Healthy dietary habits help in reducing the risk of depression. While beef intake is essential for those with depression, it is crucial to maintain it within a certain limit. Overconsumption of beef might actually exacerbate the risk of depression (49).
5 Conclusion
Our study indicates that various lifestyle factors have both univariable and multivariable causal relationships with depression, and we have drawn corresponding conclusions. Our analysis focusing on dietary habits primarily targets the European population, and comparatively, there is a lack of analysis concerning the dietary habits of the Asian population. Furthermore, in exploring the causal relationship between cooked vegetable intake and beef intake with depression, we cannot completely rule out the influence of cultural differences on the results. In future studies, we will consider more deeply the impact of cultural factors on depression. The sample population for mobile phone usage frequency is mostly adolescent depression patients, and there is a relative scarcity of data from other age groups. We need to further investigate the accuracy and consistency of our results, but we will continue to monitor research related to different lifestyles and depression.
Data availability statement
The original contributions presented in the study are included in the article/Supplementary Material. Further inquiries can be directed to the corresponding author.
Ethics statement
Ethical approval was not required for the study involving humans in accordance with the local legislation and institutional requirements. Written informed consent to participate in this study was not required from the participants or the participants’ legal guardians/next of kin in accordance with the national legislation and the institutional requirements.
Author contributions
SG: Data curation, Formal analysis, Visualization, Writing – original draft. WZ: Writing – review & editing. LY: Writing – original draft. LJ: Visualization, Writing – original draft. DT: Investigation, Writing – review & editing. TZ: Writing – review & editing. BQZ: Writing – review & editing. BZ: Methodology, Project administration, Supervision, Writing – review & editing.
Funding
The author(s) declare that no financial support was received for the research, authorship, and/or publication of this article.
Conflict of interest
The authors declare that the research was conducted in the absence of any commercial or financial relationships that could be construed as a potential conflict of interest.
Publisher’s note
All claims expressed in this article are solely those of the authors and do not necessarily represent those of their affiliated organizations, or those of the publisher, the editors and the reviewers. Any product that may be evaluated in this article, or claim that may be made by its manufacturer, is not guaranteed or endorsed by the publisher.
Supplementary material
The Supplementary Material for this article can be found online at: https://www.frontiersin.org/articles/10.3389/fpsyt.2024.1343132/full#supplementary-material
Abbreviations
MR, Mendelian randomization; BMI, Body mass index; IEU, Integrative epidemiology unit; GWAS, Genome-wide association study; IVW, Inverse variance weighted; UVMR, Univariable Mendelian randomization; LOO, Leave-one-out; MVMR, Multivariable Mendelian randomization; SNPs, Single-nucleotide polymorphisms; IVs, Instrumental variables; OR, Odds ratio; CI, Confidence interval.
References
1. Malhi GS, Mann JJ. Depression. Lancet (London England). (2018) 392:2299–312. doi: 10.1016/s0140-6736(18)31948-2
2. Collaborators GDaIIaP. Global, regional, and national incidence, prevalence, and years lived with disability for 354 diseases and injuries for 195 countries and territories, 1990-2017: a systematic analysis for the Global Burden of Disease Study 2017. Lancet (London England). (2018) 392:1789–858. doi: 10.1016/s0140-6736(18)32279-7
3. Moussavi S, Chatterji S, Verdes E, Tandon A, Patel V, Ustun B. Depression, chronic diseases, and decrements in health: results from the World Health Surveys. Lancet (London England). (2007) 370:851–8. doi: 10.1016/s0140-6736(07)61415-9
4. Ustün TB, Ayuso-Mateos JL, Chatterji S, Mathers C, Murray CJ. Global burden of depressive disorders in the year 2000. Br J Psychiatry. (2004) 184:386–92. doi: 10.1192/bjp.184.5.386
5. Belmaker RH, Agam G. Major depressive disorder. N Engl J Med. (2008) 358:55–68. doi: 10.1056/NEJMra073096
6. Heim C, Binder EB. Current research trends in early life stress and depression: review of human studies on sensitive periods, gene-environment interactions, and epigenetics. Exp Neurol. (2012) 233:102–11. doi: 10.1016/j.expneurol.2011.10.032
7. Hammarström A, Lehti A, Danielsson U, Bengs C, Johansson EE. Gender-related explanatory models of depression: a critical evaluation of medical articles. Public Health. (2009) 123:689–93. doi: 10.1016/j.puhe.2009.09.010
8. Mata J, Thompson RJ, Jaeggi SM, Buschkuehl M, Jonides J, Gotlib IH. Walk on the bright side: physical activity and affect in major depressive disorder. J Abnorm Psychol. (2012) 121:297–308. doi: 10.1037/a0023533
9. Boden JM, Fergusson DM. Alcohol and depression. Addiction. (2011) 106:906–14. doi: 10.1111/j.1360-0443.2010.03351.x
10. Lipton RI. The effect of moderate alcohol use on the relationship between stress and depression. Am J Public Health. (1994) 84:1913–7. doi: 10.2105/ajph.84.12.1913
11. Boden JM, Fergusson DM, Horwood LJ. Cigarette smoking and depression: tests of causal linkages using a longitudinal birth cohort. Br J Psychiatry. (2010) 196:440–6. doi: 10.1192/bjp.bp.109.065912
12. Lassale C, Batty GD, Baghdadli A, Jacka F, Sánchez-Villegas A, Kivimäki M, et al. Healthy dietary indices and risk of depressive outcomes: a systematic review and meta-analysis of observational studies. Mol Psychiatry. (2019) 24:965–86. doi: 10.1038/s41380-018-0237-8
13. Frank P, Jokela M, Batty GD, Lassale C, Steptoe A, Kivimäki M. Overweight, obesity, and individual symptoms of depression: A multicohort study with replication in UK Biobank. Brain Behav Immun. (2022) 105:192–200. doi: 10.1016/j.bbi.2022.07.009
14. Franzen PL, Buysse DJ. Sleep disturbances and depression: risk relationships for subsequent depression and therapeutic implications. Dialogues Clin Neurosci. (2008) 10:473–81. doi: 10.31887/DCNS.2008.10.4/plfranzen
15. Pandi-Perumal SR, Monti JM, Burman D, Karthikeyan R, BaHammam AS, Spence DW, et al. Clarifying the role of sleep in depression: A narrative review. Psychiatry Res. (2020) 291:113239. doi: 10.1016/j.psychres.2020.113239
16. Thomée S, Härenstam A, Hagberg M. Mobile phone use and stress, sleep disturbances, and symptoms of depression among young adults–a prospective cohort study. BMC Public Health. (2011) 11:66. doi: 10.1186/1471-2458-11-66
17. Smith GD, Ebrahim S. 'Mendelian randomization': can genetic epidemiology contribute to understanding environmental determinants of disease? Int J Epidemiol. (2003) 32:1–22. doi: 10.1093/ije/dyg070
18. Burgess S, Foley CN, Zuber V. Inferring causal relationships between risk factors and outcomes from genome-wide association study data. Annu Rev Genomics Hum Genet. (2018) 19:303–27. doi: 10.1146/annurev-genom-083117-021731
19. Firth J, Solmi M, Wootton RE, Vancampfort D, Schuch FB, Hoare E, et al. A meta-review of "lifestyle psychiatry": the role of exercise, smoking, diet and sleep in the prevention and treatment of mental disorders. World Psychiatry. (2020) 19:360–80. doi: 10.1002/wps.20773
20. Burgess S, Davey Smith G, Davies NM, Dudbridge F, Gill D, Glymour MM, et al. Guidelines for performing Mendelian randomization investigations: update for summer 2023. Wellcome Open Res. (2019) 4:186. doi: 10.12688/wellcomeopenres.15555.3
21. Sanderson E. Multivariable mendelian randomization and mediation. Cold Spring Harb Perspect Med. (2021) 11. doi: 10.1101/cshperspect.a038984
22. Hemani G, Zheng J, Elsworth B, Wade KH, Haberland V, Baird D, et al. The MR-Base platform supports systematic causal inference across the human phenome. Elife. (2018) 7. doi: 10.7554/eLife.34408
23. Zhou W, Liu G, Hung RJ, Haycock PC, Aldrich MC, Andrew AS, et al. Causal relationships between body mass index, smoking and lung cancer: Univariable and multivariable Mendelian randomization. Int J Cancer. (2021) 148:1077–86. doi: 10.1002/ijc.33292
24. Bowden J, Davey Smith G, Burgess S. Mendelian randomization with invalid instruments: effect estimation and bias detection through Egger regression. Int J Epidemiol. (2015) 44:512–25. doi: 10.1093/ije/dyv080
25. Bowden J, Davey Smith G, Haycock PC, Burgess S. Consistent estimation in mendelian randomization with some invalid instruments using a weighted median estimator. Genet Epidemiol. (2016) 40:304–14. doi: 10.1002/gepi.21965
26. Burgess S, Scott RA, Timpson NJ, Davey Smith G, Thompson SG. Using published data in Mendelian randomization: a blueprint for efficient identification of causal risk factors. Eur J Epidemiol. (2015) 30:543–52. doi: 10.1007/s10654-015-0011-z
27. Hartwig FP, Davey Smith G, Bowden J. Robust inference in summary data Mendelian randomization via the zero modal pleiotropy assumption. Int J Epidemiol. (2017) 46:1985–98. doi: 10.1093/ije/dyx102
28. Yuan S, Larsson SC. Inverse association between serum 25-hydroxyvitamin D and nonalcoholic fatty liver disease. Clin Gastroenterol Hepatol. (2023) 21:398–405.e4. doi: 10.1016/j.cgh.2022.01.021
29. Liu Q, He H, Yang J, Feng X, Zhao F, Lyu J. Changes in the global burden of depression from 1990 to 2017: Findings from the Global Burden of Disease study. J Psychiatr Res. (2020) 126:134–40. doi: 10.1016/j.jpsychires.2019.08.002
30. Byrne EM, Yang J, Wray NR. Inference in psychiatry via 2-sample mendelian randomization-from association to causal pathway? JAMA Psychiatry. (2017) 74:1191–2. doi: 10.1001/jamapsychiatry.2017.3162
31. Anda RF, Williamson DF, Escobedo LG, Mast EE, Giovino GA, Remington PL. Depression and the dynamics of smoking. A national perspective. Jama. (1990) 264:1541–5. doi: 10.1001/jama.264.12.1541
32. Gilman SE, Abraham HD. A longitudinal study of the order of onset of alcohol dependence and major depression. Drug Alcohol Depend. (2001) 63:277–86. doi: 10.1016/s0376-8716(00)00216-7
33. Błaszczyk B, Straburzyński M, Więckiewicz M, Budrewicz S, Niemiec P, Staszkiewicz M, et al. Relationship between alcohol and primary headaches: a systematic review and meta-analysis. J Headache Pain. (2023) 24:116. doi: 10.1186/s10194-023-01653-7
34. de Boer N, Vermeulen J, Lin B, van Os J, Ten Have M, de Graaf R, et al. Longitudinal associations between alcohol use, smoking, genetic risk scoring and symptoms of depression in the general population: a prospective 6-year cohort study. Psychol Med. (2023) 53:1409–17. doi: 10.1017/s0033291721002968
35. Gea A, Beunza JJ, Estruch R, Sánchez-Villegas A, Salas-Salvadó J, Buil-Cosiales P, et al. Alcohol intake, wine consumption and the development of depression: the PREDIMED study. BMC Med. (2013) 11:192. doi: 10.1186/1741-7015-11-192
36. Gea A, Martinez-Gonzalez MA, Toledo E, Sanchez-Villegas A, Bes-Rastrollo M, Nuñez-Cordoba JM, et al. A longitudinal assessment of alcohol intake and incident depression: the SUN project. BMC Public Health. (2012) 12:954. doi: 10.1186/1471-2458-12-954
37. Agabio R, Trogu E, Pani PP. Antidepressants for the treatment of people with co-occurring depression and alcohol dependence. Cochrane Database Syst Rev. (2018) 4:Cd008581. doi: 10.1002/14651858.CD008581.pub2
38. Zhou H, Polimanti R, Yang BZ, Wang Q, Han S, Sherva R, et al. Genetic risk variants associated with comorbid alcohol dependence and major depression. JAMA Psychiatry. (2017) 74:1234–41. doi: 10.1001/jamapsychiatry.2017.3275
39. Breslau N, Novak SP, Kessler RC. Daily smoking and the subsequent onset of psychiatric disorders. Psychol Med. (2004) 34:323–33. doi: 10.1017/s0033291703008869
40. Wootton RE, Richmond RC, Stuijfzand BG, Lawn RB, Sallis HM, Taylor GMJ, et al. Evidence for causal effects of lifetime smoking on risk for depression and schizophrenia: a Mendelian randomisation study. Psychol Med. (2020) 50:2435–43. doi: 10.1017/s0033291719002678
41. Galan D, Perry BI, Warrier V, Davidson CC, Stupart O, Easton D, et al. Applying Mendelian randomization to appraise causality in relationships between smoking, depression and inflammation. Sci Rep. (2022) 12:15041. doi: 10.1038/s41598-022-19214-4
42. Bayes J, Schloss J, Sibbritt D. Effects of polyphenols in a mediterranean diet on symptoms of depression: A systematic literature review. Adv Nutr. (2020) 11:602–15. doi: 10.1093/advances/nmz117
43. Sala-Climent M, López de Coca T, Guerrero MD, Muñoz FJ, López-Ruíz MA, Moreno L, et al. The effect of an anti-inflammatory diet on chronic pain: a pilot study. Front Nutr. (2023) 10:1205526. doi: 10.3389/fnut.2023.1205526
44. Serra-Majem L, Trichopoulou A, Ngo de la Cruz J, Cervera P, García Alvarez A, La Vecchia C, et al. Does the definition of the Mediterranean diet need to be updated? Public Health Nutr. (2004) 7:927–9. doi: 10.1079/phn2004564
45. Brookie KL, Best GI, Conner TS. Intake of raw fruits and vegetables is associated with better mental health than intake of processed fruits and vegetables. Front Psychol. (2018) 9:487. doi: 10.3389/fpsyg.2018.00487
46. Nicoli MC, Anese M, Parpinel M. Influence of processing on the antioxidant properties of fruit and vegetables. Trends Food Sci Technology. (1999) 10:94–100. doi: 10.1016/S0924-2244(99)00023-0
47. Zhang D, Hamauzu Y. Phenolics, ascorbic acid, carotenoids and antioxidant activity of broccoli and their changes during conventional and microwave cooking. Food Chem. (2004) 88:503–9. doi: 10.1016/j.foodchem.2004.01.065
48. Chen TT, Chen CY, Fang CP, Cheng YC, Lin YF. Causal influence of dietary habits on the risk of major depressive disorder: A diet-wide Mendelian randomization analysis. J Affect Disord. (2022) 319:482–9. doi: 10.1016/j.jad.2022.09.109
49. Oliván-Blázquez B, Aguilar-Latorre A, Motrico E, Gómez-Gómez I, Zabaleta-Del-Olmo E, Couso-Viana S, et al. The relationship between adherence to the mediterranean diet, intake of specific foods and depression in an adult population (45-75 years) in primary health care. A Cross-Sectional Descriptive Study. Nutrients. (2021) 13. doi: 10.3390/nu13082724
50. Malmir H, Mirzababaei A, Moradi S, Rezaei S, Mirzaei K, Dadfarma A. Metabolically healthy status and BMI in relation to depression: A systematic review of observational studies. Diabetes Metab Syndr. (2019) 13:1099–103. doi: 10.1016/j.dsx.2019.01.027
51. Silva DA, Coutinho E, Ferriani LO, Viana MC. Depression subtypes and obesity in adults: A systematic review and meta-analysis. Obes Rev. (2020) 21:e12966. doi: 10.1111/obr.12966
52. Moazzami K, Lima BB, Sullivan S, Shah A, Bremner JD, Vaccarino V. Independent and joint association of obesity and metabolic syndrome with depression and inflammation. Health Psychol. (2019) 38:586–95. doi: 10.1037/hea0000764
53. Chu K, Cadar D, Iob E, Frank P. Excess body weight and specific types of depressive symptoms: Is there a mediating role of systemic low-grade inflammation? Brain Behav Immun. (2023) 108:233–44. doi: 10.1016/j.bbi.2022.11.016
54. Karageorgiou V, Casanova F, O'Loughlin J, Green H, McKinley TJ, Bowden J, et al. Body mass index and inflammation in depression and treatment-resistant depression: a Mendelian randomisation study. BMC Med. (2023) 21:355. doi: 10.1186/s12916-023-03001-7
55. Gao T, Xiang YT, Zhang H, Zhang Z, Mei S. Neuroticism and quality of life: Multiple mediating effects of smartphone addiction and depression. Psychiatry Res. (2017) 258:457–61. doi: 10.1016/j.psychres.2017.08.074
56. Wong SM, Chen EY, Wong CS, Suen YN, Chan DL, Tsang SH, et al. Impact of smartphone overuse on 1-year severe depressive symptoms and momentary negative affect: Longitudinal and experience sampling findings from a representative epidemiological youth sample in Hong Kong. Psychiatry Res. (2022) 318:114939. doi: 10.1016/j.psychres.2022.114939
57. Pereira FS, Bevilacqua GG, Coimbra DR, Andrade A. Impact of problematic smartphone use on mental health of adolescent students: Association with mood, symptoms of depression, and physical activity. Cyberpsychol Behav Soc Netw. (2020) 23:619–26. doi: 10.1089/cyber.2019.0257
58. Xie H, Tao S, Zhang Y, Tao F, Wu X. Impact of problematic mobile phone use and insufficient physical activity on depression symptoms: a college-based follow-up study. BMC Public Health. (2019) 19:1640. doi: 10.1186/s12889-019-7873-z
59. Yang J, Fu X, Liao X, Li Y. Association of problematic smartphone use with poor sleep quality, depression, and anxiety: A systematic review and meta-analysis. Psychiatry Res. (2020) 284:112686. doi: 10.1016/j.psychres.2019.112686
60. Wei X, An F, Liu C, Li K, Wu L, Ren L, et al. Escaping negative moods and concentration problems play bridge roles in the symptom network of problematic smartphone use and depression. Front Public Health. (2022) 10:981136. doi: 10.3389/fpubh.2022.981136
61. Ohayon MM, Roth T. Place of chronic insomnia in the course of depressive and anxiety disorders. J Psychiatr Res. (2003) 37:9–15. doi: 10.1016/s0022-3956(02)00052-3
62. Zhang MM, Ma Y, Du LT, Wang K, Li Z, Zhu W, et al. Sleep disorders and non-sleep circadian disorders predict depression: A systematic review and meta-analysis of longitudinal studies. Neurosci Biobehav Rev. (2022) 134:104532. doi: 10.1016/j.neubiorev.2022.104532
63. Baglioni C, Riemann D. Is chronic insomnia a precursor to major depression? Epidemiological and biological findings. Curr Psychiatry Rep. (2012) 14:511–8. doi: 10.1007/s11920-012-0308-5
64. Riemann D, Krone LB, Wulff K, Nissen C. Sleep, insomnia, and depression. Neuropsychopharmacology. (2020) 45:74–89. doi: 10.1038/s41386-019-0411-y
65. Christensen H, Batterham PJ, Gosling JA, Ritterband LM, Griffiths KM, Thorndike FP, et al. Effectiveness of an online insomnia program (SHUTi) for prevention of depressive episodes (the GoodNight Study): a randomised controlled trial. Lancet Psychiatry. (2016) 3:333–41. doi: 10.1016/s2215-0366(15)00536-2
66. Lane JM, Jones SE, Dashti HS, Wood AR, Aragam KG, van Hees VT, et al. Biological and clinical insights from genetics of insomnia symptoms. Nat Genet. (2019) 51:387–93. doi: 10.1038/s41588-019-0361-7
67. Wirz-Justice A. Diurnal variation of depressive symptoms. Dialogues Clin Neurosci. (2008) 10:337–43. doi: 10.31887/DCNS.2008.10.3/awjustice
68. Murray G. Diurnal mood variation in depression: a signal of disturbed circadian function? J Affect Disord. (2007) 102:47–53. doi: 10.1016/j.jad.2006.12.001
69. Moffoot AP, O'Carroll RE, Bennie J, Carroll S, Dick H, Ebmeier KP, et al. Diurnal variation of mood and neuropsychological function in major depression with melancholia. J Affect Disord. (1994) 32:257–69. doi: 10.1016/0165-0327(94)90090-6
70. Germain A, Nofzinger EA, Meltzer CC, Wood A, Kupfer DJ, Moore RY, et al. Diurnal variation in regional brain glucose metabolism in depression. Biol Psychiatry. (2007) 62:438–45. doi: 10.1016/j.biopsych.2006.09.043
71. Bowen RC, Mahmood J, Milani A, Baetz M. Treatment for depression and change in mood instability. J Affect Disord. (2011) 128:171–4. doi: 10.1016/j.jad.2010.06.040
72. Werner-Seidler A, Li SH, Spanos S, Johnston L, O'Dea B, Torok M, et al. The effects of a sleep-focused smartphone application on insomnia and depressive symptoms: a randomised controlled trial and mediation analysis. J Child Psychol Psychiatry. (2023) 64:1324–35. doi: 10.1111/jcpp.13795
73. Alesci S, Martinez PE, Kelkar S, Ilias I, Ronsaville DS, Listwak SJ, et al. Major depression is associated with significant diurnal elevations in plasma interleukin-6 levels, a shift of its circadian rhythm, and loss of physiological complexity in its secretion: clinical implications. J Clin Endocrinol Metab. (2005) 90:2522–30. doi: 10.1210/jc.2004-1667
Keywords: depression, lifestyle, Mendelian randomization, genome-wide association study, causality
Citation: Guo S, Zhu W, Yu L, Jie L, Tian D, Zhao T, Zhao B and Zhang B (2024) The potential causal relationship between various lifestyles and depression: a univariable and multivariable Mendelian randomization study. Front. Psychiatry 15:1343132. doi: 10.3389/fpsyt.2024.1343132
Received: 23 November 2023; Accepted: 12 February 2024;
Published: 29 February 2024.
Edited by:
Edwin de Beurs, Leiden University, NetherlandsReviewed by:
Zhongshan Cheng, St. Jude Children’s Research Hospital, United StatesEugene Boon Yau Koh, Universiti Putra Malaysia, Malaysia
Marta Waliszewska-Prosół, Wroclaw Medical University, Poland
Copyright © 2024 Guo, Zhu, Yu, Jie, Tian, Zhao, Zhao and Zhang. This is an open-access article distributed under the terms of the Creative Commons Attribution License (CC BY). The use, distribution or reproduction in other forums is permitted, provided the original author(s) and the copyright owner(s) are credited and that the original publication in this journal is cited, in accordance with accepted academic practice. No use, distribution or reproduction is permitted which does not comply with these terms.
*Correspondence: Biao Zhang, emhhbmdiaWFvMTk2OUAxNjMuY29t