 Fangzhu Ai
 Enguang Li
 Qiqi Ji
 Huijun Zhang
- Department of Nursing, Jinzhou Medical University, Jinzhou, China
Background: Hypertension is a common chronic disease that can trigger symptoms such as anxiety and depression. Therefore, it is essential to predict their risk of depression. The aim of this study is to find the best prediction model and provide effective intervention strategies for health professionals.
Methods: The study subjects were 2733 middle-aged and older adults who participated in the China Health and Retirement Longitudinal Study (CHARLS) between 2018 and 2020. R software was used for Lasso regression analysis to screen the best predictor variables, and logistic regression, random forest and XGBoost models were constructed. Finally, the prediction efficiency of the three models was compared.
Results: In this study, 18 variables were included, and LASSO regression screened out 10 variables that were important for the establishment of the model. Among the three models, Logistic Regression model showed the best performance in various evaluation indicators.
Conclusion: The prediction model based on machine learning can accurately assess the likelihood of depression in middle-aged and elderly patients with hypertension in the next three years. And by combining Logistic regression and nomograms, we were able to provide a clear interpretation of personalized risk predictions.
Introduction
The aging of the population is one of the major social problems in the world today (1). As the country with the largest elderly population in the world, China is faced with severe challenges and threats of population aging (2). One of the biggest challenges of aging is health-related issues, most notably chronic disease (3). Admittedly, chronic disease has become one of the biggest threats to human health, especially to the elderly (4). Among these chronic diseases, cardiovascular diseases are the most common and the leading cause of death in China. High blood pressure is widely recognized as a major risk factor for cardiovascular disease and has one of the highest disease burdens globally (5). According to the World Health Organization (WHO), about 1.13 billion people worldwide currently have high blood pressure, and the number of people with high blood pressure is expected to increase by more than 400 million by 2025 (6). Over the past few decades, the prevalence of hypertension has increased dramatically, and disability-adjusted life years associated with hypertension have also increased significantly (7). In addition, the prevalence of hypertension among the elderly in China is as high as 50% (8). This situation has become one of the chronic diseases that seriously threaten public health, especially in the middle-aged and elderly population, and has brought a heavy burden to the whole society (9).
The increase in hypertension is accompanied by various problems and challenges. Studies have shown that individuals with high blood pressures have a higher prevalence of mental health disorders, due to changes in physical symptoms of high blood pressure patients, which seriously affect physical and mental health, prone to depression, anxiety and loneliness and other problems (10–12). In addition, taking medication every day and worrying about serious complications may also increase the psychological burden on patients (13). A meta-analysis study showed that the prevalence of depression in people with high blood pressure was 26.8%, higher than in the general population (14). Several studies in China have also suggested that high blood pressure is a risk factor for depression (15, 16). Studies have also shown that symptoms of depression are associated with higher rates of high blood pressure (17, 18). Many studies have shown that depression has a significant impact on hypertensive patients (19, 20). In addition, when the same scale was used to screen populations in different regions, the depression detection rate among hypertensive patients in China was higher than 17.3% in American Indians (21) and 24.0% in Australia (22).
Depression is a mood disorder that can cause a variety of functional physical impairments and loss of interest in daily activities, which can reduce quality of life (23). At present, depression has become a major mental health problem in low-income, middle-income, and high-income countries, and its lifetime risk has risen steadily over the past few decades (24, 25). According to Whiteford H. A. et al., they used data from the Global Burden of Diseases, Injuries, and Risk Factors Study 2010 to estimate the burden of disease associated with mental and substance use disorders (26). The findings show that mental and substance use disorders account for 7.4% of disability-adjusted life years globally. At the same time, mental and substance use disorders are also the main causes of global years of life lost due to disability, and depression contributes the most to the global years of life lost due to mental and substance use disorders, reaching 40.5%. The findings highlight the important impact of depression on global health. In addition, a 2013 systematic review of Gu L et al. showed that the lifetime prevalence of depression in China was 3.3% (27). In 2014, Smith K et al. showed the epidemiological status of depression in the world in Nature, among which the incidence of depression in China was 3.02% (28). Depression is expected to become the leading cause of the global burden of disease by 2030 and has become the leading cause of suicide in China. This series of data shows that depression has become a global public health problem that needs adequate attention and attention (28).
When older people suffer from both hypertension and depression, the double burden of physical and mental illness increases the risk of cardiovascular and cerebrovascular disease, non-compliance with medication, poor quality of life, and suicide (12, 29, 30). In addition, research has shown that depression can affect treatment, physical function, and health outcomes in people with high blood pressure (31). Patients with long-term hypertension often have emotional disorders, but few people can timely detect and correctly understand the severity of depression, thus delaying treatment, which will also affect the control of hypertension. There is a lot of research on high blood pressure and depression. In the early 1990s, some studies showed no clear correlation between high blood pressure and depression. However, recent studies have found that clinically significant depressive symptoms are independently associated with elevated blood pressure (32, 33). In addition, Chinese scholars have also studied the heterogeneity of depression in non-hospitalized elderly patients with hypertension and studied the influencing factors of various categories (34).
In summary, although there have been many studies on the association between high blood pressure and depression, there is still a lack of tools and practical applications for risk assessment in high-risk patients. Clinically, we can only rely on the summary of experience to promote the prevention of depression in hypertensive patients. However, with the continuous progress of artificial intelligence (AI) technology in recent years, it has become an important topic in the field of health care, and its application is also expanding. Machine learning (ML) is an in-depth study of how to extract valuable information from massive amounts of data. It is not only a theory but also a practical discipline, which is the core and one of AI (35, 36). ML was first proposed by Samuel in 1959 (37), through ML, we can extract the best objective function from a large amount of data and use these functions to achieve optimization. It can effectively help doctors predict diseases through ML, thus effectively supporting clinicians’ diagnosis and treatment decisions. Algorithms such as logistic regression (LR), random forest (RF), lasso regression, and XGBoost are included for the construction and validation of disease prediction models. However, in the prediction model of depression in middle-aged and elderly people with hypertension, there is a lack of relevant research. Therefore, this study will take the hypertension population in the China Health and Retirement Longitudinal Study database as the research object and use R studio software to organize and analyze the data. Three classical machine learning algorithms were used to scientifically construct a prediction model for depression risk in middle-aged and elderly hypertensive patients. By evaluating and screening the efficacy of the model, an optimal model algorithm is derived to better understand the patient’s disease changes.
Materials and methods
Data source
This study used data from the China Health and Retirement Longitudinal Study (CHARLS) from 2018 to 2020. CHARLS is a large-scale interdisciplinary survey project hosted by the National School of Development at Peking University. The project uses household surveys to collect high-quality longitudinal survey data from a nationally representative sample of people aged 45 years and older and their spouses (38, 39). The CHARLS survey covers 150 counties and 450 communities (villages) in 28 provinces. The survey used a probability sampling method proportional to population size, sampling at the county, household, and individual levels in four phases. This method has strong advantages in scientificity, geographical coverage, representativeness, and authenticity of samples.
Study participants
According to the purpose of the survey, the inclusion criteria for this study included: (1) age 45 years or older; (2) Patients with clinical diagnosis of hypertension. Exclusion criteria included: (1) participants who already had depressive symptoms or had not completed the depression scale at baseline (2018); (2) Participants who are unable to provide additional survey information on their own or who lack reliable information; (3) Participants who did not participate in follow-up in 2020; (4) Participants who did not complete the depression scale in 2020. In the end, a total of 2733 middle-aged and elderly people were included in this study, and the detailed process of participant selection is shown in Figure 1. The sampling unit for this study was middle-aged and elderly hypertensive patients. And since the number of samples screened in this study was large enough, no sampling weights were performed.
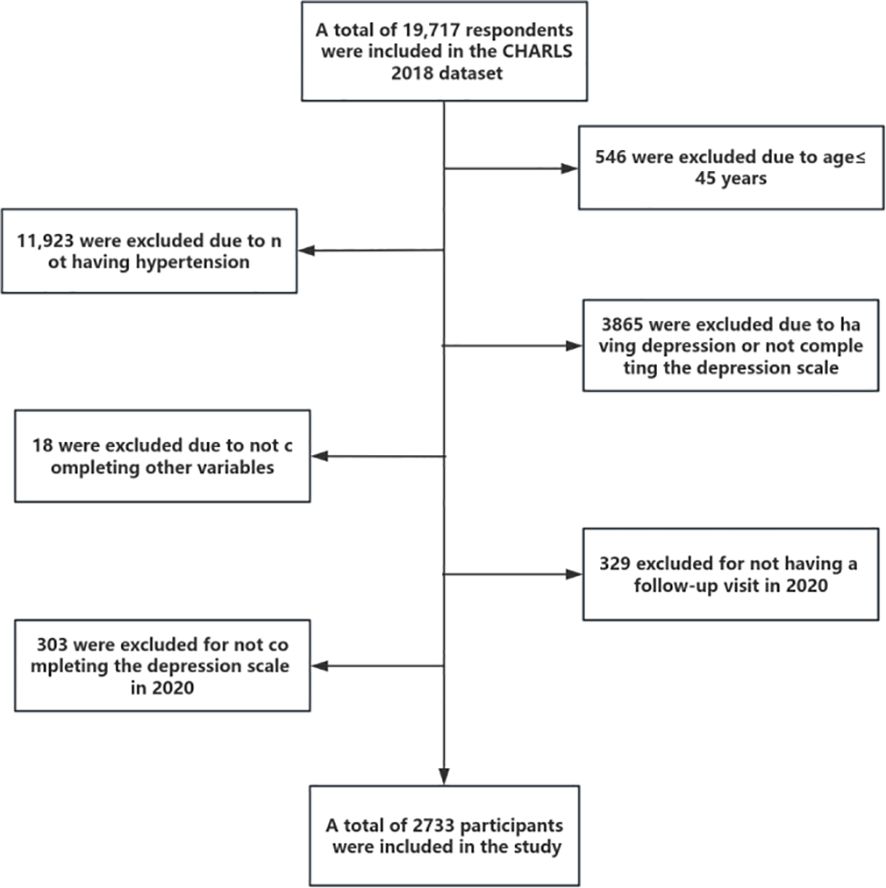
Figure 1 A flow chart for study population selection.
Research variable
Outcome variable
In the CHARLS questionnaire, participants were screened for depressive symptoms using the CESD-10 scale. The scale has strong reliability and validity, especially in the measurement of depression symptoms in the elderly (40, 41). The scale consists of ten items and uses the Likert4 scoring method. Item 5 “I am hopeful for the future” and item 8 “I am happy” are positive items, and the rest are negative items. Negative entries are assigned according to “rarely or not at all (less than 1 day) =0”, “not much (1-2 days) =1”, “sometimes or half the time (3-4 days) =2” and “most of the time (5-7 days) =3”, while positive entries are assigned in reverse. Finally, the score of each item is added to get the total score, which ranges from 0 to 30 points. A total score of ≥10 was defined as the presence of depressive symptoms; If the total score is less than 10, it is defined as no depressive symptoms. A higher score indicates more severe depressive symptoms (42).
Socio-demographic factors
Sociodemographic factors include gender, hukou, education level, marital status, place of residence, and age. Among them, gender is divided into male and female; The level of education is classified as “none” and “ ≥1 year”; Types of hukou include “agricultural hukou” and “non-agricultural hukou”; Marital status can be classified as “married” (including living with a spouse or temporarily separated for reasons such as work) and “unmarried” (including separated, divorced or widowed); Place of residence are divided into “urban”, “urban-rural integration and special areas” and “rural”; Age is treated as a continuous variable.
Behavioral factors
Behavioral factors included exercise, social activities, smoke, drink, and sleep duration. Among them, exercise, social activities, smoke, and drink were classified as “yes” and “no”. Sleep duration was measured by asking the question, “During the past month, how many hours per night did you sleep on average?”. And was treated as a continuous variable in this study.
Health status
In this study, health status included disability, hearing difficulties, pain, and the number of chronic diseases. For the definition of disability, the following five questions were used: (1) Do you have one of the following disabilities? (2) Do you have Brain damage/intellectual disability? (3) Do you have vision problems? (4) Do you have hearing problems? (5) Do you have a Speech impediment? Participants were defined as disabled if they answered “yes” to at least one of the above questions, otherwise, it is “no”. For the definition of hearing difficulty, the following three questions were used: (1) Do you ever wear a hearing aid? (2)Is your hearing very good, good, fair, poor, or very poor(3)Do you have hearing problems? Hearing difficulties were defined if the answer to questions 1 or 3 was “yes” or if the answer to question 2 was “poor”. In this study, chronic diseases included 13 types, namely: dyslipidemia, diabetes, cancer, cardiovascular disease, chronic lung disease, liver disease, psychiatric problems, stroke, psychiatric illness, arthritis or rheumatic disease, kidney disease, digestive system disease, or asthma. The number of chronic diseases was treated as a continuous variable in this study. In addition, the pain was defined as “yes” and “no”.
Mental health factors
Mental health factors included life satisfaction, self-rated health, and self-rated memory, which were defined as “good”, “fair” and “bad” in this study, and all three variables are categorical in this study.
Statistical analysis
In this study, R Studio software was used for data analysis with the aid of several R software packages, including rms, ROCR, Hmisc, random forest, glment, and caret, among others. Firstly, the general information table and scores of the patients were described. Because the measurement data in this study were not normally distributed, they were expressed as median and interquartile range, and the Mann-Whitney U test was used for comparison between groups and within groups. Count data were expressed as utilization rate, constituent ratio, or frequency, and the chi-square test was used for comparison between groups and within groups. The test level was set as α=0.05. Next, significant risk factors were screened using the Lasso regression method. Then, three machine learning algorithms, including logistic regression (LR), random forest (RF), and XGBoost, were used in the training set to construct depression risk prediction models for middle-aged and elderly hypertensive people.
Finally, the performance of the prediction models was evaluated by the area under the Receiver Operating Characteristic (ROC) curve, specificity, sensitivity, positive predictive value (PPV), and negative predictive value (NPV).
Results
Analysis of the number of patients
We randomly divided all the screened patients into a training set and a calibration set in a 7:3 ratio. The training set served as the modeling group with 2050 cases, and the calibration set served as the testing group with 683 cases. For the flow chart of the study, see Figure 2.
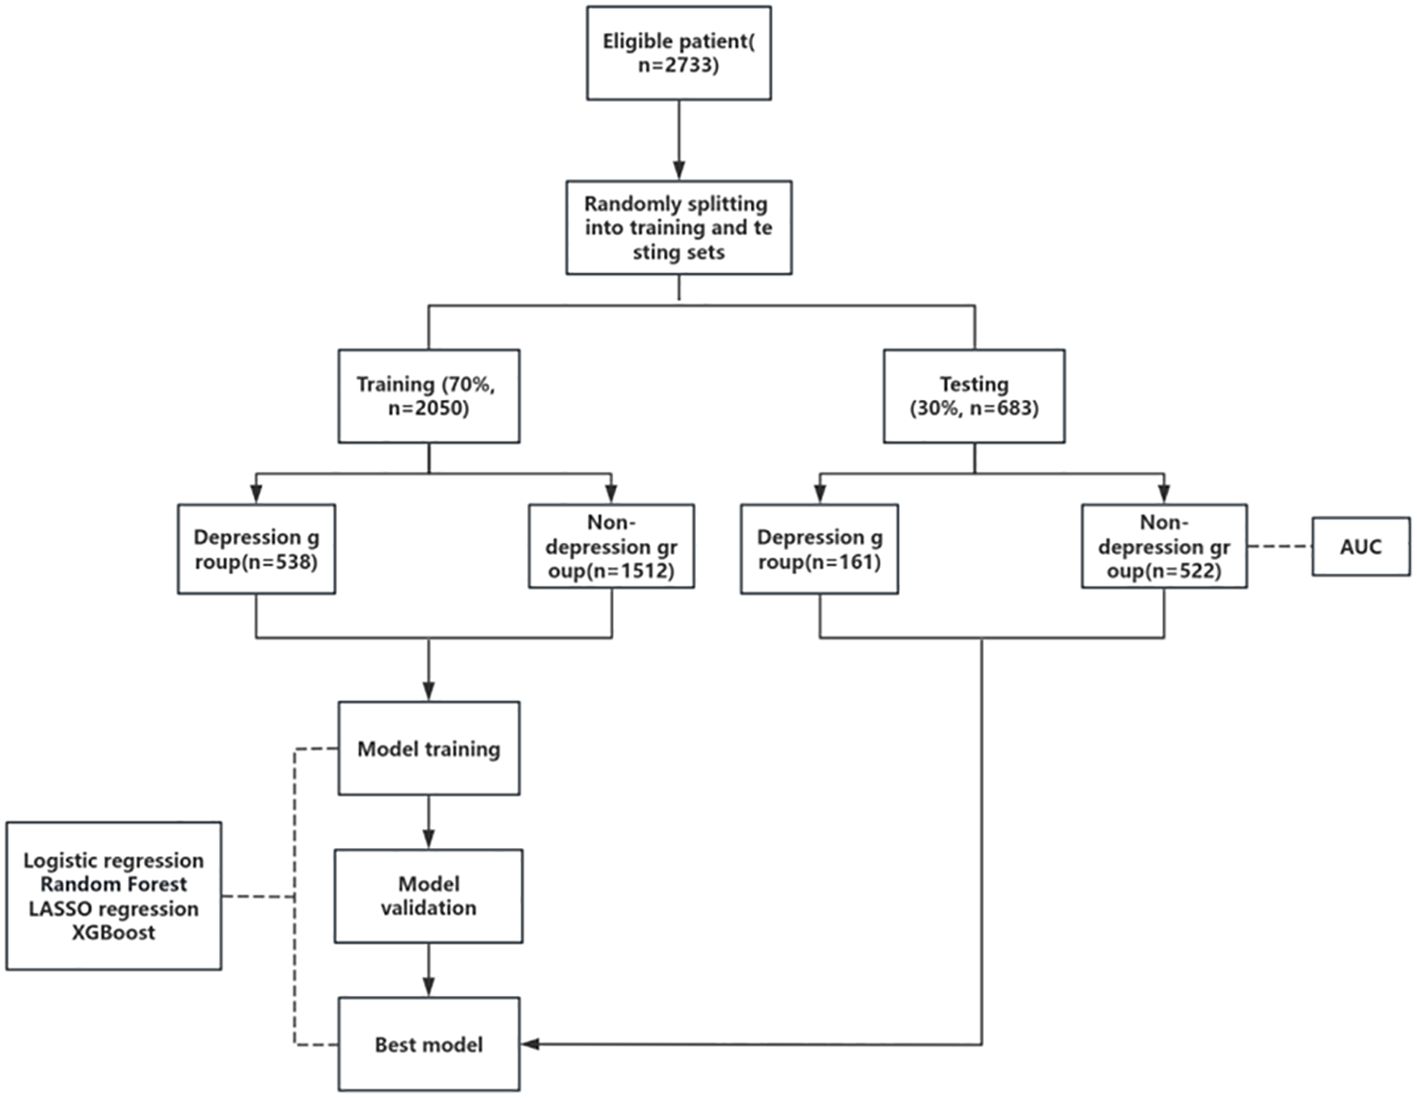
Figure 2 Flow chart of the study.
Baseline data of training set and testing set
Except for hearing difficulty, social activities and age, there were no significant differences in baseline characteristics between the two groups (P >0.05), indicating that the two groups would not be biased due to the uneven distribution of dependent variables, as detailed in Table 1.
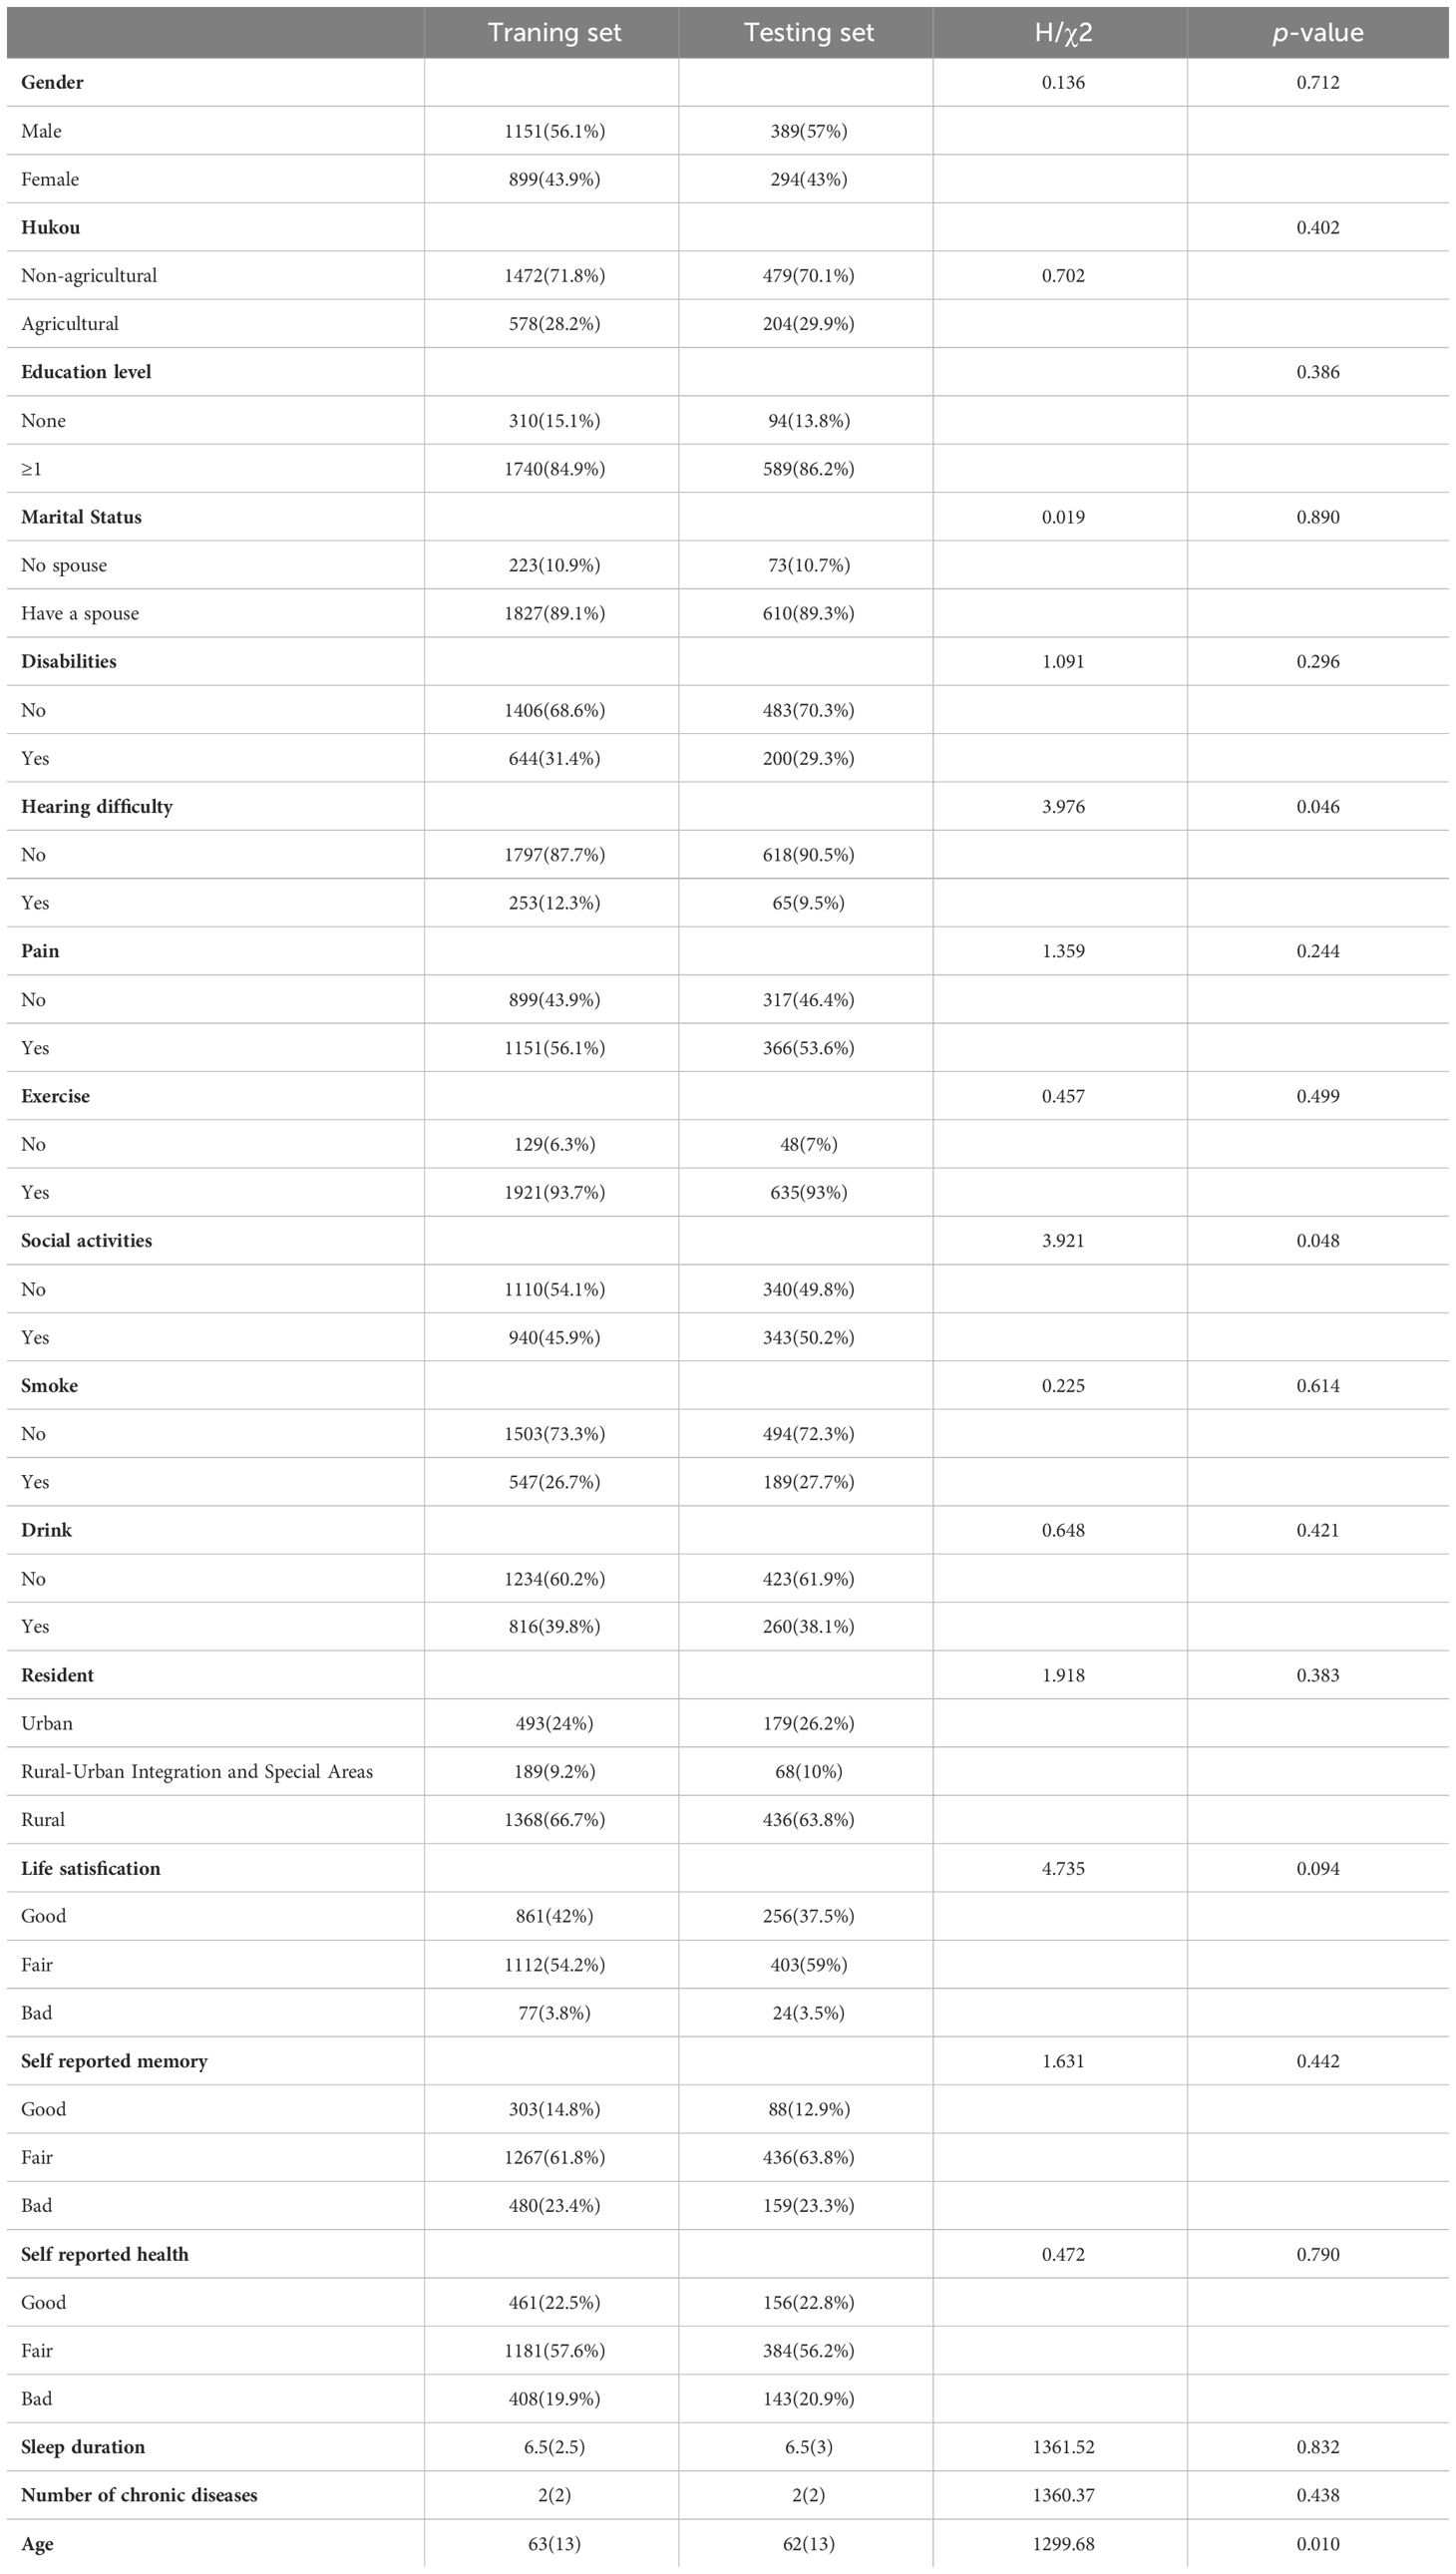
Table 1 Comparison of baseline data between the two groups.
Identification of risk factors
In the training set, with the presence or absence of depression as the dependent variable (yes =1, no =0) and preselected risk factors for depression in middle-aged and elderly hypertensive patients as the independent variables, lasso Regression was used to screen risk factors. As can be seen from Figure 3A, the coefficients of the independent variables included in the model from the beginning will be gradually compressed, and the coefficients of the last part of the independent variables will be compressed to 0 to avoid overfitting the model. As can be seen from Figure 3B, by means of 10-fold cross-validation, λ+1 with the smallest error was selected as the optimal value, and finally, 10 risk factors including gender, household registration, education, pain, drinking, life satisfaction, self-rated memory, self-rated health, number of chronic diseases and age were screened out.
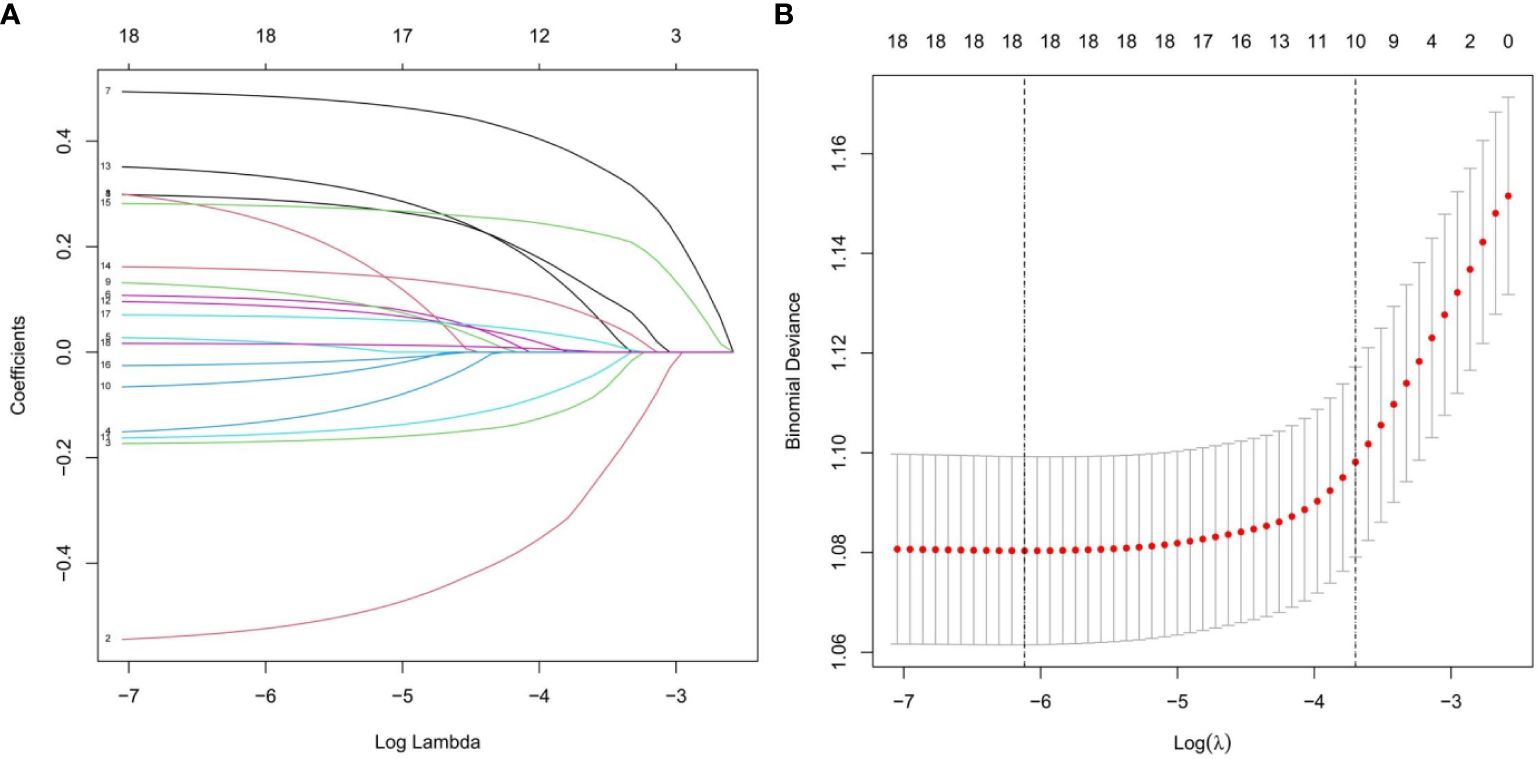
Figure 3 Lasso regression model was used to screen the risk factors. (A) Coefficient curves are generated according to the logarithmic (lambda) sequence, with nonzero coefficients generated by the optimal lambda. (B) Results of tenfold cross validation, partial likelihood deviation (binomial deviation) curves were plotted by validating the optimal lambda in the LASSO model, and virtual vertical lines were plotted according to the minimum lambda and standard error criteria.
Construction of LR risk prediction model
After selection by lasso regression, we performed a multivariate logistic regression analysis in the training set, using forward stepwise and likelihood ratio tests to rule out confounding factors. The results are shown in Table 2, gender, hukou, pain, life satisfaction, self-reported health, self-reported memory, number of chronic diseases and age are independent risk factors for depression in middle-aged and elderly patients with hypertension. We plotted the nomogram for depression in middle-aged and elderly hypertensive patients as shown in Figure 4A, and the specific variable allocation is shown in Table 3. Finally, based on the risk factor scores in the nomogram, we can calculate the corresponding predicted probability, which is the probability of depression in middle-aged and elderly hypertensive patients. For example, female (score 31), agricultural hukou (score 50), pain (score 36.5), fair life satisfaction (score 25), poor self-rated memory (score 20.5), poor self-rated health (score 43), 5 chronic diseases (score 25), and age 80(score 54). These scores are added to give a total score of 285, corresponding to a risk of more than 50%. This means that patients may be at higher risk for depression and therefore require individualized preventive measures. The specific scoring criteria are shown in Figure 4B.
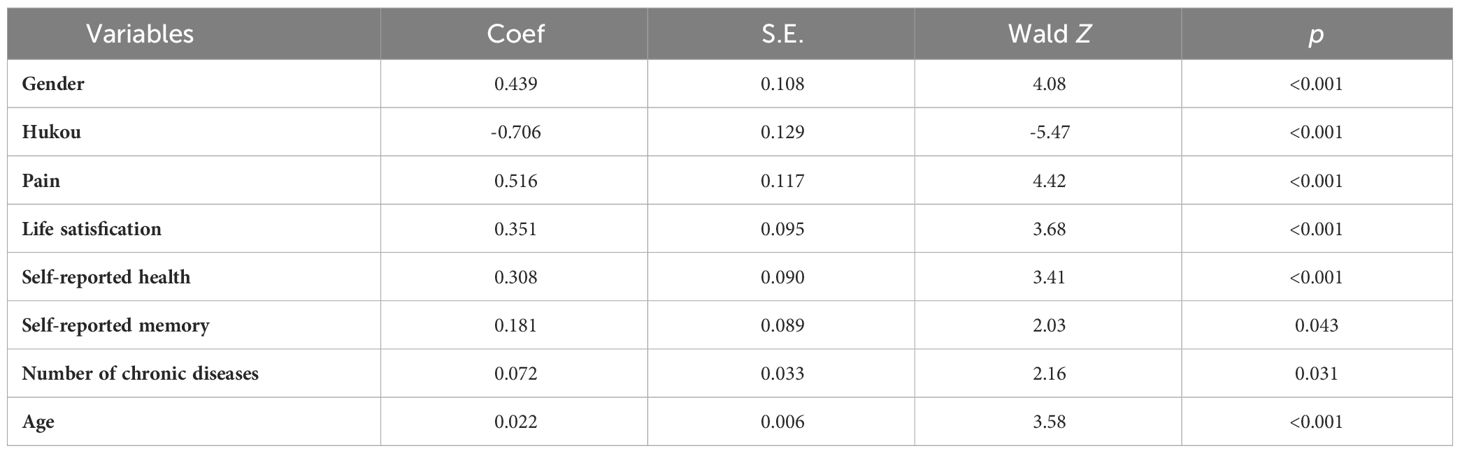
Table 2 Multivariate logistic analysis of depression in middle-aged and elderly patients with hypertension.
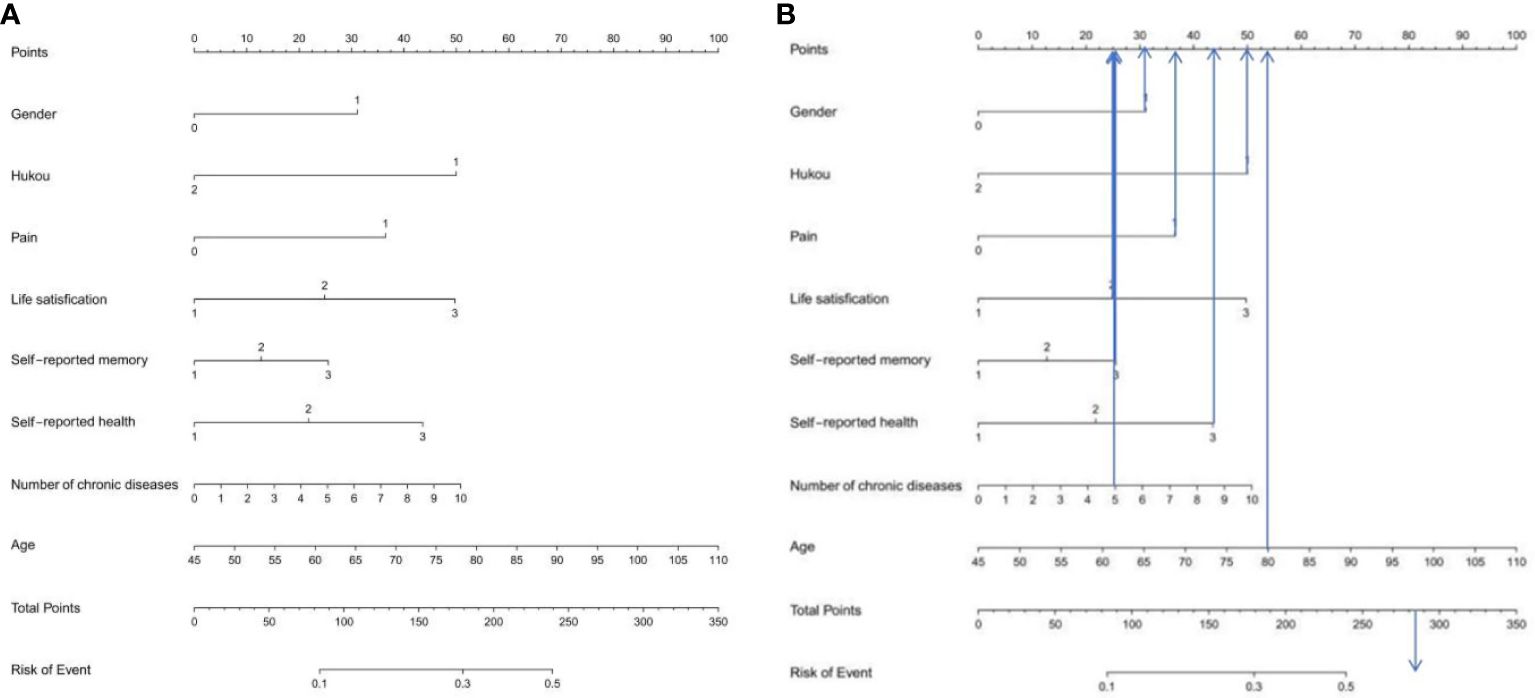
Figure 4 (A) Nomogram prediction model of logistic risk of depression in middle-aged and elderly patients with hypertension (B) Score explanation of the incidence of depression in middle-aged and elderly patients with hypertension. According to the risk factors in the Nomogram, the corresponding score of each variable can be known. After adding the scores of each variable, the prediction probability corresponding to the total score is the probability of depression in middle-aged and elderly hypertensive patients. Points is the individual score, Total Points is the total score, and Risk of Event is the incidence of depression corresponding to the total score.
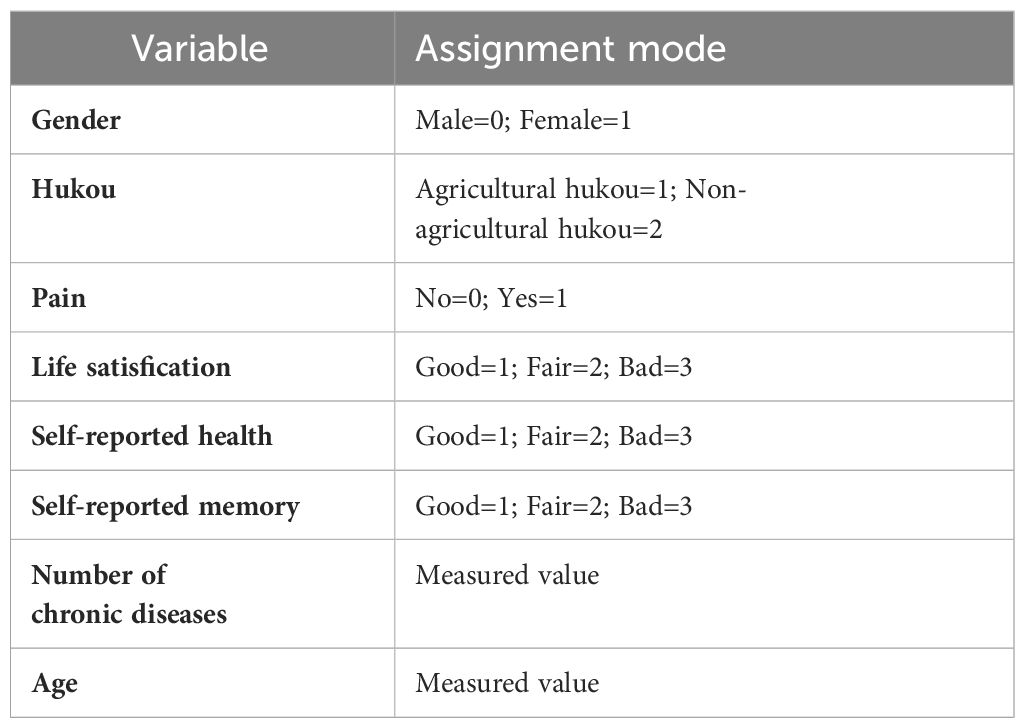
Table 3 Case of variable assignment.
Construction of RF risk prediction model
A total of 2050 samples were used to establish the random forest model in the training group. Based on the value of mtry is 5, when ntree=500, the error basically tends to be stable, and the dynamic relationship between the prediction error of random forest and the number of random trees is shown in Figure 5A. Therefore, it is the optimal model when mtry=6 and mtree=500. According to the mean value of Gini index reduction, the importance of the 10 variables was ranked. Age, number of chronic diseases, life satisfaction, self-rated health, and self-rated memory were the top 5 important indicators for predicting depression in middle-aged and elderly hypertensive people, as shown in Figure 5B.
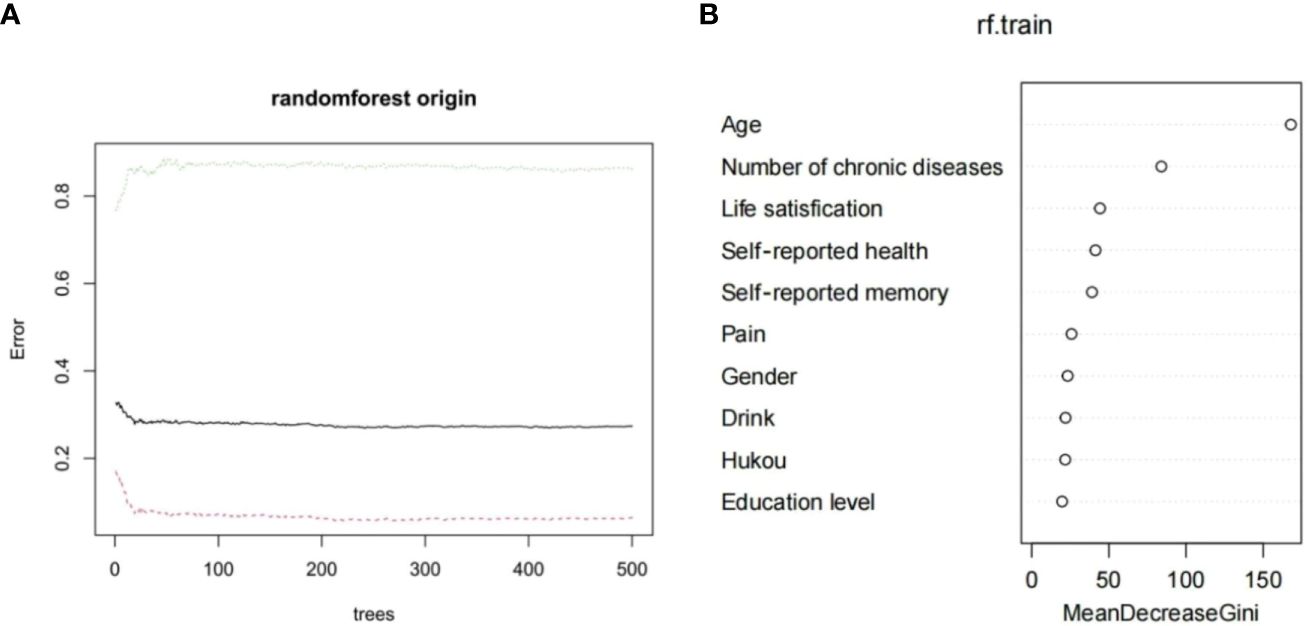
Figure 5 (A) Dynamic relationship between prediction error of random forest and the number of random trees (B) Importance ranking of variable factors based on random forest.
Construction of XGBoost risk prediction model
In this study, risk factors were input into the XGBoost model for analysis. From the feature importance results in Figure 6, it can be seen that the top eight influencing factors are age, number of chronic diseases, pain, life satisfaction, self-rated health, gender, self-rated memory, and drink. Based on these results, the first eight factors were selected as input features for the model in this study.
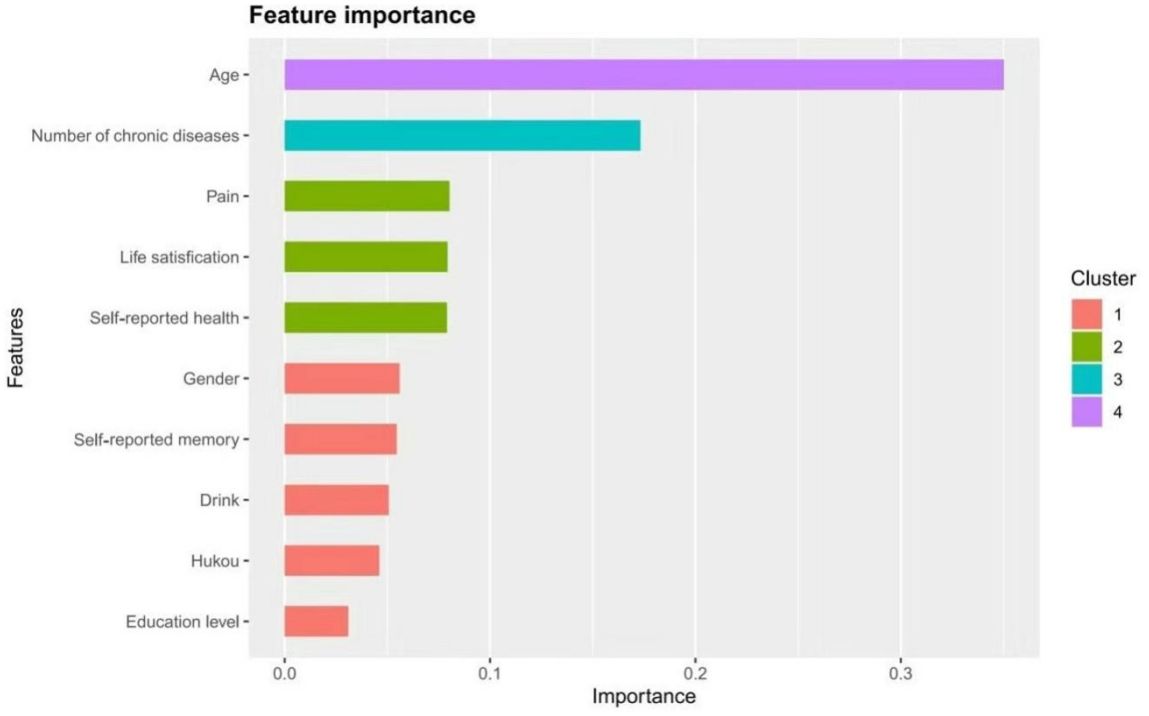
Figure 6 Importance ranking of variable factors based on XGBoost.
Performance comparison results of three prediction models
In this study, we used the 683 participants in the testing set to compare the predictive effects of RF, LR and XGBoost three models on depression in middle-aged and elderly hypertensive people. As shown in Figure 7, the AUCs of the three models in the testing set ranged from 0.7 to 0.712. The AUC value of LR was the highest (AUC=0.712), and the AUC value of RF was the lowest (AUC=0.7). We also evaluated the accuracy, sensitivity, specificity, and other performance indicators of the model, as detailed in Table 4. The thresholds of the three models were 0.271, 0.191 and 0.198, respectively. The sensitivity of the LR model was the highest (0.789), followed by the XGBoost model (0.770), and the NPV of the LR model was the highest (0.716). In general, the LR model performed the best.
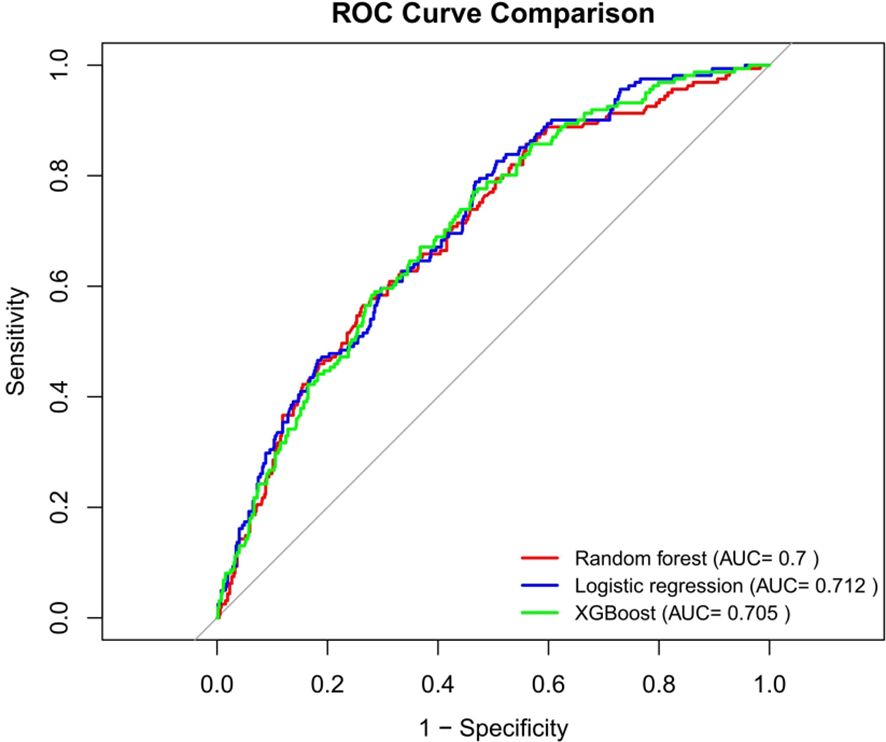
Figure 7 ROC curves for the three models.
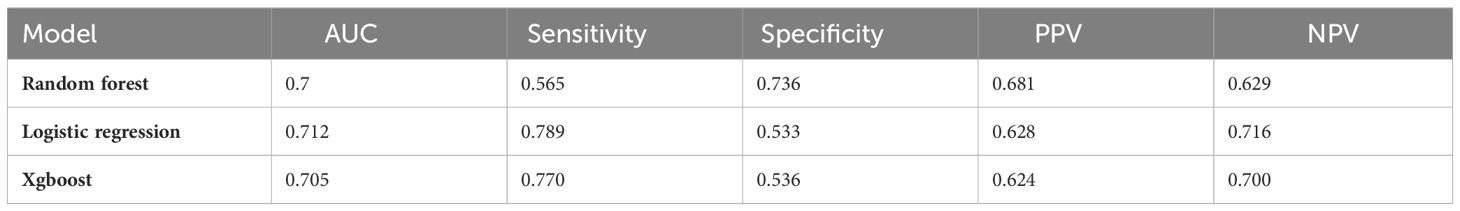
Table 4 Comparison of prediction performance of two kinds of models.
Discussion
Comparative model analysis
According to the 10 selected variables, this study used LR, RF and XGBoost machine learning algorithms to construct the risk prediction models for depression in middle-aged and elderly hypertensive patients and compared the models. The results showed that the LR-based model had the best performance in the area under the ROC curve, sensitivity and NPV, and was the best in general. In contrast, RF had the worst combined performance in several models. Several other machine learning algorithms are better able to deal with complex nonlinear relationships between variables, and using multiple algorithms can find the algorithm that performs best in this dataset, which is helpful to find models with good performance. In addition, we also constructed a nomogram model, which can be used to calculate the risk value of depression in middle-aged and elderly hypertensive patients. For example, female (score 31), agricultural hukou (score 50), pain (score 36.5), fair life satisfaction (score 25), poor self-rated memory (score 20.5), poor self-rated health (score 43), 5 chronic diseases (score 25), and age 80(score 54). These scores are added to give a total score of 285, corresponding to a risk of more than 50%. This means that patients may be at higher risk for depression and therefore require individualized preventive measures.
Influencing factors of depression in middle-aged and elderly patients with hypertension
This study found that depression in middle-aged and elderly patients with hypertension increased with age. This is consistent with the results of previous studies (43–46) and may be caused by factors such as the decline of physiological function and the weakening of psychological tolerance. Maatouk et al. interviewed 3,124 participants aged 57 to 84 years and used Logistic regression analysis to explore the relationship between high blood pressure and depressive symptoms (17). The findings show a significant link between depression and high blood pressure. In addition, individual perception is also influenced by many factors such as society, family, surrounding environment, economic income, culture, and customs (47). This suggests that we need to pay more attention to the mental health of middle-aged and elderly people, especially patients with hypertension. Therefore, in future work, more attention should be paid to the mental health of middle-aged and elderly people with hypertension to alleviate their negative emotions such as depression and anxiety. In addition, female patients were more likely to have depressive symptoms than men, which is consistent with the results of most studies (29, 48, 49). This may be due to the fact that women have a lower psychological tolerance to cope with stress, and are more sensitive to negative emotions, and a higher neuroticism score is also a factor (50). In addition, women often bear dual responsibilities and stress at home and at work, and women with chronic diseases may face difficulties in fulfilling gender-specific social roles, which also increases their risk of depressive and anxiety symptoms (48).
There is also a large difference in depressive symptoms between middle-aged and elderly hypertensive patients in urban and rural areas. Middle-aged and elderly hypertensive patients with agricultural hukou are more likely to have depressive symptoms, which is similar to the results of related studies (51). According to this study, nearly half (40.6%) of the elderly hypertensive patients in rural areas of Jinzhong City of Shanxi Province, China were assessed using the CES-D (Center for Epidemiologic Studies Depression Scale), and nearly half (40.6%) of the patients had depressive symptoms (52). The reasons for this difference may be multifactorial. First of all, the economic level of middle-aged and elderly people in rural areas is much lower than that in towns and cities, which leads to the imperfect living environment, medical level and social security. Due to the limitation of economic conditions, the decrease of life status and satisfaction may increase the incidence of depression in middle-aged and elderly people in rural areas (53). Secondly, hypertensive patients in rural areas have lower awareness of disease, distance from medical institutions, and access to medical resources. This results in a lower sense of well-being for the patient, which in turn triggers depressive feelings.
Therefore, in addition to considering the disease factors of patients themselves, the government can start from the supply of public services and diagnosis and treatment services to formulate relevant policies (54). At the same time, according to the differences between urban and rural areas, different strategies can be taken to improve the mental health status of middle-aged and elderly patients with hypertension in rural areas. This may include better medical resources, better awareness of the disease, and a better social safety net. Through these measures, better support and help can be provided to middle-aged and elderly patients with hypertension and their quality of life can be improved (55).
Patients with hypertension often have other chronic diseases, and the results of this study suggest that those with coexisting chronic diseases are more likely to have depressive symptoms, and the more chronic diseases they have, the more likely they are to have depressive symptoms. This is consistent with other findings (48, 56) and may be due to limitations in daily functioning related to coexisting conditions (48). A similar conclusion was reached in the study by Gray et al. (57), who found that diabetes was an independent predictor of concurrent hypertension and depressive symptoms. In addition, cerebrovascular complications such as stroke and intracerebral hemorrhage were also more common in the depressed group, and many studies have shown that the occurrence of stroke is associated with an increased risk of depressive symptoms (58). Therefore, more attention should be paid to the emotional state of middle-aged and elderly hypertensive patients with multiple diseases in clinical practice.
The results of this study also showed that depressive symptoms were further aggravated if hypertensive patients also suffered from pain. This is similar to the findings of Chen et al (59) and Gerrits et al (60). In addition, a large number of cross-sectional studies have found that patients with pain have an increased risk of depression (61), and similarly, patients with depression have a higher risk of pain than those without depression (62). This may be because pain causes people to be limited in their physical activities, affecting their lives and reducing the frequency of contact with others. As pain and lack of social activities increase psychological distress, this leads to an increased incidence of depression. In conclusion, middle-aged and elderly patients with hypertension often have other chronic diseases, and the coexistence of these chronic diseases as well as pain symptoms may increase the risk of depression. Therefore, these complications should be paid attention to and actively managed in clinical practice to improve the mental health of patients.
Life satisfaction and depressive symptoms are two psychological constructs that are widely recognized and are often used in population health surveys to assess mental health (63). Europe and the United Kingdom and other countries have used life satisfaction as a relevant indicator to evaluate mental health (64). Although relatively few studies have examined the association between life satisfaction and blood pressure, the association has been found to be somewhat protective (65–68). The present study found that middle-aged and elderly hypertensive patients are more likely to have depressive symptoms, which is consistent with the results of previous studies (69). This may be due to the fact that middle-aged and elderly patients with low life satisfaction may experience many negative experiences and life stresses, which can exacerbate depressive moods. Therefore, when helping older people cope with depression, we need to focus on their life satisfaction and quality of life, provide positive support and help to help them cope with negative emotions and stress, and improve their quality of life and mental health.
The results of the present study also showed that patients with poorer self-rated memory had more severe depressive symptoms. Many previous studies have shown that people with high blood pressure have a decline in memory (70, 71). In addition, the results of a 12-year follow-up showed that middle-aged hypertensive people had worse cognitive function than healthy people without hypertension during the same period, and untreated hypertensive people had worse memory and information processing speed than those with stable blood pressure control (71). Subsequently, depressive symptoms occur due to memory loss in hypertensive patients, which has been demonstrated in previous studies (72, 73). Therefore, cognitive function training can be carried out in advance for middle-aged and elderly patients with hypertension in the future, which will contribute to the mental health of patients. In addition, poorer self-rated health was associated with a higher risk of depression. This is similar to the findings of Boima et al (43). On the one hand, it may be because when the self-rated health is poor, the ability of daily life is affected and the quality of life is decreased, resulting in heavier psychological burden, greater pressure, and more likely to produce depressive symptoms. On the other hand, it may be because the decline of health may lead to the limitation of people’s communication and social activities with others. Lack of social support and a sense of isolation, which can also lead to the onset and exacerbation of depressive mood.
Limitations
There are some limitations in this study. First, we were unable to include all possible risk factors due to the structural limitations of the questionnaire. Second, the data relied heavily on respondents’ self-reports, which may be subject to memory bias, subjective interpretation, and social expectations. Finally, although several methods were used to ensure the reliability and generalizability of the model, the results still need to be validated in external independent samples. Despite these limitations, we believe that these findings are instructive for the prevention and intervention of depressive symptoms in middle-aged and elderly patients with hypertension. Future research could further collect data on related factors to make the analysis of factors affecting depression more comprehensive and in-depth.
Conclusion
In this study, a variety of machine learning algorithms were used to construct models for predicting the risk of depression in middle-aged and elderly patients with hypertension. After evaluation and comparison, the LR model was found to be the most predictive model. The results showed that gender, hukou, pain, life satisfaction, self-reported health, self-reported memory, number of chronic diseases, and age are risk factors for depression in middle-aged and elderly hypertensive patients. Medical staff can formulate intervention programs based on these related risk factors and implement them as early as possible to reduce the adverse effects of depression on middle-aged and elderly patients with hypertension.
Data availability statement
Publicly available datasets were analyzed in this study. This data can be found here: The datasets presented in this study can be found in online repositories. The names of the repository/repositories and accession number(s) can be found below: The datasets generated for this study can be found in the China Health and Retirement Longitudinal Study (CHARLS) online datasets (https://charls.charlsdata.com/pages/data/111/zh-cn.html).
Ethics statement
The studies involving humans were approved by the Institutional Review Board of Peking University (IRB00001052-11015). The studies were conducted in accordance with the local legislation and institutional requirements. The participants provided their written informed consent to participate in this study.
Author contributions
FA: Conceptualization, Data curation, Writing – original draft, Writing – review & editing. EL: Conceptualization, Writing – original draft, Writing – review & editing. HZ: Data curation, Writing – review & editing. QJ: Data curation, Writing – original draft.
Funding
The author(s) declare that no financial support was received for the research, authorship, and/or publication of this article.
Acknowledgments
We thank the China Center for Economic Research, National School of Development at Peking.
Conflict of interest
The authors declare that the research was conducted in the absence of any commercial or financial relationships that could be construed as a potential conflict of interest.
Publisher’s note
All claims expressed in this article are solely those of the authors and do not necessarily represent those of their affiliated organizations, or those of the publisher, the editors and the reviewers. Any product that may be evaluated in this article, or claim that may be made by its manufacturer, is not guaranteed or endorsed by the publisher.
References
1. You R, Li W, Ni L, Peng B. Study on the trajectory of depression among middle-aged and elderly disabled people in China: based on group-based trajectory model. SSM Popul Health. (2023) 24:101510. doi: 10.1016/j.ssmph.2023.101510
2. Williams L, Zhang R, Packard KC. Factors affecting the physical and mental health of older adults in China: the importance of marital status, child proximity, and gender. SSM Popul Health. (2017) 3:20–36. doi: 10.1016/j.ssmph.2016.11.005
3. Fan ZY, Yang Y, Zhang CH, Yin RY, Tang L, Zhang F. Prevalence and patterns of comorbidity among middle-aged and elderly people in China: A cross-sectional study based on charls data. Int J Gen Med. (2021) 14:1449–55. doi: 10.2147/ijgm.S309783
4. Liu X, Song F, Liu F, Mao Z, Qu S. Multiple chronic conditions among older adults in China: differences in socio-demographic characteristics. Heliyon. (2022) 8:e11129. doi: 10.1016/j.heliyon.2022.e11129
5. Zhang H, Li S, Chen G, Abdulai T, Liu X, Wang Y, et al. Ambient air pollutants aggravate association of snoring with prevalent hypertension: results from the henan rural cohort. Chemosphere. (2020) 256:127108. doi: 10.1016/j.chemosphere.2020.127108
6. Rajati F, Hamzeh B, Pasdar Y, Safari R, Moradinazar M, Shakiba E, et al. Prevalence, awareness, treatment, and control of hypertension and their determinants: results from the first cohort of non-communicable diseases in a kurdish settlement. Sci Rep. (2019) 9:12409. doi: 10.1038/s41598-019-48232-y
7. Poulter NR, Prabhakaran D, Caulfield M. Hypertension. Lancet. (2015) 386:801–12. doi: 10.1016/s0140-6736(14)61468-9
8. Lin H, Wu Y, Wu J, Chen Q, Yu J, Lin Y. Prevalence of hypertension and 10-year cardiovascular disease risk among older adults living in quanzhou, a coastal region of Southeast China. Risk Manag Healthc Policy. (2022) 15:1045–53. doi: 10.2147/rmhp.S341148
9. Wu Y, Zhao D, Guo J, Lai Y, Chen L, Jin S, et al. Economic burden of depressive symptoms conditions among middle-aged and elderly people with hypertension in China. Int J Environ Res Public Health. (2021) 18. doi: 10.3390/ijerph181910009
10. Turana Y, Tengkawan J, Chia YC, Shin J, Chen CH, Park S, et al. Mental health problems and hypertension in the elderly: review from the hope asia network. J Clin Hypertens (Greenwich). (2021) 23:504–12. doi: 10.1111/jch.14121
11. Almas A, Patel J, Ghori U, Ali A, Edhi AI, Khan MA. Depression is linked to uncontrolled hypertension: A case-control study from Karachi, Pakistan. J Ment Health. (2014) 23:292–6. doi: 10.3109/09638237.2014.924047
12. Kretchy IA, Owusu-Daaku FT, Danquah SA. Mental health in hypertension: assessing symptoms of anxiety, depression and stress on anti-hypertensive medication adherence. Int J Ment Health Syst. (2014) 8:25. doi: 10.1186/1752-4458-8-25
13. Liu X, Bai G, Li H, Li S. Applying sf-6d to measure health state utilities among the middle and old aged patients with hypertension in China. Health Qual Life Outcomes. (2020) 18:385. doi: 10.1186/s12955-020-01598-4
14. Li Z, Li Y, Chen L, Chen P, Hu Y. Prevalence of depression in patients with hypertension: A systematic review and meta-analysis. Med (Baltimore). (2015) 94:e1317. doi: 10.1097/md.0000000000001317
15. Wu NW, Yang F, Xia J, Ma TP, Yu C, Li NX. Analysis of the status of depression and the influencing factors in middle-aged and older adults in China. Sichuan Da Xue Xue Bao Yi Xue Ban. (2021) 52:767–71. doi: 10.12182/20210960507
16. Jin Y, Luo Y, He P. Hypertension, socioeconomic status and depressive symptoms in chinese middle-aged and older adults: findings from the China health and retirement longitudinal study. J Affect Disord. (2019) 252:237–44. doi: 10.1016/j.jad.2019.04.002
17. Maatouk I, Herzog W, Böhlen F, Quinzler R, Löwe B, Saum KU, et al. Association of hypertension with depression and generalized anxiety symptoms in a large population-based sample of older adults. J Hypertens. (2016) 34:1711–20. doi: 10.1097/hjh.0000000000001006
18. Shay M, MacKinnon AL, Metcalfe A, Giesbrecht G, Campbell T, Nerenberg K, et al. Depressed mood and anxiety as risk factors for hypertensive disorders of pregnancy: A systematic review and meta-analysis. Psychol Med. (2020) 50:2128–40. doi: 10.1017/s0033291720003062
19. Musselman DL, Evans DL, Nemeroff CB. The relationship of depression to cardiovascular disease: epidemiology, biology, and treatment. Arch Gen Psychiatry. (1998) 55:580–92. doi: 10.1001/archpsyc.55.7.580
20. Graham N, Smith DJ. Comorbidity of depression and anxiety disorders in patients with hypertension. J Hypertens. (2016) 34:397–8. doi: 10.1097/hjh.0000000000000850
21. Suchy-Dicey A, Verney SP, Nelson LA, Barbosa-Leiker C, Howard BA, Crane PK, et al. Depression symptoms and cognitive test performance in older american Indians: the strong heart study. J Am Geriatr Soc. (2020) 68:1739–47. doi: 10.1111/jgs.16434
22. Gunn JM, Ayton DR, Densley K, Pallant JF, Chondros P, Herrman HE, et al. The association between chronic illness, multimorbidity and depressive symptoms in an Australian primary care cohort. Soc Psychiatry Psychiatr Epidemiol. (2012) 47:175–84. doi: 10.1007/s00127-010-0330-z
23. Hammen C. Risk factors for depression: an autobiographical review. Annu Rev Clin Psychol. (2018) 14:1–28. doi: 10.1146/annurev-clinpsy-050817-084811
25. Bromet E, Andrade LH, Hwang I, Sampson NA, Alonso J, de Girolamo G, et al. Cross-national epidemiology of dsm-iv major depressive episode. BMC Med. (2011) 9:90. doi: 10.1186/1741-7015-9-90
26. Whiteford HA, Degenhardt L, Rehm J, Baxter AJ, Ferrari AJ, Erskine HE, et al. Global burden of disease attributable to mental and substance use disorders: findings from the global burden of disease study 2010. Lancet. (2013) 382:1575–86. doi: 10.1016/s0140-6736(13)61611-6
27. Gu L, Xie J, Long J, Chen Q, Chen Q, Pan R, et al. Epidemiology of major depressive disorder in mainland China: A systematic review. PloS One. (2013) 8:e65356. doi: 10.1371/journal.pone.0065356
29. Graham N, Ward J, Mackay D, Pell JP, Cavanagh J, Padmanabhan S, et al. Impact of major depression on cardiovascular outcomes for individuals with hypertension: prospective survival analysis in uk biobank. BMJ Open. (2019) 9:e024433. doi: 10.1136/bmjopen-2018-024433
30. Saboya PM, Zimmermann PR, Bodanese LC. Association between anxiety or depressive symptoms and arterial hypertension, and their impact on the quality of life. Int J Psychiatry Med. (2010) 40:307–20. doi: 10.2190/PM.40.3.f
31. Hamam MS, Kunjummen E, Hussain MS, Nasereldin M, Bennett S, Miller J. Anxiety, depression, and pain: considerations in the treatment of patients with uncontrolled hypertension. Curr Hypertens Rep. (2020) 22:106. doi: 10.1007/s11906-020-01117-2
32. Rantanen AT, Korkeila JJA, Löyttyniemi ES, Saxén UKM, Korhonen PE. Awareness of hypertension and depressive symptoms: A cross-sectional study in a primary care population. Scand J Prim Health Care. (2018) 36:323–8. doi: 10.1080/02813432.2018.1499588
33. Carroll D, Phillips AC, Gale CR, Batty GD. Generalized anxiety and major depressive disorders, their comorbidity and hypertension in middle-aged men. Psychosom Med. (2010) 72:16–9. doi: 10.1097/PSY.0b013e3181c4fca1
34. Kong L, Zhang H. Latent profile analysis of depression in non-hospitalized elderly patients with hypertension and its influencing factors. J Affect Disord. (2023) 341:67–76. doi: 10.1016/j.jad.2023.08.114
35. Saberi-Karimian M, Khorasanchi Z, Ghazizadeh H, Tayefi M, Saffar S, Ferns GA, et al. Potential value and impact of data mining and machine learning in clinical diagnostics. Crit Rev Clin Lab Sci. (2021) 58:275–96. doi: 10.1080/10408363.2020.1857681
36. Rajkomar A, Dean J, Kohane I. Machine learning in medicine. N Engl J Med. (2019) 380:1347–58. doi: 10.1056/NEJMra1814259
37. Samuel AL. Some studies in machine learning using the game of checkers. I. In: Levy DNL, editor. Computer Games I, vol. . p . Springer New York, New York, NY (1988). p. 335–65.
38. Liao F, Wang W, Zhou B, Yu SB, Su RC, Gou L, et al. [Longitudinal cohort study of the relationship between sleep duration and depressive symptoms in older people in China]. Sichuan Da Xue Xue Bao Yi Xue Ban. (2022) 53:109–13. doi: 10.12182/20220160204
39. Zhao Y, Hu Y, Smith JP, Strauss J, Yang G. Cohort profile: the China health and retirement longitudinal study (Charls). Int J Epidemiol. (2014) 43:61–8. doi: 10.1093/ije/dys203
40. Chen H, Mui AC. Factorial validity of the center for epidemiologic studies depression scale short form in older population in China. Int Psychogeriatr. (2014) 26:49–57. doi: 10.1017/s1041610213001701
41. Cheng ST, Chan AC, Fung HH. Factorial structure of a short version of the center for epidemiologic studies depression scale. Int J Geriatr Psychiatry. (2006) 21:333–6. doi: 10.1002/gps.1467
42. Andresen EM, Malmgren JA, Carter WB, Patrick DL. Screening for depression in well older adults: evaluation of a short form of the ces-D (Center for epidemiologic studies depression scale). Am J Prev Med. (1994) 10:77–84. doi: 10.1016/S0749-3797(18)30622-6
43. Boima V, Tetteh J, Yorke E, Archampong T, Mensah G, Biritwum R, et al. Older adults with hypertension have increased risk of depression compared to their younger counterparts: evidence from the world health organization study of global ageing and adult health wave 2 in Ghana. J Affect Disord. (2020) 277:329–36. doi: 10.1016/j.jad.2020.08.033
44. Wang L, Li N, Heizhati M, Li M, Pan F, Yang Z, et al. Prevalence and predictive nomogram of depression among hypertensive patients in primary care: A cross-sectional study in less developed Northwest China. Med (Baltimore). (2021) 100:e24422. doi: 10.1097/md.0000000000024422
45. Mahmood S, Hassan SZ, Tabraze M, Khan MO, Javed I, Ahmed A, et al. Prevalence and predictors of depression amongst hypertensive individuals in Karachi, Pakistan. Cureus. (2017) 9:e1397. doi: 10.7759/cureus.1397
46. Hamrah MS, Hamrah MH, Ishii H, Suzuki S, Hamrah MH, Hamrah AE, et al. Anxiety and depression among hypertensive outpatients in Afghanistan: A cross-sectional study in andkhoy city. Int J Hypertens. (2018) 2018:8560835. doi: 10.1155/2018/8560835
47. Naeim A, Aapro M, Subbarao R, Balducci L. Supportive care considerations for older adults with cancer. J Clin Oncol. (2014) 32:2627–34. doi: 10.1200/jco.2014.55.3065
48. Zhang B, Zhang W, Sun X, Ge J, Liu D. Physical comorbidity and health literacy mediate the relationship between social support and depression among patients with hypertension. Front Public Health. (2020) 8:304. doi: 10.3389/fpubh.2020.00304
49. Platt J, Prins S, Bates L, Keyes K. Unequal depression for equal work? How the wage gap explains gendered disparities in mood disorders. Soc Sci Med. (2016) 149:1–8. doi: 10.1016/j.socscimed.2015.11.056
50. Okunrinboye HI, Otakpor AN, Ilesanmi OS. Depression and medication-adherence in patients with hypertension attending a tertiary health facility in south-west Nigeria. Pan Afr Med J. (2019) 33:27. doi: 10.11604/pamj.2019.33.27.12941
51. Yuan Y, Peng C, Burr JA, Lapane KL. Frailty, cognitive impairment, and depressive symptoms in chinese older adults: an eight-year multi-trajectory analysis. BMC Geriatr. (2023) 23:843. doi: 10.1186/s12877-023-04554-1
52. Ma C. The prevalence of depressive symptoms and associated factors in countryside-dwelling older chinese patients with hypertension. J Clin Nurs. (2018) 27:2933–41. doi: 10.1111/jocn.14349
53. Szöke A, Charpeaud T, Galliot AM, Vilain J, Richard JR, Leboyer M, et al. Rural-urban variation in incidence of psychosis in France: A prospective epidemiologic study in two contrasted catchment areas. BMC Psychiatry. (2014) 14:78. doi: 10.1186/1471-244x-14-78
54. Yin R, Yin L, Li L, Silva-Nash J, Tan J, Pan Z, et al. Hypertension in China: burdens, guidelines and policy responses: A state-of-the-art review. J Hum Hypertension. (2022) 36:126–34. doi: 10.1038/s41371-021-00570-z
55. Chen Q, Ran L, Li M, Tan X. Health-related quality of life of middle-aged and elderly people with hypertension: A cross-sectional survey from a rural area in China. PloS One. (2021) 16:e0246409. doi: 10.1371/journal.pone.0246409
56. Zhang Y, Chen Y, Ma L. Depression and cardiovascular disease in elderly: current understanding. J Clin Neurosci. (2018) 47:1–5. doi: 10.1016/j.jocn.2017.09.022
57. Gray CA, Sims OT, Oh H. Prevalence and predictors of co-occurring hypertension and depression among community-dwelling older adults. J Racial Ethn Health Disparities. (2020) 7:365–73. doi: 10.1007/s40615-019-00665-x
58. Das J, KR G. Post stroke depression: the sequelae of cerebral stroke. Neurosci Biobehav Rev. (2018) 90:104–14. doi: 10.1016/j.neubiorev.2018.04.005
59. Chen Y, Wu M, Zeng T, Peng C, Zhao M, Xiao Q, et al. Effect of pain on depression among nursing home residents: serial mediation of perceived social support and self-rated health. A cross-sectional study. Geriatr Gerontol Int. (2020) 20:1234–40. doi: 10.1111/ggi.14067
60. Gerrits M, van Oppen P, van Marwijk HWJ, Penninx B, van der Horst HE. Pain and the onset of depressive and anxiety disorders. Pain. (2014) 155:53–9. doi: 10.1016/j.pain.2013.09.005
61. Bauer H, Emeny RT, Baumert J, Ladwig KH. Resilience moderates the association between chronic pain and depressive symptoms in the elderly. Eur J Pain. (2016) 20:1253–65. doi: 10.1002/ejp.850
62. Ohayon MM, Stingl JC. Prevalence and comorbidity of chronic pain in the german general population. J Psychiatr Res. (2012) 46:444–50. doi: 10.1016/j.jpsychires.2012.01.001
63. Keyes CL. Mental illness and/or mental health? Investigating axioms of the complete state model of health. J Consult Clin Psychol. (2005) 73:539–48. doi: 10.1037/0022-006x.73.3.539
64. Gigantesco A, Fagnani C, Toccaceli V, Stazi MA, Lucidi F, Violani C, et al. The relationship between satisfaction with life and depression symptoms by gender. Front Psychiatry. (2019) 10:419. doi: 10.3389/fpsyt.2019.00419
65. Guimond AJ, Kubzansky LD, Boehm JK, Kivimaki M, Trudel-Fitzgerald C. Does life satisfaction reduce risk of incident hypertension and stroke? Evidence from the whitehall ii cohort. J Psychosom Res. (2021) 144:110414. doi: 10.1016/j.jpsychores.2021.110414
66. Steptoe A, Wardle J. Positive affect and biological function in everyday life. Neurobiol Aging. (2005) 26 Suppl 1:108–12. doi: 10.1016/j.neurobiolaging.2005.08.016
67. Ostir GV, Berges IM, Markides KS, Ottenbacher KJ. Hypertension in older adults and the role of positive emotions. Psychosom Med. (2006) 68:727–33. doi: 10.1097/01.psy.0000234028.93346.38
68. Trudel-Fitzgerald C, Boehm JK, Kivimaki M, Kubzansky LD. Taking the tension out of hypertension: A prospective study of psychological well being and hypertension. J Hypertens. (2014) 32:1222–8. doi: 10.1097/hjh.0000000000000175
69. An L, Ma L, Xu N, Yu B. Life satisfaction, depressive symptoms, and blood pressure in the middle-aged and older chinese population. J Psychosom Res. (2023) 170:111367. doi: 10.1016/j.jpsychores.2023.111367
70. González HM, Tarraf W, Harrison K, Windham BG, Tingle J, Alonso A, et al. Midlife cardiovascular health and 20-year cognitive decline: atherosclerosis risk in communities study results. Alzheimers Dement. (2018) 14:579–89. doi: 10.1016/j.jalz.2017.11.002
71. Köhler S, Baars MA, Spauwen P, Schievink S, Verhey FR, van Boxtel MJ. Temporal evolution of cognitive changes in incident hypertension: prospective cohort study across the adult age span. Hypertension. (2014) 63:245–51. doi: 10.1161/hypertensionaha.113.02096
72. Ellis HC, Ottaway SA, Varner LJ, Becker AS, Moore BA. Emotion, motivation, and text comprehension: the detection of contradictions in passages. J Exp Psychol Gen. (1997) 126:131–46. doi: 10.1037//0096-3445.126.2.131
Keywords: hypertension, depression, middle-aged and elderly, machine learning, prediction model
Citation: Ai F, Li E, Ji Q and Zhang H (2024) Construction of a machine learning-based risk prediction model for depression in middle-aged and elderly hypertensive people in China: a longitudinal study. Front. Psychiatry 15:1398596. doi: 10.3389/fpsyt.2024.1398596
Received: 10 March 2024; Accepted: 22 April 2024;
Published: 03 May 2024.
Edited by:
Ali Saffet Gonul, Ege University, TürkiyeCopyright © 2024 Ai, Li, Ji and Zhang. This is an open-access article distributed under the terms of the Creative Commons Attribution License (CC BY). The use, distribution or reproduction in other forums is permitted, provided the original author(s) and the copyright owner(s) are credited and that the original publication in this journal is cited, in accordance with accepted academic practice. No use, distribution or reproduction is permitted which does not comply with these terms.
*Correspondence: Huijun Zhang, MTM5MDQwNjk2MDZAMTYzLmNvbQ==
†These authors have contributed equally to this work and share first authorship