Abstract
Background:
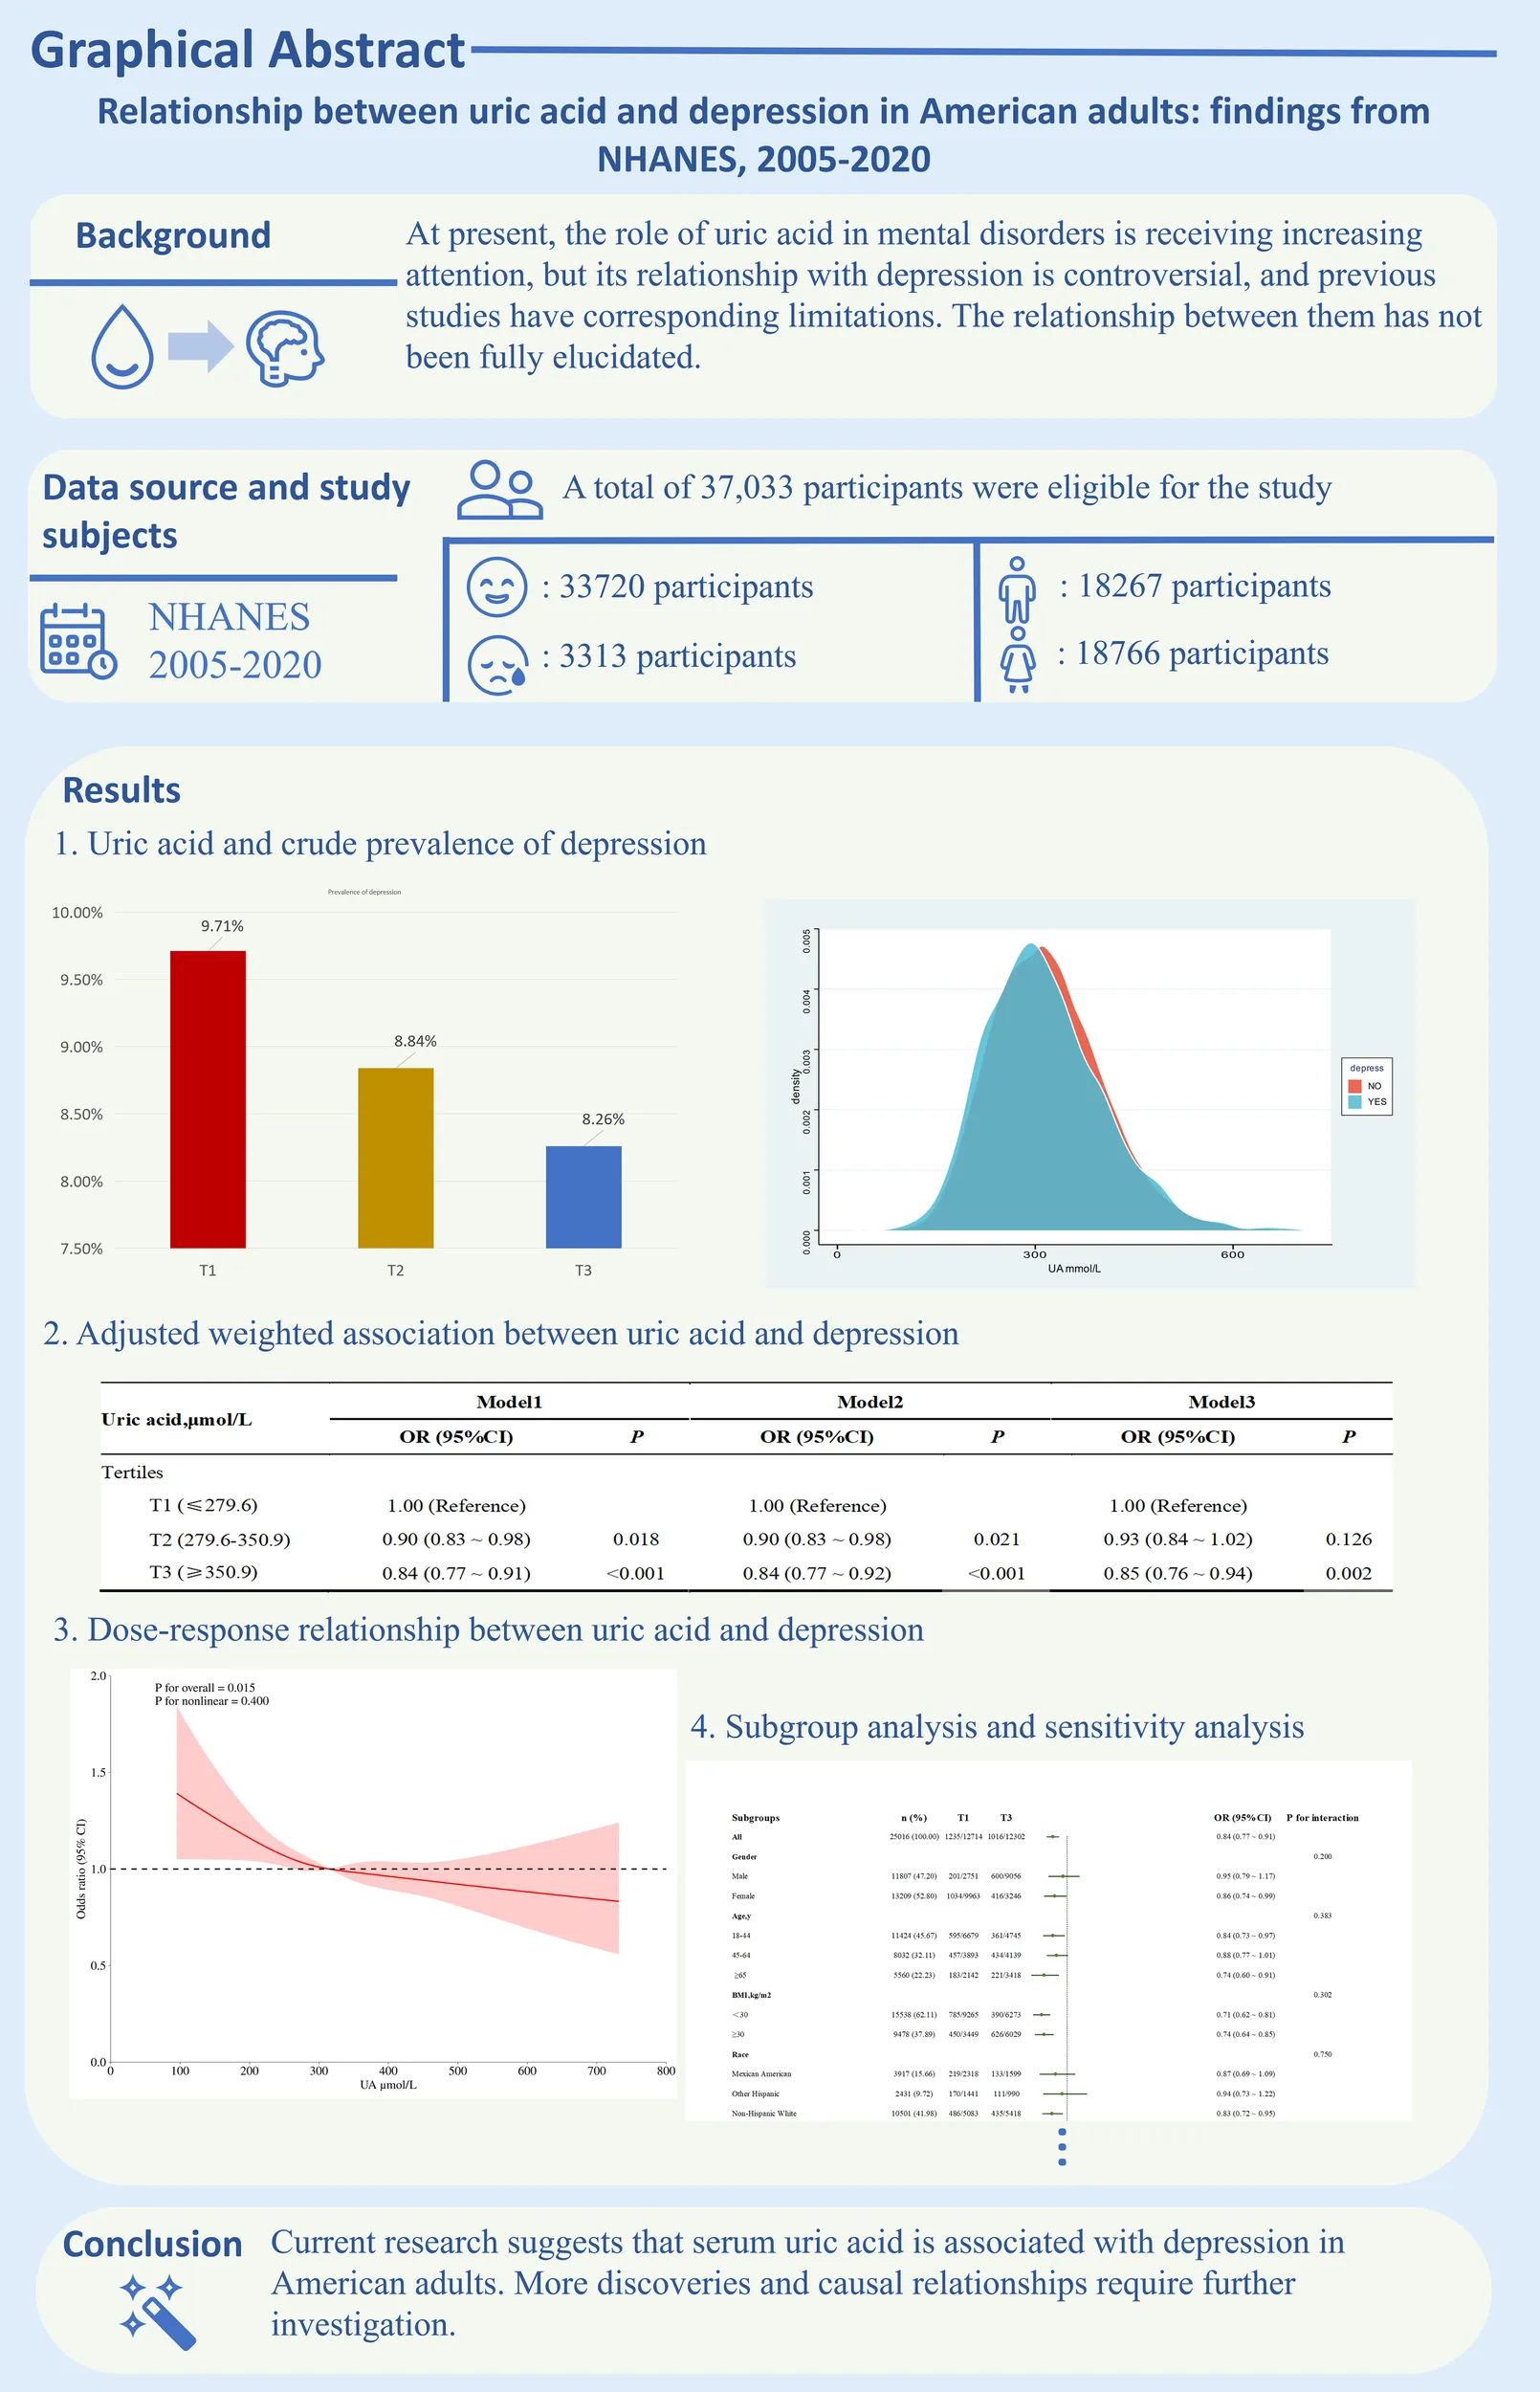
At present, the role of uric acid in mental disorders is receiving increasing attention, but its relationship with depression is controversial, and previous studies have corresponding limitations. The relationship between them has not been fully elucidated.
Objective:
The purpose of this study is to explore the relationship between uric acid and depression in American adults using data from the National Health and Nutrition Examination Survey (NHANES).
Methods:
This cross-sectional study included participants from the National Health and Nutrition Examination Survey 2011-2020. Use logistic regression and restricted cubic spline analysis to investigate the relationship between uric acid and depression. The interactions between variables were determined using subgroup analysis and described in a forest plot.
Results:
37033 participants were included in this study, with depression patients accounting for 8.95%. The uric acid levels in the depression group and nondepression group were 317.69 μ mol/L and 323.34 μ mol/L, respectively, with the former having significantly lower uric acid levels than the latter. In the fully adjusted model, participants in the third tertile of uric acid showed a significant correlation (P=0.002, OR; 0.85 (0.76 ~ 0.94)) with a higher risk of depression compared to participants in the first tertile. There is an approximately linear negative correlation between uric acid and depression (P for nonlinear=0.360), and the OR value of uric acid is 1 when the uric acid value is 312.20 μ mol/L.
Conclusions:
Current research suggests that serum uric acid is associated with depression in American adults. More discoveries and causal relationships require further investigation.
Introduction
As people’s awareness of mental illnesses continues to deepen, depression has garnered increasing attention (1). Depression is defined as a prolonged period of low mood or a loss of pleasure or interest in activities (2). It is estimated that approximately 5% of adults worldwide suffer from depression each year, and this figure is still on the rise (1, 3). The diagnosis and treatment of depression are also not optimistic. In developed countries, about half of depressed patients do not receive proper diagnosis and treatment, while in developing countries, this figure increases to 80%-90% (4). Patients with depression who do not receive proper diagnosis and treatment can appear in various populations, causing immeasurable losses to individuals, families, and society (3, 5, 6). Studies have shown that major depression will become the biggest burden of non-fatal health loss by 2030 (3, 7).
Uric acid is a well-known substance, which is the ultimate product of the metabolism of adenine and guanine (8). In the past, uric acid was often regarded as a metabolic waste, but now people are paying more and more attention to its physiological role. The role of uric acid is diverse. It can react with various oxidants to form free radicals (9), reduce the bioavailability of NO, inhibit cell migration and endothelial cell proliferation, and promote oxidation and inflammation (10–14), It can also scavenge superoxide anions and inhibit the formation of nitrated tyrosine (15, 16), thus achieving anti-inflammatory and antioxidant protective effects (17–20). In addition, it can also affect changes in white matter connectivity (21). The interaction of various mechanisms is related to uric acid concentration, the type and concentration of free radicals, the patient’s own state, and the type of disease, presenting a very complex state (22, 23).
There is much debate about the relationship between uric acid and depression, with varying effects observed in different regions and populations. A study in the elderly population in China found that the prevalence of depression among uric acid-hypertension participants was not high in women, with a negative correlation between uric acid and depression, which was not found in men (24). However, another cross-sectional study showed that higher serum uric acid was associated with depression in postmenopausal women (25). In the elderly population in South Korea, uric acid was negatively correlated with depression in elderly women but was unrelated to depression in elderly men (26). A study on depression and anxiety from the Netherlands showed that patients with severe depression had lower uric acid levels, but there were no confounding factors such as diet (27). However, the results of a Mendelian randomization study from Europe and South America suggest that there is no significant causal relationship between serum uric acid and severe depression from a genetic perspective (28).
The relationship between uric acid and depression has been reported inconsistently in the literature, with some studies even yielding contradictory findings. Certain studies have been limited by the absence of relevant confounding factors, inadequate sample sizes, or restricted conclusions (24–28). Consequently, it is crucial to address these existing limitations. Thus, this study aims to investigate the association between uric acid levels and depression among adults in the United States utilizing data from the National Health and Nutrition Examination Survey (NHANES).
Methods
Data source
NHANES is a continuous, nationally representative survey that will be used to assess the nutritional status and its association with health promotion and disease prevention (29). This study was exempt from institutional review board review because the NHANES dataset is unidentified and publicly available.
Variable definitions
The Patient Health Questionnaire-9 (PHQ-9), first published in 2001, has been included in numerous depression guidelines and implemented in many clinical practice settings, becoming a widely recognized questionnaire for depression assessment (30). NHANES began using the PHQ-9 as a depression diagnostic criterion in 2005. Therefore, we selected data from survey participants from 2005 to the latest (i.e., 2005-2020) as the research object.
We consider a PHQ-9 score of 10 or higher as a diagnosis of depression. The uric acid data is from the Standard Biochemistry Profile in Laboratory Data. Other variables included are: gender (male and female); age (years) (18-44, 45-64,and≥65); race/ethnicity (Mexican American, Other Hispanic, Non-Hispanic Black, and Other Race); educational level (Less than 9th grade, 9-11th grade, High school graduate, Some college or AA degree,and College graduate or above); Marital status (Married/Living with Partner, Widowed/Divorced/Separated and Never married); Family monthly poverty level category (≤1.30, 1.30 -1.85, >1.85, Refused and Don’t know); Moderate work activity-defined as at least 10 minutes of moderate activity that increases the participant’s breathing and heart rate (yes or no); Sleeping trouble-defined as having ever told a doctor or other health professional that you have trouble sleeping (yes or no); Smoking: defined as having smoked at least 100 cigarettes in a lifetime (yes or no); Drinking-defined as having consumed at least 12 alcoholic beverages in one’s lifetime (yes or no); High blood pressure(yes or no); High cholesterol level(yes or no); Diabetes (yes or no); BMI (kg/m2) (<30, ≥30); Total energy intake (kcal/day) (≤2100, >2100) and serum creatinine levels(μmol/L)(≤44, 44 -133, >133). We also collected information on the use of medications for hypertension, hyperlipidemia, and diabetes whenever possible. Additionally, we gathered detailed data on the types and quantities of foods and beverages (including all types of water) consumed in the 24 hours preceding the survey (from midnight to midnight) and converted this information into various dietary nutrients.
Statistical analysis
Continuous variables with normally distributed data are expressed as mean ± standard deviation (SD), while continuous variables with non-normally distributed data are expressed as median within the range of tertiles, and categorical data are displayed as frequency percentages. The baseline characteristics of depressive symptoms were evaluated using independent two-sample t-tests for continuous variables and chi-square tests for categorical variables. Binary logistic regression analysis was used to determine the odds ratio (OR) and 95% confidence interval (CI) between uric acid and depression. The relationship between uric acid concentration and depression was evaluated through the RCS curve. Use subgroup analysis to test interactions and display adjusted OR and 95% CI in forest plots. Compare the third tertile and the first tertile of uric acid in subgroup analysis to enhance statistical power. In all analyses, a p-value of < 0.05 on both sides was considered statistically significant. All data analysis was performed using R software version 4.1.3 (www.R-project.org) and SPSS software (version 26; IBM Corp; Armonk, NY, USA).
Results
Characteristics and parameters of the participants
As shown in Figure 1. A total of 73292 participants were included in the NHANES cycle from 2005 to 2020, including 27312 participants aged < 18 years, 5062 participants with missing serum uric acid data, 3486 participants with missing depression data, 399 participants who refused to answer or did not know in other included variables (except family monthly poverty level category), and only 37033 participants were finally included in this study. There were 33720 participants without depression and 3313 patients with depression, accounting for 8.95%. The prevalence was consistent with that of the general population in the United States in other studies (31).
Figure 1

Study flow diagram.
Table 1 shows that the uric acid levels of the depression group and non-depression group are 317.69 μ mol/l and 323.34 μ mol/l respectively, and the serum uric acid level of the former is significantly lower than that of the latter. In addition, compared with the non-depression group, the BMI of the depression group was higher, but the total energy intake was lower. Men and women accounted for almost half of the total population respectively, but the proportion of women in the depression group was significantly greater than that of men, accounting for 62.66%. In addition, within the race, education level, marital status, and family monthly poverty level category groups, there were statistically significant differences between the depression group and the non-depression group (P <0.001). Finally, participants without moderate work activity and with sleeping trouble, smoking, drinking, high blood pressure, high cholesterol level, and diabetes accounted for a higher proportion in the depression group (P <0.001). The specific details regarding the intake of various dietary nutrients and medications are provided in Supplementary Table 1. Compared with individuals in the general population, those with depression consumed less protein, fiber, and various antioxidant-rich foods but more sugar and caffeine. There were no significant differences between the two groups in the use of antihypertensive and lipid-lowering medications, while the use of diabetes medications was more prevalent among individuals with depression.
Table 1
| Characteristics | Total (n = 37033) |
depression (n = 33720) | Normal (n = 3313) | P |
|---|---|---|---|---|
| Uric acid,μmol/L | 322.84 ± 85.92 | 323.34 ± 85.64 | 317.69 ± 88.57 | <0.001 |
| Age,y | 47.90 ± 18.62 | 47.88 ± 18.75 | 48.06 ± 17.33 | 0.574 |
| BMI, kg/m2 | 29.18 ± 7.06 | 29.01 ± 6.89 | 30.88 ± 8.40 | <0.001 |
| Total energy intake, kcal/day, | 2124.37 ± 1005.49 | 2133.13 ± 1000.52 | 2035.19 ± 1050.82 | <0.001 |
| Serum creatinine,μmol/L | 79.81 ± 40.12 | 79.80 ± 38.07 | 79.99 ± 56.94 | 0.844 |
| Gender, n(%) | <0.001 | |||
| Male | 18267 (49.33) | 17030 (50.50) | 1237 (37.34) | |
| Female | 18766 (50.67) | 16690 (49.50) | 2076 (62.66) | |
| Race, n(%) | <0.001 | |||
| Mexican American | 5876 (15.87) | 5360 (15.90) | 516 (15.58) | |
| Other Hispanic | 3598 (9.72) | 3173 (9.41) | 425 (12.83) | |
| Non-Hispanic White | 15591 (42.10) | 14232 (42.21) | 1359 (41.02) | |
| Non-Hispanic Black | 8022 (21.66) | 7278 (21.58) | 744 (22.46) | |
| Other Race | 3946 (10.66) | 3677 (10.90) | 269 (8.12) | |
| Education level, n(%) | <0.001 | |||
| Less than 9th grade | 3494 (9.43) | 3030 (8.99) | 464 (14.01) | |
| 9-11th grade | 5120 (13.83) | 4460 (13.23) | 660 (19.92) | |
| High school graduate | 8542 (23.07) | 7731 (22.93) | 811 (24.48) | |
| Some college or AA degree | 11267 (30.42) | 10260 (30.43) | 1007 (30.40) | |
| College graduate or above | 8610 (23.25) | 8239 (24.43) | 371 (11.20) | |
| Marital status, n(%) | <0.001 | |||
| Married/Living with Partner | 21631 (58.41) | 20119 (59.66) | 1512 (45.64) | |
| Widowed/Divorced/Separated | 7750 (20.93) | 6690 (19.84) | 1060 (32.00) | |
| Never married | 7652 (20.66) | 6911 (20.50) | 741 (22.37) | |
| Family monthly poverty level category, n(%) | <0.001 | |||
| ≤1.30 | 12506 (33.77) | 10773 (31.95) | 1733 (52.31) | |
| 1.30 -1.85 | 5219 (14.09) | 4721 (14.00) | 498 (15.03) | |
| >1.85 | 18472 (49.88) | 17467 (51.80) | 1005 (30.34) | |
| Refused | 220 (0.59) | 208 (0.62) | 12 (0.36) | |
| Don't know | 616 (1.66) | 551 (1.63) | 65 (1.96) | |
| Moderate work activity, n(%) | <0.001 | |||
| Yes | 15339 (41.42) | 14100 (41.81) | 1239 (37.40) | |
| No | 21694 (58.58) | 19620 (58.19) | 2074 (62.60) | |
| Sleeping trouble, n(%) | <0.001 | |||
| Yes | 9354 (25.26) | 7477 (22.17) | 1877 (56.66) | |
| No | 27679 (74.74) | 26243 (77.83) | 1436 (43.34) | |
| Smoking, n(%) | <0.001 | |||
| Yes | 16166 (43.65) | 14268 (42.31) | 1898 (57.29) | |
| No | 20867 (56.35) | 19452 (57.69) | 1415 (42.71) | |
| Drinking, n(%) | <0.001 | |||
| Yes | 27090 (73.15) | 24577 (72.89) | 2513 (75.85) | |
| No | 9943 (26.85) | 9143 (27.11) | 800 (24.15) | |
| High blood pressure, n(%) | <0.001 | |||
| Yes | 12744 (34.41) | 11225 (33.29) | 1519 (45.85) | |
| No | 24289 (65.59) | 22495 (66.71) | 1794 (54.15) | |
| High cholesterol level, n(%) | <0.001 | |||
| Yes | 13367 (36.09) | 11933 (35.39) | 1434 (43.28) | |
| No | 23666 (63.91) | 21787 (64.61) | 1879 (56.72) | |
| Diabetes, n(%) | <0.001 | |||
| Yes | 4548 (12.28) | 3928 (11.65) | 620 (18.71) | |
| No | 31652 (85.47) | 29059 (86.18) | 2593 (78.27) |
Characteristics of the study population.
Continuous variables are expressed as mean (SD) for normally distributed data and as median with interquartile range for non normally distributed data. Categorical variables are expressed as percentages.
Relationship between uric acid and risk of depression
As shown in Table 2, we evaluated the risk relationship between uric acid and depression in the original model and the adjusted model respectively. In the original model, compared with participants in uric acid tertile 1, participants in uric acid tertiles 2 and 3 were significantly associated with the risk of depression, with P and OR values of P=0.018, OR:0.90 (0.83 ~ 0.98), P<0.001, OR:0.84 (0.77 ~ 0.91), respectively. Model 2 included age and gender in the analysis, and the final results were consistent with the original model. After additional adjustments for gender, age, race/ethics, educational level, marital status, family monthly population level category, moderate work activity, sleeping trouble, smoking, drinking, high blood pressure, high cholesterol level, diabetes, BMI, total energy intake and serum creatinine levels, model 3 still found that participants with serum uric acid tertile 3 had significantly higher risk of depression than those with tertile 1 (P=0.002, OR:0.85 (0.76 ~ 0.94)).In Supplementary Table 2, we added dietary nutrients and medication use as confounding factors and adjusted for them. The results remained robust (P = 0.033, OR: 0.81 (0.66–0.98)).
Table 2
| Uric acid,μmol/L | Model1 | Model2 | Model3 | |||
|---|---|---|---|---|---|---|
| OR (95%CI) | P | OR (95%CI) | P | OR (95%CI) | P | |
| Tertiles | ||||||
| T1 (≤279.6) | 1.00 (Reference) | 1.00 (Reference) | 1.00 (Reference) | |||
| T2 (279.6-350.9) | 0.90 (0.83 ~ 0.98) | 0.018 | 0.90 (0.83 ~ 0.98) | 0.021 | 0.93 (0.84 ~ 1.02) | 0.126 |
| T3 (≥350.9) | 0.84 (0.77 ~ 0.91) | <0.001 | 0.84 (0.77 ~ 0.92) | <0.001 | 0.85 (0.76 ~ 0.94) | 0.002 |
The relationship between uric acid and the risk of depression.
OR, Odds Ratio; CI, Confidence Interval; Model1: Crude; Model2: Adjust: Age, Race; Model3: Adjust: Age, Gender, BMI, Race, Education level, Marital status, Family monthly poverty level category, Moderate work activity, Sleeping trouble, Smoking, Drinking, Total energy intake, High blood pressure, High cholesterol level, Diabetes, Serum creatinine.
Dose-response relationship between uric acid and depression
Figure 2 shows the dose-response relationship between uric acid concentration and depression risk. It can be seen from the figure that the curve shows a downward trend. There is an approximately linear negative correlation between uric acid and depression (P for nonlinear=0.400), and the optimal cutoff value is 315.20 μ mol/L. It means that when the serum uric acid concentration is less than this value, the OR value is greater than 1, and the risk of depression is significantly increased. Similarly, after the uric acid concentration exceeds 315.20 μ mol/L, uric acid is a protective factor for the occurrence of depression, and on the whole, the uric acid concentration is statistically significant for the occurrence of depression (P for overall = 0.015). In addition, in order to avoid the interference caused by dietary intake and common drugs, we adjusted their effects in Supplementary Figure 1, and the restricted cubic spline (RCS) curve still showed a similar trend.
Figure 2
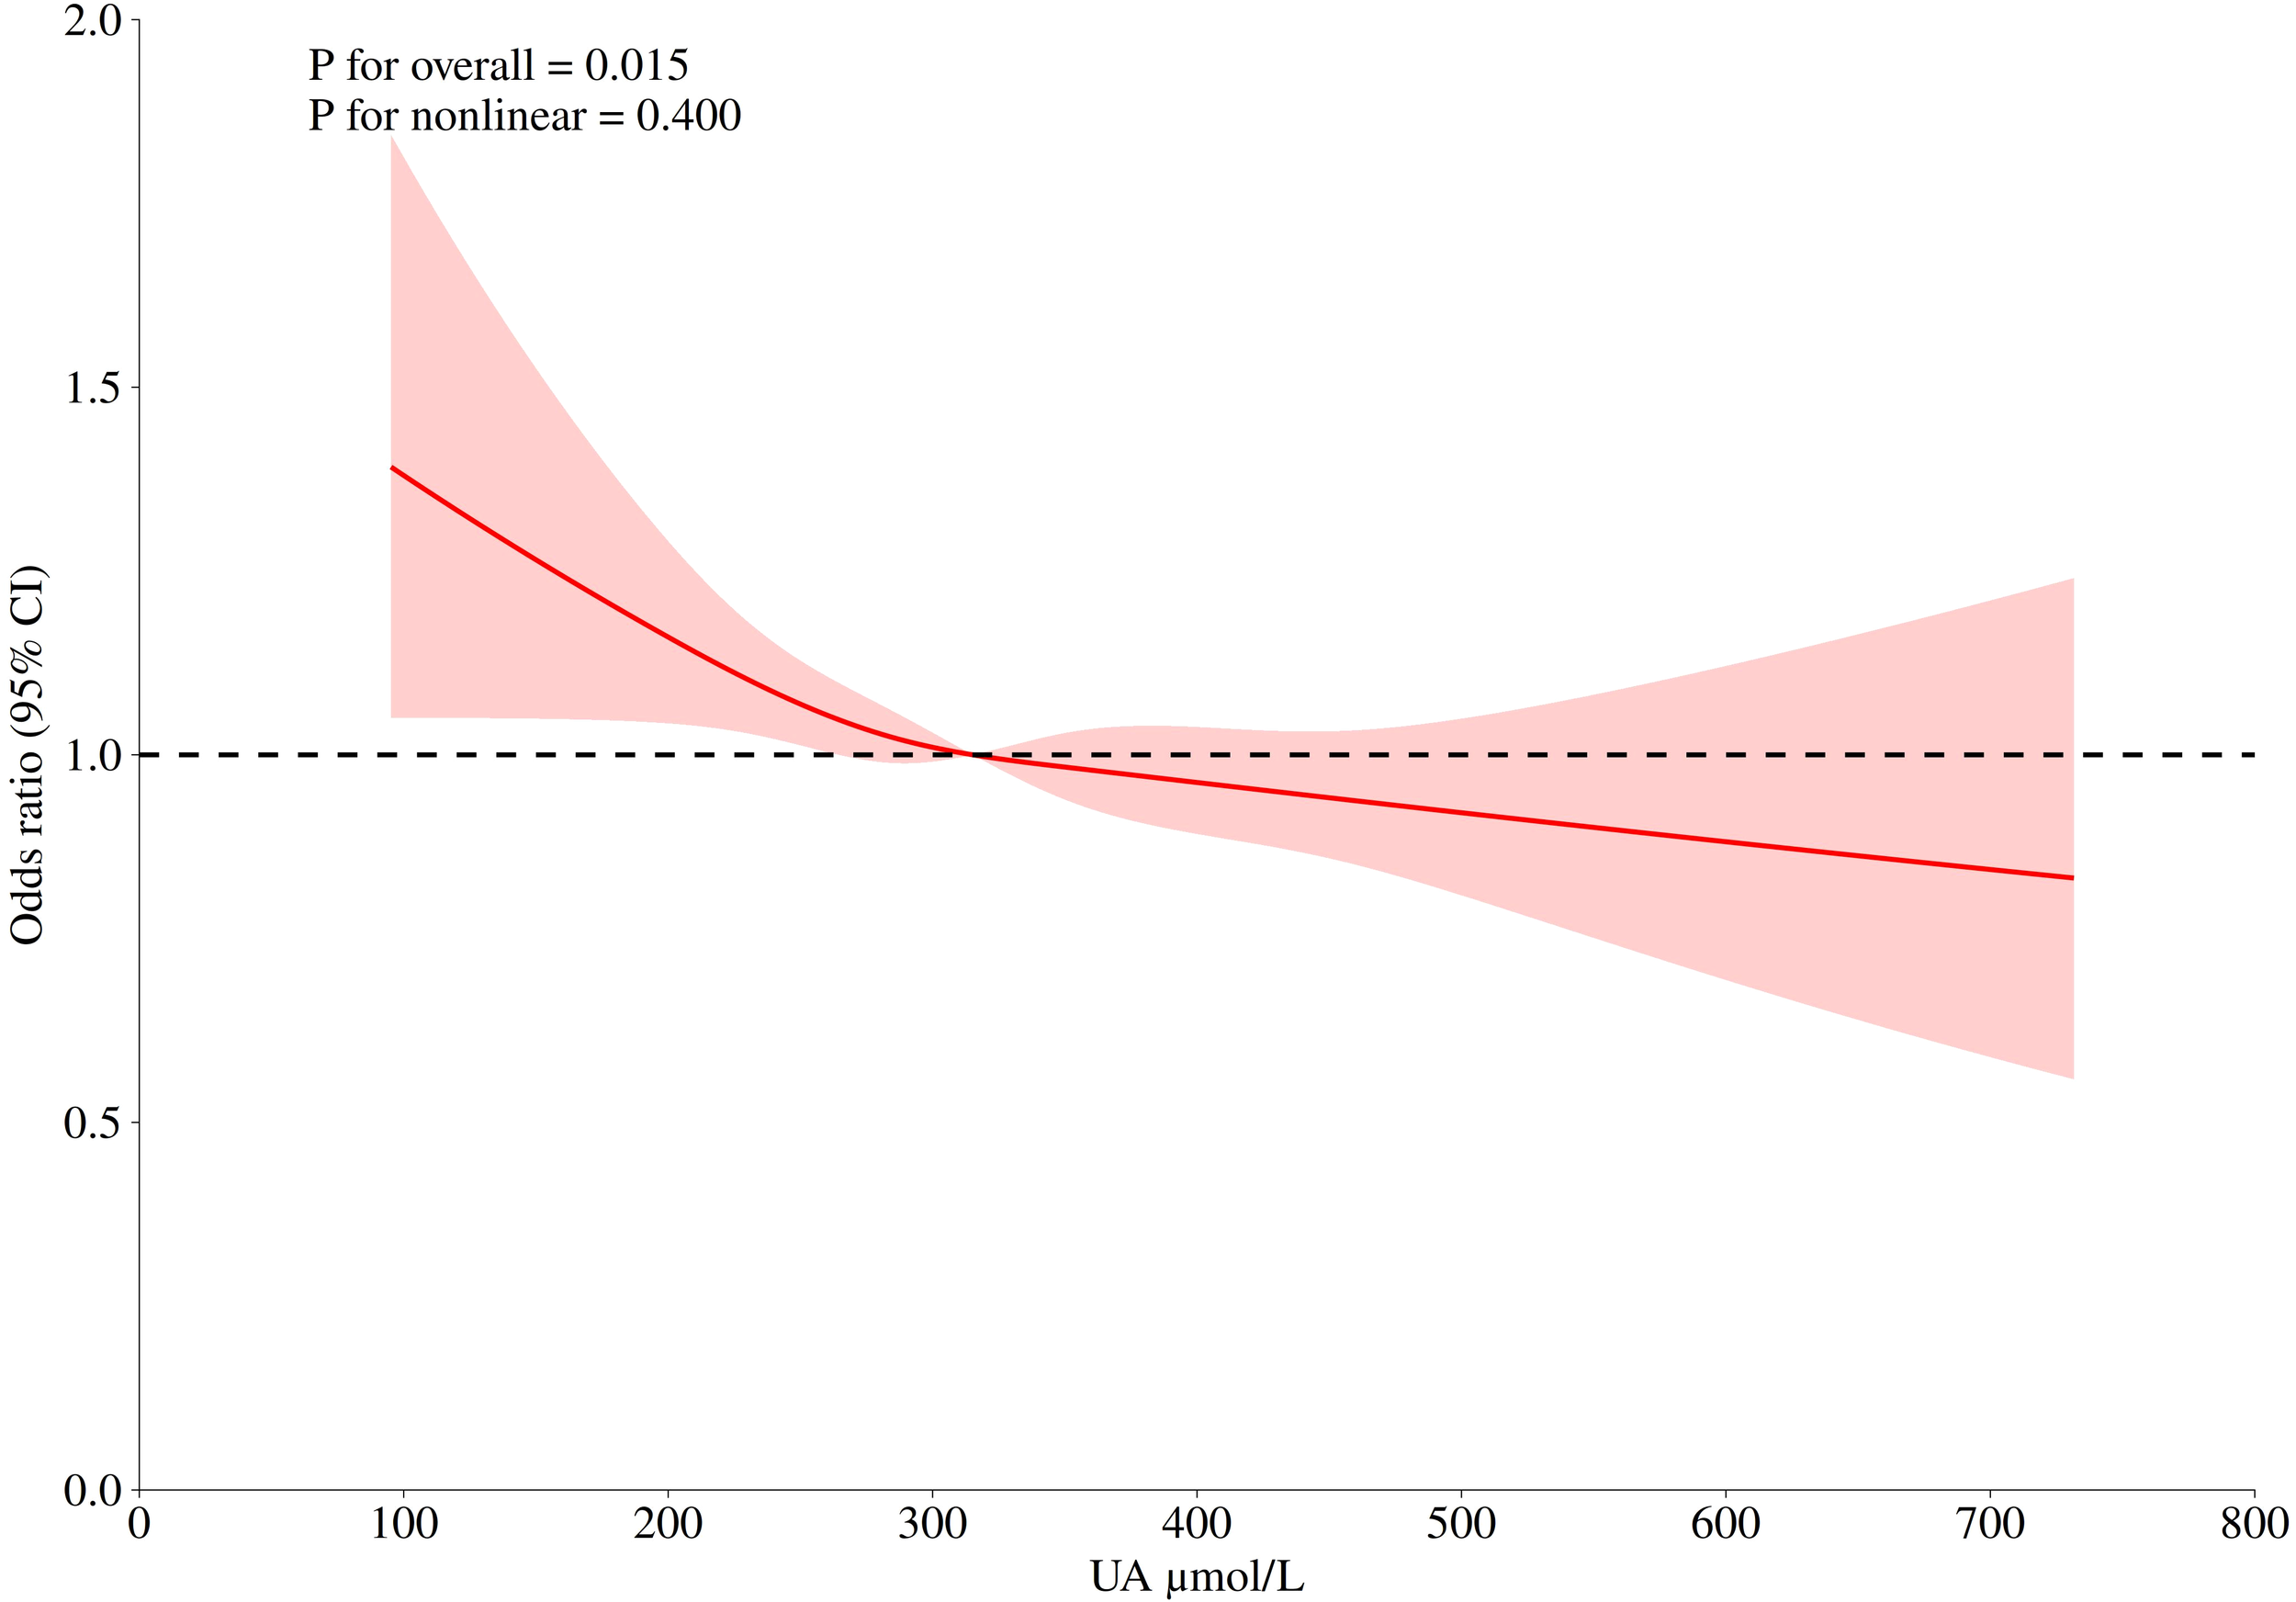
The logistic risk regression model of uric acid and depression, the adjusted hazard ratio (95% CI) of uric acid and depression is represented by a red curve. The cubic spline curve of the model has four nodes. Adjusted confounders included: Age, Gender, BMI, Race, Education level, Marital status, Family monthly poverty level category, Moderate work activity, Sleeping trouble, Smoking, Drinking, Total energy intake, High blood pressure, High cholesterol level, Diabetes, Serum creatinine.
Subgroup analysis and sensitivity analysis
In Figure 3, the subgroup analysis of serum uric acid concentration (T3 vs T1) and depression risk showed that in 25016 cases of the total population, high uric acid level (T3 group) was significantly associated with reduced depression risk (OR=0.84, 95%CI: 0.77 – 0.91). Subgroup analysis found that the association was affected by serum creatinine level and lifestyle factors: in the population with normal serum creatinine, the risk of depression in T3 group was lower (OR=0.90, 95%CI: 0.86 – 0.94), but there was a risk reversal in the group with creatinine ≤ 44 μ mol/L (OR=2.56, 95%CI: 1.63 – 4.62, P for interaction <0.001), and the risk relationship was consistent with the overall relationship when creatinine was greater than 133 μ mol/L; The protective effect of uric acid was stronger in smokers (OR=0.69, 95%CI: 0.61 – 0.78, P for interaction =0.003) and people with moderate physical activity (OR=0.70, 95%CI: 0.61 – 0.81, P for interaction =0.001). In addition, in the family monthly population level category, due to the small sample size of the subgroup who refused to answer and did not know the answer, this bias may lead to a slight interaction in the calculated results (P for interaction =0.049). Similarly, borderline in the diabetes subgroup a similar situation existed in the group.
Figure 3
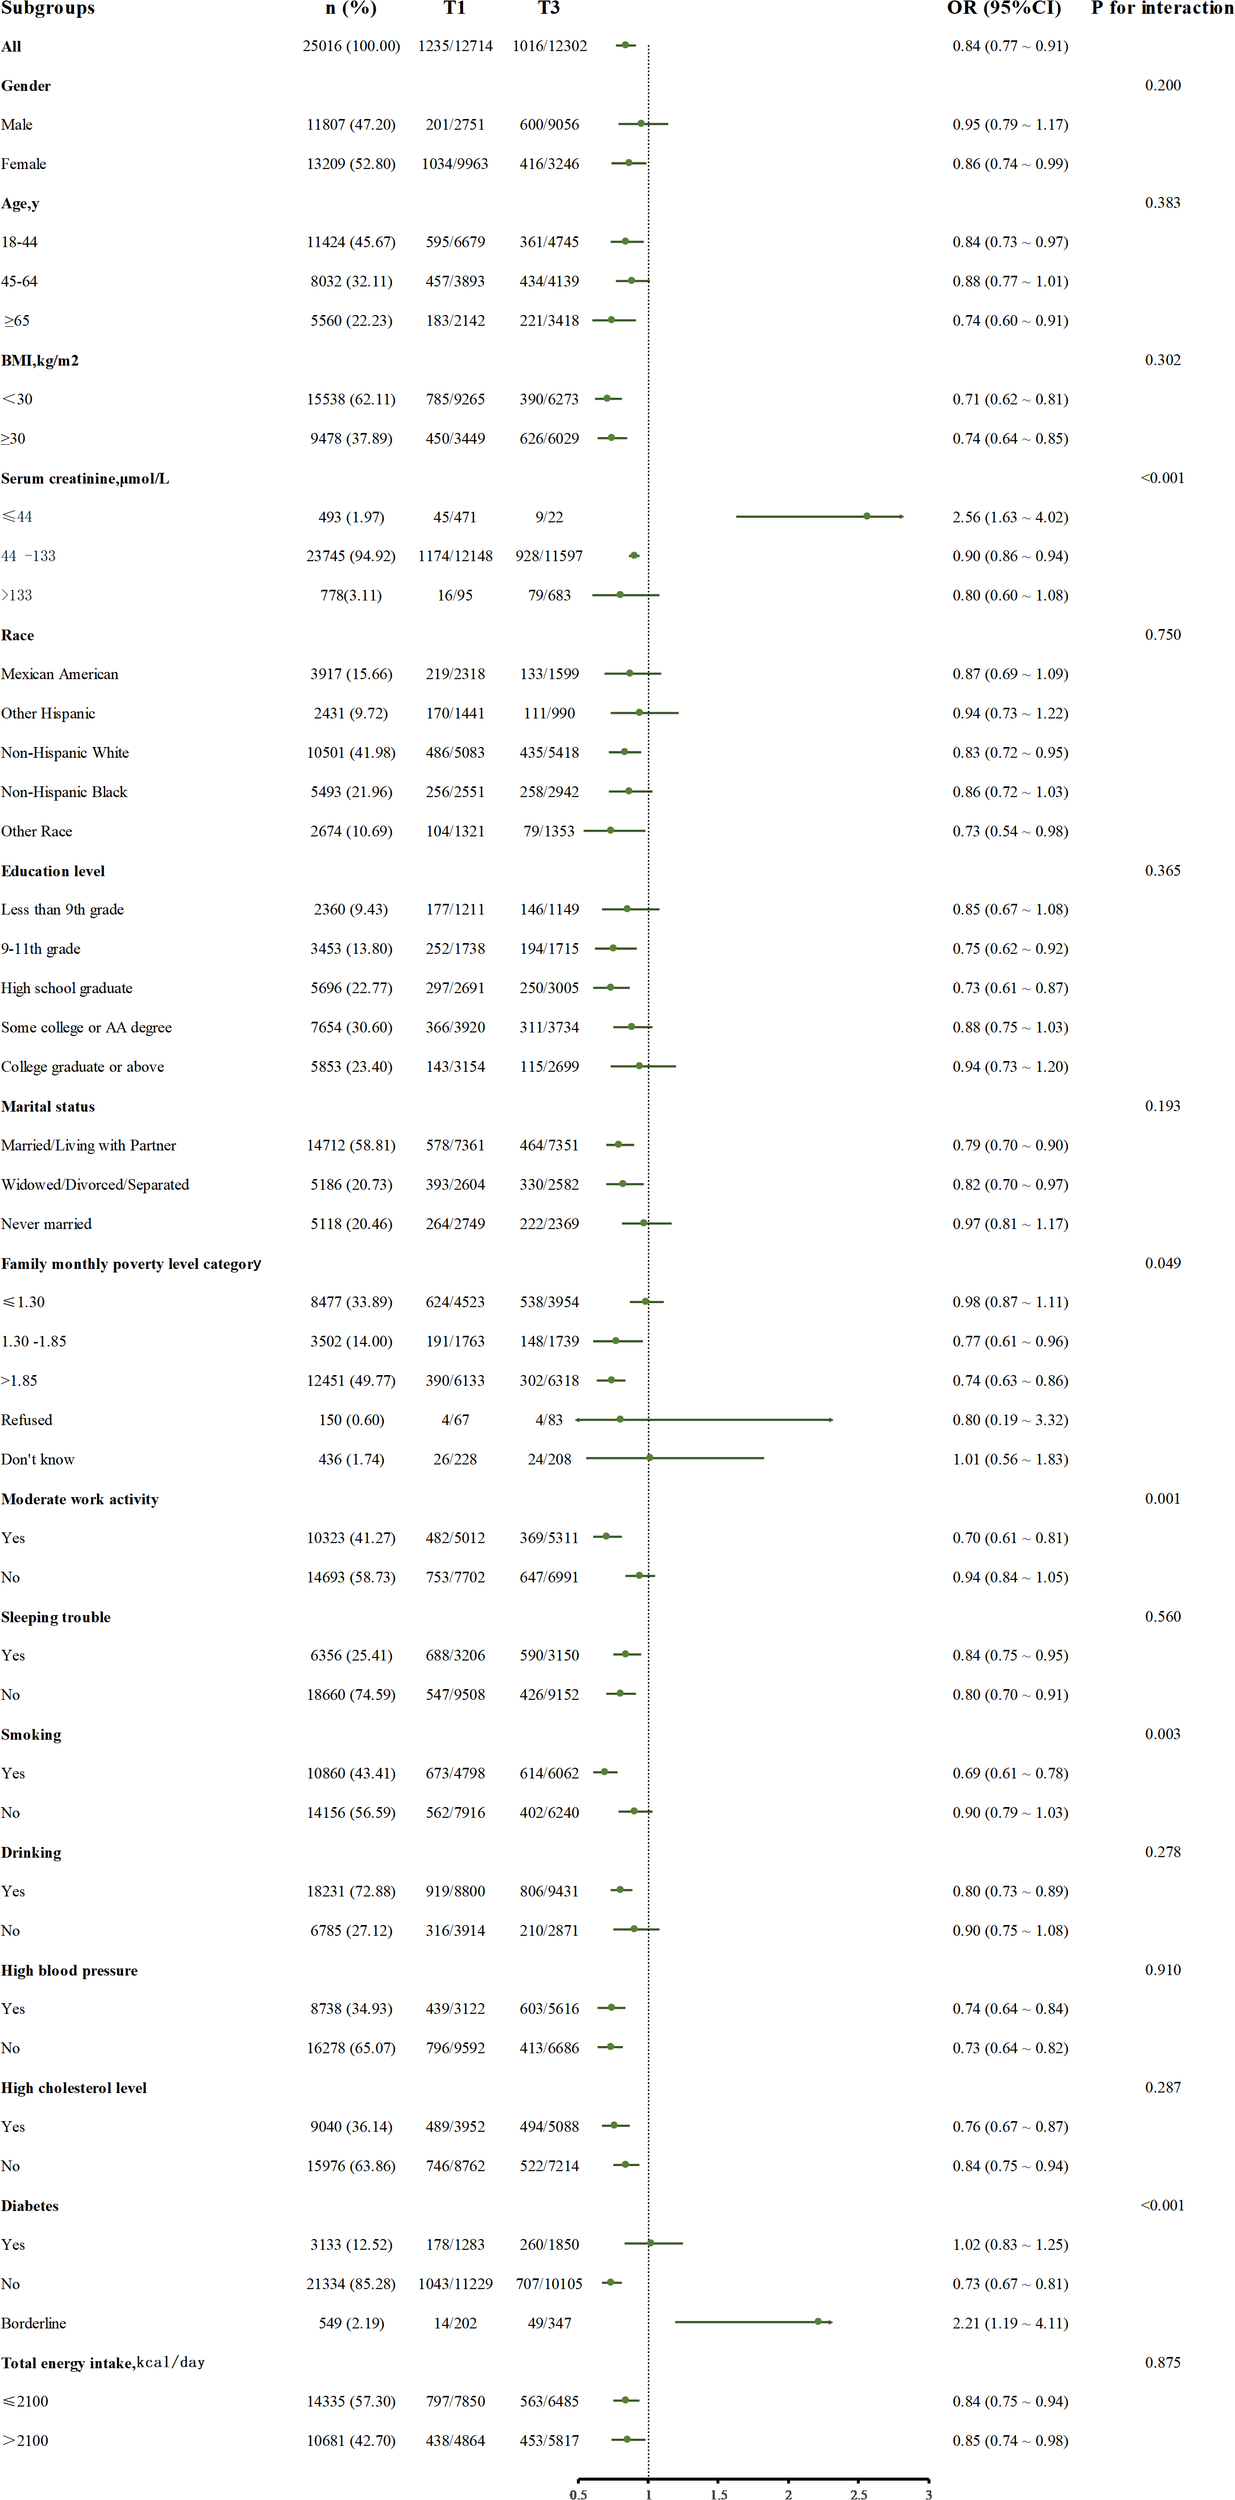
The relationship between serum uric acid (T3 and T1) and depression risk in different subgroups, adjusted for confounding factors included: Age, Gender, BMI, Race, Education level, Marital status, Family monthly poverty level category, Moderate work activity, Sleeping trouble, Smoking, Drinking, Total energy intake, High blood pressure, High cholesterol level, Diabetes, Serum creatinine.
Other subgroups showed a consistent protective trend. No significant interaction was found in general demographic characteristics such as age, sex, race, BMI subgroups, and common concomitant disease subgroups (P for interaction >0.05).
Discussion
This cross-sectional study, which collected a nationally representative sample from 2005 to 2020, showed that after adjusting for confounders, there was a significant relationship between serum uric acid level and depression, and individuals with lower serum uric acid had a higher prevalence of depression than individuals with higher uric acid levels. Stratified analysis showed that the results were robust in the vast majority of the population. The dose-response relationship showed that uric acid was a risk factor for depression when uric acid was lower than 315.20 μmol/L, which was statistically significant.
In previous studies, some researchers have conducted relevant discussions, such as a study of middle-aged and elderly people from China mentioned in the introduction (24), while the population of this study is representative of participants from the United States, and the age is not limited to the elderly but still obtained similar results, which also shows the robustness of the results in different populations (24). In addition, clinical studies have shown that the uric acid level of patients with depression is significantly lower than that of patients with other cognitive impairment, and when these patients received standard antidepressant treatment for 5 weeks, the uric acid level returned to normal (32), which reflects the significance of the relationship between uric acid and depression from another side. In addition, depression can be subdivided into unipolar depression and bipolar depression. Some studies have compared the clinical characteristics of the two. This study proved that compared with patients with unipolar depression, patients with bipolar depression have higher serum uric acid levels and lower triglyceride levels (33). This may become a key biomarker to distinguish unipolar depression from bipolar depression.
In this study, there are some interesting phenomena worthy of attention. The most noticeable one is the reversal phenomenon in the low creatinine subgroup in Figure 3. High uric acid plays a protective role in depression in other groups, but it is a risk factor in this group alone. We speculate that creatinine, as a non enzymatic product of muscle phosphocreatine, its blood concentration mainly depends on the total muscle volume and glomerular filtration capacity (34, 35). It is a dual biomarker of muscle metabolism and renal function. Muscle tissue is the main site of glutathione synthesis (36). When muscle mass is significantly reduced, the systemic antioxidant capacity decreases (36, 37). In addition, low creatinine is often accompanied by glomerular hyperfiltration, resulting in unstable blood uric acid levels. This fluctuation may activate the inflammasome (such as NLRP3) (14, 38), which may lead to the conversion of uric acid into a depression risk factor due to the collapse of the antioxidant system.
Another interesting point is that the effect of uric acid on depression is more significant in the subgroup with moderate work activity, probably because there is an association between exercise intensity and depression, and exercise intensity is a strong predictor of depression (39). In addition, according to the symptom perception hypothesis, depression will play different roles in concurrent and retrospective physical reports, which will exaggerate retrospective physical reports (40). From the perspective of demography, the people who have moderate exercise as a healthier population have fewer comorbidities with other basic diseases (41), and the influence of uric acid on depression is less interfered with by other factors, so the result is more significant.
Another phenomenon is that uric acid is more closely related to depression in smokers, which may be related to the impact of tobacco exposure on the dopamine system in the body (42). Nicotine and tobacco particulate matter will affect the long-term imbalance of dopamine transport (43), which will lead to the generation of negative emotions and the excessive activation of microglia (44–46). Moreover, smokers themselves are exposed to more stress, and there are more stress reactions (47), which synergize with the functions of uric acid to promote inflammation and oxidative response, which together lead to this result (10).
We found that in patients with impaired glucose tolerance, higher uric acid was a risk factor for depression, but the opposite was true in patients with diabetes and normoglycemia. Our analysis may be that these correlations stem from complex two-way interactions, which involve many factors, including disorders of the nervous system and neuroendocrine system, structural changes of the hippocampus, inflammation, oxidative stress, and obesity (48, 49). In this study, the number of people with abnormal glucose tolerance is relatively small, and there may also be related bias. In short, there is no satisfactory mechanism to explain this result, which still needs further systematic mining.
Finally, compared with other studies, this study retained the participants who answered rejected in the family monthly prevalence level category because the relationship between financial status and depression was gradually explored (50, 51). Previous studies often only studied the exact data and excluded participants who refused to answer for various reasons. However, the avoidant response indicated that participants themselves were more likely to have risk factors or diseases (52, 53), which were closely related to depression (54), and they might need more social attention. Therefore, this study retained and analyzed this part of the participants. Although the sample size was not large enough and the confidence interval was wider than other groups, similar conclusions could still be drawn, indicating that uric acid and the relationship between depression remained robust in this group.
The mechanisms that can explain our study are different, and the role of uric acid itself is also diverse. In this study, we found that serum uric acid has a protective effect on depression in the vast majority of people. Low serum uric acid can significantly increase the risk of depression, probably because of the antioxidant effect of uric acid. As a highly effective free radical scavenger, uric acid can remove o2- and block the formation of peroxynitrite (ONOO−), playing a neuroprotective role (16, 55), but also improving calcium homeostasis, protecting cell membranes from damage and protecting mitochondria (56). In addition, uric acid protects the integrity of the blood-brain barrier, reduces the permeability of inflammatory cells, and has anti-inflammatory effects (19). From another perspective, uric acid, as a product of purine metabolism, is largely produced by food (8). Too low uric acid may mean food shortage, which is a blow both physically and psychologically, leading to a higher risk of depression (50, 51). However, we should be vigilant that although uric acid plays a protective role in most people, it can still play other roles. For example, when the creatinine level is low, the systemic antioxidant capacity decreases, the inflammasome is activated, and uric acid changes from “antioxidant guard” to “inflammatory trigger” (14, 36–38).
Although some studies of the same type have appeared in recent years (24, 25, 57), this study still has its advantages. We integrated adult data from eight NHANES cycles from 2005 to 2020, covering different races, ages, and socio-economic groups in the United States, with a sample size larger than previous similar studies. In addition, the confounding factors we focus on are more comprehensive (including demography, lifestyle, comorbidities, drugs, dietary nutrients, etc.), which is better than the adjustment dimensions of other studies. We also paid special attention to the special Responder groups that may be excluded by other studies and showed more care for the vulnerable groups.
There are still some limitations in this study. First, our study is a retrospective cross-sectional study and cannot show that there is a causal relationship between uric acid and depression. In the future, if there is an opportunity, longitudinal studies can be designed to explore this relationship. Secondly, although we included all potential confounding factors we could collect (including demography, comorbidities, diet, and common drugs) in the study, there are still some omissions. For example, we did not consider the impact of antidepressant drugs on this study, which needs to be supplemented by subsequent studies. Although our results are applicable to the vast majority of the population, the reversal results of the low creatinine population still need more experimental verification, and the use of glomerular filtration rate for the evaluation of renal function may get more accurate results. In addition, the participants in this study are all adults. The relationship between uric acid and depression in children needs further exploration.
Conclusion
In the context of depression becoming a public health problem of great concern, this study used a nationally representative sample of American adults to explore the relationship between depression and uric acid. Our study showed that lower serum uric acid was associated with a higher prevalence of depression in American adults. For adults with low serum uric acid, attention should be paid to the prevention and treatment of depression. Further clinical and experimental studies are needed to verify their potential causality.
Statements
Data availability statement
Publicly available datasets were analyzed in this study. This data can be found here: https://www.cdc.gov/nchs/nhanes/index.htm.
Ethics statement
The studies involving humans were approved by National Health and Nutrition Examination Survey. The studies were conducted in accordance with the local legislation and institutional requirements. The participants provided their written informed consent to participate in this study.
Author contributions
PL: Data curation, Software, Visualization, Writing – original draft, Writing – review & editing. XX: Data curation, Formal Analysis, Visualization, Writing – original draft. WZ: Project administration, Resources, Validation, Writing – review & editing. WC: Conceptualization, Formal Analysis, Methodology, Writing – review & editing. XL: Project administration, Supervision, Writing – review & editing. HL: Project administration, Supervision, Writing – review & editing. TP: Methodology, Visualization, Writing – review & editing. AH: Methodology, Supervision, Writing – review & editing. XD: Conceptualization, Investigation, Project administration, Supervision, Writing – review & editing.
Funding
The author(s) declare that financial support was received for the research and/or publication of this article. This work was supported through Grants from the National Natural Science Foundation of China (82160364), the Project of the Jiangxi Provincial Department of Science and Technology (20232BCJ22016).
Conflict of interest
The authors declare that the research was conducted in the absence of any commercial or financial relationships that could be construed as a potential conflict of interest.
Generative AI statement
The author(s) declare that no Generative AI was used in the creation of this manuscript.
Publisher’s note
All claims expressed in this article are solely those of the authors and do not necessarily represent those of their affiliated organizations, or those of the publisher, the editors and the reviewers. Any product that may be evaluated in this article, or claim that may be made by its manufacturer, is not guaranteed or endorsed by the publisher.
Supplementary material
The Supplementary Material for this article can be found online at: https://www.frontiersin.org/articles/10.3389/fpsyt.2025.1544266/full#supplementary-material
Supplementary Figure 1The logistic risk regression model of uric acid and depression, the adjusted hazard ratio (95% CI) of uric acid and depression is represented by a red curve. The cubic spline curve of the model has four nodes. Adjusted confounders included: Age, Gender, BMI, Race, Education level, Marital status, Family monthly poverty level category, Moderate work activity, Sleeping trouble, Smoking, Drinking, Total energy intake, High blood pressure, High cholesterol level, Diabetes,Protein (gm), Carbohydrate (gm), Total sugars (gm), Dietary fiber (gm), Total fat (gm), Total saturated fatty acids (gm), Total monounsaturated fatty acids (gm), Total polyunsaturated fatty acids (gm), Cholesterol (mg), Vitamin E as alpha-tocopherol (mg), Added alpha-tocopherol (Vitamin E) (mg), Retinol (mcg), Vitamin A, RAE (mcg), Alpha-carotene (mcg), Beta-carotene (mcg), Beta-cryptoxanthin (mcg), Lycopene (mcg), Lutein + zeaxanthin (mcg), Thiamin (Vitamin B1) (mg), Riboflavin (Vitamin B2) (mg), Niacin (mg), Vitamin B6 (mg), Total folate (mcg), Folic acid (mcg), Food folate (mcg), Folate, DFE (mcg), Total choline (mg), Vitamin B12 (mcg), Added vitamin B12 (mcg), Vitamin C (mg), Vitamin K (mcg), Calcium (mg), Phosphorus (mg), Magnesium (mg), Iron (mg), Zinc (mg), Copper (mg), Sodium (mg), Potassium (mg), Selenium (mcg), Caffeine (mg), Theobromine (mg),Hypertensive drugs,Hyperlipidemic drugs,Antidiabetics.
Abbreviations
UA, Uric acid; NHANES, National Health and Nutrition Examination Survey; OR, Odds ratios; 95% CI:95% Confidence interval; SD, Standard Deviation; PHQ-9, Patient Health Questionnaire-9; AA degree, Associate of Arts degree; BMI, Body mass index; RCS, Restricted Cubic Spline; NO, Nitric Oxide; ONOO−, Peroxynitrite; NLRP3:NLR Family Pyrin Domain Containing 3; ROS, Reactive Oxygen Species; DFE, Dietary Folate Equivalents; RAE, Retinol Activity Equivalents.
References
1
Herrman H Patel V Kieling C Berk M Buchweitz C Cuijpers P et al . Time for united action on depression: a Lancet-World Psychiatric Association Commission. Lancet. (2022) 399:957–1022. doi: 10.1016/s0140-6736(21)02141-3
2
First MB . Diagnostic and statistical manual of mental disorders, 5th edition, and clinical utility. J Nerv Ment Dis. (2013) 201:727–9. doi: 10.1097/NMD.0b013e3182a2168a
3
World Health O . Depression and other common mental disorders: global health estimates (2017). Available online at: https://iris.who.int/handle/10665/254610. (Accessed June 26, 2024).
4
Evans-Lacko S Aguilar-Gaxiola S Al-Hamzawi A Alonso J Benjet C Bruffaerts R et al . Socio-economic variations in the mental health treatment gap for people with anxiety, mood, and substance use disorders: results from the WHO World Mental Health (WMH) surveys. Psychol Med. (2018) 48:1560–71. doi: 10.1017/s0033291717003336
5
Woody CA Ferrari AJ Siskind DJ Whiteford HA Harris MG . A systematic review and meta-regression of the prevalence and incidence of perinatal depression. J Affect Disord. (2017) 219:86–92. doi: 10.1016/j.jad.2017.05.003
6
Zhang Y Chen Y Ma L . Depression and cardiovascular disease in elderly: Current understanding. J Clin Neurosci. (2018) 47:1–5. doi: 10.1016/j.jocn.2017.09.022
7
Mathers CD Loncar D . Projections of global mortality and burden of disease from 2002 to 2030. PloS Med. (2006) 3:e442. doi: 10.1371/journal.pmed.0030442
8
Maiuolo J Oppedisano F Gratteri S Muscoli C Mollace V . Regulation of uric acid metabolism and excretion. Int J Cardiol. (2016) 213:8–14. doi: 10.1016/j.ijcard.2015.08.109
9
Kang DH Ha SK . Uric acid puzzle: dual role as anti-oxidantand pro-oxidant. Electrolyte Blood Press. (2014) 12:1–6. doi: 10.5049/ebp.2014.12.1.1
10
Glantzounis GK Tsimoyiannis EC Kappas AM Galaris DA . Uric acid and oxidative stress. Curr Pharm Des. (2005) 11:4145–51. doi: 10.2174/138161205774913255
11
Maples KR Mason RP . Free radical metabolite of uric acid. J Biol Chem. (1988) 263:1709–12. doi: 10.1016/S0021-9258(19)77933-2
12
Vásquez-Vivar J Santos AM Junqueira VB Augusto O . Peroxynitrite-mediated formation of free radicals in human plasma: EPR detection of ascorbyl, albumin-thiyl and uric acid-derived free radicals. Biochem J. (1996) 314:869–76. doi: 10.1042/bj3140869
13
Chen CJ Shi Y Hearn A Fitzgerald K Golenbock D Reed G et al . MyD88-dependent IL-1 receptor signaling is essential for gouty inflammation stimulated by monosodium urate crystals. J Clin Invest. (2006) 116:2262–71. doi: 10.1172/jci28075
14
Martinon F Pétrilli V Mayor A Tardivel A Tschopp J . Gout-associated uric acid crystals activate the NALP3 inflammasome. Nature. (2006) 440:237–41. doi: 10.1038/nature04516
15
Whiteman M Ketsawatsakul U Halliwell B . A reassessment of the peroxynitrite scavenging activity of uric acid. Ann N Y Acad Sci. (2002) 962:242–59. doi: 10.1111/j.1749-6632.2002.tb04072.x
16
Ames BN Cathcart R Schwiers E Hochstein P . Uric acid provides an antioxidant defense in humans against oxidant- and radical-caused aging and cancer: a hypothesis. Proc Natl Acad Sci U S A. (1981) 78:6858–62. doi: 10.1073/pnas.78.11.6858
17
Becker BF . Towards the physiological function of uric acid. Free Radic Biol Med. (1993) 14:615–31. doi: 10.1016/0891-5849(93)90143-i
18
Hooper DC Scott GS Zborek A Mikheeva T Kean RB Koprowski H et al . Uric acid, a peroxynitrite scavenger, inhibits CNS inflammation, blood-CNS barrier permeability changes, and tissue damage in a mouse model of multiple sclerosis. FASEB J. (2000) 14:691–8. doi: 10.1096/fasebj.14.5.691
19
Kastenbauer S Koedel U Becker BF Pfister HW . Experimental meningitis in the rat: protection by uric acid at human physiological blood concentrations. Eur J Pharmacol. (2001) 425:149–52. doi: 10.1016/s0014-2999(01)01137-2
20
Aliena-Valero A Rius-Pérez S Baixauli-Martín J Torregrosa G Chamorro Á Pérez S et al . Uric acid neuroprotection associated to IL-6/STAT3 signaling pathway activation in rat ischemic stroke. Mol Neurobiol. (2021) 58:408–23. doi: 10.1007/s12035-020-02115-w
21
Sohn H Kwon MS Lee SW Oh J Kim MK Lee SK et al . Effects of uric acid on the alterations of white matter connectivity in patients with major depression. Psychiatry Investig. (2018) 15:593–601. doi: 10.30773/pi.2017.12.17
22
Keizman D Ish-Shalom M Berliner S Maimon N Vered Y Artamonov I et al . Low uric acid levels in serum of patients with ALS: further evidence for oxidative stress? J Neurol Sci. (2009) 285:95–9. doi: 10.1016/j.jns.2009.06.002
23
Mijailovic NR Vesic K Borovcanin MM . The influence of serum uric acid on the brain and cognitive dysfunction. Front Psychiatry. (2022) 13:828476. doi: 10.3389/fpsyt.2022.828476
24
Li Y Zhao L Yu D Ding G . Associations between serum uric acid and depression among middle-aged and elderly participants in China. Psychol Health Med. (2019) 24:1277–86. doi: 10.1080/13548506.2019.1622748
25
Chen J Zhou W Huang Y . Association between serum uric acid levels and depressive symptoms according to menopausal status. J Affect Disord. (2024) 350:240–6. doi: 10.1016/j.jad.2024.01.108
26
Kim JO Park GN Oh JW Lee S . Association between uric acid and depressive symptoms in older adults: The Korea National Health and Nutrition Examination Survey. Int J Geriatr Psychiatry. (2023) 38:e5963. doi: 10.1002/gps.5963
27
Black CN Bot M Scheffer PG Snieder H Penninx B . Uric acid in major depressive and anxiety disorders. J Affect Disord. (2018) 225:684–90. doi: 10.1016/j.jad.2017.09.003
28
Chen Z Liang S Bai Y Lin J Li M Mo Z et al . Serum uric acid is not associated with major depressive disorder in European and South American populations: a meta-analysis and two-sample bidirectional Mendelian Randomization study. Eur J Clin Nutr. (2022) 76:1665–74. doi: 10.1038/s41430-022-01165-8
29
Khrisanopulo MP . Origin, program, and operation of the U.S. national health survey. Vital Health Stat 1. (1963) 1):1–41.
30
Kroenke K . PHQ-9: global uptake of a depression scale. World Psychiatry. (2021) 20:135–6. doi: 10.1002/wps.20821
31
Zhang Z Jackson SL Gillespie C Merritt R Yang Q . Depressive symptoms and mortality among US adults. JAMA Netw Open. (2023) 6:e2337011. doi: 10.1001/jamanetworkopen.2023.37011
32
Wen S Cheng M Wang H Yue J Wang H Li G et al . Serum uric acid levels and the clinical characteristics of depression. Clin Biochem. (2012) 45:49–53. doi: 10.1016/j.clinbiochem.2011.10.010
33
Liu Y Zhang X Wang P Yang M Li N . Comparison of clinical features, serum lipid, and uric acid levels in patients with unipolar depression and bipolar depression. Psychiatry Clin Psychopharmacol. (2022) 32:313–9. doi: 10.5152/pcp.2022.22473
34
Iyengar MR Coleman DW Butler TM . Phosphocreatinine, a high-energy phosphate in muscle, spontaneously forms phosphocreatine and creatinine under physiological conditions. J Biol Chem. (1985) 260:7562–7. doi: 10.1016/S0021-9258(17)39644-8
35
Levey AS Perrone RD Madias NE . Serum creatinine and renal function. Annu Rev Med. (1988) 39:465–90. doi: 10.1146/annurev.me.39.020188.002341
36
Ferreira LF Reid MB . Muscle-derived ROS and thiol regulation in muscle fatigue. J Appl Physiol (1985). (2008) 104:853–60. doi: 10.1152/japplphysiol.00953.2007
37
Wilson VD Bommart S Passerieux E Thomas C Pincemail J Picot MC et al . Muscle strength, quantity and quality and muscle fat quantity and their association with oxidative stress in patients with facioscapulohumeral muscular dystrophy: Effect of antioxidant supplementation. Free Radic Biol Med. (2024) 219:112–26. doi: 10.1016/j.freeradbiomed.2024.04.001
38
Wan X Xu C Lin Y Lu C Li D Sang J et al . Uric acid regulates hepatic steatosis and insulin resistance through the NLRP3 inflammasome-dependent mechanism. J Hepatol. (2016) 64:925–32. doi: 10.1016/j.jhep.2015.11.022
39
Kapitány-Fövény M Bokk O Kiss A Sulyok M . Time perception at resting state and during active motion: The role of anxiety and depression. J Psychiatr Res. (2022) 155:186–93. doi: 10.1016/j.jpsychires.2022.08.023
40
Howren MB Suls J . The symptom perception hypothesis revised: depression and anxiety play different roles in concurrent and retrospective physical symptom reporting. J Pers Soc Psychol. (2011) 100:182–95. doi: 10.1037/a0021715
41
Garber CE Blissmer B Deschenes MR Franklin BA Lamonte MJ Lee IM et al . American College of Sports Medicine position stand. Quantity and quality of exercise for developing and maintaining cardiorespiratory, musculoskeletal, and neuromotor fitness in apparently healthy adults: guidance for prescribing exercise. Med Sci Sports Exerc. (2011) 43:1334–59. doi: 10.1249/MSS.0b013e318213fefb
42
Bahk JY Li S Park MS Kim MO . Dopamine D1 and D2 receptor mRNA up-regulation in the caudate-putamen and nucleus accumbens of rat brains by smoking. Prog Neuropsychopharmacol Biol Psychiatry. (2002) 26:1095–104. doi: 10.1016/s0278-5846(02)00243-9
43
Danielson K Putt F Truman P Kivell BM . The effects of nicotine and tobacco particulate matter on dopamine uptake in the rat brain. Synapse. (2014) 68:45–60. doi: 10.1002/syn.21715
44
Dowlati Y Herrmann N Swardfager W Liu H Sham L Reim EK et al . A meta-analysis of cytokines in major depression. Biol Psychiatry. (2010) 67:446–57. doi: 10.1016/j.biopsych.2009.09.033
45
Dantzer R O’Connor JC Lawson MA Kelley KW . Inflammation-associated depression: from serotonin to kynurenine. Psychoneuroendocrinology. (2011) 36:426–36. doi: 10.1016/j.psyneuen.2010.09.012
46
Schroeter ML Abdul-Khaliq H Krebs M Diefenbacher A Blasig IE . Serum markers support disease-specific glial pathology in major depression. J Affect Disord. (2008) 111:271–80. doi: 10.1016/j.jad.2008.03.005
47
Hammen C . Stress and depression. Annu Rev Clin Psychol. (2005) 1:293–319. doi: 10.1146/annurev.clinpsy.1.102803.143938
48
Patel SS Mehta V Changotra H Udayabanu M . Depression mediates impaired glucose tolerance and cognitive dysfunction: A neuromodulatory role of rosiglitazone. Horm Behav. (2016) 78:200–10. doi: 10.1016/j.yhbeh.2015.11.010
49
Joseph JJ Golden SH . Cortisol dysregulation: the bidirectional link between stress, depression, and type 2 diabetes mellitus. Ann N Y Acad Sci. (2017) 1391:20–34. doi: 10.1111/nyas.13217
50
Ettman CK Fan AY Philips AP Adam GP Ringlein G Clark MA et al . Financial strain and depression in the U.S.: a scoping review. Transl Psychiatry. (2023) 13:168. doi: 10.1038/s41398-023-02460-z
51
Uutela A . Economic crisis and mental health. Curr Opin Psychiatry Mar. (2010) 23:127–30. doi: 10.1097/YCO.0b013e328336657d
52
Weinbrecht A Schulze L Boettcher J Renneberg B . Avoidant personality disorder: a current review. Curr Psychiatry Rep. (2016) 18:29. doi: 10.1007/s11920-016-0665-6
53
Kvarstein EH Antonsen BT Klungsøyr O Pedersen G Wilberg T . Avoidant personality disorder and social functioning: A longitudinal, observational study investigating predictors of change in a clinical sample. Pers Disord. (2021) 12:594–605. doi: 10.1037/per0000471
54
Lampe L . Avoidant personality disorder as a social anxiety phenotype: risk factors, associations and treatment. Curr Opin Psychiatry. (2016) 29:64–9. doi: 10.1097/yco.0000000000000211
55
Squadrito GL Cueto R Splenser AE Valavanidis A Zhang H Uppu RM et al . Reaction of uric acid with peroxynitrite and implications for the mechanism of neuroprotection by uric acid. Arch Biochem Biophys. (2000) 376:333–7. doi: 10.1006/abbi.2000.1721
56
Yu ZF Bruce-Keller AJ Goodman Y Mattson MP . Uric acid protects neurons against excitotoxic and metabolic insults in cell culture, and against focal ischemic brain injury in vivo. J Neurosci Res. (1998) 53:613–25. doi: 10.1002/(sici)1097-4547(19980901)53:5<613::Aid-jnr11>3.0.Co;2-1
57
Wang J Yang M Lin H Wang J . Association between uric acid and the risk of depressive symptoms in US adults: results from NHANES 2005-2018. Sci Rep. (2024) 14:24097. doi: 10.1038/s41598-024-74869-5
Summary
Keywords
uric acid, depression, NHANES, disease marker, public health
Citation
Lai P, Xie X, Zeng W, Cheng W, Liu X, Long H, Peng T, Hu A and Du X (2025) Relationship between uric acid and depression in American adults: findings from NHANES, 2005-2020. Front. Psychiatry 16:1544266. doi: 10.3389/fpsyt.2025.1544266
Received
12 December 2024
Accepted
03 June 2025
Published
20 June 2025
Volume
16 - 2025
Edited by
Luca Steardo Jr, University Magna Graecia of Catanzaro, Italy
Reviewed by
Stefania Landi, ASL Salerno, Italy
Lulu Yan, Yangtze University, China
Updates
Copyright
© 2025 Lai, Xie, Zeng, Cheng, Liu, Long, Peng, Hu and Du.
This is an open-access article distributed under the terms of the Creative Commons Attribution License (CC BY). The use, distribution or reproduction in other forums is permitted, provided the original author(s) and the copyright owner(s) are credited and that the original publication in this journal is cited, in accordance with accepted academic practice. No use, distribution or reproduction is permitted which does not comply with these terms.
*Correspondence: Xiaohong Du, ndefy02032@ncu.edu.cn
†These authors have contributed equally to this work
Disclaimer
All claims expressed in this article are solely those of the authors and do not necessarily represent those of their affiliated organizations, or those of the publisher, the editors and the reviewers. Any product that may be evaluated in this article or claim that may be made by its manufacturer is not guaranteed or endorsed by the publisher.