 Xia Ruan
 Tingting Yu2
 Jun Chen
- 1Department of Radiology, Qianjiang Central Hospital of Hubei Province, Qianjiang, Hubei, China
- 2Department of Radiology, Renmin Hospital of Wuhan University, Wuhan, Hubei, China
Background: It is unclear whether the alterations in neural oscillations in patients with alcohol use disorder (AUD) are specific to different frequency bands. We applied the regional homogeneity (ReHo) approach to examine intrinsic functional connectivity variations in various frequency bands in AUD patients.
Methods: Thirty-three AUD patients and 29 healthy controls (HCs) were enrolled in this study. The ReHo values in six frequency bands (conventional frequency band, 0.01–0.08 Hz; slow-2, 0.198–0.25 Hz; slow-3, 0.073–0.198 Hz; slow-4, 0.027–0.073 Hz; slow-5, 0.01–0.027 Hz; and slow-6, 0–0.01 Hz) were calculated and compared between the two groups. The performance of the ReHo on distinguishing AUD patients from HCs was examined using a receiver operating characteristic (ROC) curve. The correlation of functional changes in the network and alcohol dependence was evaluated.
Results: Decreased ReHo values were detected in two frequency bands, and the areas of decreased ReHo values were mainly located in the left inferior parietal lobule (IPL) and right middle frontal gyrus (MFG); the diagnostic efficiency of the ReHo differences in brain areas was respectively 0.876 and 0.868, with sensitivities of 90.0% and 76.7% and specificities of 70.0% and 86.7%. The clinical scale scores were not significantly correlated with the ReHo values in specific brain areas.
Conclusions: Our findings demonstrate that the widespread abnormal brain activity in AUD patients is characterized by distinct patterns of neural oscillatory power across multiple frequency bands. This exploration may provide an objective imaging basis for understanding the pathophysiological mechanisms of AUD.
1 Introduction
Alcohol is one of the most widely used addictive substances in the world, and drinking is closely related to a wide range of mental health issues, social problems, crime issues, and public health problems. There is no safe dose of alcohol, and long-term heavy drinking can lead to mild to moderate cognitive impairments, particularly in attention, executive functions, memory, visuospatial skills, motor abilities, and cognitive performance. It can also severely harm multiple organs in the human body and lead to increased cancer rates and mortality (1, 2). Therefore, using neuroimaging to understand the neurobiology of alcohol use disorder (AUD) and identifying appropriate therapeutic targets are becoming increasingly important. However, the exact mechanisms of AUD are not yet fully understood.
In recent years, a number of novel biomarkers for the diagnosis of AUD have been identified through brain imaging techniques. Resting-state functional magnetic resonance imaging (rs-fMRI) is a non-invasive method for quantifying the neural network structure and functional brain properties (3). The regional homogeneity (ReHo) method can be applied to analyze local signals in rs-fMRI, which is a highly reliable feature of the connectome of the human brain (4). Currently, ReHo analysis is widely used to assess physiological or pathological conditions to detect abnormalities in regional functional synchronization and to reveal the neural mechanisms of neurological and psychiatric disorders, such as headache disorders (5), schizophrenia (6), depression (7), and Alzheimer’s disease (8).
A majority of ReHo studies have examined conventional frequency bands (9, 10), but results from one frequency band lack frequency specificity. Conversely, rare studies have explored the local characteristics of the blood oxygen level dependent (BOLD) signal in different frequency bands, even though they may offer useful information. Different oscillation frequencies could be used to reflect various aspects of brain function (11, 12). The study of Baria et al. (13) concluded that resting-state BOLD oscillations exhibit frequency-dependent anatomically constrained spatial structure in the human brain throughout the full BOLD bandwidth. Liu et al. (14) found that a frequency-dependent genetic modulation of spontaneous neuronal activity, which may support spontaneous neural activity across different frequency bands, may be driven by different genetic underpinnings. A previous study by Song et al. (15) has shown that the frequency-specific ReHo variations across brain regions may originate from their distinct cytoarchitectonic organization or synaptic diversity. Therefore, distinct frequency-specific ReHo characteristics could be more sensitive markers for different tasks or pathophysiological states, advancing the understanding of the neural–physiological basis of regional structural–functional specificity and its link to regional homogeneity. Typically, the power spectrum has five different frequency bands (16): slow-2, slow-3, slow-4, slow-5, and slow-6. Most studies have ignored the very low-frequency band (slow-6, <0.01 Hz), but slow-6 has been shown to be significant in physiological and pathological investigations (17–19). Many studies have investigated the effects of frequency band differences on functional brain connectivity, such as obsessive compulsive disorder (20), schizophrenia (21), acute pericoronitis (22), and tension-type headache (23). However, it is unclear how ReHo changes with frequency in patients with AUD.
Therefore, we performed rs-fMRI to detect the frequency-dependent effects of ReHo in patients with AUD and then correlated these changes with clinical and neuropsychological data. We tested the ability of ReHo analysis to distinguish between AUD and healthy controls (HCs) using a receiver operating characteristic (ROC) curve.
2 Materials and methods
2.1 Subjects
The study was approved by the Medical Ethics Committee at Renmin Hospital of Wuhan University and followed the principles of the Declaration of Helsinki. Written informed consent was obtained from all subjects.
Thirty right-handed male AUD patients and 30 HCs were recruited from the primary care outpatient department of Renmin Hospital of Wuhan University, and they were matched on age, sex, education, and handedness.
AUD patients must match the diagnostic criteria for AUD in the American Psychiatric Association’s Diagnostic and Statistical Manual of Mental Disorders, Fifth Edition (DSM-5). The inclusion criteria of AUD patients were as follows: a history of alcohol dependence for no less than 10 years, Alcohol Dependence Scale (ADS) score ≥14 and Michigan Alcohol Screening Test (MAST) score ≥ 6 (24), and no prior treatment history for AUD. HCs were those who had never or very seldom consumed alcohol (<1 standard unit per time) (25).
Subjects were excluded due to any of the following: 1) an individual who exhibits psychotic symptoms or whose first-degree relative has been diagnosed with psychosis; 2) history of addiction to substances other than alcohol; 3) with organic brain disease or severe physical disease; 4) a history of cranial trauma, cranial surgery, brain tumor, and coma; 5) people with previous seizures or a family history of epilepsy; 6) patients who have been treated with antipsychotic medication or who are receiving medication; and 7) claustrophobia or any MRI contraindications.
The time interval between the last alcohol consumption and MR examination was 3 weeks for all subjects in this study to exclude the effects of acute alcohol intake.
2.2 Cognitive and alcohol level evaluation
Before undergoing MRI scans, all subjects were administered the Mini-Mental State Examination (MMSE) and Montreal Cognitive Assessment (MoCA); to evaluate the level of alcohol dependence, only ADS and MAST scores from the AUD group were collected.
2.3 MRI acquisition
MRI scans were acquired using a 3.0-T MRI scanner (Discovery 750W Silent MR, GE Healthcare, Milwaukee, WI, USA). To avoid subject head movement artifacts during the experiment, the matching rubber soft plugs were used to fix the head. To reduce equipment noise, soft foam earplugs were also used. All subjects were asked to be quiet and relaxed, remain awake, keep their eyes closed, and think of nothing in particular. Participants with lesions of the brain were excluded from T2-weighted imaging (T2WI) and T2-Fluid Attenuated Inversion Recovery (T2-FLAIR) images. High‐resolution structural data were obtained in sagittal position: repetition time (TR) = 8.5 ms, echo time (TE) = 3.3 ms, field of view (FOV) = 240 mm × 240 mm, flip angle (FA) = 12°, matrix size = 256 × 256, slice thickness = 1.0 mm, no slice gap, and voxel size = 1 mm × 1 mm × 1 mm. The scanning parameters of fMRI data were as follows: TR = 2,000 ms, TE = 25 ms, FOV = 240 mm × 240 mm, FA = 90°, slice thickness = 3.5 mm, no slice gap, matrix size = 64 × 64, interleaved axial slices = 40, and volumes = 240. The visual inspection of all MR images was carried out to make sure that none of the images included in the study had visible artifacts.
2.4 MRI data preprocessing and analysis
2.4.1 Data preprocessing
MRI data were preprocessed using the Statistical Parametric Mapping software (SPM12) (http://www.fil.ion.ucl.ac.uk/spm) and Resting-State fMRI Data Analysis Toolkit plus (RESTplus) (http://restfmri.net/forum/RESTplus). The main preprocessing steps were as follows: 1) remove the first 10 time points because of inhomogeneities in the magnetic field and subjects’ maladaptive interferences with the environment; 2) slice timing; 3) realign, subjects with head movement >2.0 mm or 2.0° were excluded; 4) normalizing the data to the Montreal Neurological Institute (MNI) space via the DARTEL technique (26); 5) detrend; 6) nuisance covariate regression, including the Friston 24-parameter model, white matter, and cerebrospinal fluid signals; and 7) filter (conventional frequency band, slow-2 band, slow-3 band, slow-4 band, slow-5 band, and slow-6 band).
2.4.2 ReHo calculation
For filtered data in each band, the ReHo value was calculated using Kendall’s coefficient of concordance of the time series of every 27 nearest neighboring voxels. For standardization, the ReHo z-score map for each subject was obtained using Fisher’s r-to-z transformation. Spatial smoothing was performed using a 6 mm × 6 mm × 6 mm Gaussian kernel after ReHo calculation.
2.5 Statistical analysis
2.5.1 Clinical information
Baseline clinical information was compared between the two groups using the Statistical Package for the Social Sciences (SPSS) version 26.0 software (IBM, Armonk, NY, USA). Demographic and clinical data for both groups were tested using the Shapiro–Wilk test and independent samples t-tests. The threshold was set at a significant level of p < 0.05.
2.5.2 ReHo analysis
Group comparisons in ReHo were conducted using two-sample t-tests in the SPM12 software. Age, education level, and mean framewise displacement were used as covariates in two-sample t-tests. ReHo differences in six different frequency bands were analyzed, and regions where the differences were significant were pinpointed. Multiple comparisons were corrected using a cluster-level family-wise error (FWE) method, resulting in a cluster-defining threshold of p < 0.001 and a corrected cluster significance of p < 0.05. Crucially, the minimum cluster size was independently determined for each frequency band (conventional frequency band: cluster size = 85, slow-3 band: cluster size = 126) through separate Monte Carlo simulations. This approach accounts for intrinsic differences in spatial smoothness and data structure between bands, ensuring valid inference specific to each band’s characteristics.
2.5.3 ROC curve and correlation analysis
To determine if the ReHo values may be used as a biological marker for differentiating AUD from HCs, the ReHo values from regions with significant differences between groups were extracted for the ROC curve.
To investigate the specific relationships between ReHo values in different frequency bands and MAST/ADS scores, we performed a correlation study using the SPSS version 26.0 software. We extracted ReHo values from regions with significant differences between groups and analyzed the relationships between ReHo values and the patients’ MAST/ADS scores. We calculated Spearman’s correlation coefficient.
3 Results
3.1 Clinical information
No participants were excluded following correction for head motion. Finally, 30 AUD patients and 30 HCs were included in this research. The clinical information of the two groups is shown in Table 1. In terms of gender, age, education, handedness, and mean Framewise Displacement (FD) , no statistically significant difference was found. Nonetheless, the MMSE and MoCA scores of the AUD group were considerably lower (p < 0.05) than those of the HC group.
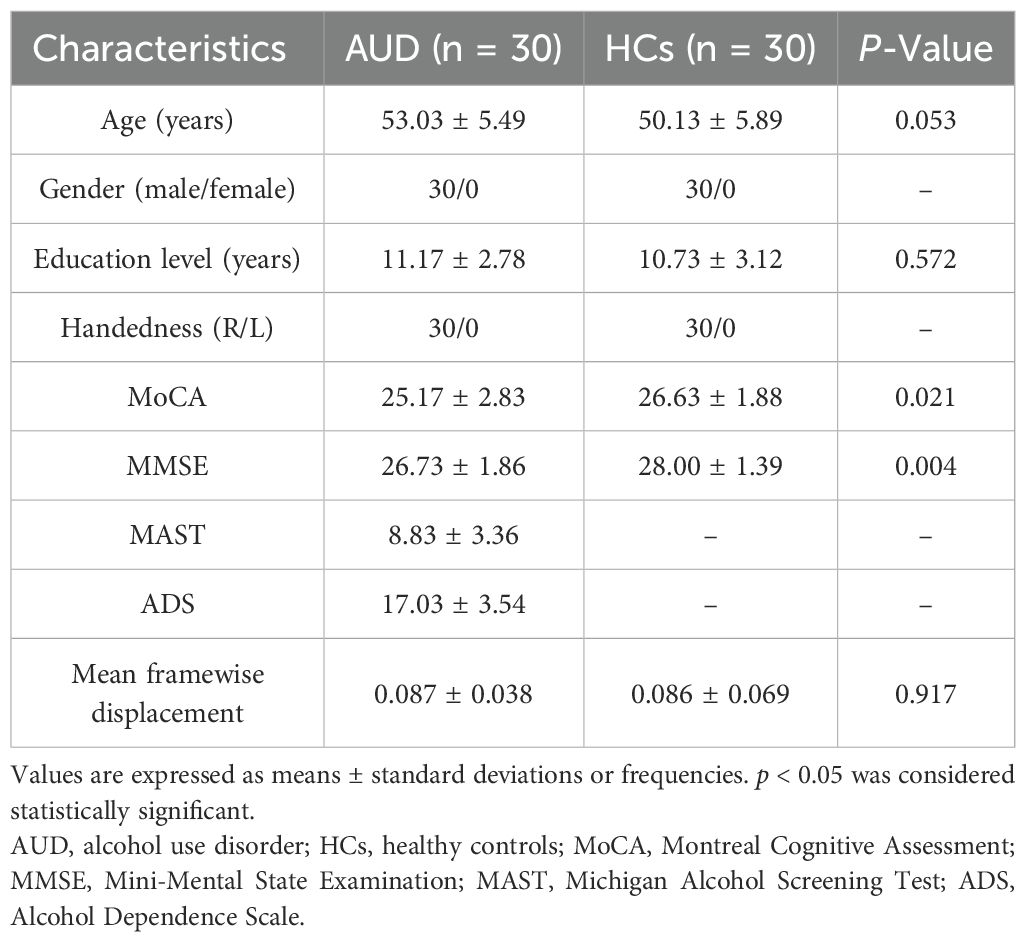
Table 1. Demographic and clinical characteristics.
3.2 ReHo analysis
In the conventional frequency band, the ReHo values decreased in the left inferior parietal lobule (IPL). The ReHo values in the right middle frontal gyrus (MFG) were decreased in the AUD group in the slow-3 band (Table 2; Figures 1, 2). The ReHo values were not significantly different in slow-2, slow-4, slow-5, and slow-6 bands.
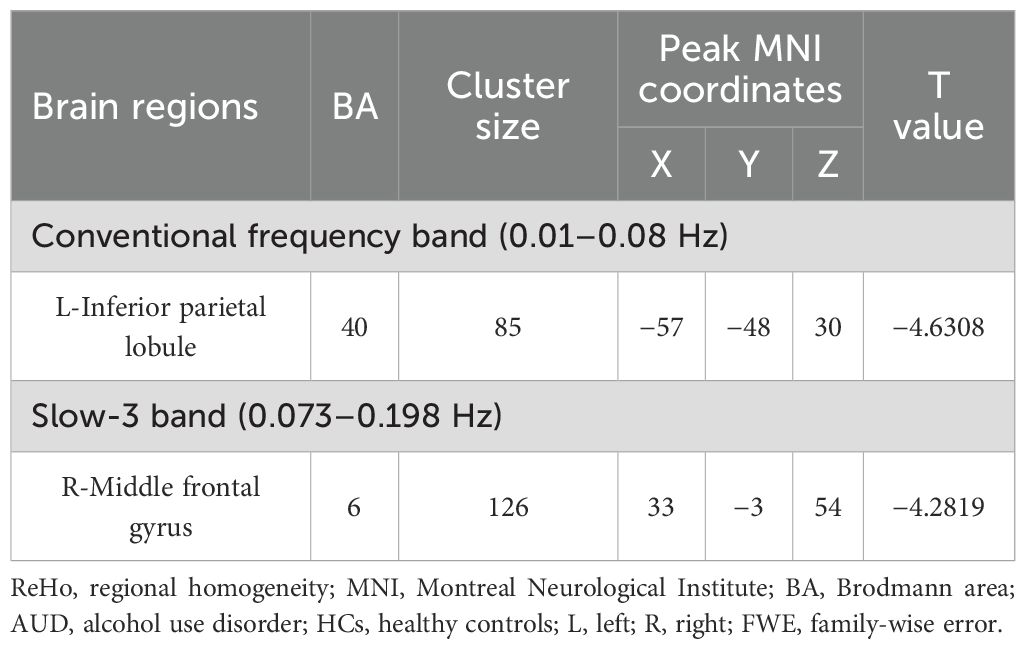
Table 2. The ReHo difference in each frequency band between patients with AUD and HCs (p < 0.05, cluster-level FWE corrected).
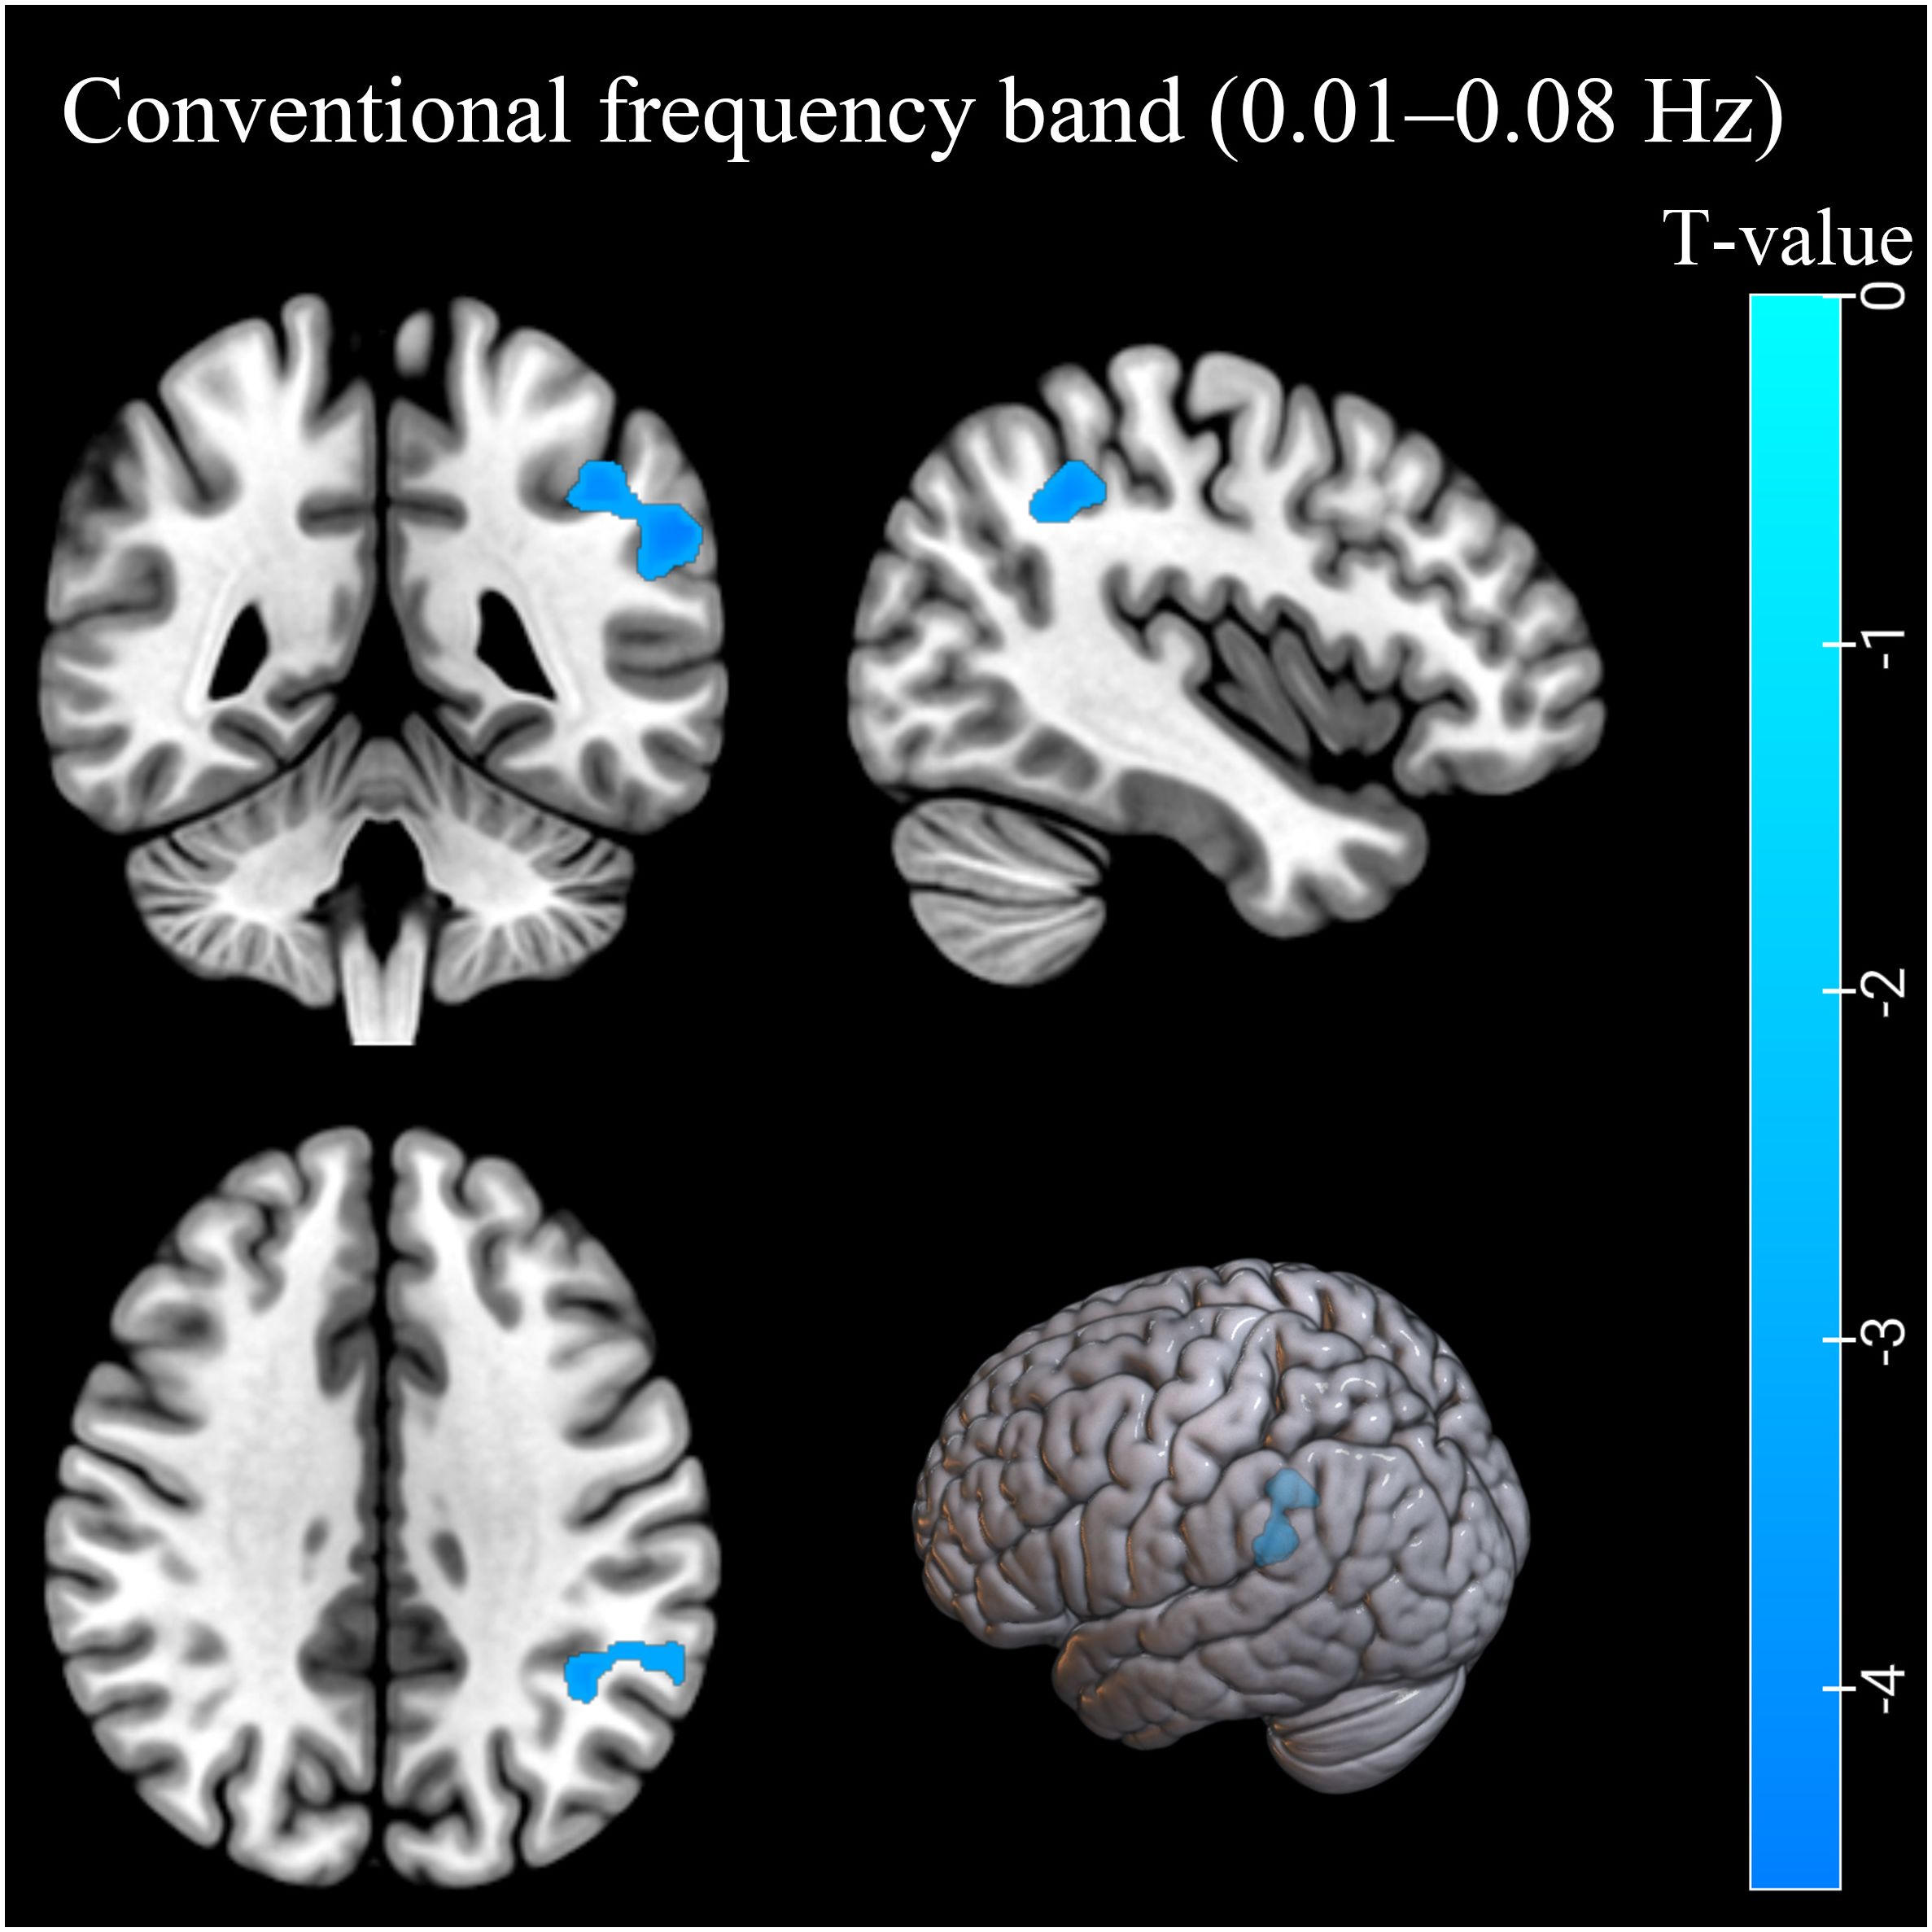
Figure 1. The ReHo differences in the conventional band (0.01–0.08 Hz) between AUD patients and HCs. Blue denotes lower ReHo values in AUD patients compared to HCs. ReHo, regional homogeneity; AUD, alcohol use disorder; HCs, healthy controls.
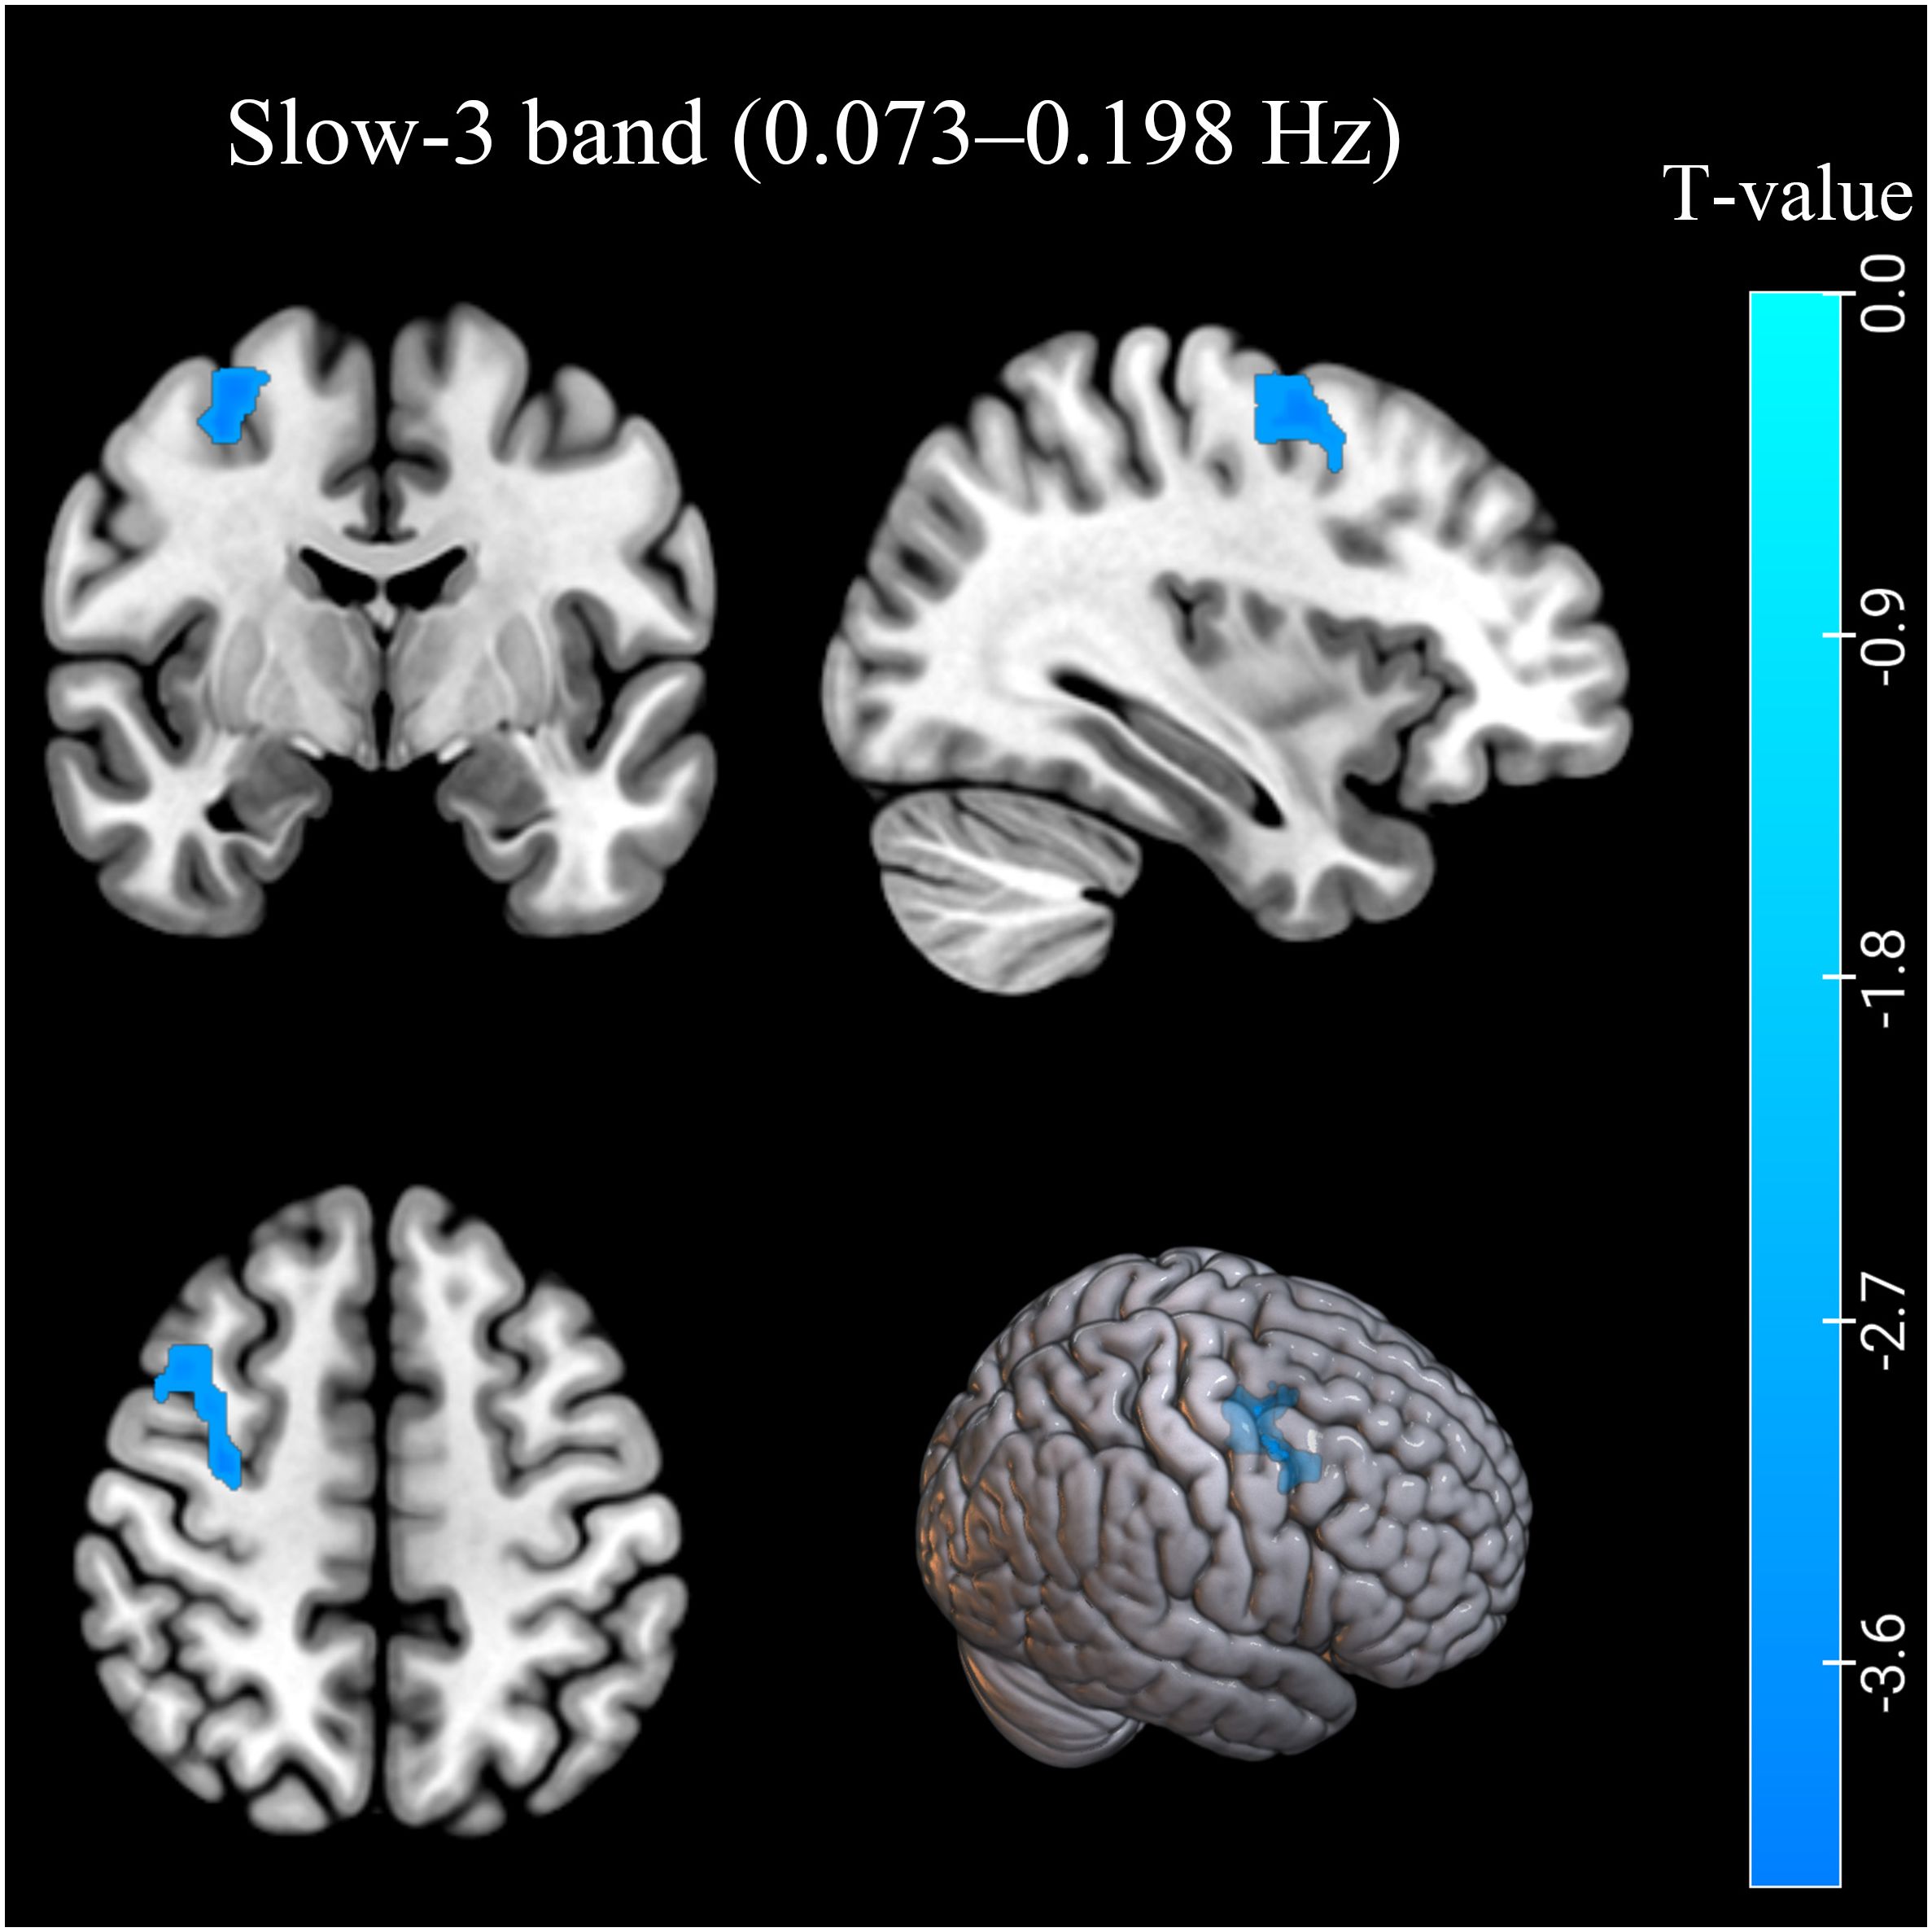
Figure 2. The ReHo differences in the slow-3 band (0.073–0.198 Hz) between AUD patients and HCs. Blue denotes lower ReHo values in AUD patients compared to HCs. ReHo, regional homogeneity; AUD, alcohol use disorder; HCs, healthy controls.
3.3 ROC curve
According to our research, the ROC curve showed good AUC values (range 0.868–0.876) for ReHo values in various bands. Further diagnostic study found that the ReHo values can distinguish the AUD patients from the HCs with good sensitivities (range 76.7%–90.0%) and specificities (range 70.0%–86.7%) (Table 3; Figure 3).
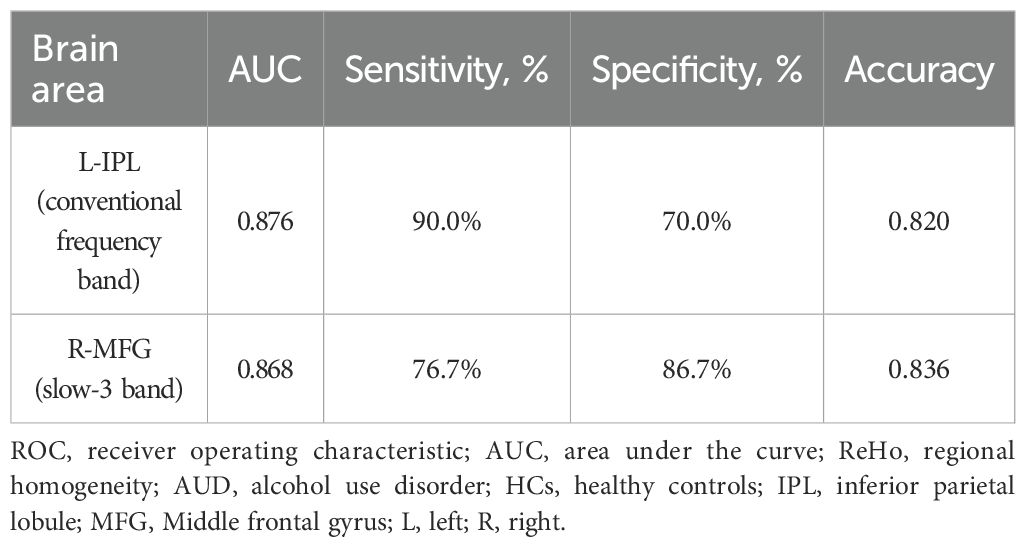
Table 3. ROC curve for ReHo differences in brain areas between AUD patients and HCs.
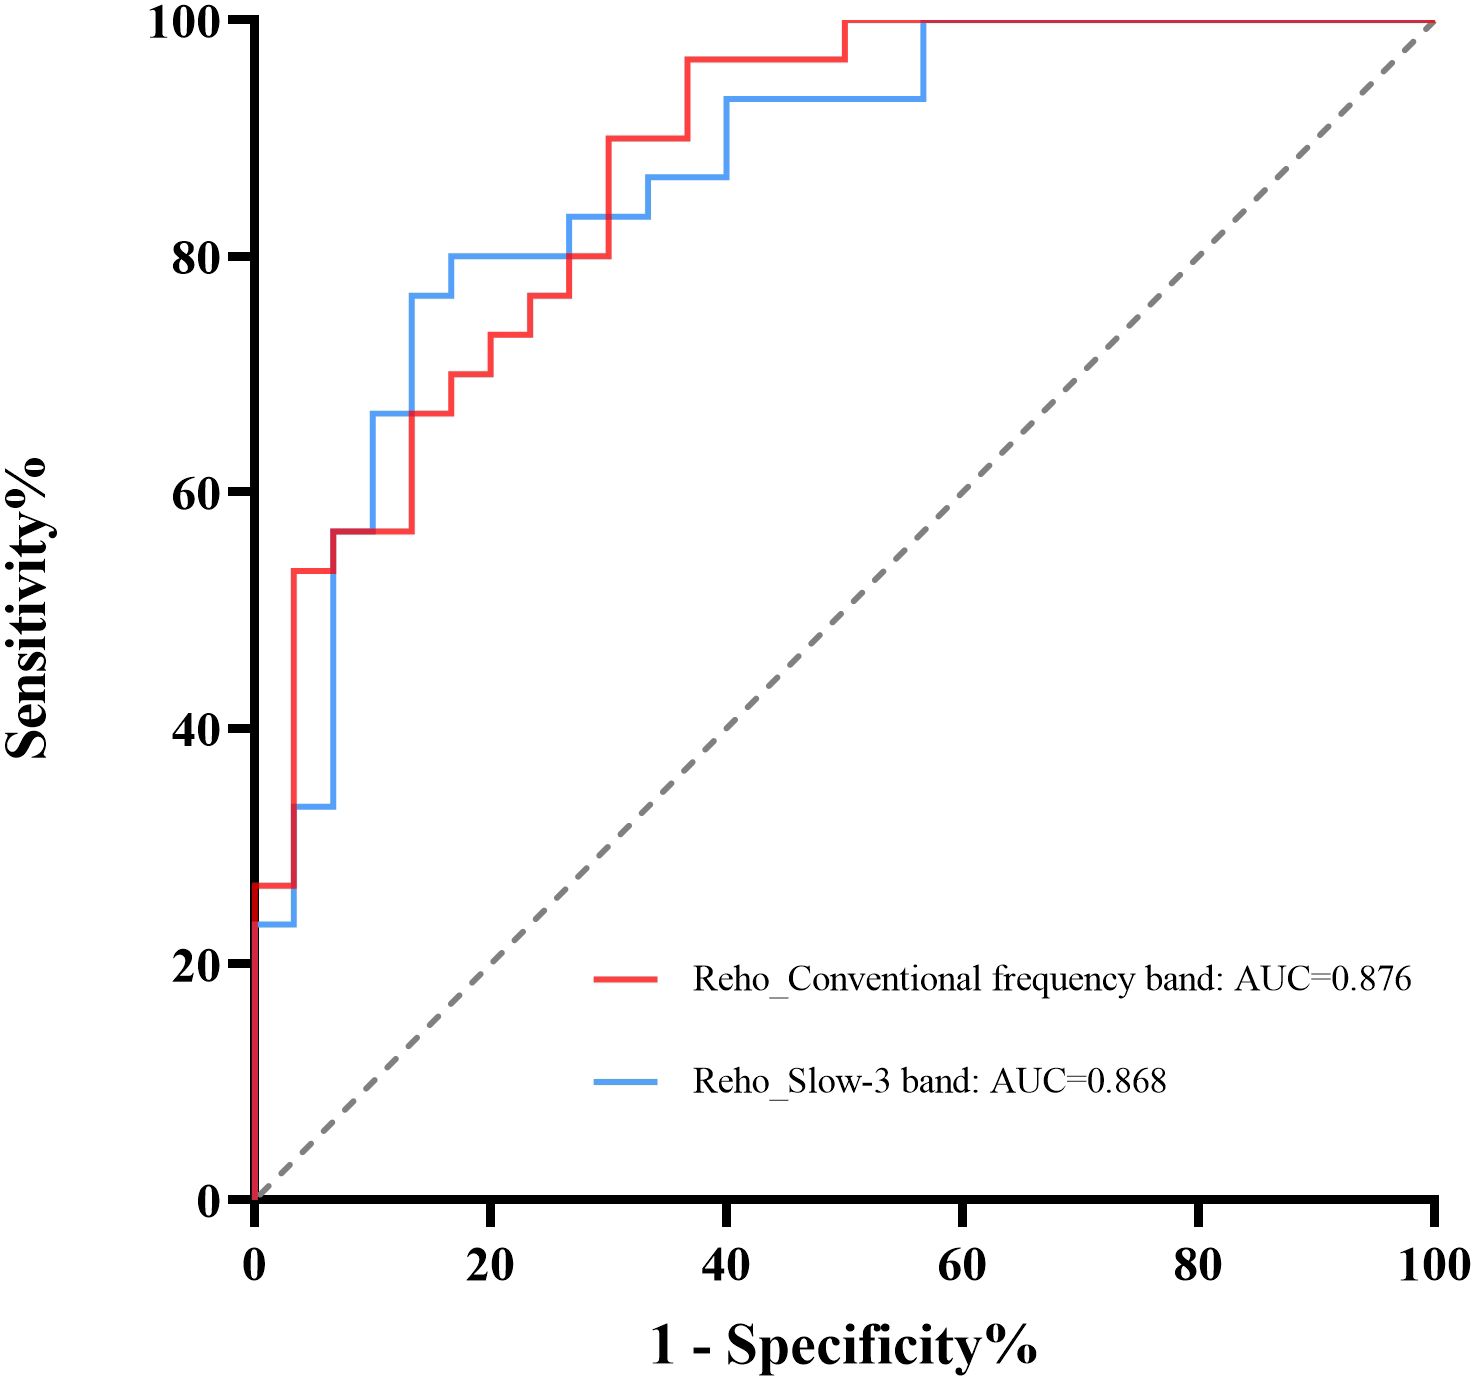
Figure 3. ROC curve analysis of ReHo values from regions with significant differences. The diagnostic efficiency of the ReHo differences in brain areas ranged from 0.876 to 0.868, with sensitivities of 76.7%–90.0% and specificities of 70.0%–86.7%. ReHo, regional homogeneity; ROC, receiver operating characteristic.
3.4 Correlation analysis
The MAST or ADS scores were not significantly correlated with the ReHo values from regions with significant differences between groups (Figure 4).
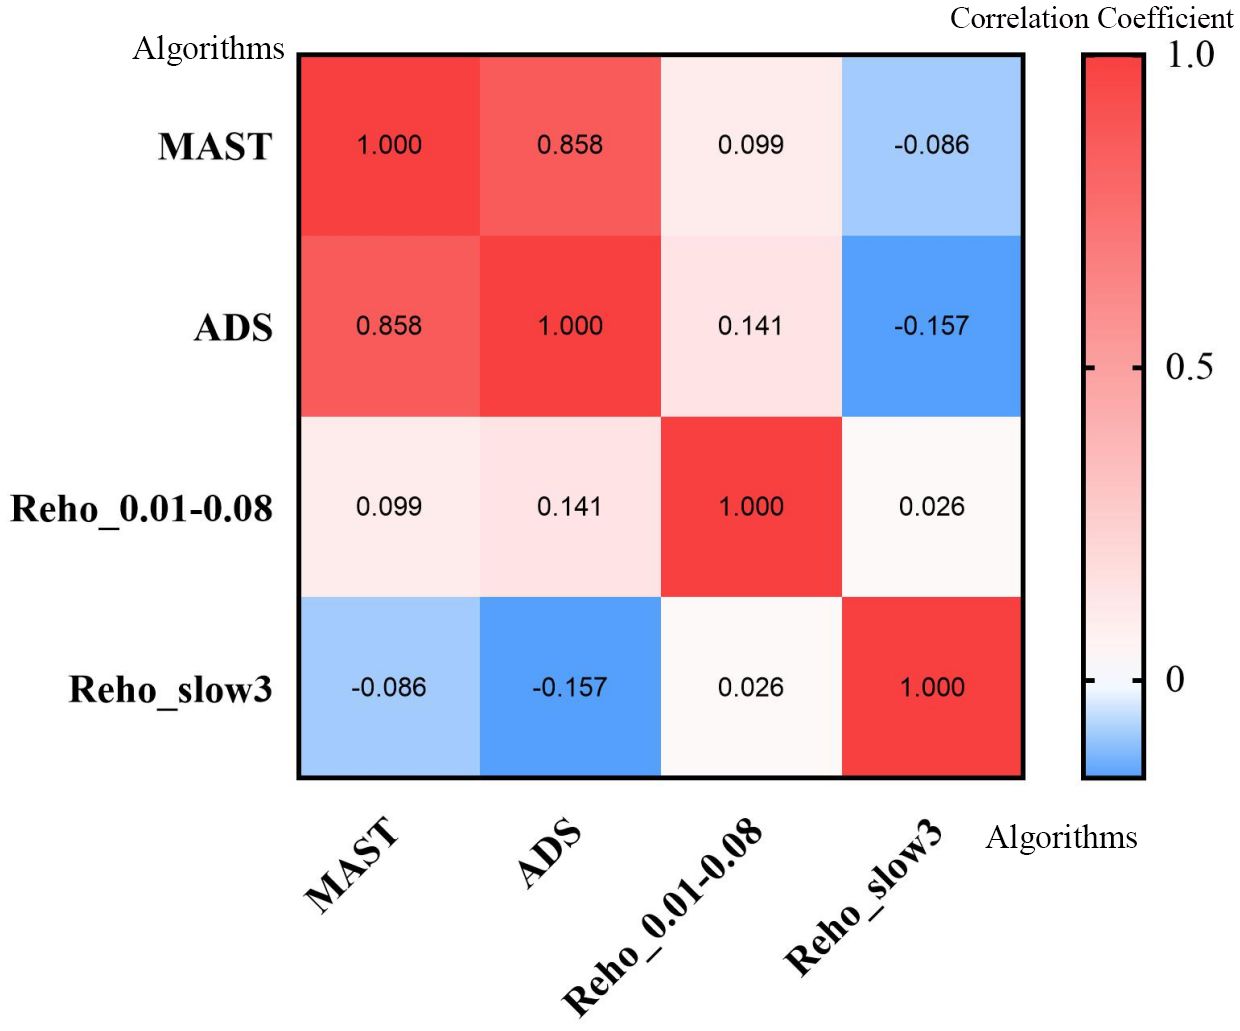
Figure 4. Heatmap of correlation analysis between MAST score, ADS score, and ReHo values from regions with significant differences in different frequencies. ReHo, regional homogeneity; MAST, Michigan Alcohol Screening Test; ADS, Alcohol Dependence Scale.
4 Discussion
ReHo is a method to examine local signal variation in brain activity (4). Many studies have indicated that the low-frequency fluctuation of fMRI was related to spontaneous neuronal activity in certain areas of the brain (27, 28). Currently, fMRI studies on AUD patients have mostly focused on the conventional frequency band (9, 10). Previous results (29) have shown that brain activity in AUD patients may be different in multiple frequency bands, but no studies have explored the regional homogeneity of multiple frequency bands in AUD patients. Therefore, this study investigated the brain activity of AUD patients using the ReHo method in six different frequency bands.
Significant variations in ReHo values were seen in several regions in the two frequency bands. These findings suggested frequency-dependent effects of altered brain activity in AUD patients.
In this study, the AUD group exhibited decreased ReHo values in the left IPL (BA40) in the conventional frequency band and the right MFG (BA6) in the slow-3 band. In contrast, ReHo values in slow-2, slow-4, and slow-5 bands showed no significant group difference. The decreased ReHo values of the IPL (BA40) and MFG (BA6) indicated decreased local synchronization of BOLD signal fluctuations.
The MFG is an important part of the frontal lobe, which interacts with several brain regions to accomplish many higher brain activities, such as processing various sensory information, cognition, error processing, impulse control, and decision-making processes. The current studies (30–33) have shown that alcohol abuse can lead not only to reduced MFG activation but also to changes in volume. Quaglieri et al. (34) found clusters of deactivation in the MFG of patients with AUD, and their findings suggest that patients with AUD have difficulty adapting to the changing contingencies of reward-oriented decision-making. The MFG is also a key part of language processing and has functions of coordinating different information, so the damage to this brain region was related to reduced language function in AUD patients (35). Based on these findings, our results of the reduction in regional homogeneity in the MFG are consistent with those of previous studies on alcohol abuse (30, 31, 34). Therefore, the change of MFG function may be one of the main reasons for losing control of alcohol dependence behavior.
The IPL is involved in attention allocation and the assessment of decisions (36, 37). A follow-up study of short-term abstinent alcoholics by Camchong et al. found that compared with abstainers, relapsers showed significantly decreased resting-state synchrony in the IPL (36). The results of this study suggest that relapsers have lower organization in the attention network, a process required for proper decision-making and evaluation, such as deciding to ingest suppressive drugs to avoid relapse. Previous studies have also shown that alcohol-induced differences in degree centrality are mainly located in the IPL and that functional connectivity between the bilateral IPL may be related to alcohol dependence and cognitive impairment (38). Thus, the reduced ReHo of the IPL in this study may be one of the reasons for impaired attention and decision-making function in AUD patients.
The observed ReHo reductions in the MFG and IPL may reflect disruptions in large-scale intrinsic connectivity networks critical for cognitive and behavioral control. Recent studies have demonstrated that aberrant functional integration within the frontoparietal network (FPN) contributes to impaired decision-making and attentional deficits (39–41). Specifically, the MFG (a key node of the FPN) and the IPL (part of both the FPN and dorsal attention network) are hubs for top-down regulation of goal-directed behavior (42, 43). Alcohol-related ReHo reductions in these regions may indicate localized desynchronization, which could propagate to network-level dysfunctions, including disrupted communication between the FPN and default mode network (DMN) (44). Such network disorganization aligns with the loss of inhibitory control and compulsive alcohol use in AUD patients.
We found ReHo differences in two bands, but not in slow-2, slow-4, slow-5, and slow-6 bands. Slow-2 and slow-6 mainly reflect very physiological noise and low-frequency drift, which is probably the main reason (45). There were no significant ReHo differences in these frequency bands that are most susceptible to non-neural signals, indicating that the observed ReHo abnormalities in other frequency bands were unlikely to be caused by such artifacts, but were more likely to reflect the actual neural changes in the AUD. This further supports the finding of this study that the frequency band specificity has a neural significance. Although slow-4 and slow-5 bands are the two main frequency ranges in which gray matter-related oscillations occur at resting state (16), this study did not find significant differences in the ReHo of the AUD and HC groups in these two frequency bands. This indicates that the network abnormalities in AUD patients may not be dependent on the local synchrony changes in the traditional gray matter frequency bands but are transmitted through conventional frequency bands, the slow-3 frequency band, or cross-frequency band coupling (such as phase–amplitude coupling) (46, 47). The decreased ReHo in the differential frequency bands of AUD patients may indicate the desynchronization of local sub-networks (such as FPN nodes), but by retaining the integration ability of slow-4 and slow-5, the basic network architecture can be maintained.
Furthermore, the potential diagnostic value of our findings was explored. The ROC curve showed good AUC values for ReHo values from regions with significant differences in various bands. Further diagnostic study found that the ReHo values can distinguish the AUD patients from the HCs with good sensitivities and specificities. In addition, this study did not show any association between MAST/ADS scores and the ReHo values from the regions with significant differences in the conventional and slow-3 bands in AUD patients.
There were some limitations in our study. First, the sample size was relatively small, although rs-fMRI studies with more than 16 subjects per group are considered acceptable (48). Future replication in larger cohorts is essential. Second, the results may not apply to female AUD subjects due to the fact that only men were included. Finally, this study was cross-sectional, and dynamic changes of ReHo in AUD patients could not be observed at various stages. Further longitudinal studies would be beneficial in addressing this issue.
5 Conclusion
The ReHo analysis demonstrated aberrant signal fluctuations in certain areas of the brains of AUD patients. Furthermore, altered spontaneous brain activity was frequency-specific. The use of a particular frequency band may be helpful in measuring the intrinsic activity of AUD patients. Our results will help to better understand the neuropathological mechanism of AUD, which can provide a foundation for further exploration.
Author’s note
This research is related to a previous study by the same authors titled “A voxel-level resting-state fMRI study on patients with alcohol use disorders based on a power spectrum slope analysis method”. The previous study was performed on whether PSS, as a novel method, can well detect abnormal local brain activity in AUD patients and the current submission is focusing on aberrant regional homogeneity in multiple frequency bands. This article follows the methodology explained in 4, 16.
Data availability statement
The raw data supporting the conclusions of this article will be made available by the authors, without undue reservation.
Ethics statement
The studies involving humans were approved by The ethics committee of the Renmin Hospital of Wuhan University. The studies were conducted in accordance with the local legislation and institutional requirements. The participants provided their written informed consent to participate in this study.
Author contributions
XR: Conceptualization, Data curation, Formal Analysis, Investigation, Methodology, Software, Visualization, Writing – original draft. TY: Conceptualization, Data curation, Project administration, Validation, Writing – original draft. CY: Conceptualization, Data curation, Validation, Writing – original draft. MY: Conceptualization, Project administration, Resources, Supervision, Validation, Writing – review & editing. JC: Conceptualization, Data curation, Project administration, Resources, Supervision, Validation, Writing – review & editing.
Funding
The author(s) declare that no financial support was received for the research and/or publication of this article.
Acknowledgments
We thank all the participants patients and volunteers for participating in this study.
Conflict of interest
The authors declare that the research was conducted in the absence of any commercial or financial relationships that could be construed as a potential conflict of interest.
Generative AI statement
The author(s) declare that no Generative AI was used in the creation of this manuscript.
Any alternative text (alt text) provided alongside figures in this article has been generated by Frontiers with the support of artificial intelligence and reasonable efforts have been made to ensure accuracy, including review by the authors wherever possible. If you identify any issues, please contact us.
Publisher’s note
All claims expressed in this article are solely those of the authors and do not necessarily represent those of their affiliated organizations, or those of the publisher, the editors and the reviewers. Any product that may be evaluated in this article, or claim that may be made by its manufacturer, is not guaranteed or endorsed by the publisher.
Abbreviations
AUD, alcohol use disorder; ReHo, regional homogeneity; ROC, receiver operating characteristic; rs-fMRI, resting-state functional magnetic resonance imaging; FC, functional connectivity; HCs, healthy controls; ADS, Alcohol Dependence Scale; MAST, Michigan Alcohol Screening Test; MMSE, Mini-Mental State Examination; MoCA, Montreal Cognitive Assessment; TR, repetition time; TE, echo time; FOV, field of view; FA, flip angle; IPL, inferior parietal lobule; MFG, middle frontal gyrus; GM, gray matter; MNI, Montreal Neurological Institute; BA, Brodmann area; L, left; R, right.
References
1. Carvalho AF, Heilig M, Perez A, Probst C, and Rehm J. Alcohol use disorders. Lancet. (2019) 394:781–92. doi: 10.1016/S0140-6736(19)31775-1
2. Witkiewitz K, Litten RZ, and Leggio L. Advances in the science and treatment of alcohol use disorder. Sci Adv. (2019) 5:eaax4043. doi: 10.1126/sciadv.aax4043
3. Duan R, Li Y, Jing L, Zhang T, Yao Y, Gong Z, et al. The altered functional connectivity density related to cognitive impairment in alcoholics. Front Psychol. (2022) 13:973654. doi: 10.3389/fpsyg.2022.973654
4. Zuo XN, Xu T, Jiang L, Yang Z, Cao XY, He Y, et al. Toward reliable characterization of functional homogeneity in the human brain: preprocessing, scan duration, imaging resolution and computational space. Neuroimage. (2013) 65:374–86. doi: 10.1016/j.neuroimage.2012.10.017
5. Di Pietro F, Lee B, and Henderson LA. Altered resting activity patterns and connectivity in individuals with complex regional pain syndrome. Hum Brain Mapp. (2020) 41:3781–93. doi: 10.1002/hbm.25087
6. Zhao X, Yao J, Lv Y, Zhang X, Han C, Chen L, et al. Abnormalities of regional homogeneity and its correlation with clinical symptoms in Naive patients with first-episode schizophrenia. Brain Imaging Behav. (2019) 13:503–13. doi: 10.1007/s11682-018-9882-4
7. Geng J, Yan R, Shi J, Chen Y, Mo Z, Shao J, et al. Altered regional homogeneity in patients with somatic depression: A resting-state fMRI study. J Affect Disord. (2019) 246:498–505. doi: 10.1016/j.jad.2018.12.066
8. Cheng J, Yang H, and Zhang J. Donepezil’s effects on brain functions of patients with alzheimer disease: A regional homogeneity study based on resting-state functional magnetic resonance imaging. Clin Neuropharmacol. (2019) 42:42–8. doi: 10.1097/WNF.0000000000000324
9. Kim H, Kim YK, Gwak AR, Lim JA, Lee JY, Jung HY, et al. Resting-state regional homogeneity as a biological marker for patients with Internet gaming disorder: A comparison with patients with alcohol use disorder and healthy controls. Prog Neuropsychopharmacol Biol Psychiatry. (2015) 60:104–11. doi: 10.1016/j.pnpbp.2015.02.004
10. Tu X, Wang J, Liu X, and Zheng J. Aberrant regional brain activities in alcohol dependence: a functional magnetic resonance imaging study. Neuropsychiatr Dis Treat. (2018) 14:847–53. doi: 10.2147/NDT.S158221
11. Fan D, Liu T, Jiang J, Kochan NA, Wang Y, Brodaty H, et al. Cognitive decline is associated with frequency-specific resting state functional changes in normal aging. Brain Imaging Behav. (2022) 16:2120–32. doi: 10.1007/s11682-022-00682-1
12. Ikeda S, Takeuchi H, Taki Y, Nouchi R, Yokoyama R, Kotozaki Y, et al. A comprehensive analysis of the correlations between resting-state oscillations in multiple-frequency bands and big five traits. Front Hum Neurosci. (2017) 11:321. doi: 10.3389/fnhum.2017.00321
13. Baria AT, Baliki MN, Parrish T, and Apkarian AV. Anatomical and functional assemblies of brain BOLD oscillations. . J Neurosci. (2011) 31:7910–9. doi: 10.1523/JNEUROSCI.1296-11.2011
14. Liu S, Zhang C, Meng C, Wang R, Jiang P, Cai H, et al. Frequency-dependent genetic modulation of neuronal oscillations: a combined transcriptome and resting-state functional MRI study. Cereb Cortex. (2022) 32:5132–44. doi: 10.1093/cercor/bhac003
15. Song X, Zhang Y, and Liu Y. Frequency specificity of regional homogeneity in the resting-state human brain. PloS One. (2014) 9:e86818. doi: 10.1371/journal.pone.0086818
16. Zuo XN, Di Martino A, Kelly C, Shehzad ZE, Gee DG, Klein DF, et al. The oscillating brain: complex and reliable. Neuroimage. (2010) 49:1432–45. doi: 10.1016/j.neuroimage.2009.09.037
17. Lv Y, Margulies DS, Villringer A, and Zang YF. Effects of finger tapping frequency on regional homogeneity of sensorimotor cortex. PloS One. (2013) 8:e64115. doi: 10.1371/journal.pone.0064115
18. Wang J, Zhang Z, Ji GJ, Xu Q, Huang Y, Wang Z, et al. Frequency-specific alterations of local synchronization in idiopathic generalized epilepsy. Med (Baltimore). (2015) 94:e1374. doi: 10.1097/MD.0000000000001374
19. Zhang H, Zhang L, and Zang Y. Fluctuation amplitude and local synchronization of brain activity in the ultra-low frequency band: An fMRI investigation of continuous feedback of finger force. Brain Res. (2015) 1629:104–12. doi: 10.1016/j.brainres.2015.10.023
20. Gimenez M, Guinea-Izquierdo A, Villalta-Gil V, Martinez-Zalacain I, Segalas C, Subira M, et al. Brain alterations in low-frequency fluctuations across multiple bands in obsessive compulsive disorder. Brain Imaging Behav. (2017) 11:1690–706. doi: 10.1007/s11682-016-9601-y
21. Qi R, Li J, Wu X, Geng X, Chen N, and Yu H. ). Effects of ketamine on basal gamma band oscillation and sensory gating in prefrontal cortex of awake rats. Neurosci Bull. (2018) 34:457–64. doi: 10.1007/s12264-018-0208-8
22. Tang X, Li B, Wang M, Gao L, He Y, and Xia G. Frequency-dependent alterations in the amplitude of low-frequency fluctuations in patients with acute pericoronitis: A resting-state fMRI study. J Pain Res. (2023) 16:501–11. doi: 10.2147/JPR.S397523
23. Li MT, Zhang SX, Li X, Antwi CO, Sun JW, Wang C, et al. Amplitude of low-frequency fluctuation in multiple frequency bands in tension-type headache patients: A resting-state functional magnetic resonance imaging study. Front Neurosci. (2021) 15:742973. doi: 10.3389/fnins.2021.742973
24. Pilatti A, Read JP, and Pautassi RM. ELSA 2016 cohort: alcohol, tobacco, and marijuana use and their association with age of drug use onset, risk perception, and social norms in argentinean college freshmen. Front Psychol. (2017) 8:1452. doi: 10.3389/fpsyg.2017.01452
25. Conley TB. Construct validity of the MAST and AUDIT with multiple offender drunk drivers. J Subst Abuse Treat. (2001) 20:287–95. doi: 10.1016/s0740-5472(01)00159-3
26. Ashburner J. A fast diffeomorphic image registration algorithm. Neuroimage. (2007) 38:95–113. doi: 10.1016/j.neuroimage.2007.07.007
27. Logothetis NK, Pauls J, Augath M, Trinath T, and Oeltermann A. Neurophysiological investigation of the basis of the fMRI signal. Nature. (2001) 412:150–7. doi: 10.1038/35084005
28. Lu H, Zuo Y, Gu H, Waltz JA, Zhan W, Scholl CA, et al. Synchronized delta oscillations correlate with the resting-state functional MRI signal. Proc Natl Acad Sci U. S. A. (2007) 104:18265–9. doi: 10.1073/pnas.0705791104
29. Ruan X, Song Z, Yu T, and Chen J. A voxel-level resting-state fMRI study on patients with alcohol use disorders based on a power spectrum slope analysis method. Front Neurosci. (2024) 18:2024.1323741. doi: 10.3389/fnins.2024.1323741
30. Li G, Chen Y, Chaudhary S, Tang X, and Li CR. Loss and frontal striatal reactivities characterize alcohol use severity and rule-breaking behavior in young adult drinkers. Biol Psychiatry Cogn. Neurosci Neuroimaging. (2022) 7:1007–16. doi: 10.1016/j.bpsc.2022.06.001
31. Li G, Zhong D, Zhang N, Dong J, Yan Y, Xu Q, et al. The inter-related effects of alcohol use severity and sleep deficiency on semantic processing in young adults. Neuroscience. (2024) 555:116–24. doi: 10.1016/j.neuroscience.2024.07.025
32. Li J, Wang Y, Xu Z, Liu T, Zang X, Li M, et al. Whole-brain morphometric studies in alcohol addicts by voxel-based morphometry. Ann Transl Med. (2019) 7:635. doi: 10.21037/atm.2019.10.90
33. Yang X, Tian F, Zhang H, Zeng J, Chen T, Wang S, et al. Cortical and subcortical gray matter shrinkage in alcohol-use disorders: a voxel-based meta-analysis. Neurosci Biobehav Rev. (2016) 66:92–103. doi: 10.1016/j.neubiorev.2016.03.034
34. Quaglieri A, Mari E, Boccia M, Piccardi L, Guariglia C, and Giannini AM. Brain network underlying executive functions in gambling and alcohol use disorders: an activation likelihood estimation meta-analysis of fMRI studies. Brain Sci. (2020) 10:05. doi: 10.3390/brainsci10060353
35. Guo T, Liu H, Misra M, and Kroll JF. ). Local and global inhibition in bilingual word production: fMRI evidence from Chinese-English bilinguals. Neuroimage. (2011) 56:2300–9. doi: 10.1016/j.neuroimage.2011.03.049
36. Camchong J, Stenger A, and Fein G. Resting-state synchrony during early alcohol abstinence can predict subsequent relapse. Cereb Cortex. (2013) 23:2086–99. doi: 10.1093/cercor/bhs190
37. Hopfinger JB, Buonocore MH, and Mangun GR. The neural mechanisms of top-down attentional control. Nat Neurosci. (2000) 3:284–91. doi: 10.1038/72999
38. Ruan X, Song Z, Zhang J, Yu T, Chen J, and Zhou T. Alterations of brain activity in patients with alcohol use disorder: a resting-state fMRI study. BMC Psychiatry. (2023) 23:894. doi: 10.1186/s12888-023-05361-z
39. Grecucci A, Langerbeck M, Bakiaj R, Ghomroudi PA, Rivolta D, Yi X, et al. Salience and default networks predict borderline personality traits and affective symptoms: a dynamic functional connectivity analysis. Front Hum Neurosci. (2025) 19:1589440. doi: 10.3389/fnhum.2025.1589440
40. Marek S and Dosenbach N. The frontoparietal network: function, electrophysiology, and importance of individual precision mapping. Dialogues Clin Neurosci. (2018) 20:133–40. doi: 10.31887/DCNS.2018.20.2/smarek
41. van Oort J, Diazgranados N, George DT, Horneffer Y, Schwandt M, Goldman D, et al. Preliminary evidence for changes in frontoparietal network connectivity in the early abstinence period in alcohol use disorder: a longitudinal resting-state functional magnetic resonance imaging study. Front Psychiatry. (2023) 14:1185770. doi: 10.3389/fpsyt.2023.1185770
42. Cole MW, Reynolds JR, Power JD, Repovs G, Anticevic A, and Braver TS. Multi-task connectivity reveals flexible hubs for adaptive task control. Nat Neurosci. (2013) 16:1348–55. doi: 10.1038/nn.3470
43. Power JD, Cohen AL, Nelson SM, Wig GS, Barnes KA, Church JA, et al. Functional network organization of the human brain. Neuron. (2011) 72:665–78. doi: 10.1016/j.neuron.2011.09.006
44. Sridharan D, Levitin DJ, and Menon V. A critical role for the right fronto-insular cortex in switching between central-executive and default-mode networks. Proc Natl Acad Sci U. S. A. (2008) 105:12569–74. doi: 10.1073/pnas.0800005105
45. Wang Z, Liu Y, Ruan X, Li Y, Li E, Zhang G, et al. Aberrant amplitude of low-frequency fluctuations in different frequency bands in patients with parkinson’s disease. Front Aging Neurosci. (2020) 12:576682. doi: 10.3389/fnagi.2020.576682
46. Marzetti L, Basti A, Chella F, D’Andrea A, Syrjala J, and Pizzella V. Brain functional connectivity through phase coupling of neuronal oscillations: A perspective from magnetoencephalography. Front Neurosci. (2019) 13:964. doi: 10.3389/fnins.2019.00964
47. Yakubov B, Das S, Zomorrodi R, Blumberger DM, Enticott PG, Kirkovski M, et al. Cross-frequency coupling in psychiatric disorders: A systematic review. Neurosci Biobehav Rev. (2022) 138:104690. doi: 10.1016/j.neubiorev.2022.104690
Keywords: alcohol use disorder, frequency band, regional homogeneity, resting-state functional magnetic resonance imaging, spontaneous brain activity
Citation: Ruan X, Yu T, You C, Yang M and Chen J (2025) Aberrant regional homogeneity in multiple frequency bands in patients with alcohol use disorder. Front. Psychiatry 16:1549970. doi: 10.3389/fpsyt.2025.1549970
Received: 22 December 2024; Accepted: 20 October 2025;
Published: 05 November 2025.
Edited by:
Wensi Tao, Nova Southeastern University, United StatesReviewed by:
Yuanchao Zhang, University of Electronic Science and Technology of China, ChinaJiajia Zhu, First Affiliated Hospital of Anhui Medical University, China
Copyright © 2025 Ruan, Yu, You, Yang and Chen. This is an open-access article distributed under the terms of the Creative Commons Attribution License (CC BY). The use, distribution or reproduction in other forums is permitted, provided the original author(s) and the copyright owner(s) are credited and that the original publication in this journal is cited, in accordance with accepted academic practice. No use, distribution or reproduction is permitted which does not comply with these terms.
*Correspondence: Ming Yang, MjgyNDQ1MDk1QHFxLmNvbQ==; Jun Chen, d2h1Y2hlbmp1bkAxNjMuY29t