 Wanchen Zhao
 Hui Zhang1
 Zhen Li
- 1Department of Nursing, Peking Union Medical College Hospital, Chinese Academy of Medical Sciences, Beijing, China
- 2Department of Clinical Nutrition, Peking Union Medical College Hospital, Chinese Academy of Medical Sciences, Beijing, China
Background: Recent evidence suggests that there is a close correlation of inflammation with depression. Therefore, our study aims to explore the association of Alpha-1-acid glycoprotein (AGP), a highly sensitive inflammatory biomarker, with depression in US adult women.
Methods: Data from the National Health and Nutrition Examination Survey (NHANES) from 2021-2023 were selected for this study. Both AGP concentrations and depression levels were assessed using standardized survey instruments. Multivariate logistic and linear regression, and restricted cubic splines models (RCS) were performed to evaluate the relationship of AGP concentrations with depression. Stratified analyses and multiplicative interaction testing were conducted to evaluate the robustness of the observed association across relevant subgroups.
Results: AGP concentrations demonstrated a positive linear association with depression among US adult women. Each standardized unit increment in ln-transformed AGP concentrations was associated with significantly higher odds of depression (OR = 2.04, 95% CI: 1.17-3.57) and a 1.47-point increase in PHQ-9 scores (β = 1.47, 95% CI: 0.37-2.56) in the fully adjusted model. Furthermore, compared with participants in the lowest AGP concentration quartile, those in the highest quartile exhibited 72% greater odds of depression (OR = 1.72, 95%CI: 1.03-2.87), and 1.32-point higher PHQ-9 scores (β = 1.32, 95%CI: 0.31-2.34) in the fully adjusted model. This positive association remained consistent across several subgroups and our sensitivity analysis. In addition, compared to C-reactive protein (CRP), AGP had a stronger predictive effect on depression using the ROC curve.
Conclusions: AGP exhibited a positive linear association with depression in US adult women. This positive association remained consistent across several subgroups. Furthermore, AGP had a stronger predictive effect on depression compared to CRP.
1 Introduction
Depression is a debilitating psychiatric condition characterized by persistent depressed mood and marked anhedonia, accompanied by cognitive impairments, psychomotor disturbances, and autonomic dysregulation, collectively contributing to significant somatic dysfunction (1). With the rapid pace of modern life and the increasing pressure of life, more and more people around the world suffer from depression. According to the World Health Organization, nearly 280 million people are diagnosed with depression worldwide, which accounts for approximately 3.8% of the global population (2), of which 10.7% are adults (3, 4). More than 700000 people all around the world annually experience depression-associated suicide (5, 6). Depression brings a substantial public health burden impacting individual well-being, familial functioning, and societal healthcare systems. However, the underlying pathophysiological mechanisms of depression have not been fully explored, but accumulating evidence suggests that inflammatory pathways and related inflammation factors may contribute to the pathogenesis and progression of depression (7, 8).
AGP is a systemic inflammatory biomarker and a non-specific acute-phase reactant, produced primarily by hepatocytes, type II pneumocytes, vascular endothelial cells, and tissue-specific parenchymal cells. After its production, it enters the blood circulation system into plasma, cerebrospinal fluid, gastrointestinal fluid, and urine (9, 10). When the body has inflammation, due to the stimulation of prostaglandin E2 and cytokines, AGP will be synthesized and secreted in large quantities, which has become an effective inflammation biomarker (11).
Emerging evidence demonstrates a significant association between systemic inflammatory markers and clinically diagnosed depression. However, the majority of existing epidemiological studies have primarily examined relationships between interleukin-1b (IL-1b), interleukin-2 (IL-2), interleukin-6 (IL-6), tumor necrosis factor-alpha (TNF-a), and other inflammatory factors and depression (12–16). AGP, as an essential inflammatory marker, can effectively respond to the early inflammation stage in humans. However, there are limited studies that have explored the association of AGP concentrations with depression. The only studies are relatively old and the conclusions have not been unified. For example, Healy D (17) suggested that AGP concentrations were positively correlated with depression risk, but K. Schmid (18) suggested that there was no relationship between them. In addition, recent studies in adolescents by Osuna E (19) and Zarate-Ortiz AG (20) also suggested that iron deficiency could lead to depression. Moreover, inflammatory markers such as C-reactive protein (CRP) and AGP are relatively sensitive indicators to evaluate individual iron status. All these indicate that there may be an association between AGP concentrations and depression, but what kind of association exists and whether this association persists in the adult population still needs to be verified by the study.
Given the existing evidence, a rigorous examination of the association between AGP concentrations and depression using large-scale, nationally representative epidemiological data is warranted. To address this knowledge gap, we conducted a cross-sectional analysis utilizing 2021-2023 NHANES data to investigate AGP-depression associations in the US adult population.
2 Methods
2.1 Study design and participants
This study conducted a cross-sectional design utilizing data from NHANES, a nationally representative surveillance program employing complex probability sampling methodology. Administered by the Centers for Disease Control and Prevention’s National Center for Health Statistics (CDC/NCHS), NHANES provides comprehensive health and nutritional assessments of the non-institutionalized US population. Participants completed self-administered standardized questionnaires during home visits, followed by comprehensive physical evaluations and clinical laboratory assessments conducted at specially equipped mobile examination centers. All the health-related data for each participant are obtained over the same period and are comparable. The study protocol (#2021-05) received ethical clearance from the Institutional Review Board of the NCHS, with all participants providing documented informed consent before data collection. All the NHANES data are publicly available at https://www.cdc.gov/nchs/nhanes/. Demographic data from the database for 2021-2023 were used in this study.
The study initially included 11,933 participants. Since the measurement of AGP data in the NHANES (2021–2023) was only presented in adult females, we designed the criteria of inclusion and exclusion for participants, including excluded participants who were males, participants who were females with missing data about AGP, participants with age < 20, participants with incomplete depression screening data, and participants with incomplete covariate measurements. The final study comprised 885 eligible participants, representing a weighted national population estimate of 6.31 million US adults. Figure 1 illustrated the complete participant selection flowchart, detailing the inclusion/exclusion criteria application.
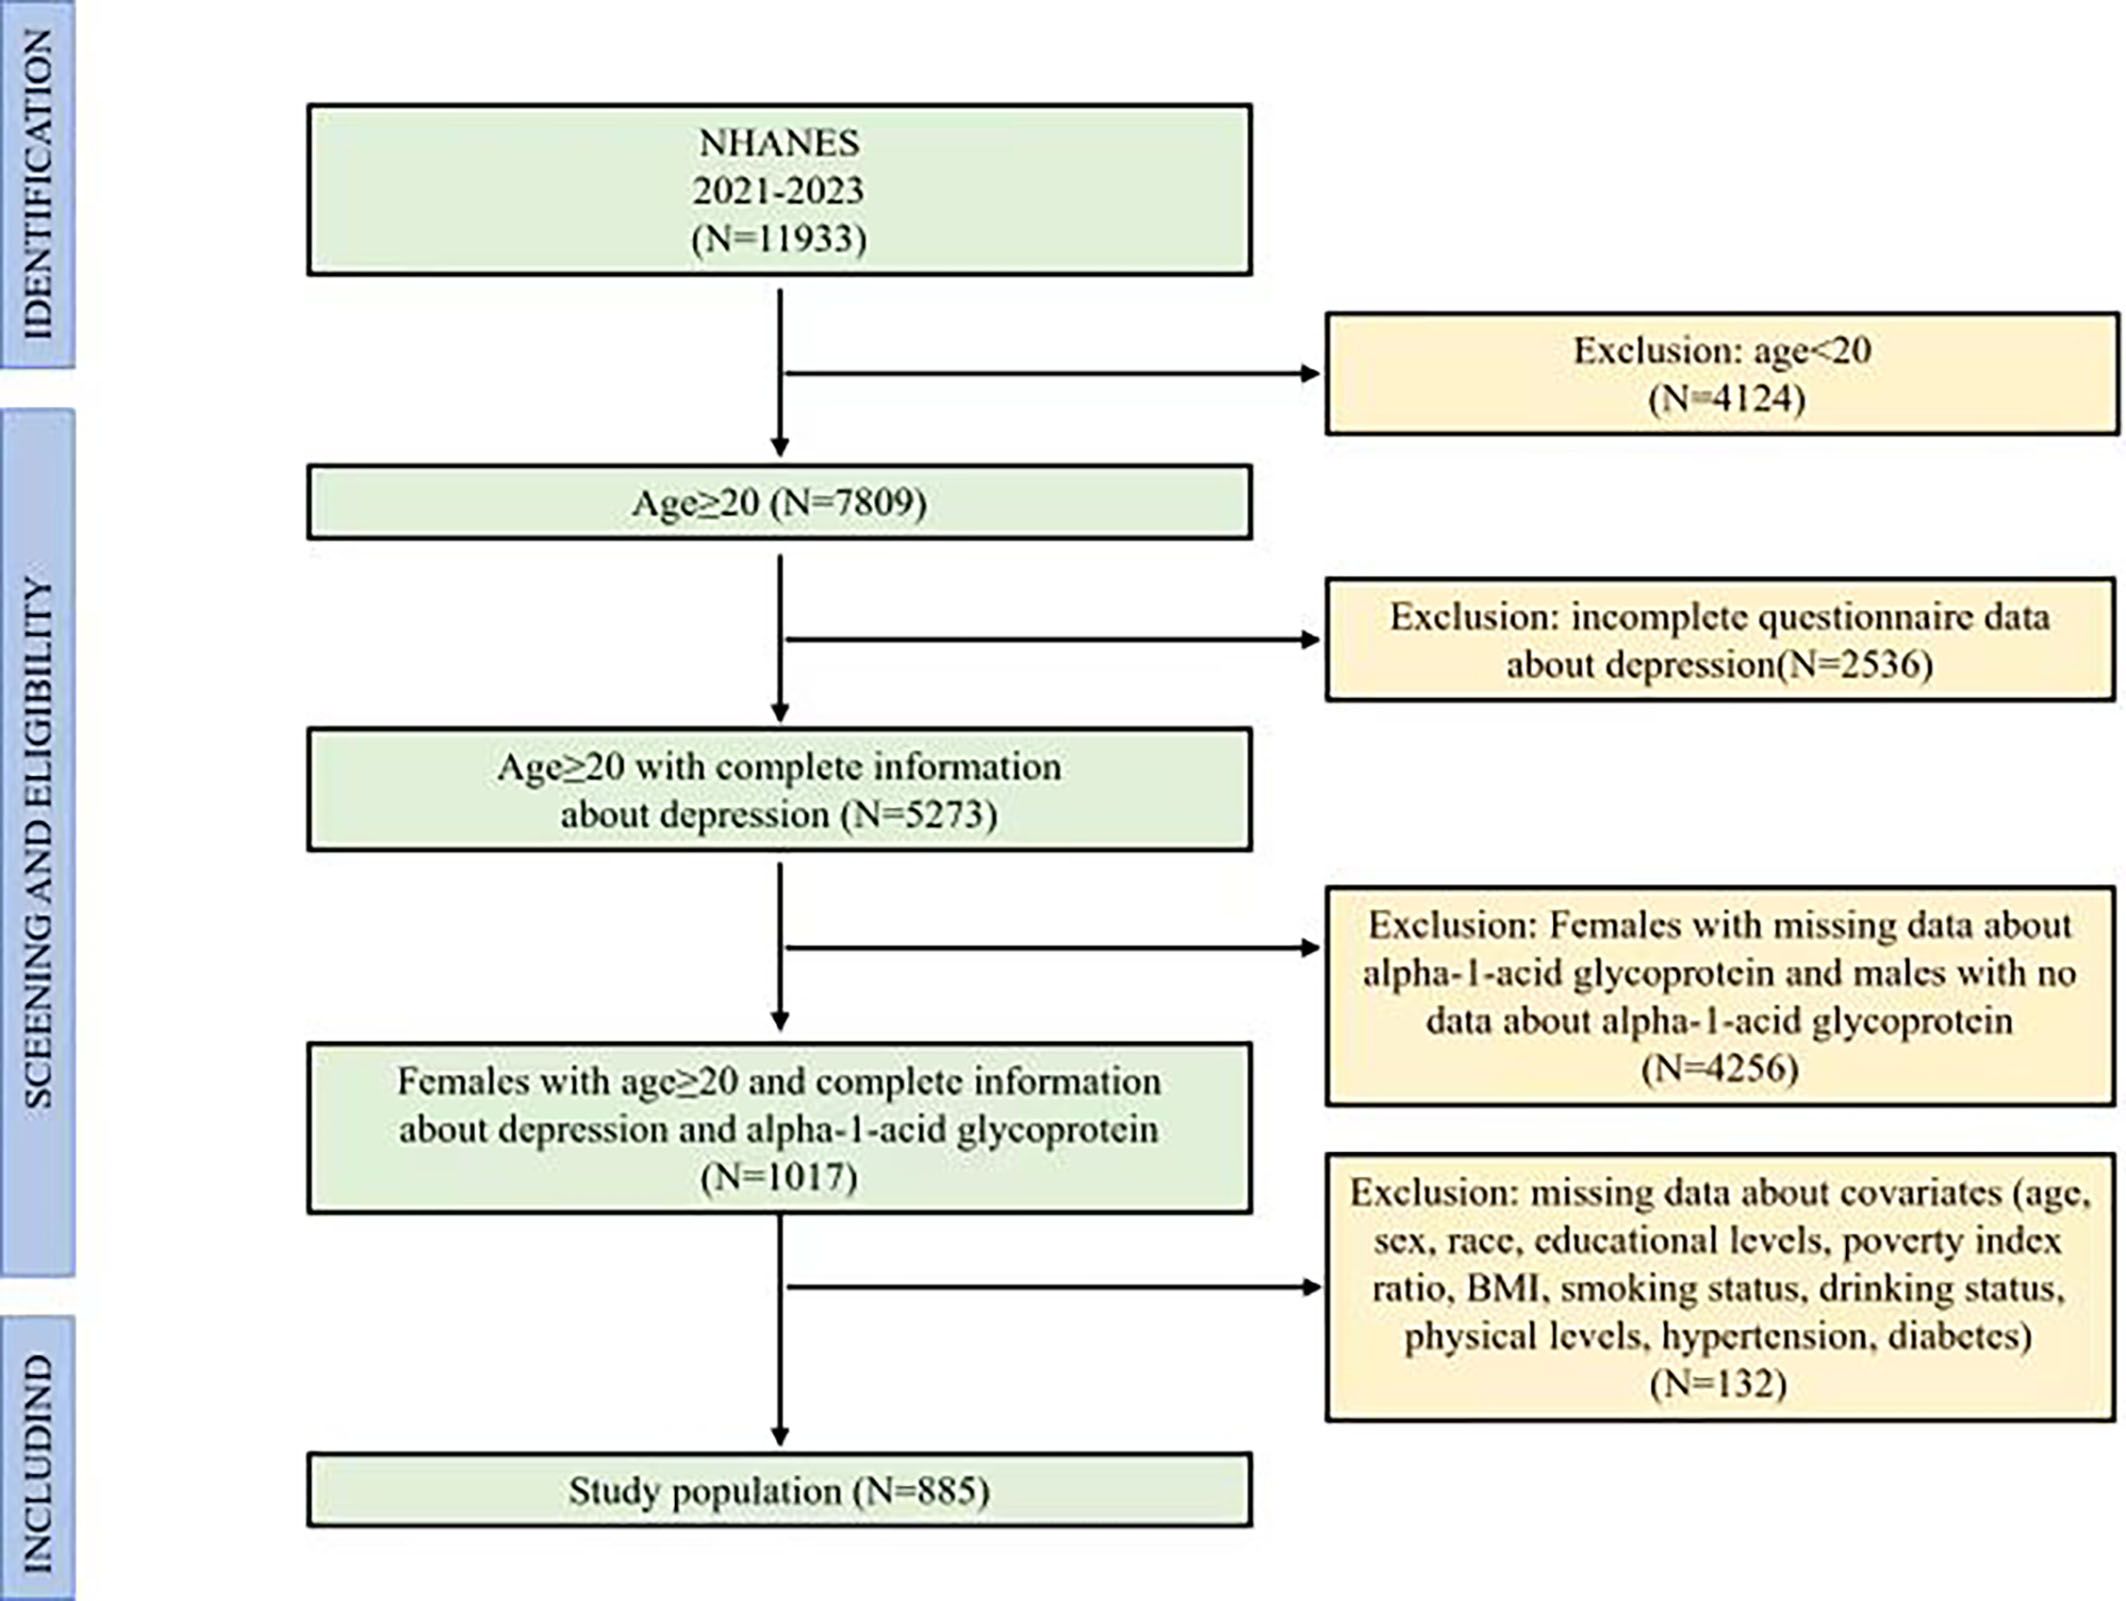
Figure 1. Flow chart of participants in inclusion and exclusion criteria.
2.2 Measurement of the AGP
The measurement of AGP concentrations was conducted using the Tina-quant Roche AGP assay, which was based on the principle of immunological agglutination. In summary, the AGP antibodies reacted with the antigen in the sample to form an antigen/antibody complex. Following agglutination, this is measured turbidimetrically.
2.3 Definitions of depression
Depression was evaluated using the 9-item Public Health Questionnaire (PHQ-9), a validated screening instrument derived from the Diagnostic and Statistical Manual of Mental Disorders, Fourth Edition (DSM-IV) criteria (21, 22). Its nine items directly align with the nine core symptoms of depression in DSM-IV (23). Each item was scored from 0 (not at all) to 3 (nearly every day) based on the frequency of symptom occurrence over the preceding two weeks. Total scores ranged from 0 to 27, with a cutoff of ≥ 10 classifying participants as having depression.
2.4 Covariates
In this study, the covariates include age (20-34 years and 35-49 years), race (non-Hispanic White, non-Hispanic Black, Mexican American, or other races), educational levels (lower than high school, high school, and college or above), poverty index ratio (PIR; < 1, 1-3, > 3), body mass index [BMI; < 18.5 kg/m2 (underweight), 18.5-24.9 kg/m2 (normal weight), 25-29.9 kg/m2 (overweight), ≥ 30 kg/m2 (obesity)], drinking status (never, former, current) and smoking status (never, former, current), physical activity (vigorous physical level, middle physical level, and others levels), hypertension (yes and no) and diabetes (yes and no) (12) (24). Hypertension was defined as (1): systolic blood pressure ≥ 130 mmHg (2); diastolic blood pressure ≥ 80 mmHg (3); physician-diagnosed hypertension; or (4) current use of antihypertensive medications. Diabetes mellitus was defined as: (1) fasting blood glucose ≥ 126 mg/dL; (2) HbA1c level ≥ 6.5%; (3) physician-diagnosed diabetes; or (4) current use of glucose-lowering medications.
2.5 Statistical analysis
Participant baseline characteristics were analyzed using appropriate statistical methods based on variable types: continuous variables were compared using t-tests or the Mann-Whitney U test, while categorical variables were assessed with χ² tests as indicated. To present the distribution condition of AGP concentrations and the potential relationship of AGP concentrations with depression, the dot plots of AGP concentrations in depression and non-depression groups and two-dimensional scattered plots of the correlation between AGP concentrations and PHQ-9 scores were performed. To reduce the skew of the AGP concentrations in subsequent statistical analysis, the AGP concentrations were ln-transformed. The AGP concentrations were regarded as continuous and category variables. When it was category variables, it was divided into the fourth quartile (the lowest quartile, the second and third quartiles, and the highest quartile). The associations between natural logarithm-transformed AGP concentrations and both depression status (via weighted multivariable-adjusted logistic regression) and continuous symptom severity scores (via weighted linear regression) were examined, with restricted cubic splines (RCS) modeling employed to evaluate potential nonlinear dose-response relationships. To evaluate the robustness of the observed association between AGP concentrations and depression, stratified analyses, interaction tests, and sensitivity analyses were performed. The Benjamini-Hochberg (BH) method was used to adjust the multiple comparison corrections to cause potential the risk of false positives to increase. To comprehensively assess the predictive capacity of AGP for depression, CRP was incorporated as a comparator inflammatory marker. Receiver operating characteristic (ROC) curve analysis was then performed to evaluate and compare the diagnostic accuracy of both biomarkers. All statistical analyses were conducted using R statistical software (v4.3.1; R Foundation for Statistical Computing), with statistical significance determined a priori as two-tailed P < 0.05. This study employed a cross-sectional design utilizing 2021-2023 NHANES data to examine associations between AGP concentrations and clinically assessed depression, which may not establish causal relationships due to this study design.
3 Result
3.1 Baseline demographic characteristics of the participants
As presented in Table 1, our study included 885 women aged ≥ 20 years, comprising 183 (20.7%) with depression and 702 (79.3%) without depression. The AGP concentrations (0.86 ± 0.28) in depression groups were higher than those (0.77 ± 0.24) in none-depression groups in Figure 2. Mann-Whitney U tests, t-tests and chi-square tests revealed significant intergroup differences in multiple variables including socioeconomic status (PIR), anthropometric measures (BMI), health behaviors (tobacco use and physical activity), cardiometabolic comorbidities (hypertension and diabetes), inflammatory markers (AGP concentrations), and depressive symptom severity (PHQ-9 scores) (all P < 0.05).
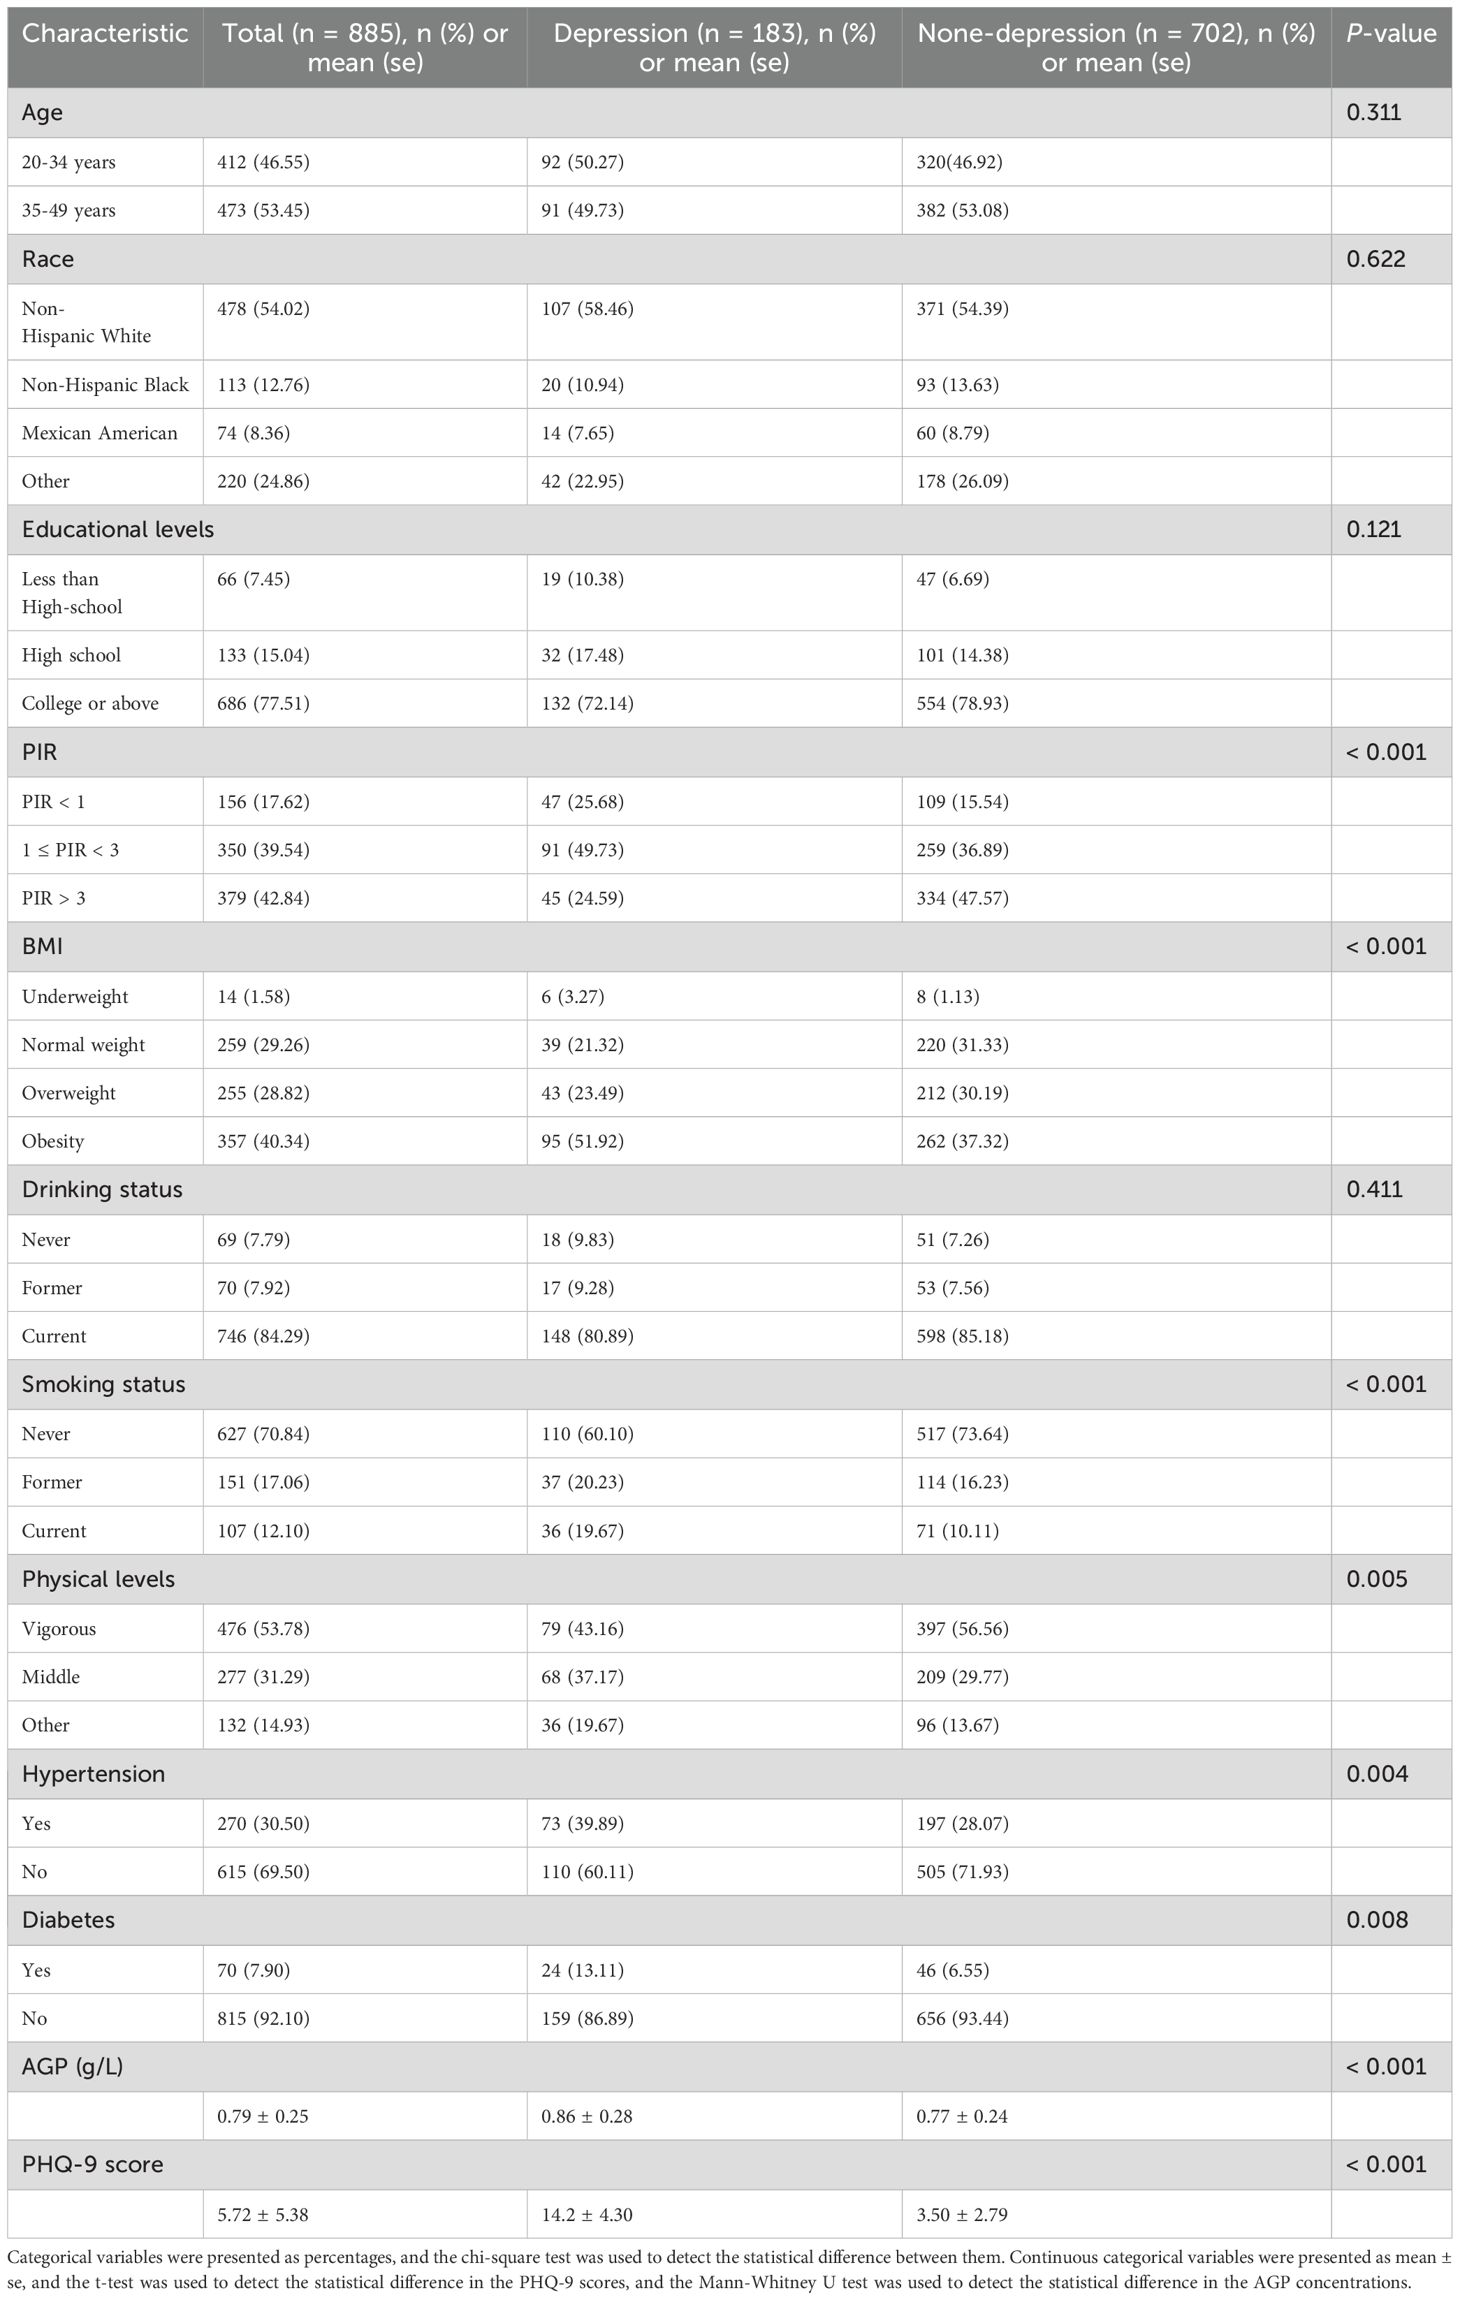
Table 1. Baseline demographic characteristics of the participants.
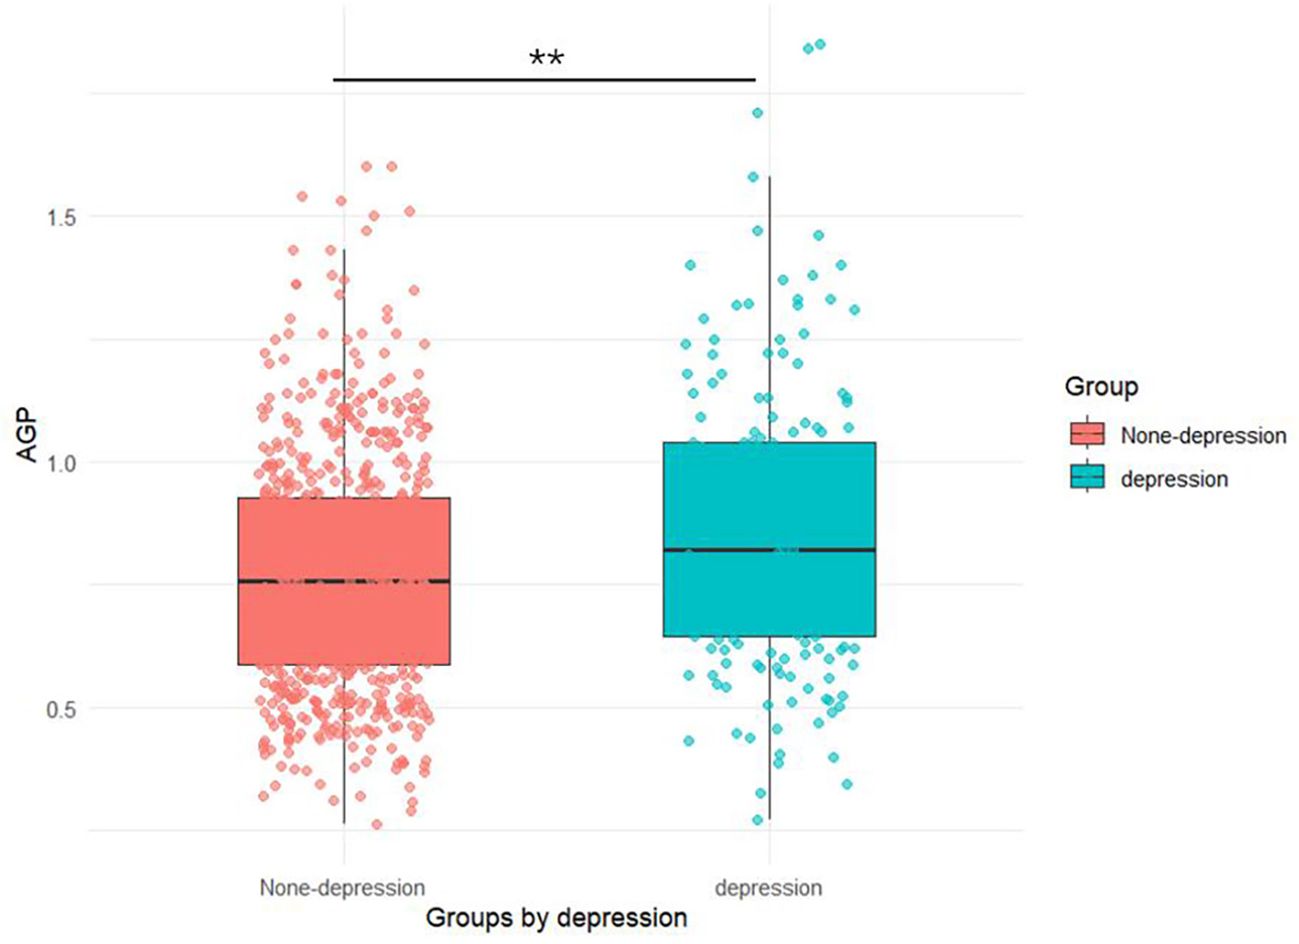
Figure 2. Dot plots of AGP concentrations in depression and non-depression groups.
3.2 Association between AGP concentrations and depression
The two-dimensional scattered plots between AGP concentrations and PHQ-9 scores were performed to initially reveal the potential relationship, this result showed that AGP concentrations may have a positive relationship with PHQ-9 scores (r = 0.15, P < 0.001) (Figure 3). Therefore, to further examine the association, the weighed multivariates logistical regression and linear models and RCS models were used. Table 2 demonstrated the significant association of AGP concentrations with depression. Each ln-unit increase in AGP concentrations was associated with significantly higher odds of depression across progressively adjusted models: Model 1 (OR = 2.87, 95%CI: 1.69-4.86), Model 2 (OR = 2.35, 95%CI: 1.36-4.06), and Model 3 (OR = 2.04, 95%CI: 1.17-3.57). Consistently, participants in the uppermost quartile of AGP concentrations demonstrated a significantly elevated odds ratio for depression relative to those in the lowest quartile: Model 1 (OR = 2.36, 95%CI: 1.46-3.82), Model 2 (OR = 1.95, 95%CI: 1.18-3.23), and Model 3 (OR = 1.72, 95%CI = 1.03-2.87). Notably, consistent positive associations were observed between AGP concentrations and PHQ-9 scores. To further reveal whether there was a significant linear relationship between AGP and depression. A trend analysis was used, and our results showed an increased trend of the odds ratio of depression with AGP concentrations in three models (all P for trend < 0.05). The RCS models with three knots [adjusted R2 value was the highest (0.734) and AIC value was lowest (2167), which suggested that the model in this condition had the best performance] were performed to further explore the potential non-linear relationship between AGP concentrations and depression and PHQ-9 scores. Our results showed a linear relationship between ln-transform AGP and depression (P for overall = 0.011, P for nonlinear = 0.129) and the PHQ-9 scores (P for overall = 0.012, P for nonlinear = 0.175), respectively, which was consistent with our linear trend analysis (Figure 4).
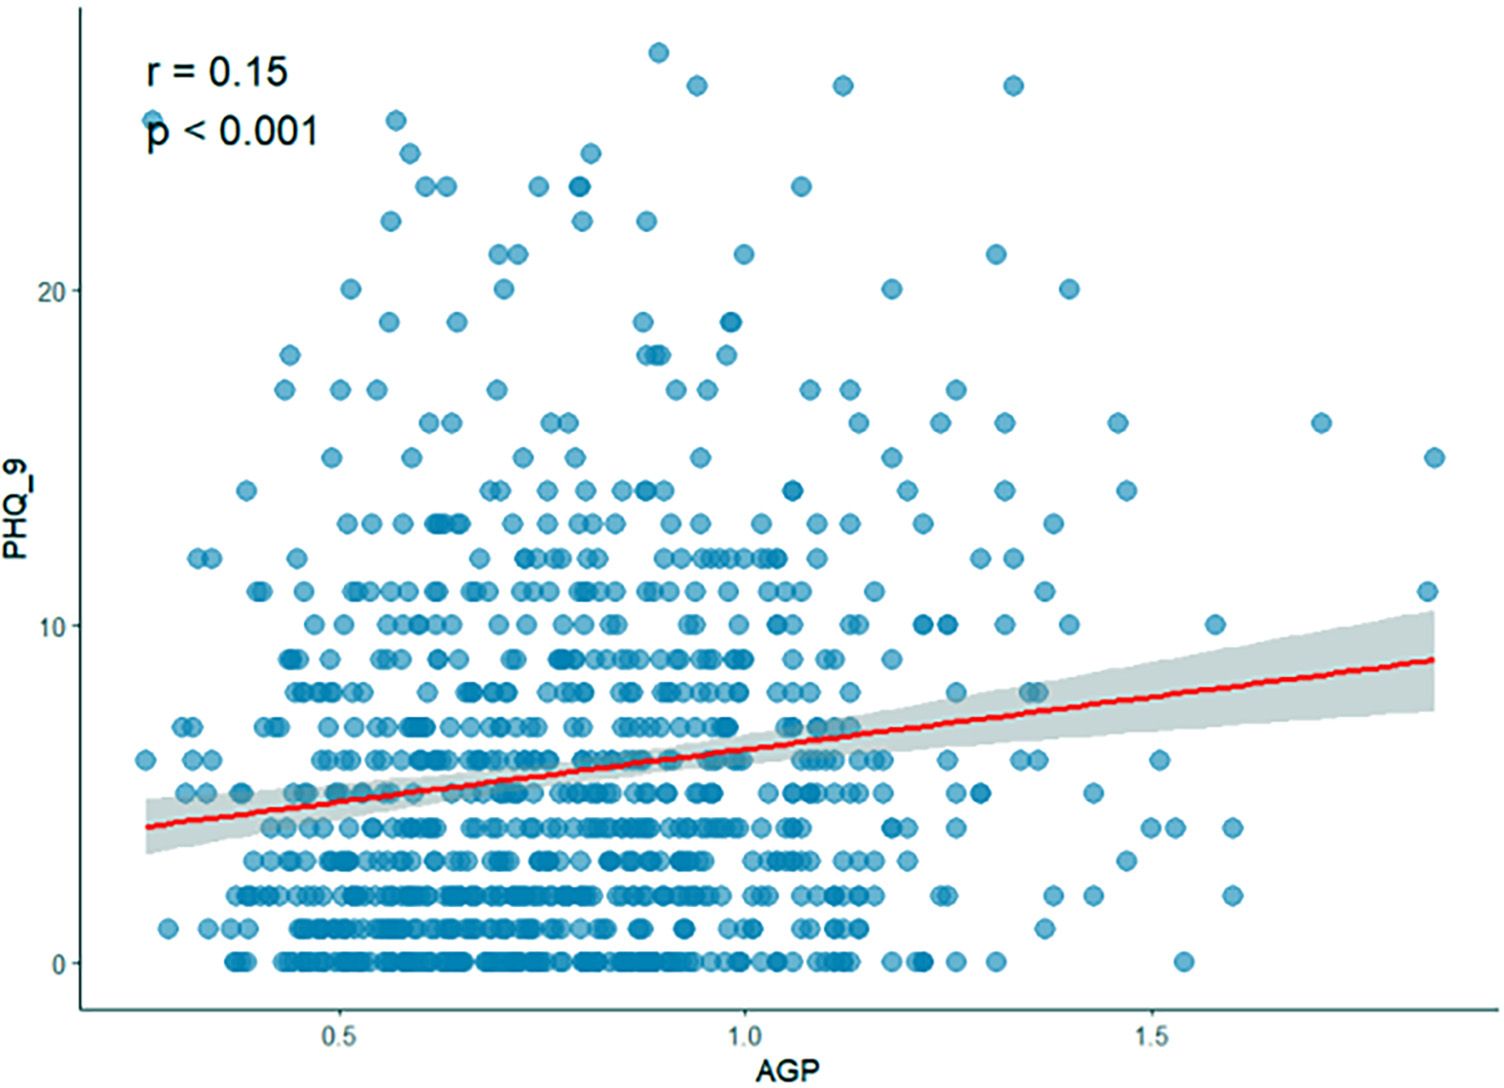
Figure 3. Two-dimensional scattered plots of correlation between AGP concentrations and PHQ-9 score.
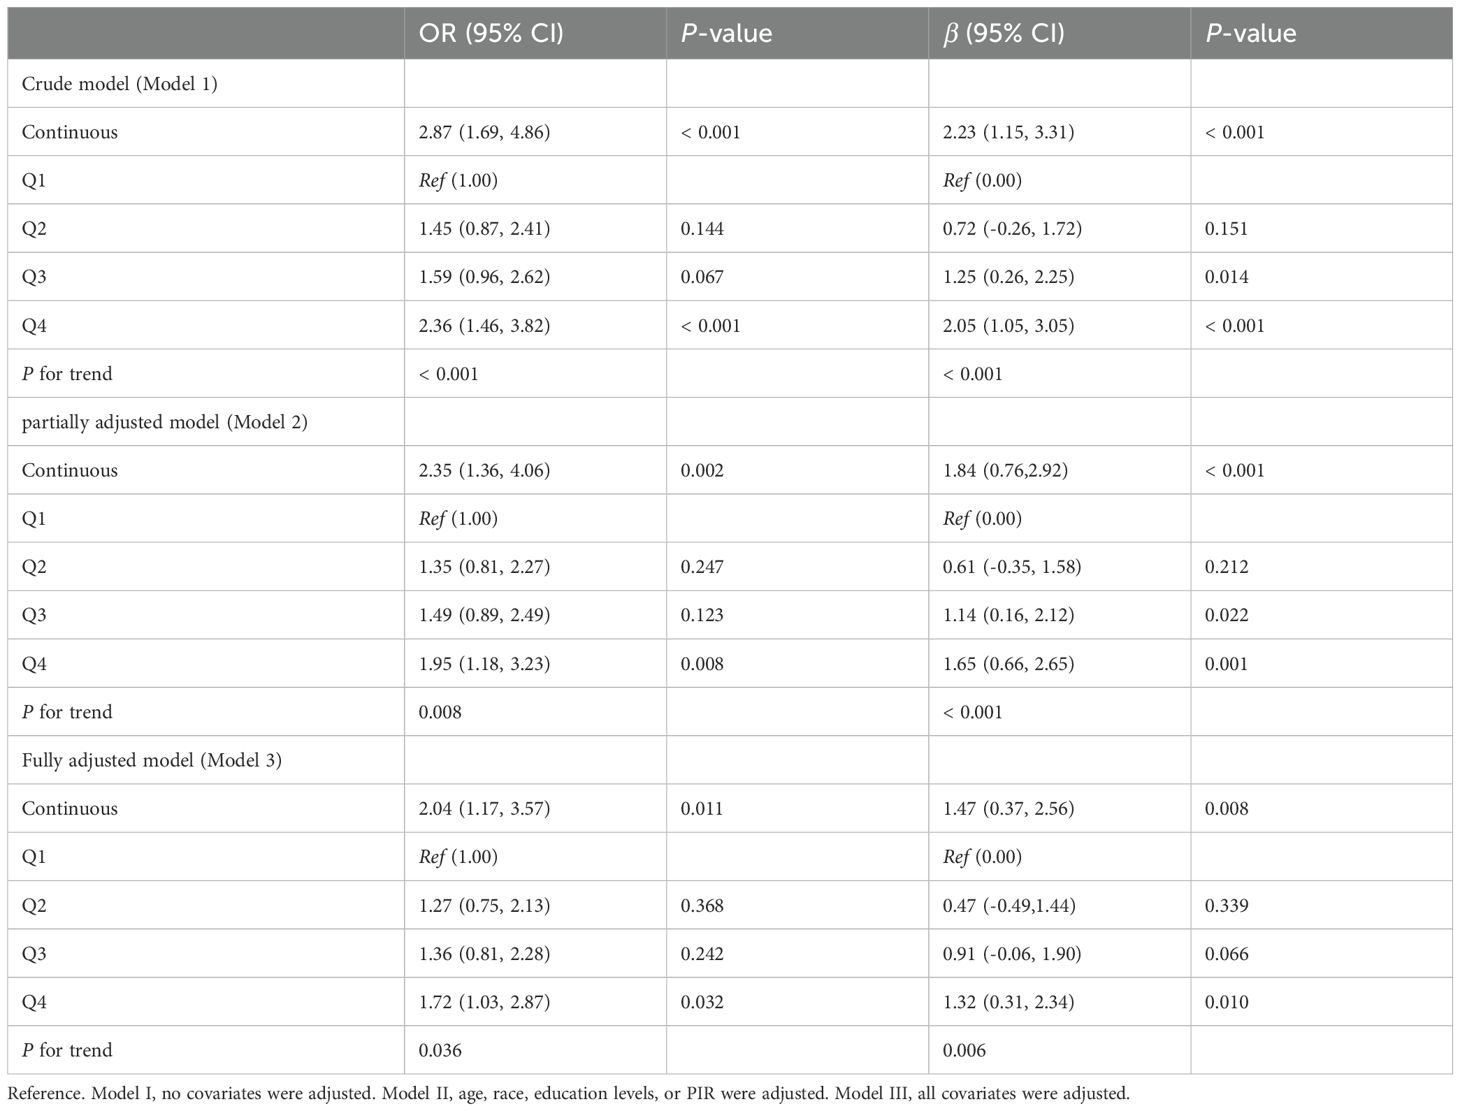
Table 2. Association between AGP concentrations and depression and PHQ-9 scores.
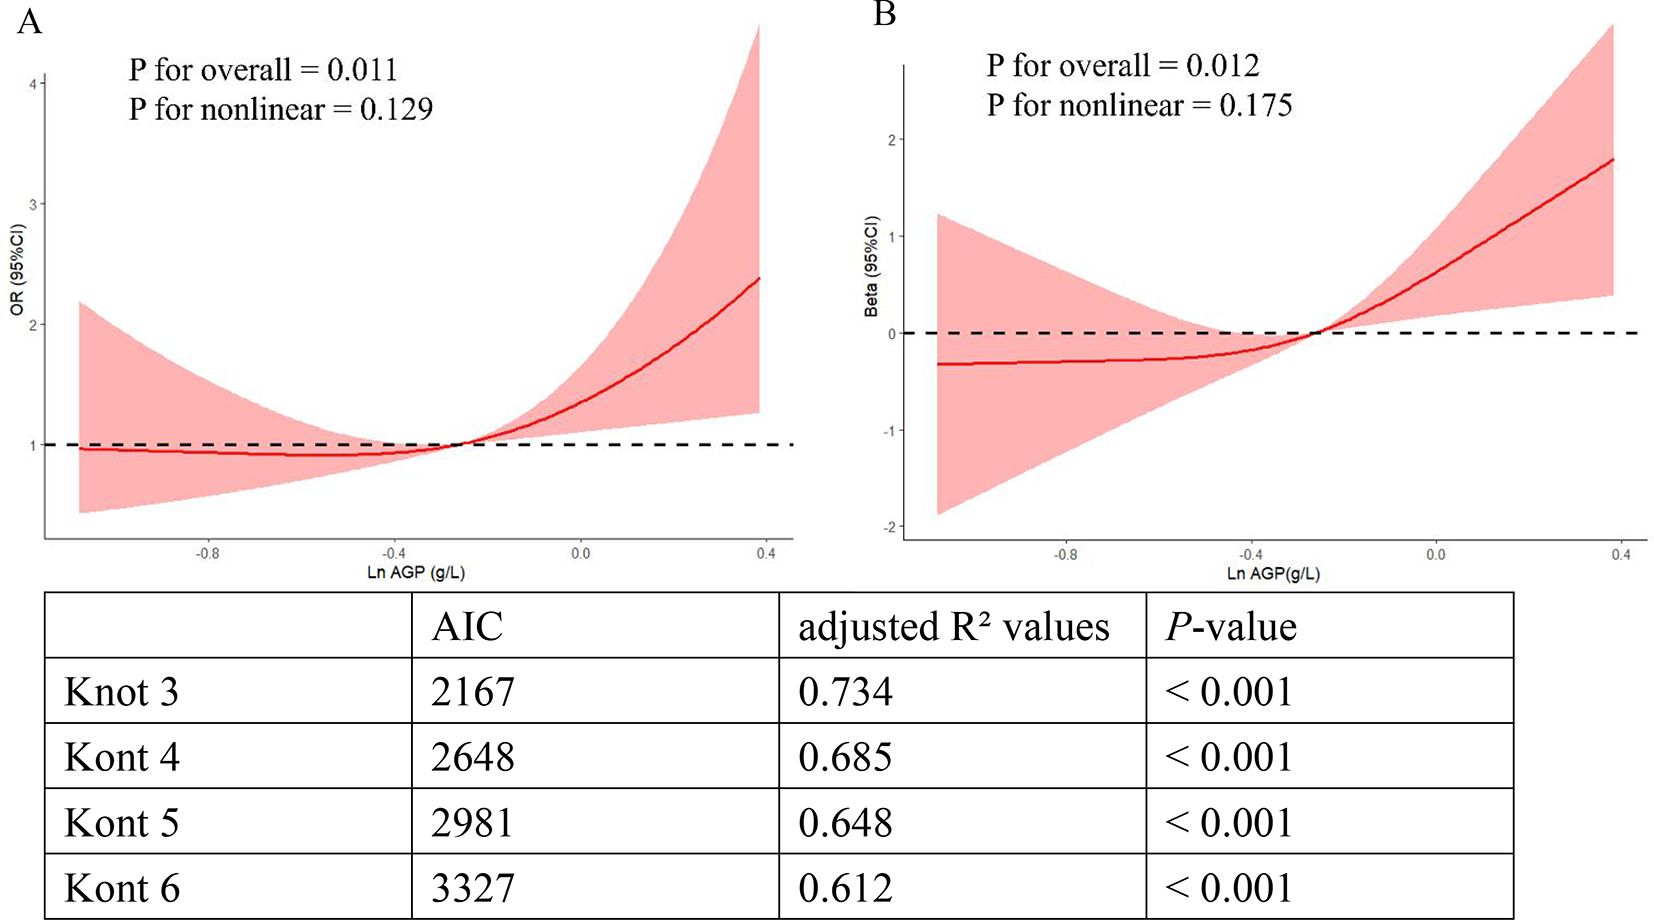
Figure 4. The linear relationship of ln-transformed AGP with depression and the PHQ-9 scores in RCS models. (A) The linear relationship of ln-transformed AGP with the depression risk. (B) The linear relationship of ln-transformed AGP with the PHQ-9 scores.
3.3 Stratified analyses and sensitivity analyses
To evaluate the stability of the observed relationship between depression and AGP concentrations, we performed comprehensive stratified analyses and multivariable sensitivity testing across clinically relevant subgroups. To control the multiple comparisons to increase the risk of false positives, we used the method of Benjamini-Hochberg (BH) to adjust all P-values in stratified analyses (Supplementary Table S1). Our results of stratified analyses showed consistent positive associations of AGP concentrations with depression and PHQ-9 values across specified demographic and clinical subgroups, such as younger adults (20-34 years), non-Hispanic White participants, college-educated participants, middle-income groups (PIR 1-3), current alcohol consumers, non-smokers, physically active individuals (vigorous level), Non-diabetic participants (P < 0.05, adjusted P < 0.05). Additionally, stratified analyses revealed no significant effect modification by AGP concentrations on depression (all interaction P-values > 0.05) (Table 3). To address potential bias from missing covariates in the association of AGP concentrations with depression, we employed multiple imputation methods for missing data handling. The results demonstrated robust stability of the positive AGP-depression association across all analytical models (Supplementary Table S2).
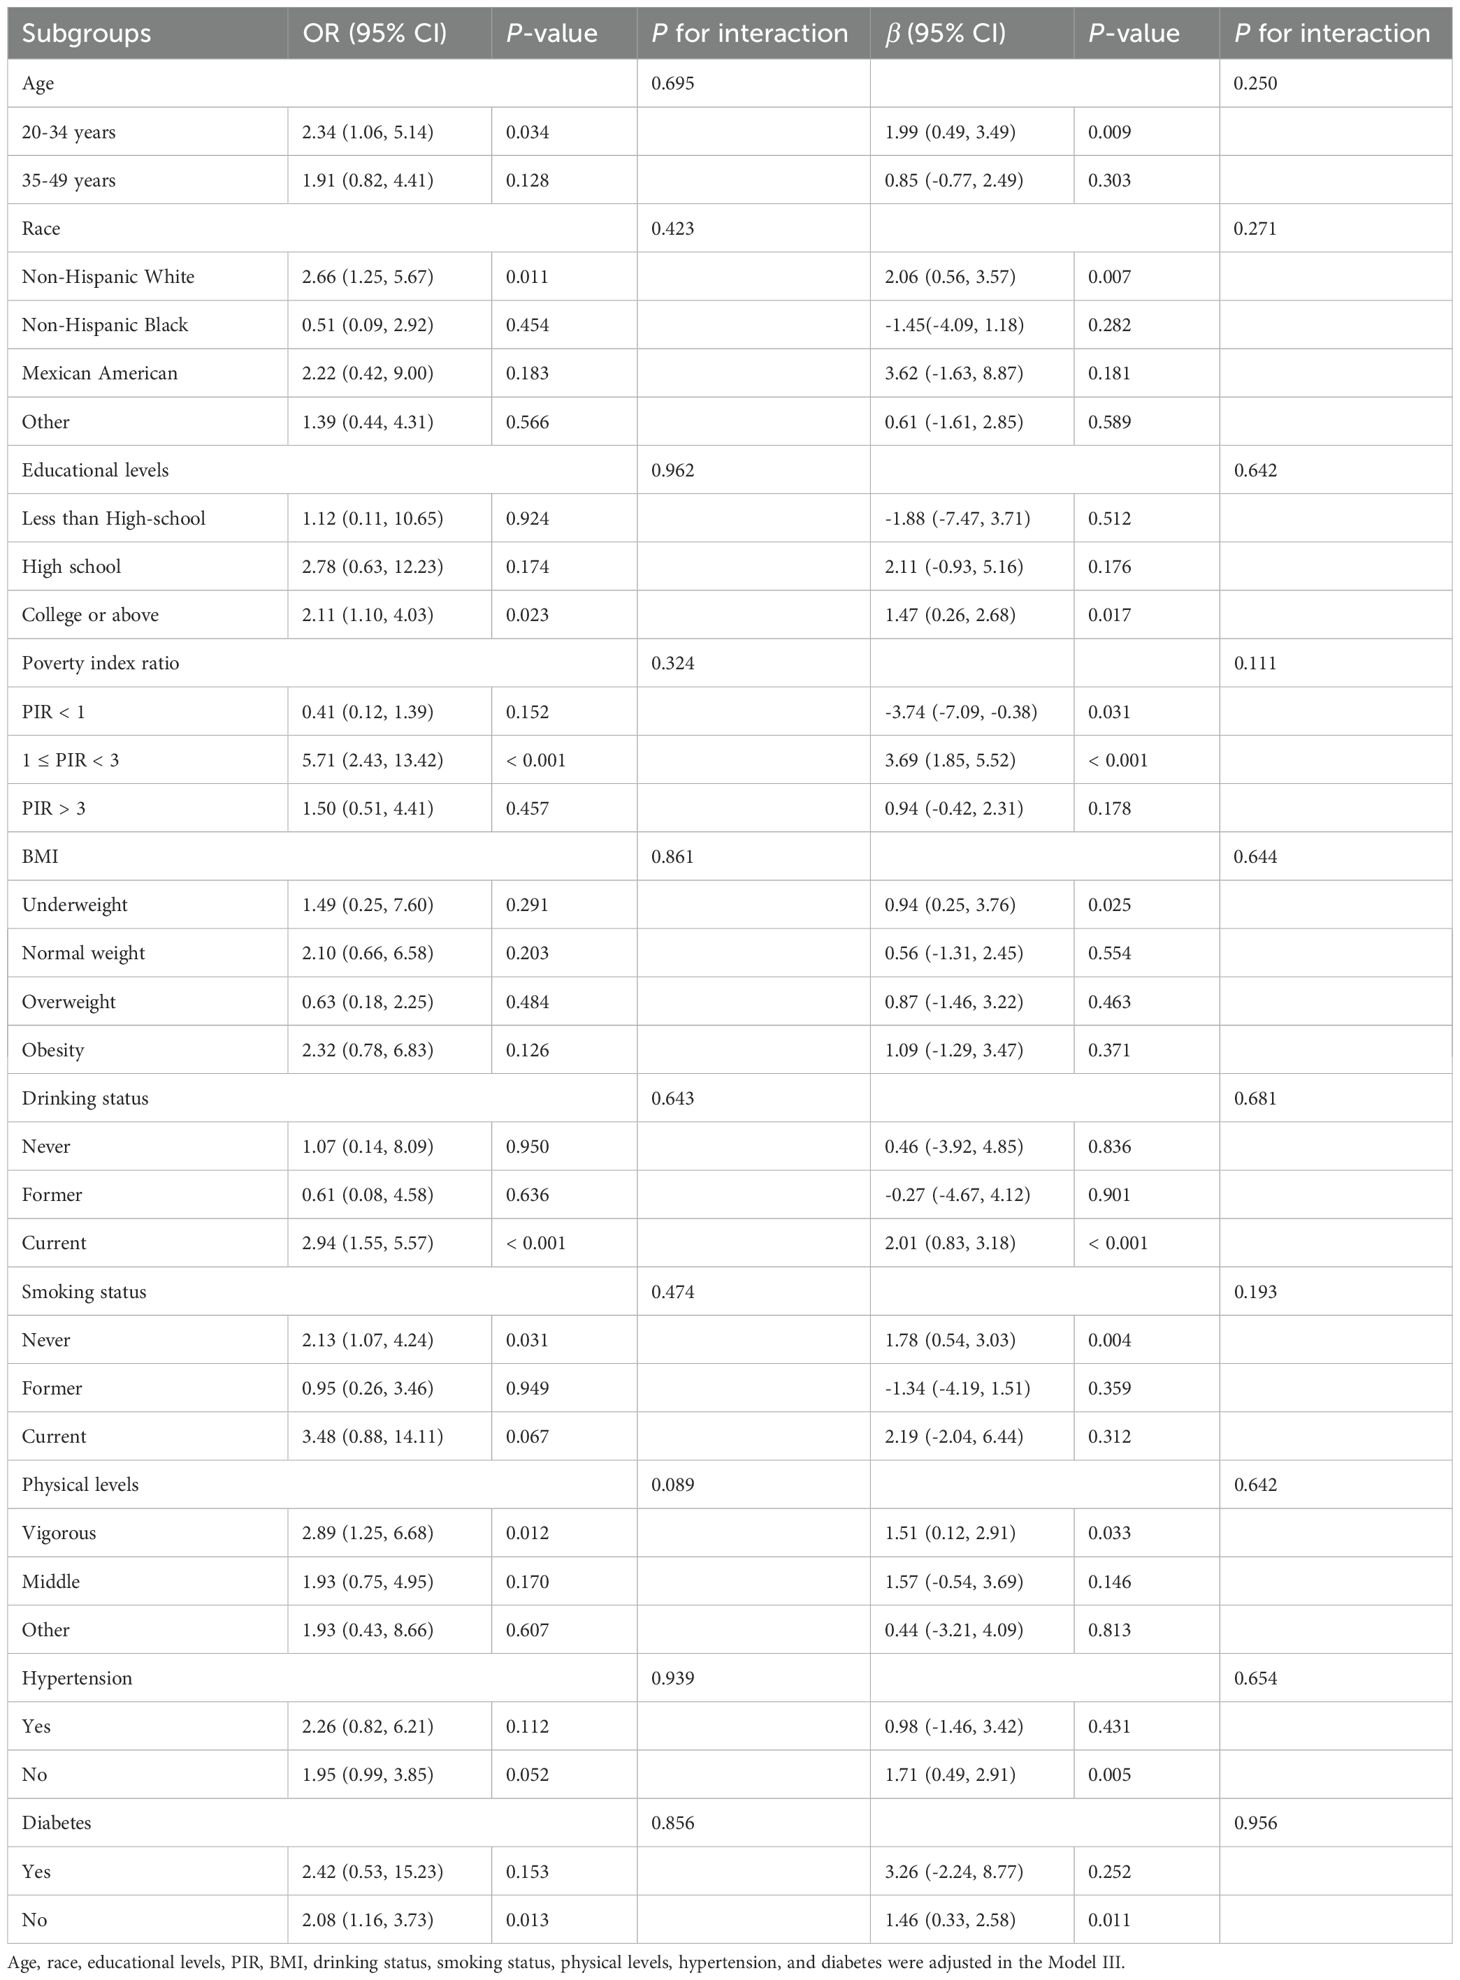
Table 3. The associations between ln transform AGP concentrations, depression, and the PHQ-9 scores in subgroups.
3.4 The prognostic value of AGP concentrations for depression
To evaluate the prognostic capacity of AGP concentrations for clinical depression diagnosis, the ROC curves were employed to assess the prognostic capacity of AGP for depression risk prediction. Since the CRP has been demonstrated it had a great predictive effect on depression (25–27). Therefore, in our study, the CRP was used to be an inflammatory biomarker reference. The analytical results demonstrated that AGP concentrations exhibited superior prognostic accuracy for depression compared to CRP, as a conventional risk predictor (AUC: 0.701 vs 0.578, P < 0.001) (Figure 5).
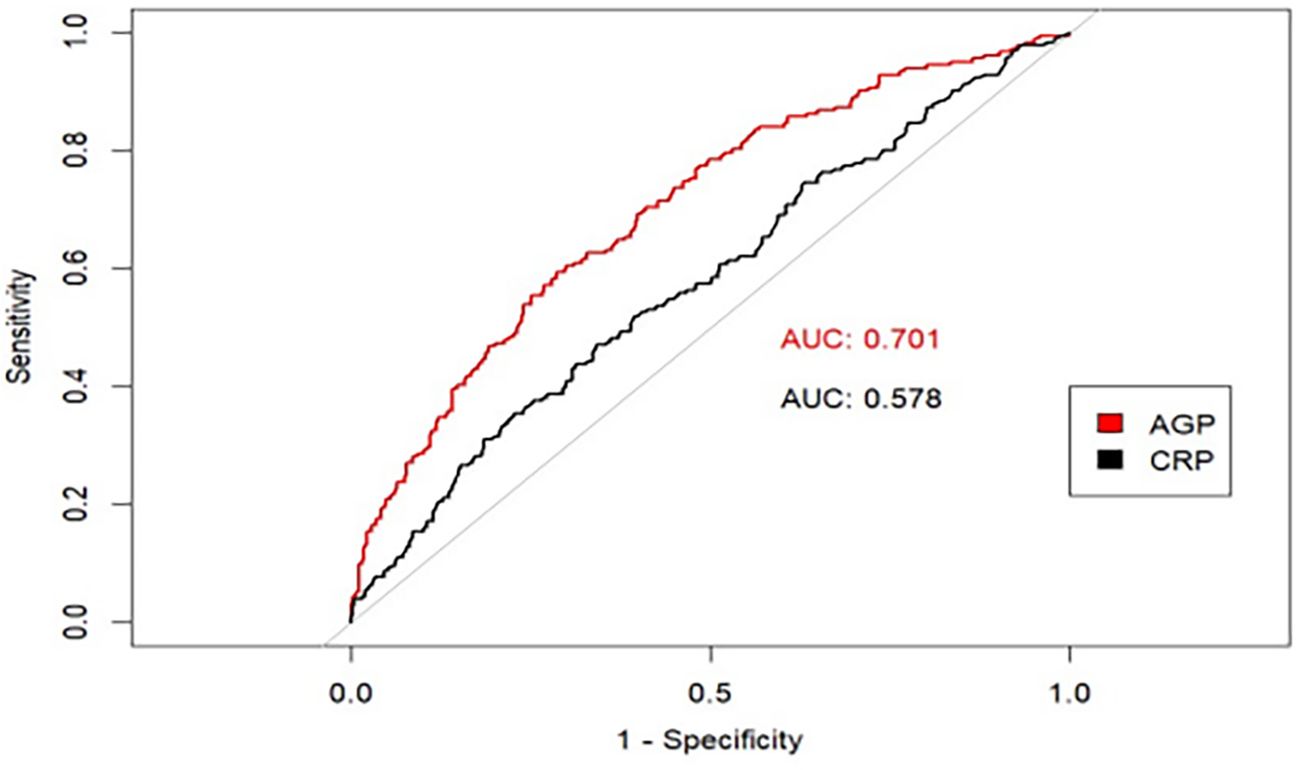
Figure 5. The predictive effect of AGP using ROC curves.
4 Discussion
Some epidemiology and animal studies have shown that there is a close link between inflammation and depression, the levels of proinflammatory cytokines such as interleukin-1b (IL-1b), interleukin-2 (IL-2), interleukin-6 (IL-6), tumor necrosis factor-alpha (TNF-a) and anti-inflammatory cells such as interleukin-4 (IL-4), interleukin-10 (IL-10) are higher in patients with depression (12–16). Inflammatory mediators can affect monoamine transmitters and cause changes in glutamate neurotransmission, glucocorticoid receptor resistance, etc. These molecular mediators constitute key pathophysiological substrates in depression etiology. Furthermore, pro-inflammatory cytokines can disrupt neural circuitry signaling, contributing to neurocognitive dysfunction and core depressive symptomatology, including persistent anhedonia and depressed mood (28–31). In addition, some evidence has supported that some pro-inflammatory factors, such as IL-1, IL-6, and TNF-α, could increase the synthesis of acute phase reactant AGP (32). Most present studies mainly focused on exploring the relationship of IL-1b, IL-2, IL-6, and TNF-a, with depression. However, the relationship of AGP concentrations with depression risk is controversial at present.
This cross-sectional study utilized 2021-2023 NHANES data to examine associations between AGP concentrations and depression. Multivariable-adjusted analyses, including logistic regression (categorical depression outcome), linear regression (continuous PHQ-9 scores), and restricted cubic splines (nonlinear relationships), consistently demonstrated significant positive linear associations. These associations remained robust across key demographic and clinical strata: age groups, racial categories, educational attainment, PIR tertiles, substance use status (tobacco/alcohol), physical activity levels, and diabetes status (all interaction P-values > 0.05).
Although the precise pathophysiological mechanism of the association between AGP concentrations and depression has not been elucidated, the underlying mechanism cannot be explained without the inflammatory and neuroprogressive (IN-PRO) hypothesis of depression. In this hypothesis, cell-mediated immune activation and inflammatory pathways and their consequences or accompanying symptoms are implicated as the cause of the neuro-progressive process, which in turn can lead directly to the development of depression (33). AGP gene expression is controlled by a combination of major regulatory mediators IL-1, IL-6, and TNF-α. IL-1, IL-6, and TNF-α, on the other hand, lead to neural progression and depression through their pathways (33). For example, IL-1 induces depression by decreasing the mRNA and protein levels of BDNF and NGF, and decreasing the expression of the neurotrophin TrK receptor in the hippocampus, affecting the survival of neurons (34). IL-6 leads to neural progression by promoting astrocyte apoptosis and contributes to the occurrence of depression (35). TNF-αleads to neural progression through a variety of pathways such as caspase-dependent cascades, enhanced glutamate neurotoxicity, or stimulation of glutamate release from microglia by upregulating glutaminase and blocking glutamate transporter activity, as well as silencing cell survival signals, which further leads to the occurrence of depression (36).
Our results are consistent with the results of BahriniL.et al. (37), which studied the association of AGP concentrations with depression in the Middle Eastern and North African populations. However, our results were different from the results of K. Schmid. et al. (18), which revealed that the relationship between them was not statistically significant, the reason may be that K. Schmid’s research was published earlier and the technology and methods of AGP detection at that time were not advanced, which induced detected AGP concentrations might not represent the real AGP concentrations in the general population. In addition to this, from a methodological perspective, the reason for the difference between our research and K. Schmid’s research may be that the sample size of K. Schmid’s research was too small and the statistical power was insufficient to detect the difference.
Some studies have demonstrated that inflammatory factors such as IL-6 and TNF-α may be difficult to evaluate in chronic inflammatory states owing to their rapid pharmacokinetic characteristics, but AGP demonstrates measurable concentrations across diverse physiological and pathological conditions owing to its distinct intermediate pharmacokinetic profile. Thus, AGP was considered an essential inflammatory marker in acute inflammatory states, and it may be more sensitive in the examination of inflammation levels. Our study showed that in terms of predictive performance, the area under the ROC curve of AGP for depression was 0.70, which was much larger than the area under the ROC curve of other inflammatory markers such as CRP (0.58) and HDL-related inflammation indexes (0.65) (38). This proves that AGP has good predictive performance and clinical applicability and application prospects for depression. In addition, some studies have shown that some patients’ depressive symptoms were also relieved during the treatment with anti-inflammatory factors (39, 40). The results of our study provide some insights into the anti-inflammatory treatment of depression by reducing AGP concentrations and other inflammatory markers. Therefore, in the following studies, we can try to explore whether drugs that reduce AGP concentrations can be used to relieve depressive symptoms.
This study possesses several methodological advantages (1): enhanced population representativeness: utilizing a substantially larger, nationally representative sample compared to prior studies (weighted n = 6.31 million), our findings demonstrate superior generalizability and statistical power (2); standardized biomarker assessment: AGP concentrations are quantified using standardized immunoturbidimetric assays performed in CDC-certified laboratories, ensuring analytical precision superior to conventional methodologies (3). robust confounding control: Multivariable adjustment for demographic, behavioral, and clinical covariates (including age, race/ethnicity, socioeconomic status, cardiometabolic factors, and lifestyle variables) was implemented, with sensitivity analyses confirming result stability.
Our study also had certain limitations. Firstly, since AGP data was presented only in females, the participants included in this study were only females, and there might be a gender bias. Secondly, the cross-sectional study design used in this study had its limitations in that causality could not be determined. It limited the possibility of establishing a causal relationship between AGP concentrations and depression risk. Specifically, through the current study, we cannot determine whether higher AGP concentrations lead to the development of depression or vice versa. Thirdly, the study included unadjusted confounders such as diet, chronic medical conditions, and psychosocial factors, which may have introduced bias and affected the stability of these results in this study. Fourthly, this study relied on NHANES data and lacked an assessment of biological variability in AGP, including individual differences and diurnal fluctuations, which may reduce the generalisability of the conclusions. In addition, longitudinal follow-up of AGP was lacking in this study to determine whether changes in AGP concentrations were associated with depression progression. Consequently, well-designed longitudinal cohort studies incorporating repeated biomarker measurements, complemented by Mendelian randomization analyses leveraging genetic instrumental variables, are warranted to establish causal inference regarding this association. In addition, some animal studies are needed to explore the potential biological mechanisms in this process.
5 Conclusion
In summary, this study demonstrates a significant dose-dependent relationship between AGP concentrations and depression in adult women based on the NHANES database. In the future, more longitudinal and animal studies deserve to further explore potential biological mechanisms between them.
Data availability statement
The original contributions presented in the study are included in the article/supplementary material. Further inquiries can be directed to the corresponding author.
Ethics statement
The studies involving humans were approved by Ethical approval (Protocol #2021-05) for the survey was obtained from the ethics committee of the National Center for Health Statistics, and the participants were provided with written informed consent. The studies were conducted in accordance with the local legislation and institutional requirements. The participants provided their written informed consent to participate in this study.
Author contributions
WZ: Data curation, Formal Analysis, Methodology, Software, Validation, Writing – original draft, Writing – review & editing. HZ: Data curation, Methodology, Software, Writing – original draft, Writing – review & editing. ZL: Data curation, Formal Analysis, Methodology, Software, Supervision, Writing – original draft, Writing – review & editing. CM: Data curation, Investigation, Software, Writing – original draft, Writing – review & editing. XH: Conceptualization, Formal Analysis, Funding acquisition, Methodology, Project administration, Resources, Supervision, Validation, Writing – original draft, Writing – review & editing. NG: Data curation, Formal Analysis, Funding acquisition, Methodology, Project administration, Resources, Supervision, Validation, Writing – original draft, Writing – review & editing.
Funding
The author(s) declare that financial support was received for the research and/or publication of this article. This study was supported by the PUMCH Clinical Research Program: PUMCH Clinical Specialty Nursing Quality Improvement Program (2022-PUMCH-B-130).
Acknowledgments
We are grateful to all the NHANES participants and the NHANES researchers for making this data publicly available.
Conflict of interest
The authors declare that the research was conducted in the absence of any commercial or financial relationships that could be construed as a potential conflict of interest.
Generative AI statement
The author(s) declare that no Generative AI was used in the creation of this manuscript.
Publisher’s note
All claims expressed in this article are solely those of the authors and do not necessarily represent those of their affiliated organizations, or those of the publisher, the editors and the reviewers. Any product that may be evaluated in this article, or claim that may be made by its manufacturer, is not guaranteed or endorsed by the publisher.
Supplementary material
The Supplementary Material for this article can be found online at: https://www.frontiersin.org/articles/10.3389/fpsyt.2025.1555321/full#supplementary-material
References
1. Evans-Lacko S, Aguilar-Gaxiola S, Al-Hamzawi A, Alonso J, Benjet C, Bruffaerts R, et al. Socio-economic variations in the mental health treatment gap for people with anxiety, mood, and substance use disorders: results from the WHO World Mental Health (WMH) surveys. Psychol Med. (2018) 48:1560–71. doi: 10.1017/s0033291717003336
2. Ferrari AJ, Santomauro DF, Herrera AMM, Shadid J, Ashbaugh C, Erskine HE, et al. Global regional and national burden of 12 mental disorders in 204 countries and territories, 1990-2019: a systematic analysis for the Global Burden of Disease Study 2019. Lancet Psychiatry. (2022) 9(2):137–50. doi: 10.1016/s2215-0366(21)00395-3
3. Vos T, Lim SS, Abbafati C, Abbas KM, Abbasi M, Abbasifard M, et al. Global burden of 369 diseases and injuries in 204 countries and territories, 1990-2019: a systematic analysis for the Global Burden of Disease Study 2019. Lancet. (2020) 396:1204–22. doi: 10.1016/s0140-6736(20)30925-9
4. World Health Organization. Depression E. coli (2023). Available online at: https://www.who.int/zh/news-room/fact-sheets/detail/depression (Accessed November 30, 2024).
5. Institute of Health Metrics and Evaluation. Global health dataexchange(GHDx). E. coli (2023). Available online at: http://ghdx.healthdata.org/gbd-results-tool?params=gbd-api-2019-permalink/d780dffbe8a381b25e1416884959e88b (Accessed November 30, 2024).
7. Milaneschi Y, Kappelmann N, Ye Z, Lamers F, Moser S, Jones PB, et al. Association of inflammation with depression and anxiety: evidence for symptom-specificity and potential causality from UK Biobank and NESDA cohorts. Mol Psychiatry. (2021) 26:7393–402. doi: 10.1038/s41380-021-01188-w
8. Zunszain PA, Hepgul N, and Pariante CM. Inflammation and depression. Curr Top Behav Neurosci. (2013) 14:135–51. doi: 10.1007/7854_2012_211
9. Sierra T, González MC, Moreno B, Crevillen AG, and Escarpa A. Total α(1)-acid glycoprotein determination in serum samples using disposable screen-printed electrodes and osmium (VI) as electrochemical tag. Talanta. (2018) 180:206–10. doi: 10.1016/j.talanta.2017.12.018
10. Yoo J, Yoon T, Park YB, Ahn SS, and Lee SW. The Clinical Utility of Serum Alpha-1-Acid Glycoprotein in Reflecting the Cross-Sectional Activity of Antineutrophil Cytoplasmic Antibody-Associated Vasculitis: A Single-Centre Retrospective Study. Medicina (Kaunas). (2024) 60(8):1212. doi: 10.3390/medicina60081212
11. Fournier T, Bouach N, Delafosse C, Crestani B, and Aubier M. Inducible expression and regulation of the alpha 1-acid glycoprotein gene by alveolar macrophages: prostaglandin E2 and cyclic AMP act as new positive stimuli. J Immunol. (1999) 163:2883–90. doi: 10.4049/jimmunol.163.5.2883
12. Mazza MG, De Lorenzo R, Conte C, Poletti S, Vai B, Bollettini I, et al. Anxiety and depression in COVID-19 survivors: Role of inflammatory and clinical predictors. Brain Behav Immun. (2020) 89:594–600. doi: 10.1016/j.bbi.2020.07.037
13. Köhler CA, Freitas TH, Maes M, De Andrade NQ, Liu CS, Fernandes BS, et al. Peripheral cytokine and chemokine alterations in depression: a meta-analysis of 82 studies. Acta Psychiatr Scand. (2017) 135:373–87. doi: 10.1111/acps.12698
14. Nusslock R, Brody GH, Armstrong CC, Carroll AL, Sweet LH, Yu T, et al. Higher peripheral inflammatory signaling associated with lower resting-state functional brain connectivity in emotion regulation and central executive networks. Biol Psychiatry. (2019) 86:153–62. doi: 10.1016/j.biopsych.2019.03.968
15. Duivis HE, Vogelzangs N, Kupper N, De Jonge P, and Penninx BW. Differential association of somatic and cognitive symptoms of depression and anxiety with inflammation: findings from the Netherlands Study of Depression and Anxiety (NESDA). Psychoneuroendocrinology. (2013) 38:1573–85. doi: 10.1016/j.psyneuen.2013.01.002
16. Peters AT, Ren X, Bessette KL, George N, Kling LR, Thies B, et al. Inflammation, depressive symptoms, and emotion perception in adolescence. J Affect Disord. (2021) 295:717–23. doi: 10.1016/j.jad.2021.08.126
17. Healy D, Calvin J, Whitehouse AM, White W, Wilton-Cox H, Theodorou AE, et al. Alpha-1-acid glycoprotein in major depressive and eating disorders. J Affect Disord. (1991) 22:13–20. doi: 10.1016/0165-0327(91)90078-7
18. Putnam FW. The plasma proteins: structure, function and genetic control. New York: Academic Press (1975) p. 184–228.
19. Osuna E, Baumgartner J, Wunderlin O, Emery S, Albermann M, Baumgartner N, et al. Omega-3 Study Team. Iron status in Swiss adolescents with paediatric major depressive disorder and healthy controls: a matched case-control study. Eur J Nutr. (2024) 63:951–63. doi: 10.1007/s00394-023-03313-7
20. Zarate-Ortiz AG, Verhoef H, Melse-Boonstra A, Woods BJ, Lee-Bazaldúa EE, Feskens EJ, et al. Depressive symptoms among Mexican adolescent girls in relation to iron status, anaemia, body weight and pubertal status: results from a latent class analysis. Public Health Nutr. (2023) 26:408–15. doi: 10.1017/S1368980022001203
21. Ji Y and Wang J. Association between blood cadmium and depression varies by age and smoking status in US adult women: a cross-sectional study from NHANES 2005-2016. Environ Health Prev Med. (2024) 29:32. doi: 10.1265/ehpm.24-00050
22. Hu PW, Zhang XL, Yan XT, Qi C, and Jiang GJ. Association between depression and endometriosis using data from NHANES 2005-2006. Sci Rep. (2023) 13:18708. doi: 10.1038/s41598-023-46005-2
23. Muñoz-Navarro R, Cano-Vindel A, Medrano LA, Schmitz F, Ruiz-Rodríguez P, Abellán-Maeso C, et al. Utility of the PHQ-9 to identify major depressive disorder in adult patients in Spanish primary care centres. BMC Psychiatry. (2017) 17:291. doi: 10.1186/s12888-017-1450-8
24. Xue Y, Xu J, Li M, and Gao Y. Potential screening indicators for early diagnosis of NAFLD/MAFLD and liver fibrosis: Triglyceride glucose index-related parameters. Front Endocrinol (Lausanne). (2022) 13:951689. doi: 10.3389/fendo.2022.951689
25. Tavares VDO, Schuch FB, de Sousa GM, Hallgren M, Teychenne M, de Almeida RN, et al. Does multimodal exercise reduce C-reactive protein levels in major depressive disorder? Preliminary results from a randomized controlled trial. J Psychiatr Res. (2025) 183:252–9. doi: 10.1016/j.jpsychires.2025.02.023
26. Zhang T, Ji C, Zhu J, Wang X, Shen C, Liang F, et al. Comparison of clinical features and inflammatory factors between patients with bipolar depression and unipolar depression. BMC Psychiatry. (2025) 25:108. doi: 10.1186/s12888-025-06516-w
27. Stephenson AR, Ka-Yi Chat I, Bisgay AT, Coe CL, Abramson LY, and Alloy LB. Higher inflammatory proteins predict future depressive symptom severity among adolescents with lower emotional clarity. Brain Behav Immun. (2024) 122:388–98. doi: 10.1016/j.bbi.2024.08.035
28. Zaki NFW, Spence DW, Bahammam AS, Pandi-Perumal SR, Cardinali DP, and Brown GM. Chronobiological theories of mood disorder. Eur Arch Psychiatry Clin Neurosci. (2018) 268:107–18. doi: 10.1007/s00406-017-0835-5
29. Moorman AJ, Mozaffarian D, Wilkinson CW, Lawler RL, Mcdonald GB, Crane BA, et al. In patients with heart failure elevated soluble TNF-receptor 1 is associated with higher risk of depression. J Card Fail. (2007) 13:738–43. doi: 10.1016/j.cardfail.2007.06.301
30. Suarez EC, Krishnan RR, and Lewis JG. The relation of severity of depressive symptoms to monocyte-associated proinflammatory cytokines and chemokines in apparently healthy men. Psychosom Med. (2003) 65:362–8. doi: 10.1097/01.psy.0000035719.79068.2b
31. Walker AK, Kavelaars A, Heijnen CJ, and Dantzer R. Neuroinflammation and comorbidity of pain and depression. Pharmacol Rev. (2014) 66:80–101. doi: 10.1124/pr.113.008144
32. Vasileiadou K, Pantazidis G, Papadopoulou K, Ligoudistianou C, Kourelis A, Petrakis S, et al. alpha1-Acid glycoprotein production in rat dorsal air pouch in response to inflammatory stimuli, dexamethasone and honey bee venom. Exp Mol Pathol. (2010) 89(1):63–71. doi: 10.1016/j.yexmp.2010.03.008
33. Leonard B and Maes M. Mechanistic explanations how cell-mediated immune activation, inflammation and oxidative and nitrosative stress pathways and their sequels and concomitants play a role in the pathophysiology of unipolar depression. Neurosci Biobehav Rev. (2012) 36:764–85. doi: 10.1016/j.neubiorev.2011.12.005
34. Xiao H, Cao Y, Lizano P, Li M, Sun H, Zhou X, et al. Interleukin-1β moderates the relationships between middle frontal-mACC/insular connectivity and depressive symptoms in bipolar II depression. Brain Behav Immun. (2024) 120:44–53. doi: 10.1016/j.bbi.2024.05.029
35. Shen SY, Liang LF, Shi TL, Shen ZQ, Yin SY, Zhang JR, et al. Microglia-derived interleukin-6 triggers astrocyte apoptosis in the hippocampus and mediates depression-like behavior. Adv Sci (Weinh). (2025) 12:e2412556. doi: 10.1002/advs.202412556
36. Perry BI, Upthegrove R, Kappelmann N, Jones PB, Burgess S, and Khandaker GM. Associations of immunological proteins/traits with schizophrenia, major depression and bipolar disorder: A bi-directional two-sample mendelian randomization study. Brain Behav Immun. (2021) 97:176–85. doi: 10.1016/j.bbi.2021.07.009
37. Bahrini L, Ouanes S, and Ghachem R. Inflammatory profile in depression and associated clinical and sociodemographic features in a Middle-Eastern North-African population. J Affect Disord. (2016) 198:122–6. doi: 10.1016/j.jad.2016.03.036
38. Jingxuan M, Yuzhen P, Zhen L, Juan W, Hongjian W, and Yajia L. Monitoring of mental health in occupational populations: a study on the role and application of HDL-related inflammatory index. Front Public Health. (2025) 13:1563742. doi: 10.3389/fpubh.2025.1563742
39. Köhler CA, Freitas TH, Stubbs B, Maes M, Solmi M, Veronese N, et al. Peripheral alterations in cytokine and chemokine levels after antidepressant drug treatment for major depressive disorder: systematic review and meta-analysis. Mol Neurobiol. (2018) 55:4195–206. doi: 10.1007/s12035-017-0632-1
Keywords: NHANES, Alpha-1-acid glycoprotein, inflammatory biomarker, depression, cross-sectional study, women
Citation: Zhao W, Zhang H, Li Z, Ma C, Huo X and Guo N (2025) Association between the Alpha-1-acid glycoprotein concentrations and depression in US adult women: a cross-sectional study from NHANES 2021–2023. Front. Psychiatry 16:1555321. doi: 10.3389/fpsyt.2025.1555321
Received: 04 January 2025; Accepted: 06 May 2025;
Published: 03 June 2025.
Edited by:
Zuleide Maria Ignácio, Federal University of the Southern Frontier, BrazilReviewed by:
Shinsuke Hidese, Teikyo University, JapanShu Yanping, The Second People Hospital of Guizou Province, China
Copyright © 2025 Zhao, Zhang, Li, Ma, Huo and Guo. This is an open-access article distributed under the terms of the Creative Commons Attribution License (CC BY). The use, distribution or reproduction in other forums is permitted, provided the original author(s) and the copyright owner(s) are credited and that the original publication in this journal is cited, in accordance with accepted academic practice. No use, distribution or reproduction is permitted which does not comply with these terms.
*Correspondence: Na Guo, cHVtY2gxNDc4NTJAMTYzLmNvbQ==; Xiaopeng Huo, aHVveHAwMDFAMTI2LmNvbQ==
†These authors contributed equally to this work and share last authorship