 Andrea Perrottelli1†
 Francesco Flavio Marzocchi1†
 Giorgio Di Lorenzo2,3*
 Chiara D’Amelio4
 Noemi Sansone1
 Luigi Giuliani1
 Pasquale Pezzella1
 Edoardo Caporusso1
 Antonio Melillo1
 Giulia Maria Giordano1
 Paola Bucci1
 Armida Mucci1*
 Silvana Galderisi1
- 1Department of Psychiatry, University of Campania “Luigi Vanvitelli”, Naples, Italy
- 2Laboratory of Psychophysiology and Cognitive Neuroscience, Department of Systems Medicine, Tor Vergata University of Rome, Rome, Italy
- 3IRCCS Fondazione Santa Lucia, Rome, Italy
- 4Department of Biotechnological and Applied Clinical Sciences, University of L’Aquila, L’Aquila, Italy
Introduction: Event-related potentials (ERPs), recorded through electroencephalography (EEG) during sensory and cognitive tasks, have been consistently employed to investigate electrophysiological correlates of psychiatric disorders. However, traditional peak component analysis of ERPs is limited by the a priori selection of time windows and electrodes. Microstate analysis, a data-driven approach based on identifying periods of quasi-stable scalp topographies, has been applied to ERP data, offering a valuable tool for understanding the temporal dynamics of large-scale neural networks. This review aims to provide a comprehensive summary of studies examining event-related microstates in individuals with psychiatric disorders.
Methods: A systematic review of English-language articles indexed in PubMed, Scopus, and Web of Science (WoS) was conducted on May 1, 2024. Studies were included only if they applied microstate analysis to ERP data and analyzed data from at least one group of patients with psychiatric disorders in comparison to healthy controls.
Results: Of the 1,115 records screened, 17 studies were included in the final qualitative synthesis. The majority of these studies (n=8) included patients with schizophrenia, using various tasks focusing mainly on visuospatial processing (n=6) and face processing (n=6). Regarding the microstate methodology, the primary clustering approach employed was the k-means clustering algorithm (n=8), while the cross-validation criterion (n=10) was the most commonly used measure of fit. Sixteen of the 17 studies reported at least one significant difference in microstate features between patients and healthy controls, mainly in the temporal and topographic characteristics of microstates and the sequence of their occurrence.
Conclusions: This review highlights the value of event-related potential microstates analysis in identifying spatiotemporal alterations in brain dynamics associated with psychiatric disorders. However, the limited number of studies and the heterogeneity of experimental paradigms constrain the generalizability of the findings.
Systematic review registration: https://www.crd.york.ac.uk/PROSPERO, identifier CRD42024529185.
1 Introduction
Psychiatric disorders are multifactorial conditions characterized by diverse and complex neurobiological alterations (1–5). According to the World Health Organization (6), approximately 1 in every 8 people worldwide experiences a psychiatric disorder, resulting in a significant burden for affected individuals, their careers, and the healthcare systems (6–18). Since their discovery nearly a century ago, event-related potentials (ERPs), measured through electroencephalography (EEG), have been extensively employed to investigate neurobiological alterations associated with psychiatric disorders (19–25). ERPs are positive or negative deflections in brain activity triggered by sensory stimuli or cognitive and motor tasks, recorded within specific time windows after the event of interest (26–28). Most studies analyze the features of the ERPs waveforms, focusing on the maximal voltage amplitude and timing of their peaks. Studies have consistently reported alterations in the amplitude and latency of ERP in individuals with psychiatric disorders. For example, P50, P100, and N100, which are ERP that occur between 50 and 120 milliseconds after stimulus presentation in visual and auditory tasks and reflect early sensory processing, exhibit reduced amplitude in patients with schizophrenia (29–32). Alterations in P300, an EEG index related to attention allocation, working memory, and decision-making, have been observed in individuals with depressive disorders (33), schizophrenia (34), alcohol use disorder (AUD) (35–37), and adults with attention-deficit/hyperactivity disorder (ADHD) (38, 39).
Despite its utility, peak component analysis of ERPs, which generally focuses on the amplitude and latency of their peaks, has several limitations (40). First, the analysis is often restricted to predefined time windows, which significantly limits the amount of information that can be extracted from the recordings. Second, the analysis typically focuses on data from a single electrode or a limited set of electrodes, which reduces its capacity to capture large-scale brain dynamics. Third, the selection of reference electrodes can substantially influence the results, potentially obscuring subtle electrophysiological variations and masking the spatiotemporal complexity of brain electrical activity dynamics (41–43).
An alternative approach to address these limitations is to use EEG microstate (MS) analysis. Microstates are brief periods (generally ranging between 40 and 120 milliseconds) of quasi-stable topographical configurations of scalp potential fields (44–47). This method examines the distribution of electric fields across multiple electrodes to characterize the global electrophysiological state (48). The microstates are considered to reflect the global neuronal activity associated with the activation of distinct brain networks (48). Initially, microstates were identified by analyzing temporal sequences of scalp potential maps recorded during resting-state EEG (44). During rest, a limited number of topographic configurations dominate the temporal series, and studies have identified four to seven canonical MS classes (A, B, C, D, E, F, G) that explain most of the variance in EEG data across healthy subjects and different clinical populations (49–51). For example, MS A is characterized by a right frontal-to-left posterior configuration and it has been related to auditory processing and arousal; conversely, MS B is characterized by a left frontal-to-right posterior configuration and it is related to visual-spatial attention (48). Alterations in resting-state MS features, such as their mean duration, coverage and occurrence (measuring the dominance of the MS), contribution (the relative amount of variance in the EEG signal that is explained by a particular MS class), and topography, are consistently observed in patients with psychiatric disorders (45, 52). For example, resting-state EEG studies showed that patients with depressive disorders exhibit reduced duration and occurrence of MS D (53), which is characterized by a fronto-central configuration, and it has been associated with working memory, while patients with schizophrenia show topographic changes and reduced duration of MS D (50). MS D alterations have also been linked to the severity of positive symptoms in schizophrenia (50), while the relative contribution of microstate A correlates with the severity of negative symptoms (54). Additional findings have also been reported in other conditions. For instance, individuals with autism spectrum disorder (ASD) show reduced duration and coverage of microstate C alongside increased duration and coverage of microstate B (55–57). In ADHD, an increased duration of microstate D has been noted (58, 59).
Studies that have applied MS analysis also to task-based paradigms showed that MS analysis can offer several advantages over traditional peak component analysis of ERPs. In fact, it is a reference-free method that captures rapid (event-related microstates can be even shorter than 40 milliseconds), large-scale brain network dynamics without relying on predefined time windows, making it well-suited to detect subtle neuronal activity changes. Furthermore, MS analysis allows not only the extraction of quantitative parameters, as in peak component analysis of ERPs, to describe the intensity (e.g., mean global field power or area under the curve) and temporal features (e.g., duration, frequency of occurrence, coverage) of microstates, but also the assessment of qualitative features. These include the presence or absence of a specific microstate, its topographical shape, and the order of map appearance, which can provide further details of potential neurophysiological relevance (45, 60). Consequently, over the last two decades, MS analysis has emerged as a valuable tool for analyzing ERPs data, integrating both spatial and temporal features of brain activity (61–64). Furthermore, combining MS analysis with EEG source localization allows researchers to map electrical activity in three dimensions within the cerebral cortex (56, 65–67).
While previous systematic reviews and meta-analyses have focused on resting-state microstate alterations in psychiatric disorders (45, 68–70), the study of alterations of event-related microstates in these pathological conditions remains limited. One recent systematic review investigated MS features in ERPs in patients with psychiatric disorders, but it included only studies using face-processing tasks (71).
One challenge in retrieving and summarizing these studies is that, unlike resting-state microstates, the number, the topography and the temporal characteristics of event-related microstates depend heavily on the specific task performed during EEG recording. This variability complicates the development of a unified nomenclature, as exists for canonical resting-state maps.
Therefore, the present systematic review addresses this gap by examining studies that applied MS analysis to ERPs data in individuals with psychiatric disorders, classifying the results based on the type of task paradigm employed. Specifically, the objectives of this review are to:
1. Describe the demographic and clinical characteristics of the included study samples.
2. Provide an overview of the main EEG preprocessing and MS analysis methodologies.
3. Outline the characteristics of the experimental tasks used to elicit ERPs.
4. Summarize differences in MS features between individuals with psychiatric disorders and healthy controls.
5. Explore the use of source localization data and the associations between MS alterations and clinical features of the included psychiatric disorders.
This systematic review hypothesizes that event-related microstates analysis may capture alterations in the sequences and temporal features of electrophysiological configurations in individuals with psychiatric disorders, offering complementary insights to traditional ERP peak component analysis. We also predict that studies employing similar paradigms may yield comparable topographic microstate maps, enabling cross-study comparisons.
2 Materials and methods
2.1 Design of the review and search strategy
The review protocol was registered on the International Prospective Register of Systematic Reviews (PROSPERO) under registration number CRD42024529185. The review was conducted in accordance with the updated 2020 PRISMA Statement guidelines (72).
A systematic search for relevant articles was performed in three electronic databases—PubMed, Scopus, and Web of Science (WoS)—on 1st May 2024, without any time restrictions. The objective was to identify studies that employed microstate analysis in event-related potential (ERP) paradigms involving subjects with psychiatric disorders.
The following search string was applied to all databases:
((EEG) OR (electroencephalogra*)) AND (microstate) AND ((schizo*) OR (Psycho*) OR (Bipolar*) OR (Depress*) OR (Anxiet*) OR (Obsessive Compulsive Disorder) OR (Trauma) OR (Dissociative Disorder) OR (Somatic Disorder) OR (Substance-Related Disorder) OR (Addictive Disorder) OR (Eating Disorder) OR (Personality Disorder) OR (Conduct Disorder) OR (OCD) OR (ADHD) OR (mental) OR (autis*) OR (neurodevelopmental disorder) OR (psychiatric disorder)).
2.2 Selection process and eligibility criteria
Cohort and case-control studies published in English that included human subjects with at least one group of participants diagnosed with psychiatric disorders (including: Schizophrenia Spectrum and other psychotic disorders; Bipolar Disorder; Depressive Disorders; Anxiety Disorders; Obsessive-Compulsive and Related Disorders; Trauma- and Stressor-Related Disorders; Dissociative Disorders; Somatic Symptom and Related Disorders; Substance-Related and Addictive Disorders; Eating Disorders; Personality Disorders; Disruptive, Impulse-Control, and Conduct Disorders; Autism Spectrum Disorder or Attention-Deficit/Hyperactivity Disorder) and that recorded EEG data during sensory, cognitive, or emotional processing tasks and employed EEG event-related MS analysis comparing data from patients with psychiatric disorders to healthy controls were included in the review.
Publications such as book chapters, comments, editorials, case reports/series, theses, proceedings, letters, short surveys, notes, or studies irrelevant to the aim of the review (e.g., those analyzing either resting-state EEG data or EEG data in populations without psychiatric disorders), or studies for which full text was unavailable or studies focusing exclusively on children aged 9 years or younger were excluded from the review.
Two researchers (F.F.M. and C.D.A.) independently screened all articles based on titles and abstracts to assess eligibility, followed by full-text evaluations. Discrepancies in article selection were resolved through group discussion and consensus. However, given the anticipated high heterogeneity in study paradigms and methodologies, a meta-analysis was not planned.
2.3 Data extraction
The following data were extracted from each eligible article: publication details (authors and year of publication), study population (diagnosis, sample size, gender distribution, and age of participants), methodology (inclusion and exclusion criteria; description of the experimental task protocol; EEG recording system used; ERPs analyzed within the MS framework; time window considered for MS analysis; software used for MS analysis; EEG preprocessing details, such as sampling rate, band-pass settings, clustering algorithm; number of MS clusters identified and global explained variance (73); MS parameters considered), results (MS analysis comparing patients and healthy controls; if available, additional analyses, such as peak component analysis or source localization).
For studies reporting peak component analysis data, Cohen’s d was calculated to estimate effect sizes for peak- and microstate-related results.
2.4 Risk of bias assessment
The risk of bias was evaluated for eligible articles using the Newcastle-Ottawa Scale (NOS) (74), which assesses study quality across three domains: selection (i.e., how well the study selects participants), comparability (i.e., how well the study controls for confounding variables) and outcome (i.e., how effectively the outcomes are measured and reported).
Studies were categorized based on their NOS score (0 to 9) as follows: poor quality/high risk of bias (0–3), fair quality/moderate risk of bias (4–6) and good quality/low risk of bias (7–9).
3 Results
The combined search from three databases yielded a total of 1,115 records. After removing duplicates, 755 articles remained. Two additional articles were identified through manual screening of reference lists, bringing the total to 757 articles. After the abstract screening, 726 articles were excluded for various reasons: they were irrelevant to the topic (e.g., did not use EEG microstates, focused only on resting-state EEG microstates, or lacked subjects with psychiatric disorders), or the full text was unavailable in English (Figure 1). Thirty-one full-text articles were assessed, leading to further exclusions: eight articles due to subject age (<10 years), five due to inadequate experimental paradigms, one for not reporting statistical analysis comparing MS parameters between patient and control groups and one for lacking a control group. Ultimately, 17 articles were included in the qualitative analysis (Figure 1).
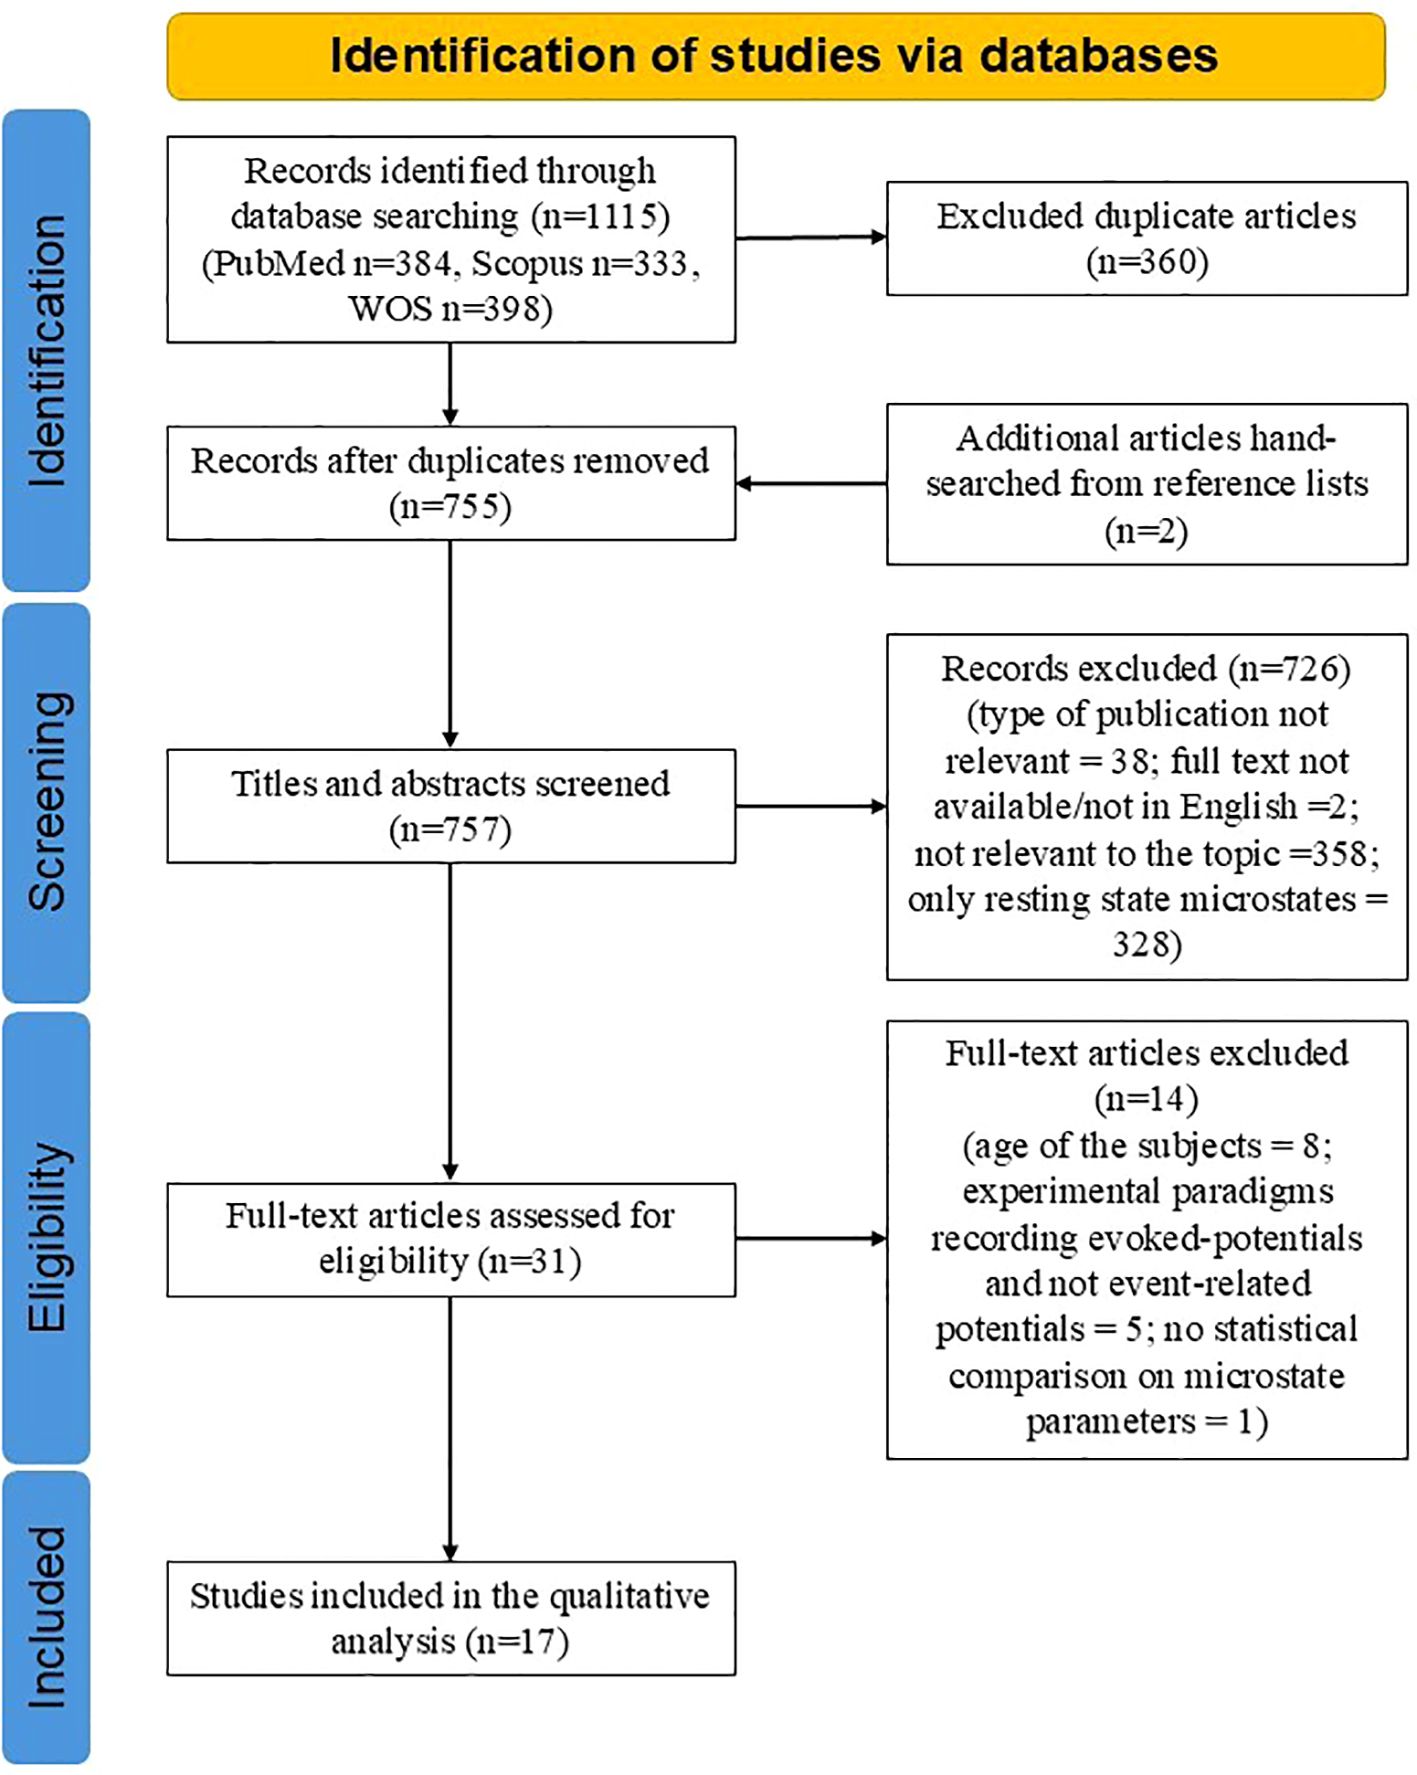
Figure 1. PRISMA flowchart of included studies.
All included studies, except one with a moderate risk of bias (NOS score: 6) (75), had a low risk of bias (NOS scores: 7–9) (Table 1).
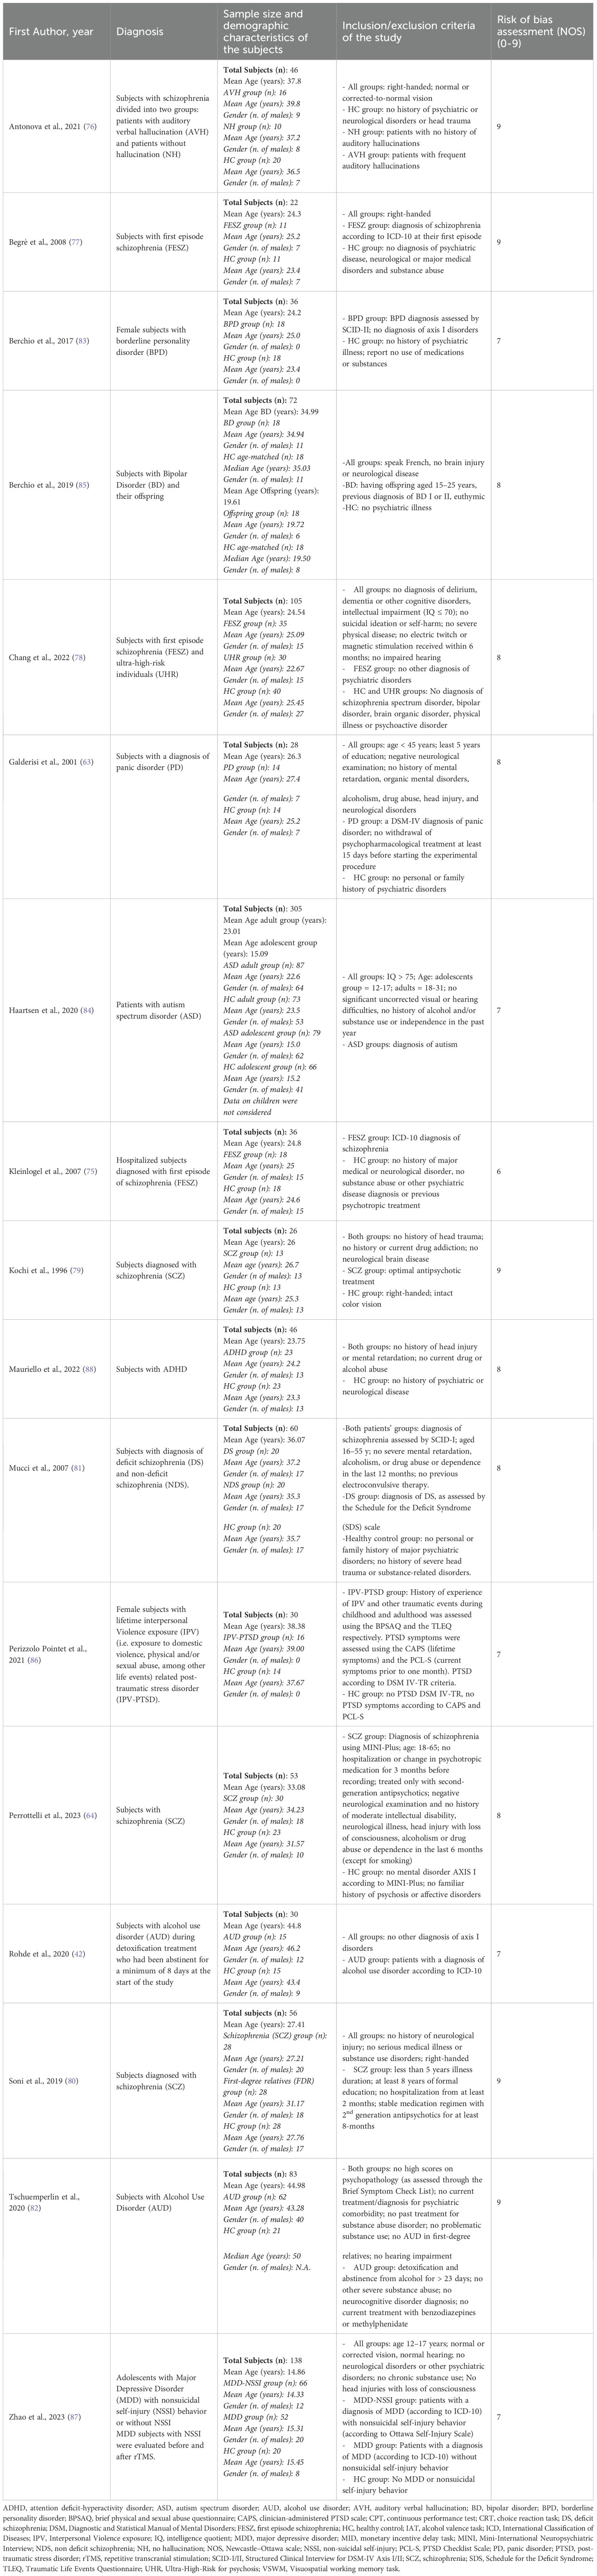
Table 1. Description of the studies included: demographic and clinical characteristics of the samples.
3.1 Clinical and demographic characteristics of the samples and experimental tasks
The studies focused on various psychiatric and neurodevelopmental conditions (Table 1). Nearly half (n=8) involved patients with schizophrenia (64, 75–81), including three studies of first-episode schizophrenia (75, 77, 78), one of which also included individuals at high risk for psychosis (78) and one study which included patients with deficit schizophrenia (81). Two studies focused on alcohol use disorder (AUD) (42, 82). Other conditions investigated included borderline personality disorder (BPD) (83), autism spectrum disorder (ASD) (84), bipolar disorder (BD) (85), panic disorder (PD) (63), post-traumatic stress disorder (PTSD) (86), major depressive disorder (MDD) (87), and attention-deficit/hyperactivity disorder (ADHD) (88).
The average sample size per study was 68.9 (Table 1), ranging from 22 to 305 participants. Two studies involved adolescents aged 10–17 years (84, 87), ten included young adults aged 18–30 years (63, 75, 77–80, 83–85, 88), five included participants aged 31–40 years (64, 76, 81, 85, 86), and two involved participants older than 41 years (42, 82).
The experimental paradigms employed during EEG recordings were highly heterogeneous (see Table 1 for a detailed description of the tasks). Overall, studies focusing on schizophrenia mainly employed paradigms addressing related cognitive domains related to executive functioning, such as attention and vigilance (75–77, 81), and working memory (80), due to the remarkable impairments that can be traced in these domains in subjects experiencing this disorder, both using clinical evaluations and EEG indices associated with these domains (89–92). The majority of studies involving face processing tasks included patients affected either by mood disorders (MDD and BD) (85, 87) or neurodevelopmental disorders, such as autism and ADHD (84, 88), due to the alterations in EEG correlates recorded in these pathologies during different stages of processing of faces and emotions. Finally, tasks using alcohol-related cues (42, 82) were employed for patients affected by AUD to obtain EEG indices of the neural mechanisms underlying cue reactivity in alcohol craving.
3.2 Characteristics of EEG acquisition and microstate analysis
A detailed summary of the EEG preprocessing procedures, MS analysis procedures and MS features considered can be found in Table 2 and Table 3.

Table 2. ERP, analysis, software and preprocessing procedures of the studies.
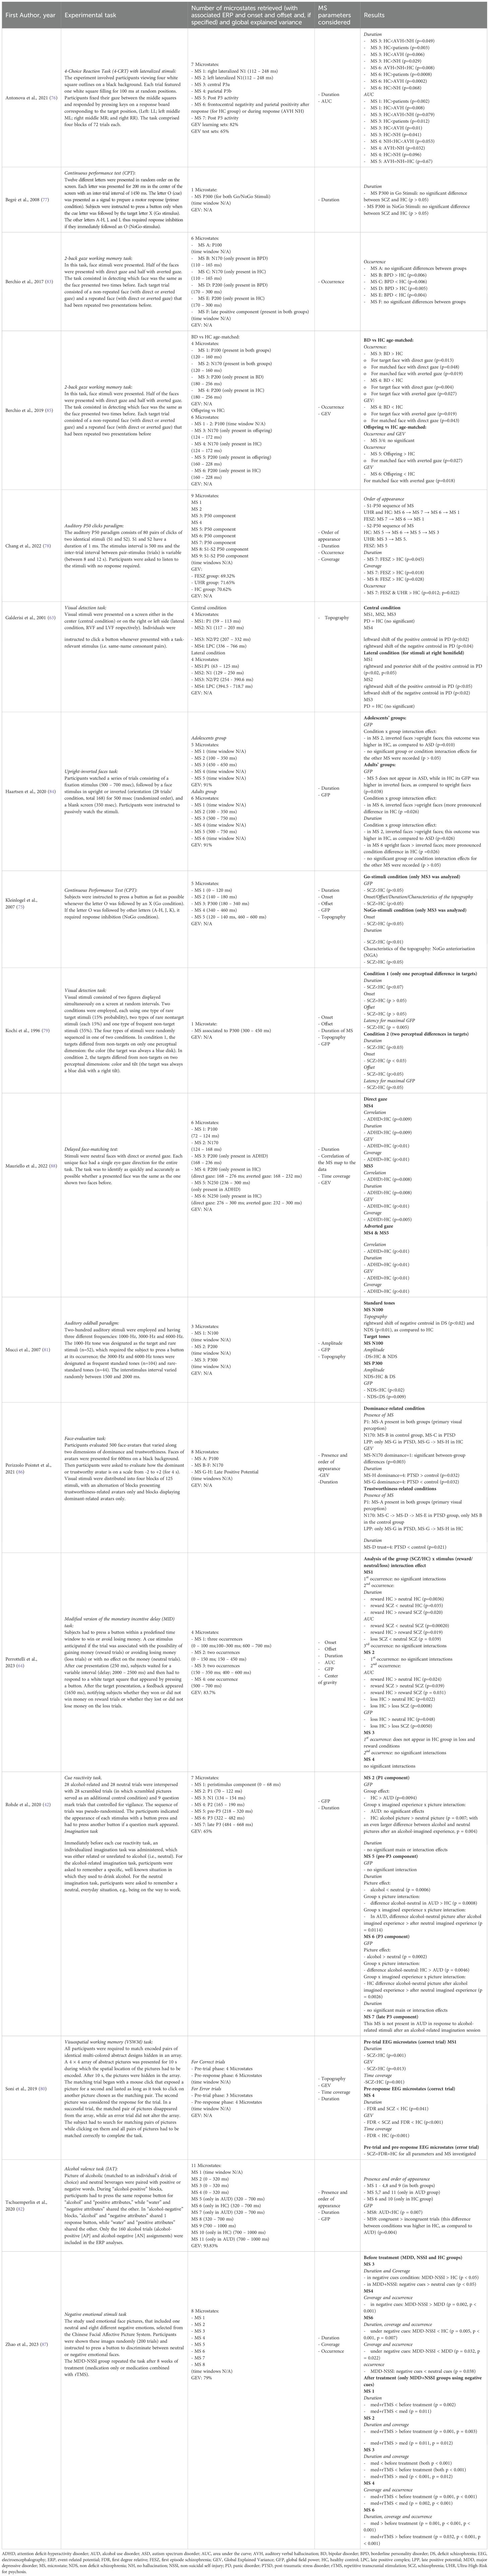
Table 3. Main results of the MS analysis.
The number of electrodes used for EEG signal acquisition varied across studies, ranging from 13 to 256 channels (Table 2).
Different software tools were used for MS analysis: RAGU (6 studies) (42, 64, 76, 82–84), Cartool (4 studies) (80, 85, 86, 88), Brain Vision Analyzer (2 studies) (75, 77), Microstate EEGlab toolbox (2 studies) (78, 87). Three studies did not specify the software used (63, 79, 81).
Clustering algorithms for MS analysis also varied: Atomize and Agglomerate Hierarchical Clustering (AAHC) (2 studies) (76, 84), K-means (8 studies) (64, 80, 82, 83, 85–88), modified K-means (2 studies) (42, 78), topographic clustering (1 study) (77). Four studies did not specify their clustering algorithm (63, 75, 79, 81).
To determine the optimal number of MS prototypes, studies employed various measures of fit: cross-validation criterion (10 studies) (42, 64, 76–78, 80, 82–84, 87), global explained variance (4 studies) (42, 78, 86, 87), meta-criterion (2 studies) (85, 88), Krzanowski–Lai criterion (1 study) (86), stability and discrimination criterion (1 study) (63). Three studies did not specify the measure of fit used (75, 79, 81).
Parameters extracted from MS varied, with most of the studies considering multiple features (e.g., global field power (GFP), mean duration, GEV, and occurrence) (Table 3). More specifically, the MS parameters employed were:
● Amplitude: The magnitude of the EEG signal during a microstate, reflecting the intensity of underlying neural activity.
● Area under the curve (AUC): for a set of time-points assigned to a particular microstate class, the AUC is simply defined as the sum of the global field power (GFP) values of those time-points;
● Center of gravity: is an index that provides information regarding both the magnitude and temporal characteristics of the MS, since it evaluates the distribution of GFP values across the time points assigned to that microstate;
● Correlation of the MS map to the data: the spatial correlation coefficient quantifying the similarity between a microstate template map and the EEG scalp potential distribution at each time point assigned to that specific MS;
● Coverage: the percentage of total recording time that a particular microstate class occupies;
● Duration: the average microstate duration in the sample for a specific MS;
● Global explained variance (GEV): the proportion of the EEG signal’s global variance explained by a microstate class;
● Global field power (GFP): a measure of the spatial standard deviation of the EEG potential field across electrodes at a given time point, reflecting the overall strength of the scalp electric field;
● Occurrence: the average number of times per second a specific microstate appears;
● Onset/Offset: the time point marking the beginning (onset) or end (offset) of a continuous segment assigned to a specific microstate class;
● Order of appearance: the sequential position in which microstate classes emerge during the recording, describing the temporal arrangement or pattern of transitions between microstates;
● Presence of the microstate: it indicates if a specific microstate class was back-fitted to the data of a subject or group;
● Topography: the spatial distribution of electric potentials over the scalp at a given time point or averaged over time, characterizing the stable, class-defining map of a microstate.
Finally, twelve of the included studies explicitly matched some of the topographic maps of the MS to the ERP of interest (42, 63, 75–79, 81, 83, 85, 86, 88) (Table 3).
3.3 Results of the microstate analysis
The following sections report the statistical results comparing study groups (patients vs. healthy controls) of the included studies. The results follow the experimental paradigms used to record ERP data and perform MS analysis. Detailed results are presented in Table 3. Due to the variety of tasks employed and the clustering methodology for MS analysis, the characteristics and polarity of the identified microstates were heterogeneous (Figure 2). Furthermore, the nomenclatures of the microstates reported in the following sections, tables, and Figure 2 were taken directly from the original articles. As a result, microstates with the same name or classification (e.g., MS 1 or MS A) do not necessarily share topographic configuration or characteristics across studies. Additionally, two studies (83, 86) labelled microstates alphabetically; however, this alphabetical classification does not align with the canonical microstates commonly identified in resting-state studies.

Figure 2. Topography of the microstate maps determined in the included studies. ADHD, attention deficit-hyperactivity disorder; BD, bipolar disorder; BPD, borderline personality disorder; DS, deficit schizophrenia; HC, healthy control; LPC, late positive complex; LPP, late positive potential; MS, microstate; NDS, non deficit schizophrenia. Note: For higher resolution, please refer to the web-based version of this figure.
3.3.1 Auditory processing
Chang et al. (78) studied auditory sensory gating in first-episode schizophrenia (FESZ), individuals at ultra-high risk for psychosis (UHR), and healthy controls (HCs) using an auditory P50 clicks paradigm. Seven microstates were identified without defining specific time windows, and group comparisons focused on their order, duration, occurrence, and coverage. The microstate sequence differed between groups for both auditory clicks (S1 and S2) (Table 3). Furthermore, while the first six microstates showed no significant group differences, MS 7 (P50-related appearing after S1) had greater duration and coverage in FESZ compared to HCs, and its occurrence was higher in both FESZ and UHR groups compared to HCs. Furthermore, MS 8, the microstate related to the difference between S1 and S2 clicks, showed a significantly higher coverage in the FESZ compared to the UHR and HCs groups. Mucci et al. (81) studied attention during an auditory oddball paradigm in patients affected by deficit schizophrenia (DS) and non-deficit schizophrenia (NDS). Two microstates were the main focus of the analyses, one related to N100 and one to P300. The authors did not specify the time windows of each MS identified. The analysis focused on the microstate mean amplitude measured at each lead, the GFP, and the topography of maps. Particularly, the N100-related MS recorded both during standard and target stimuli showed a significant reduction in amplitude and a rightward shift of negative centroid in subjects with DS, compared to NDS and HC groups. Conversely, for the P300-related MS, only patients affected by NDS displayed a reduction in GFP compared to DS subjects and healthy controls (81).
3.3.2 Visuospatial processing
Six studies investigated visuospatial processing, examining its sensory and cognitive electrophysiological correlates. Specifically, two studies focused on sensory processing with a visual detection task (63, 79), three examined attention and vigilance (75–77), and one assessed working memory (80).
A visual detection task was employed in two studies. Kochi et al. (79) investigated MS characteristics related to the P300, identified in a time window from 300 to 450 ms from the stimulus, using a visual detection task with two conditions: (1) targets differing by one perceptual feature and (2) targets differing by two perceptual features. In individuals with schizophrenia, MS latency at the point of maximum global field power (GFP) was significantly longer, and MS duration was significantly shorter, as compared to healthy controls (HCs) in both conditions. Galderisi et al. (63) identified four microstates and analyzed their topography under two conditions based on target location. For centrally presented targets, MS 4, associated with the late positive complex (LPC) and identified in a time window between 336 and 766 ms following the onset of stimuli, showed a leftward shift of the positive centroid and a rightward shift of the negative centroid in patients with panic disorder (PD), as compared to HCs. For laterally presented targets, MS 1 (associated with P100; time window: 63–125 ms following the onset of stimuli) showed a rightward and posterior shift of the positive centroid in patients. Additionally, MS 2 (related to N100; time window: 129–250 ms following the onset of stimuli) displayed a rightward shift of the positive centroid and a leftward shift of the negative centroid in patients relative to HCs.
Three studies focused on attention and vigilance using visual stimuli. Antonova et al. (76) identified seven microstates in a 4-choice reaction task (4-CRT) with lateralized stimuli, without identifying specific time windows for each MS. Differences were observed in the duration and area under the curve (76) of microstates of patients with schizophrenia. MS 3 (related to P3a) had a longer duration in patients than HCs, while MS 6 (related to task responses) was significantly shorter. The AUC of MS 1 (related to N100) was smaller in patients, while MS 3 had a higher AUC in patients than HCs. Begré et al. (77) and Kleinlogel et al. (75) both studied MS characteristics during a continuous performance task (CPT) in schizophrenia. Begré et al. found no significant group differences in MS 3 (related to P300) duration, while Kleinlogel et al. reported shorter and delayed MS 3 (in this study as well, associated with the P300) durations following NoGo stimuli in patients, as compared to HCs. Additionally, GFP during Go stimuli was lower in patients, and NoGo anteriorization (NGA) was increased in patients relative to HCs (75). Furthermore, both studies reported the means and standard deviations for each group for peak component-based and microstate-based analyses of temporal features (latency and duration), enabling us to calculate effect sizes using Cohen’s d (Table 4). However, the calculation of this effect size index showed that the analysis of microstate features had lower effect size values in both studies (75, 77).

Table 4. Main results of source analysis and comparisons with peak component analysis.
Finally, Soni et al. (80) analyzed microstates during a visuo-spatial working memory (VSWM) task in schizophrenia and their healthy first-degree relatives (FDR). Correct trials exhibited four pre-trial and six pre-response microstates, while error trials exhibited three pre-trial and four pre-response microstates. In this study, the authors did not identify specific time windows for each MS. Group differences were primarily observed in correct trials, where MS 1 (pre-trial phase) had significantly lower GEV, time coverage, and time frames in patients compared to HCs. During the pre-response phase, MS 4 showed higher GEV in patients, compared to the FDR group, but a lower number of time frames in patients compared to HCs.
3.3.3 Face processing
Six studies investigated face processing. Berchio et al. (2017), Berchio et al. (2019), and Mauriello et al. studied working memory tasks related to face processing in patients with BPD, BD, and ADHD, respectively (83, 85, 88). Haartsen et al. explored passive face processing in individuals with autism spectrum disorder (ASD) (84). Perrizzolo-Pointet et al. and Zhao et al. examined microstates during facial emotional recognition tasks in women with post-traumatic stress disorder (PTSD) (86) and adolescents with major depressive disorder (MDD) (87), respectively. Despite the use of different face-processing tasks, most studies examined the same ERPs, namely P100, N170, and P200. Furthermore, three studies highlighted differences in the topographic configuration of the P200 microstate in the two study groups (patients and healthy controls).
Berchio et al. (2017) (83) and Berchio et al. (85) used a 2-back gaze working memory task. In this task, participants were presented with face stimuli (direct or averted gaze) and were required to identify the “matched face”, which was identical to the “target face” shown in two trials earlier. In Berchio et al. (2017), six microstates were identified (N.B.: the classification of MS A-F of this study does not correspond to the canonical resting-state microstate classification), including MS B and MS C (N170-related; time window: 110–165 ms following the onset of stimuli) and MS D and MS E (P200- related; time window: 170–300 following the onset of stimuli). Patients with BPD showed a higher occurrence of MS B (N170-related) and MS D (P200-related), but a lower occurrence of MS C (N170-related) and MS E (P200-related), as compared to HCs, regardless of the face stimulus type. In the second study by the same research group (85), four microstates were identified in patients with BD. Significant group differences were found for MS 3 and MS 4 (P200-related; time window: 120–160 ms following the onset of stimuli). Patients demonstrated a higher occurrence of MS 3 and a lower occurrence and GEV of MS 4 compared to HCs. These differences were particularly pronounced for target faces with an averted gaze and matched faces with a direct gaze. In Mauriello et al. (2022) (88), seven microstates were identified during a delayed face-matching test. Group differences were observed for MS 4 (P200-related; time windows: 168–276 ms following the onset of direct gaze stimuli and 168–232 ms following the onset of adverted gaze stimuli) and MS 5 (N250-related). For direct gaze stimuli, ADHD patients exhibited lower correlation and duration for MS 4 but higher correlation and coverage for MS 5, as compared to HCs, with no significant differences in GEV. No significant group differences were observed for each of the microstates for averted gaze stimuli.
One study focused on passive face processing, focusing on adolescents and adults with ASD using an upright-inverted face task (data on children were not considered in the current review (84).
In the adolescents’ group, MS 2 showed higher global field power (GFP) for inverted faces compared to upright faces, but this difference was smaller in ASD than in HCs.
In the adults’ group, MS 2 lasted longer for inverted faces than upright faces, with this difference being greater in HCs than ASD. Furthermore, in the inverted faces condition, MS 5 did not occur in individuals with ASD, whereas HCs showed higher GFP for inverted faces. MS 6 exhibited higher GFP and longer duration for upright faces in HCs than ASD.
Finally, two studies focused on EEG correlates of recognition of emotions. In Perizzolo-Pointet et al. (2022) (86), eight microstates were identified (N.B.: the classification MS A-H of this study does not correspond to the canonical resting-state microstates) in a face-evaluation task where participants rated avatars on dominance and trustworthiness. During the N170 time window, for trustworthy faces, PTSD patients exhibited a sequence of three microstates (MS C → MS D → MS E), while only MS B occurred in HCs. Additionally, higher GEV for MS B was recorded in response to non-dominant faces, while MS D lasted less for trustworthy faces in PTSD patients. During the LPP time window, HCs exhibited a sequence of MS G and MS H for both dominant and trustworthy faces, whereas only MS G was detected in PTSD patients. PTSD patients also showed a longer MS H duration compared to HCs.
In Zhao et al. (2022) (87), eight microstates were identified during a negative emotional stimuli task in adolescents with MDD and non-suicidal self-injury (MDD-NSSI). For negative cues, MDD-NSSI patients had greater coverage and longer duration of MS 3, as compared to HCs. Conversely, MS 6 showed reduced duration, coverage, and occurrence in MDD-NSSI patients. The study also investigated the effects of repeated transcranial magnetic stimulation (rTMS) and medication, which appeared to improve some microstate alterations in MDD patients (see Table 3 for details).
3.3.4 Reward- and saliency-related processing
Three studies investigated MS characteristics in reward and saliency tasks.
Perrottelli et al. (64) examined reward processing in schizophrenia using a modified monetary incentive delay (MID) task and applied MS analysis to the anticipation stage (related to the ERP elicited after the presentation of cues) of the paradigm. MS 1 (three occurrences; 1st time window: 0–100 ms; 2nd time window: 100–300 ms; 3rd time window: 600–700 ms) showed shorter duration, earlier offset, and smaller AUC and GFP in patients than HCs for reward cues during its second occurrence. MS 3 (two occurrences; 1st time window: 150–350 ms; 2nd time window: 400–600 ms) had lower AUC and GFP in patients compared to HCs in the loss condition during its second occurrence.
Rohde et al. (42) studied alcohol cue reactivity in alcohol use disorder (AUD). MS 2 (P100-related; time window: 70–120 ms following the onset of stimuli) exhibited lower GFP in patients than HCs. MS 5 (pre-P300; time window: 218–320 ms following the onset of stimuli) had a shorter duration for alcohol pictures, as compared to neutral ones, with greater differences in patients. MS 6 (late-P300; time window: 322–482 ms following the onset of stimuli) showed lower GFP for alcohol-related pictures in patients, as compared to HCs.
Tschuemperlin et al. (82) analyzed microstates in implicit association tasks. Six microstates (MS 1–4, 8, and 9) were present in both groups, while MS 5, 7, and 11 appeared only in AUD patients, and MS 6 and 10 only in HCs. The GFP of MS 8 was lower in patients, and MS 9 had greater GFP for congruent trials, with stronger effects in HCs than in AUD patients.
3.4 Results of source analysis
EEG source localization aims to identify brain sources underlying electrophysiological data (93). The main findings from studies that utilized source analysis based on microstate analysis are summarized in Table 4. Nine studies employed source analysis, six of which used the Low-Resolution Electromagnetic Tomography (LORETA) method (64, 75, 78, 80, 82, 88), while three used the Local Autoregressive Average (LAURA) analysis method (83, 85, 86).
3.4.1 Auditory processing
In Chang et al. (78), the middle temporal gyrus and middle frontal gyrus were identified as the two neuronal regions associated with P50 microstate activity. However, the study did not explore between-group differences in these regions (schizophrenia vs. HCs).
In Mucci et al. (81), the posterior cingulate and parahippocampal gyrus showed decreased cerebral activity in patients affected by DS during the N100-related MS time window. Subjects with NDS showed decreased cerebral activity in left temporal, right superior frontal, bilateral posterior cingulate, inferior parietal, and supplementary motor areas compared to healthy controls and decreased cerebral activity in bilateral cingulate, left superior, and left middle frontal areas compared to DS subjects during the P300-related MS time window.
3.4.2 Visuospatial processing
In Kleinlogel et al. (75), during the P300-related microstate (MS), Go-stimuli activated the same neuronal regions in patients and HCs. However, NoGo-stimuli elicited activation of more anterior regions (prefrontal areas) in patients compared to HCs.
In Soni et al. (80), a reduction in activity within the right extra-nuclear region, medial frontal gyrus, orbital gyrus, rectal gyrus, and superior temporal gyrus was observed in individuals with schizophrenia, as compared to HCs during the MS 1 time window preceding correct trials.
3.4.3 Face processing
In Berchio et al. (2017) (83), increased activation of the left superior frontal gyrus, right inferior frontal gyrus, and bilateral anterior cingulate cortex was observed during the N170 time window (MS B and C), while reduced activation of the right superior frontal gyrus and middle temporal gyrus occurred during the P200 time window (MS D and E) in individuals with BPD compared to HCs.
In Berchio et al. (2019) (85), significant differences were identified during the P200-related microstate time windows (MS 3 and 4). Individuals with BD showed hypoactivation in the left superior frontal gyrus and supplementary motor area for direct gaze faces. For averted gaze faces, reduced activity was observed in the left somatosensory cortex, bilateral medial cingulate cortex, and left caudate nucleus compared to HCs.
In Mauriello et al. (88), hypoactivation in the left cerebellum and vermis during MS 3 and 4 (P200-related) and in the left posterior cingulum, bilateral lingula, bilateral cerebellum, and vermis during MS 5 and 6 (N250-related) was detected in response to direct gaze stimuli in subjects with ADHD, as compared to HCs.
In Perizzolo-Pointet et al. (86), patients with PTSD exhibited hyperactivation in limbic regions and the right superior frontal gyrus, along with hypoactivation in the superior temporal gyrus during MS B-F (N170-related) for non-dominant avatars. Hyperactivity in the fusiform gyrus was observed during MS G-H (LPP-related). For trustworthy avatars, PTSD patients showed hypoactivation in the anterior prefrontal cortex, supramarginal gyrus, and premotor cortex during MS B-F (N170-related) and in the left angular gyrus during MS G-H (LPP-related), as compared to HCs.
3.4.4 Reward- and Saliency-Related Processing
In Perrottelli et al. (64), hypoactivation of the cingulate cortex and orbitofrontal cortex, the insula, and parietal cortex was observed during the MS 1 (reward condition) and MS 2 (loss condition) time windows in patients with schizophrenia, as compared to HCs.
In Tschuemperlin et al. (82), during the MS 9 time window (alcohol-negative stimuli), patients with AUD exhibited significant hyperactivation in the superior frontal gyrus and hypoactivation in the bilateral inferior parietal gyrus, left precuneus, insula, and middle frontal gyrus compared to HCs.
3.5 Correlation between microstates and clinical and cognitive characteristics
Six studies examined correlations between features of microstates and clinical or cognitive variables:
Galderisi et al. (63) recorded a significant correlation between Corsi’s Block Tapping Task (CBTT) performance and the left-right coordinate of the LPC microstate positive centroid in the central condition. Poorer performance, indicative of right temporal-hippocampal dysfunction, was associated with a leftward shift of the positive centroid. For the lateral condition, more pronounced topographic abnormalities correlated with a higher frequency of panic attacks.
In Perrottelli et al. (64), during anticipation of rewards, topographic ERP scores for MS 1 and MS 2 correlated with the anticipation of pleasure but not with the severity of negative symptoms.
In Berchio et al. (83), no significant correlation was found between childhood trauma scores and the time frames of MS B, C, D, and E in individuals with BPD.
In Berchio et al. (BD group) (85), significant positive correlations were observed between state-trait anxiety scores, emotional abuse history, and higher GEV values of P200-related microstates.
Haartsen et al. (84) found no correlation between an EEG index representing deviations in microstate features and clinical symptoms such as social responsiveness or ASD symptom severity.
In Mauriello et al. (88), anxiety severity correlated positively with the GEV of MS 6 for direct gaze stimuli. Additionally, the mean duration of MS 4 was negatively correlated with inattention/impulsivity scores.
4 Discussion
Microstate analysis identifies and quantifies a limited set of predominant classes of electrophysiological scalp fields that represent key global functional brain states during EEG recordings. Over the past decades, research has increasingly highlighted the potential of microstate analysis in uncovering neurophysiological alterations associated with mental health conditions. While most studies utilizing this approach have focused on resting-state data, there has been a steady rise in studies examining task-related microstates.
This review aims to demonstrate the efficacy of microstates as a tool for analyzing task-related neuronal responses, providing alternative EEG markers for sensory and cognitive processing stages, and highlighting several spatiotemporal alterations in neuronal dynamics across various psychiatric disorders. The studies included in this synthesis address a diverse range of psychiatric disorders, with schizophrenia being the most extensively studied condition. In addition, two studies investigated alcohol use disorder using alcohol-related stimuli to assess craving-related effects (42, 82), while the remaining studies explored other psychiatric disorders.
Compared to peak component analysis, microstates offer several advantages, including the use of qualitative and quantitative parameters related to microstates, the independence from reference-related variability, and broader temporal exploration, capturing rapid and transient neuronal activity (48, 94). For instance, in a study on language production, microstate analysis revealed differences in temporal features of electrophysiological responses based on when the words were acquired (95). These differences were not detected in any parameter of the peak component analysis in the same dataset (95). However, a critical evaluation of the methodologies and results from the studies discussed in the following sections highlights several limitations and challenges that should be addressed to refine future studies. These include methodological variability, the omission of certain key outcomes from microstate analysis in the results sections of some studies, and the need for standardized protocols to enhance reproducibility and comparability across studies.
4.1 Methodological heterogeneity in ERP microstate analysis: challenges and future directions
The review revealed substantial heterogeneity across studies regarding EEG preprocessing, microstate mapping procedures, and analysis criteria.
Regarding EEG Preprocessing, high-pass filter settings ranged from 0.1 to 1 Hz, with 1 Hz being the most commonly used. Low-pass filter settings varied from 20 to 100 Hz, with 30 Hz being the most frequently used. Most studies (n = 9) (42, 64, 75–78, 80, 82, 87) used Independent Component Analysis (ICA) to remove artifacts such as eye blinks and movements, ensuring these were not misclassified as microstates.
The methodology for describing temporal changes in spatial brain activity through microstates has evolved significantly. Early studies (1990s–2000s) relied on global map descriptors and Global Map Dissimilarity (GMD) scores to characterize momentary topographies (45, 96). Advances in free-access software have enabled more sophisticated, data-driven approaches (97–99). Most studies (n = 12) (42, 64, 76, 78, 80, 82–88) employed AAHC or k-means clustering algorithms to compute microstates. Previous evidence suggests that both methods yield comparable results (100). Earlier studies often relied on arbitrary criteria (63, 75, 77, 79), while more recent research has used cross-validation (n = 10) (42, 64, 76–78, 80, 82–84, 87) or combined meta-criteria (n = 2) (85, 88) to determine the optimal number of microstates. Studies recommend using reliable data-driven methods to enhance robustness and minimize subjectivity (46).
Temporal smoothing influences microstate analysis results. Of the sixteen studies, only seven (42, 64, 76, 78, 82, 84, 88) systematically reported these parameters, emphasizing the need for consistent reporting practices. However, maps at the moment of phase inversion exhibit low amplitude and high noise, leading to frequent segment changes and, thus, to shorter global durations of the microstates if no smoothing parameters are introduced (46).
Task paradigms varied widely among studies, with only a few employing similar designs. Even within studies using comparable tasks, stimulus type or differences in task design can affect the elicitation of ERPs (101, 102).
A study by Khanna and colleagues showed that microstate features extracted from the same participants were highly consistent across clustering methods and acquisition using a variable number of electrodes (103). Nevertheless, the heterogeneity in several aspects of EEG data preprocessing and methodological approaches to microstate analysis underscores the need for guidelines to enhance cross-study comparability and reduce unnecessary variability. Therefore, establishing clear protocols for EEG preprocessing, microstate mapping, temporal smoothing, and parameter selection would improve the reliability, reproducibility, and generalizability of findings in this field. By addressing these challenges, future research can better leverage the potential of microstate analysis to advance our understanding of task-related brain dynamics in health and disease.
4.2 ERP-microstates findings related to task-based paradigms in psychiatric disorders
Despite the variability in the reported features and paradigms employed, the studies included in this review can be grouped into subcategories depending on the main sensory processes or cognitive domains investigated. All studies except one (77) reported significant differences in microstate features between individuals with psychiatric disorders and healthy controls.
4.2.1 Auditory processing
A single study (78) examined auditory processing during a passive listening task, demonstrating electrophysiological alterations both in baseline responses (S1 tones) and in adaptation to repeated auditory stimuli (difference between S1 and S2 tones). Specifically, the microstate MS7, associated with the P50 response after the first auditory click, showed significant differences in duration, occurrence, and coverage in FESZ and UHR groups, as compared to HCs. MS8 coverage, when neuronal responses to S1 and S2 were contrasted, also significantly differed between patients and controls. Furthermore, the sequence of microstates in response to both S1 and S2 stimuli changed remarkably between the three study groups, suggesting that sensory gating defect in the early stages of schizophrenia might be due to a combination of dysfunctions in sensory processing of stimuli at baseline and reduced ability to adapt to redundant auditory stimuli (104, 105). Source localization analysis indicated that the activated brain regions were primarily concentrated in the right temporal lobe. Moreover, the authors argued that microstate features such as duration, occurrence, and coverage enhanced the precision of statistical models for discriminating at-risk individuals and early-stage schizophrenia patients from healthy controls, as compared to peak component analysis of ERPs.
Conversely, Mucci et al. (81) examined electrophysiological alterations during an active auditory oddball task. Microstate analysis showed that alterations in the characteristics of early-N100-related microstates could only be traced in the subjects with deficit schizophrenia, a specific subtype of this disorder characterized by enduring and idiopathic negative symptoms. Conversely, dysfunctions in the P300-related microstates could only be detected in subjects with nondeficit schizophrenia. The results support the hypothesis that patients with nondeficit schizophrenia who have preserved early sensory and attentional processes have abnormalities of the late stages of information processing, suggesting that different clinical presentations are mirrored by distinct electrophysiological alterations (81). Interestingly, although it is a study related to auditory processing, similar topographic maps and alterations in features of microstates related to N100 or P300 in schizophrenia could be traced in other studies that used paradigms related to attention in the visuospatial modality (63, 75, 76).
4.2.2 Visuospatial processing
Six studies (63, 75–77, 79, 80) examined microstates related to visuospatial processing.
Two studies (63, 79) utilized target detection tasks to explore alterations in the spatial configuration of brain activity in panic disorder and schizophrenia.
In the study by Galderisi et al. on target detection (63), group differences were observed between subjects with panic disorder and healthy controls in both early (sensory information extraction) and later (cognitive and task-related processing) stages of visual processing. These findings suggest reduced activation of neuronal networks localized in the left hemisphere during early sensory processing and right hemisphere deficits during later cognitive stages. The authors proposed that these right-hemisphere impairments might hinder the integration of stimulus features with subjective states such as expectancy or certainty. Furthermore, these shifts were correlated with cognitive task performance and the frequency of panic attacks in participants.
Kochi et al. (79) found that individuals with schizophrenia showed altered neuronal activation patterns, as suggested by alterations in the topographic configuration and duration of the P300-related microstate, suggesting a dysfunction in the coordination of visual processing-related brain regions. However, the absence of topographic maps in the study by Kochi et al. limits direct comparison with the findings of the article by Galderisi et al. Furthermore, neither of these studies reports graphically the progression of microstates recorded in the groups of patients and healthy controls, hindering the possibility of detecting the presence of unique temporal microstate patterns in the groups of patients.
Three additional studies investigated visuospatial attention and vigilance.
Antonova et al. (76) reported a reduction in the strength of early microstates MS 1 and MS 2 in individuals with schizophrenia, likely reflecting decreased N100 amplitude in occipital regions. Furthermore, these two maps of N100-related microstates (MS 1 and MS 2) had a topographic configuration like the one (MS 2) recorded in the study by Galderisi et al. and related to the same event-related potential but with clear lateralization of the map, mirroring the characteristics of the target stimuli. During the later stages of stimuli processing, subjects with schizophrenia exhibited a substitution of the later portion of MS 4 (P3b-related) with MS 3 (P3a-related), in contrast to the microstates pattern observed in healthy controls. This finding is consistent with previous reports of reduced P3b amplitude during visual and auditory oddball paradigms in schizophrenia (106, 107). The alterations may reflect a dysfunction in attention networks, resulting in a parietal-to-frontal shift in P3b scalp distribution (108).
Furthermore, the microstate analysis of the study by Antonova et al. revealed additional insights, showing that within the group of patients, MS 3 characteristics varied between individuals with and without auditory-verbal hallucinations, further highlighting the potential of microstate analysis for clinical characterization.
Two studies examined P300-related microstates during the continuous performance task in individuals with schizophrenia, yielding contrasting results since one study (77) found no alterations in microstate features in patients for both Go and NoGo conditions, while the other (75) observed delayed, shorter, and with a more prefrontal configuration in P300-related microstates of patients during NoGo stimuli. The microstate map of the P300-related microstate recorded during the Go condition also seems to correspond to the one present in other tasks employing visual stimuli (42, 76).
The discrepancies may stem from the smaller sample size in Begrè et al.’s study, suggesting that Kleinlogel et al.’s findings might better reflect group differences. However, one prominent limitation of this study is that the authors only reported the sequence of microstates for the Go condition and for one patient, hindering the possibility of comparison in the sequence of microstates between conditions and between the patient and control groups.
Soni et al. (80) found that individuals with schizophrenia showed altered pre- and post-response microstates during a working memory task, particularly reduced occurrences and durations of MS 1. At the same time, changes in MS 4 were observed only in first-degree relatives, suggesting microstates may reflect both clinical and subclinical dysfunctions. However, in this study, the authors also did not report a visual representation of the sequence of the microstates succeeding in the groups of patients with schizophrenia and healthy controls.
These six studies highlight the utility of microstate analysis in uncovering neural alterations related to visuospatial processing, particularly in schizophrenia. By examining shifts in topographic configurations and durations of microstates, these studies provide valuable insights into the neural mechanisms underlying impairments in visual attention, vigilance, and working memory in psychiatric disorders. However, as highlighted by the study by Antonova et al., a visual representation of the microstates sequence divided by the study groups and condition, which was lacking in most of the studies, could facilitate the exploration of the differences in the activation of distinct neuronal networks. Finally, a related aspect that warrants further investigation is that resting-state EEG and event-related microstates, despite exhibiting distinct characteristics, may still show overlaps in certain topographies. For example, resting-state MS C might spatially correspond to maps associated with P300 and, more specifically, to P3b (42, 76, 109). These observations suggest that some resting-state MS topographies may appear in task-based data, particularly in relation to specific ERP components. However, further analyses, such as spatial correlations, would be needed to confirm these assumptions.
4.2.3 Reward- and saliency-related processing
Three studies focused on neuronal responses to salient cues related to either monetary rewards or alcohol-related stimuli.
Perrottelli et al. (64), in patients with schizophrenia, found alterations in subjects with schizophrenia in the microstate related to N100 during reward anticipation, suggesting reduced attention allocation to stimuli associated with pleasant outcomes. These results highlight the presence of electrophysiological alterations that can be detected already during the early stage of processing of “valenced” stimuli, which were not considered in two studies on the same data using peak component analysis, restricting the analysis to EEG waveforms occurring from 200 ms post-stimulus onset (110, 111). Additionally, results from source localization analysis were in accordance with previous fMRI studies suggesting that impairments in reward processing might be due to alterations within areas of motivational circuits and regions linked to cognitive control, such as the orbitofrontal cortex, the cingulate cortex, and the prefrontal cortex (112, 113).
Two studies examined alcohol-related stimuli in individuals with AUD, investigating altered brain responses underlying cue-elicited craving.
The study by Rhonde et al. (42) showed no differences in the sequence of the microstates elicited between the patients and healthy control groups. However, they found that in AUD subjects, discrimination between alcohol and neutral cues began later (P200 time window) compared to controls, who exhibited this distinction earlier (P100 time window). These results highlight aberrant deficits in early sensory gating in patients suffering from AUD, which have not been considered in other studies employing peak component analysis in alcohol-related stimuli, but focusing only on later stages of processing (114, 115).
Although in the study by Tschuemperlin et al. no explicit association between microstates and ERPs was reported for the majority of microstates, MS 2 displayed a topographic map similar to the P100-related microstate, while MS 5 and 6 represented P300-related microstates (Figure 2) (82). This study reported distinct topographic patterns in later stages (300 ms onwards) of cue processing in AUD subjects and three distinct microstate maps observable only in patients (82). Finally, differences in late positive potential (LPP)-associated microstate suggested dysregulated emotional processing in AUD patients. Results from sLORETA suggested that differences in this late-occurring microstate might be due to modifications in the activation of the superior frontal gyrus, which has been previously linked to the same task in a study involving healthy participants (116).
Overall, these studies highlight the utility of microstate analysis in characterizing temporal and spatial patterns of neuronal activity associated with reward and saliency processing. Interestingly, the studies also recorded electrophysiological alterations in early time windows that are often not considered in peak component analysis in this type of task. Furthermore, the employment of source analysis allows for drawing parallels with neuroimaging studies, reinforcing the reliability and utility of ERP microstates analysis.
4.2.4 Face processing
Microstate analysis has proven effective in investigating neural processes underlying face perception and processing, as demonstrated by a recent review (71). This approach identifies variations in brain network engagement and strength in individuals with psychiatric disorders. Six studies examined face processing using various tasks.
Haartsen et al. (84) observed differences in early microstates (MS 1 and MS 2, related to P100 and N170, respectively) during inverted face presentations in individuals with autism compared to controls. Reduced inversion effects in autism suggest deficits in the visuospatial processing of faces. Later-stage alterations, particularly in adults rather than adolescents, suggest the recruitment of compensatory mechanisms like increased prefrontal cortex activity to meet cognitive demands. These differences were unrelated to symptom severity, suggesting distinct neural processes underlying autism onset versus symptom expression.
Studies on facial repetition effects and working memory in individuals presenting emotional dysregulation (as in ADHD, BD, BPD) also reported altered microstate topographies. In these three studies, the authors highlighted differences in the topographic maps, displaying how the patients presented slightly different configurations of microstates related to the same ERP.
In BPD, changes in N170- and P200-related microstates suggested global alterations in face detection and structural encoding, linked to dysfunctions in fronto-limbic and medial temporal regions, which have a key role in emotion processing and higher cognitive functioning (83, 117, 118). Similarly, BD patients showed atypical P200 topographies and reduced activation in mirror system regions, impairing social intention perception (85). Finally, Mauriello et al. revealed intact early face-processing (P100, N170) but deficits in later stages (P200, N250) of adults with ADHD, affecting attention allocation and face recognition (88). Furthermore, source imaging results from this study revealed hypo-activations in different areas of the cerebellum, which have recently been linked to social functioning in adults with ADHD (119, 120), and in the posterior cingulate.
Finally, two studies employed paradigms involving the processing of faces with specific emotions. In PTSD patients, altered N170-related microstates during dominance- and trustworthiness-related stimuli indicated changes in threat-related face processing. Dysregulated late-stage microstates (LPP) further suggested generalized emotional processing disruption (86). A study on depression found alterations in different parameters of N250-related microstates during negative-emotion face processing, which normalized following rTMS treatment, suggesting a potential for monitoring therapeutic effects (87).
Overall, microstate analysis reveals common and condition-specific neural patterns in psychiatric disorders during face processing. Furthermore, most of these studies reported microstate maps and sequences between groups, allowing a clear comparison of results obtained in the patients versus healthy control groups. Interestingly, subjects with autism seem to show disruptions of the early stages of face processing, as compared to subjects with ADHD, who displayed alterations mainly at later processing stages. Overall, source analyses consistently showed hypoactivation in frontal, temporal, and limbic regions, alongside hyperactivation in areas like the fusiform gyrus and cerebellum, providing insight into impaired social and emotional processing in psychiatric disorders.
4.3 Transdiagnostic and disorder-specific applications and advantages of ERP microstates analysis in psychiatric research
The studies included in this review examined a broad range of clinical populations. In studies involving individuals with schizophrenia, event-related potential microstate analysis provides additional insight into the neurophysiological alterations underlying the deficits consistently reported in auditory and visuospatial processing (76, 81, 121–124). Alterations in the magnitude, timing, and topographic features of ERP-related microstates recorded in these studies, particularly within the 100–400 ms window, may reflect inefficient allocation of neural resources and impaired transitions between functional brain states.
One of the main advantages of ERP microstates analysis, in the reviewed studies, lies in its ability to track dynamic changes in scalp topography with high temporal resolution. This is particularly valuable in paradigms using lateralized stimuli. For instance, in the study by Antonova et al. (2021), this approach enabled the identification of hemispheric asymmetries in early visual components, with reduced contralateral activation over the right hemisphere in schizophrenia (76). These findings demonstrate how ERP microstates can uncover subtle, lateralized brain activity differences that may be missed by conventional analysis of ERPs, offering deeper insight into the spatiotemporal dynamics of sensory and cognitive disturbances in schizophrenia.
Early-stage sensory processing deficits were also evident in two studies using auditory paradigms (78, 81). These confirmed the relevance of investigating early ERPs, such as P50 and N100, which are often considered as reliable electrophysiological markers of abnormal auditory processing in schizophrenia. Deficits in these early responses, observed during both passive and attentional conditions, have been hypothesized to contribute to more complex aspects of symptomatology, including negative symptoms and hallucinations.
Similar patterns in microstate parameters emerged in a study employing a reward anticipation task (64). Alterations were detected during both early and late stages of processing, particularly during stages of reward anticipation and loss-avoidance. The microstate approach proved valuable in this context, revealing differences not only in the amplitude but also in the timing and duration of microstates. This highlights the presence of disruptions in the dynamics of large-scale brain networks in schizophrenia. Therefore, a further advantage of ERP microstates analysis in task-based paradigms is its sensitivity to early time windows, which are often overlooked in traditional ERP studies due to a priori selection of analysis intervals.
Finally, two studies demonstrated the potential of microstate analysis to aid in the identification of clinical subtypes within schizophrenia (76, 81). Alterations in microstates linked to early auditory processing were found in patients with deficit schizophrenia, a subtype characterized by primary and enduring negative symptoms, as opposed to non-deficit schizophrenia patients. Similarly, patients with auditory verbal hallucinations showed distinct microstate topographies compared to those without these symptoms, supporting the utility of microstate features in differentiating subgroups within the broader diagnostic category of schizophrenia (76).
The reviewed studies also offer compelling evidence for the utility of ERP microstates analysis in identifying alterations at various stages of face processing, encompassing attentional, affective, emotional, and learning-related components, in mood and neurodevelopmental disorders (71). These findings support the potential of alterations of microstate parameters to reflect shared or disorder-specific neurophysiological mechanisms across conditions.
For instance, distinct patterns of ERP-microstates during face processing were observed in individuals with bipolar disorder, borderline personality disorder, and ADHD, as compared to healthy controls (83, 85, 88). While the specific alterations were not entirely consistent across diagnostic groups, their emergence within overlapping time windows suggests the existence of transdiagnostic neurophysiological alterations linked to impaired face processing.
In individuals with bipolar disorder and those at high risk for the condition, alterations were noted at the P200 stage, which is associated with the processing of facial features. Similarly, subjects with BPD exhibited differences in both the N170 component, linked to face detection, and the P200 component, related to structural encoding. These findings point to atypical neural dynamics underlying the early stages of social information processing. Likewise, in individuals with autism spectrum conditions, passive observation of inverted faces elicited weaker modulation of microstates related to low-level visual analysis and face detection (71, 84). These alterations may reflect early-stage impairments in configural face processing, which are commonly reported in autism. However, the substantial heterogeneity in experimental paradigms and the limited number of studies focusing on conditions such as depression, autism, ADHD, and personality disorders currently limit the generalizability of these findings. Further research with standardized protocols and larger clinical samples is needed to determine whether specific microstate alterations can serve as reliable biomarkers for these disorders.
Finally, the two studies examining alcohol use disorder (AUD) underscore the value of assessing both qualitative and quantitative parameters through ERP microstates analysis (42, 82). The first study demonstrated that individuals with AUD show altered brain dynamics during alcohol cue processing, including impairments in early sensory discrimination and reduced engagement of higher-order cognitive processes (42). These findings point to deficits in both bottom-up and top-down processing streams, with blunted early-stage responses associated with increased subjective craving, and reduced later-stage activation potentially reflecting impaired central nervous system inhibition. Therefore, the microstate-based approach offers a valuable perspective on the temporal unfolding of neural dysfunction in AUD and may contribute to the identification of neurophysiological markers of craving and relapse vulnerability. The second study revealed alterations in both the topographic configuration and strength of ERP microstates during alcohol-related cue processing in patients with AUD (82). These differences were interpreted as reflecting the recruitment of alternative neural resources in response to emotionally salient or cognitively demanding stimuli, consistent with compensatory mechanisms engaged during challenging task conditions.
4.4 Limitations of the current literature on ERP-microstates and future directions
The use of ERP microstates analysis offers significant advantages in the study of brain function, enabling the investigation of transient, subtle, and rapid neural dynamics without requiring a priori definition of time windows of interest, as shown by some of the included studies. Furthermore, microstate analysis enables the investigation of both quantitative and qualitative electrophysiological alterations in mental disorders (60). Despite the advantages and their potential implications, this review also highlights several limitations within the existing literature.
Notable limitations include the relatively low number of studies employing identical experimental paradigms and the variability in analysis methodologies, which prevent direct comparison of studies and reproducibility of findings. Studies investigating the test-retest reliability of microstate analysis have reported high reliability (125–127); however, most of these studies focused on resting-state data, and only a few investigated event-related microstates using similar experimental paradigms (128, 129).
Additionally, the methods used to extract and analyze the EEG microstates have evolved over time. Among the new methods, k-means clustering has emerged as one of the most widely used approaches and is included as a standard method across various EEG analysis toolboxes (83, 85, 130). While advancements in clustering techniques, such as k-means and hierarchical clustering, have improved microstate identification, there are still controversial issues regarding optimal criteria for microstate identification, such as the number of microstates to identify in similar analysis time windows, which might also depend on the complexity of the task and the number of investigated conditions (109). Further complicating the field, the inconsistent reporting of key parameters—such as temporal smoothing criteria or rejection threshold for short-lived microstates—poses additional challenges.
Future studies should adopt standardized preprocessing and analysis protocols to address these limitations. Establishing open-access repositories for microstate templates, including those related to ERP components, would facilitate cross-study comparisons and promote methodological consistency. As noted in the current review, this standardization would enable a better differentiation of microstate subtypes that might otherwise be conflated within the same ERP component. For example, studies examining P300-related microstates have found that multiple microstates may be identified to characterize the P300 time window. These microstates can be distinguished by their topographic configuration—such as frontocentral versus parietal positivity—and by the specific processing tasks involved (76).
Another critical issue is the lack of essential data and values in the reviewed studies. First, many studies did not provide an estimation of the effect size. Effect size is crucial for assessing the robustness of findings and represents a key input for future research (e.g., power analyses) (131). Furthermore, only two studies reported mean and standard deviations of microstate and peak component analysis, allowing a comparison of the effect size obtained using these two approaches (75, 77). These studies suggested a lower sensitivity of microstate analysis in detecting electrophysiological differences between groups compared to peak component analysis. However, further research is needed to compare the relative strengths and limitations of these methodologies in detecting subtle electrophysiological differences using either peak amplitude or microstate features.
Second, only some of the reviewed studies included figures displaying the topographic configurations of the extracted microstates or the actual sequence of microstates occurring throughout the analyzed time window, separately for patients and healthy controls.
Future studies should focus on calculating the effect size of group comparisons and incorporating visual representations of microstate sequences. These steps will be essential for understanding variations in the spatial and temporal dynamics of microstates across clinical populations, supporting cross-study comparisons, and evaluating the possible advantages or limitations of this approach compared to peak component analysis.
Third, only a few studies have explored the association between EEG microstate alterations and the severity of clinical symptoms, highlighting the potential and the limitations of this research field. Among the six studies (63, 64, 83–85, 88) investigating the above association, findings were heterogeneous, underscoring the complexity of interpreting microstate features in relation to psychopathology. Future research should consider the associations of microstate features with either psychiatric symptoms or cognitive functioning and include larger, transdiagnostic samples to better delineate the role of EEG microstates as potential biomarkers.
Finally, several studies reviewed here have employed linear and distributed inverse solutions to estimate the neural sources underlying microstate activity, thereby enhancing the interpretability of results. However, it is essential to note that identical topographies can arise from different brain generators (46). Therefore, source imaging data should be validated against results from complementary neuroimaging modalities whenever possible.
In summary, while combining microstate analysis with ERPs provides valuable insights into the temporal dynamics of brain activity, the field must prioritize consistency and standardization of the methodological approaches to microstates analysis. In addition, integration with other neuroimaging techniques is essential to advance our understanding of brain dysfunction in clinical populations. This standardization would be possible through the definition of guidelines shared by the scientific community for microstate analysis. As discussed in the current review, these guidelines should provide general recommendations regarding parameters to use for microstate analysis (i.e.: ICA correction for eye blinks, use of temporal smoothing) and data reporting (i.e.: clearly reporting topographic maps of extracted microstates, their onsets and offsets and sequence of occurrence on the group/condition average), but also guidance on the different types of tasks and expected outcomes (number and types of expected microstates to be extracted). The development of such guidelines would help address the current heterogeneity of findings and facilitate more consistent comparisons across future studies.
5 Conclusions
This review underscores the potential of microstate analysis as a powerful method for examining global neuronal activity patterns underlying sensory processing and cognitive functions in subjects with psychiatric disorders. Noticeably, some of the studies reported the presence of alterations across different time frames of sensory and cognitive processing, which might be missed in peak component analysis. However, the observed considerable methodological heterogeneity highlights an urgent need for standardized analysis procedures to facilitate cross-study comparisons.
Future studies should also aim to provide detailed and comprehensive data regarding the outcomes of ERP microstate analysis. Addressing these challenges will significantly enhance the utility of microstate analysis in advancing our understanding of electrophysiological correlates of sensory and cognitive processing and their alterations in clinical contexts.
Data availability statement
The original contributions presented in the study are included in the article/supplementary material. Further inquiries can be directed to the corresponding authors.
Author contributions
AP: Writing – original draft, Writing – review & editing, Conceptualization, Methodology, Supervision, Validation, Visualization. FM: Conceptualization, Data curation, Validation, Writing – original draft, Writing – review & editing. GD: Conceptualization, Methodology, Supervision, Validation, Visualization, Writing – original draft, Writing – review & editing. CD’A: Conceptualization, Data curation, Validation, Writing – original draft, Writing – review & editing. NS: Writing – original draft, Writing – review & editing. LG: Writing – original draft, Writing – review & editing. PP: Writing – original draft, Writing – review & editing. EC: Writing – original draft, Writing – review & editing. AMe: Writing – original draft, Writing – review & editing. GG: Writing – original draft, Writing – review & editing. PB: Writing – original draft, Writing – review & editing. AMu: Conceptualization, Methodology, Supervision, Validation, Visualization, Writing – original draft, Writing – review & editing. SG: Conceptualization, Methodology, Supervision, Validation, Visualization, Writing – original draft, Writing – review & editing.
Funding
The author(s) declare financial support was received for the research and/or publication of this article. AP, GDL, LG, GMG, PB and AM were supported by #NEXTGENERATIONEU (NGEU) and funded by the Ministry of University and Research (MUR), National Recovery and Resilience Plan (NRRP), project MNESYS (PE0000006) - (DN. 1553 11.10.2022).
Acknowledgments
AP, GDL, LG, GMG, PB and AM were supported by #NEXTGENERATIONEU (NGEU) and funded by the Ministry of University and Research (MUR), National Recovery and Resilience Plan (NRRP), project MNESYS (PE0000006) - (DN. 1553 11.10.2022).
Conflict of interest
The authors declare that the research was conducted in the absence of any commercial or financial relationships that could be construed as a potential conflict of interest.
The author(s) declared that they were an editorial board member of Frontiers, at the time of submission. This had no impact on the peer review process and the final decision.
Generative AI statement
The author(s) declare that no Generative AI was used in the creation of this manuscript.
Any alternative text (alt text) provided alongside figures in this article has been generated by Frontiers with the support of artificial intelligence and reasonable efforts have been made to ensure accuracy, including review by the authors wherever possible. If you identify any issues, please contact us.
Publisher’s note
All claims expressed in this article are solely those of the authors and do not necessarily represent those of their affiliated organizations, or those of the publisher, the editors and the reviewers. Any product that may be evaluated in this article, or claim that may be made by its manufacturer, is not guaranteed or endorsed by the publisher.
References
1. Verdejo-Garcia A. Searching for biomarkers in the fluidity of mental ill-health. World Psychiatry. (2023) 22:268–70. doi: 10.1002/wps.21083
2. Yatham LN. Biomarkers for clinical use in psychiatry: where are we and will we ever get there? World Psychiatry. (2023) 22:263–4. doi: 10.1002/wps.21079
3. Michelini G, Carlisi CO, Eaton NR, Elison JT, Haltigan JD, Kotov R, et al. Where do neurodevelopmental conditions fit in transdiagnostic psychiatric frameworks? Incorporating a new neurodevelopmental spectrum. World Psychiatry. (2024) 23:333–57. doi: 10.1002/wps.21225
4. Abi-Dargham A, Moeller SJ, Ali F, DeLorenzo C, Domschke K, Horga G, et al. Candidate biomarkers in psychiatric disorders: state of the field. World Psychiatry. (2023) 22:236–62. doi: 10.1002/wps.21078
5. Stein DJ, Nielsen K, Hartford A, Gagne-Julien AM, Glackin S, Friston K, et al. Philosophy of psychiatry: theoretical advances and clinical implications. World Psychiatry. (2024) 23:215–32. doi: 10.1002/wps.21194
6. WHO. Mental Disorders (2024). Available online at: https://www.who.int/news-room/fact-sheets/detail/mental-disorders (Accessed September 12, 2024).
7. Steel Z, Marnane C, Iranpour C, Chey T, Jackson JW, Patel V, et al. The global prevalence of common mental disorders: A systematic review and meta-analysis 1980 - 2013. Int J Epidemiol. (2014) 43:476–93. doi: 10.1093/ije/dyu038
8. Vigo D, Thornicroft G, and Atun R. Estimating the true global burden of mental illness. Lancet Psychiatry. (2016) 3:171–8. doi: 10.1016/S2215-0366(15)00505-2
9. Dragioti E, Radua J, Solmi M, Gosling CJ, Oliver D, Lascialfari F, et al. Impact of mental disorders on clinical outcomes of physical diseases: an umbrella review assessing population attributable fraction and generalized impact fraction. World Psychiatry. (2023) 22:86–104. doi: 10.1002/wps.21068
10. Fusar-Poli P, Sunkel C, Larrauri CA, Keri P, McGorry PD, Thornicroft G, et al. Violence and schizophrenia: the role of social determinants of health and the need for early intervention. World Psychiatry. (2023) 22:230–1. doi: 10.1002/wps.21074
11. Ten Have M, Tuithof M, van Dorsselaer S, Schouten F, Luik AI, and de Graaf R. Prevalence and trends of common mental disorders from 2007 – 2009 to 2019 - 2022: results from the Netherlands mental health survey and incidence studies (Nemesis), including comparison of prevalence rates before vs. During the Covid-19 Pandemic. World Psychiatry. (2023) 22:275–85. doi: 10.1002/wps.21087
12. Brandt V, Zhang Y, Carr H, Golm D, Correll CU, Arrondo G, et al. First evidence of a general disease (“D”) factor, a common factor underlying physical and mental illness. World Psychiatry. (2023) 22:335–7. doi: 10.1002/wps.21097
13. Javed A. The wpa action plan 2020 - 2023: an updated report. World Psychiatry. (2023) 22:341–2. doi: 10.1002/wps.21101
14. Berk M, Kohler-Forsberg O, Turner M, Penninx B, Wrobel A, Firth J, et al. Comorbidity between major depressive disorder and physical diseases: A comprehensive review of epidemiology, mechanisms and management. World Psychiatry. (2023) 22:366–87. doi: 10.1002/wps.21110
15. Galderisi S. Promoting schizophrenia research in europe: the contribution of the european group for research in schizophrenia. World Psychiatry. (2023) 22:486–7. doi: 10.1002/wps.21100
16. Hartmann S, Dwyer D, Cavve B, Byrne EM, Scott I, Gao C, et al. Development and temporal validation of a clinical prediction model of transition to psychosis in individuals at ultra-high risk in the uhr 1000+ Cohort. World Psychiatry. (2024) 23:400–10. doi: 10.1002/wps.21240
17. Giordano GM, Palumbo D, Mucci A, Ventura J, Giuliani L, Perrottelli A, et al. The cognitive assessment interview (Cai): association with neuropsychological scores and real-life functioning in a large sample of italian subjects with schizophrenia. Schizophr Res. (2022) 241:161–70. doi: 10.1016/j.schres.2022.01.029
18. Galderisi S, Perrottelli A, Giuliani L, Pisaturo MA, Monteleone P, Pagliano P, et al. Cognitive impairment after recovery from covid-19: frequency, profile, and relationships with clinical and laboratory indices. Eur Neuropsychopharmacol. (2024) 79:22–31. doi: 10.1016/j.euroneuro.2023.11.001
19. McLoughlin G, Makeig S, and Tsuang MT. In search of biomarkers in psychiatry: eeg-based measures of brain function. Am J Med Genet Part B Neuropsychiatr Genet. (2014) 165B:111–21. doi: 10.1002/ajmg.b.32208
20. Tivadar RI and Murray MM. A primer on electroencephalography and event-related potentials for organizational neuroscience. Organizational Res Methods. (2018) 22:69–94. doi: 10.1177/1094428118804657
21. Telenczuk B, Baker SN, Herz AV, and Curio G. High-frequency eeg covaries with spike burst patterns detected in cortical neurons. J Neurophysiol. (2011) 105:2951–9. doi: 10.1152/jn.00327.2010
22. Berger H. Über das elektrenkephalogramm des menschen. Archiv für Psychiatr und Nervenkrankheiten. (1929) 87:527–70. doi: 10.1007/bf01797193
23. Newson JJ and Thiagarajan TC. Eeg frequency bands in psychiatric disorders: A review of resting state studies. Front Hum Neurosci. (2018) 12:521. doi: 10.3389/fnhum.2018.00521
24. Bowman FD, Guo Y, and Derado G. Statistical approaches to functional neuroimaging data. Neuroimaging Clin N Am. (2007) 17:441–58. doi: 10.1016/j.nic.2007.09.002
25. Tononi G and Raison C. Artificial intelligence, consciousness and psychiatry. World Psychiatry. (2024) 23:309–10. doi: 10.1002/wps.21222
26. Hajcak G, Klawohn J, and Meyer A. The utility of event-related potentials in clinical psychology. Annu Rev Clin Psychol. (2019) 15:71–95. doi: 10.1146/annurev-clinpsy-050718-095457
27. Helfrich RF and Knight RT. Chapter 36 - cognitive neurophysiology: event-related potentials. In: Levin KH and Chauvel P, editors. Handbook of Clinical Neurology, vol. 160. Amsterdam: Elsevier (2019). p. 543 – 58.
28. van der Stelt O and Belger A. Application of electroencephalography to the study of cognitive and brain functions in schizophrenia. Schizophr Bull. (2007) 33:955–70. doi: 10.1093/schbul/sbm016
29. Schechter I, Butler PD, Zemon VM, Revheim N, Saperstein AM, Jalbrzikowski M, et al. Impairments in generation of early-stage transient visual evoked potentials to magno- and parvocellular-selective stimuli in schizophrenia. Clin Neurophysiol. (2005) 116:2204–15. doi: 10.1016/j.clinph.2005.06.013
30. Vafaii P, Mazhari S, Pourrahimi AM, and Nakhee NJN. Hemispheric differences for visual P3 amplitude in patients with schizophrenia. Neuropsychiatry (London) (2016) 6:308–13. doi: 10.4172/Neuropsychiatry.1000154
31. Bedwell JS, Spencer CC, Chan CC, Butler PD, Sehatpour P, and Schmidt J. The P1 visual-evoked potential, red light, and transdiagnostic psychiatric symptoms. Brain Res. (2018) 1687:144–54. doi: 10.1016/j.brainres.2018.03.002
32. Atagun MI, Drukker M, Hall MH, Altun IK, Tatli SZ, Guloksuz S, et al. Meta-analysis of auditory P50 sensory gating in schizophrenia and bipolar disorder. Psychiatry Res Neuroimaging. (2020) 300:111078. doi: 10.1016/j.pscychresns.2020.111078
33. Arikan MK, Ilhan R, Orhan O, Esmeray MT, Turan S, Gica S, et al. P300 parameters in major depressive disorder: A systematic review and meta-analysis. World J Biol Psychiatry. (2024) 25:255–66. doi: 10.1080/15622975.2024.2321554
34. Hamilton HK, Mathalon DH, and Ford JM. P300 in schizophrenia: then and now. Biol Psychol. (2024) 187:108757. doi: 10.1016/j.biopsycho.2024.108757
35. Herrmann MJ, Weijers HG, Wiesbeck GA, Aranda D, Boning J, and Fallgatter AJ. Event-related potentials and cue-reactivity in alcoholism. Alcohol Clin Exp Res. (2000) 24:1724–9. doi: 10.1111/j.1530-0277.2000.tb01974.x
36. Namkoong K, Lee E, Lee CH, Lee BO, and An SK. Increased P3 amplitudes induced by alcohol-related pictures in patients with alcohol dependence. Alcohol Clin Exp Res. (2004) 28:1317–23. doi: 10.1097/01.alc.0000139828.78099.69
37. Volkow ND and Blanco C. Substance use disorders: A comprehensive update of classification, epidemiology, neurobiology, clinical aspects, treatment and prevention. World Psychiatry. (2023) 22:203–29. doi: 10.1002/wps.21073
38. Raz S and Dan O. Altered event-related potentials in adults with adhd during emotional faces processing. Clin Neurophysiol. (2015) 126:514–23. doi: 10.1016/j.clinph.2014.06.023
39. Raz S and Dan O. Behavioral and neural correlates of facial versus nonfacial stimuli processing in adults with adhd: an erp study. Neuropsychology. (2015) 29:726–38. doi: 10.1037/neu0000176
40. Campos E, Hazlett C, Tan P, Truong H, Loo S, DiStefano C, et al. Principle erp reduction and analysis: estimating and using principle erp waveforms underlying erps across tasks, subjects and electrodes. Neuroimage. (2020) 212:116630. doi: 10.1016/j.neuroimage.2020.116630
41. Koenig T, Stein M, Grieder M, and Kottlow M. A tutorial on data-driven methods for statistically assessing erp topographies. Brain topography. (2014) 27:72–83. doi: 10.1007/s10548-013-0310-1
42. Rohde KB, Fey W, Moggi F, Koenig T, Luedi I, Duppenthaler L, et al. Deficient processing of alcohol cues in the addicted brain: evidence from event-related potential microstates. Clin Neurophysiol. (2020) 131:2224–35. doi: 10.1016/j.clinph.2020.06.012
43. Voineskos AN, Hawco C, Neufeld NH, Turner JA, Ameis SH, Anticevic A, et al. Functional magnetic resonance imaging in schizophrenia: current evidence, methodological advances, limitations and future directions. World Psychiatry. (2024) 23:26–51. doi: 10.1002/wps.21159
44. Lehmann D, Ozaki H, and Pal I. Eeg alpha map series: brain micro-states by space-oriented adaptive segmentation. Electroencephalogr Clin Neurophysiol. (1987) 67:271–88. doi: 10.1016/0013-4694(87)90025-3
45. Khanna A, Pascual-Leone A, Michel CM, and Farzan F. Microstates in resting-state eeg: current status and future directions. Neurosci Biobehav Rev. (2015) 49:105–13. doi: 10.1016/j.neubiorev.2014.12.010
46. Michel CM and Koenig T. Eeg microstates as a tool for studying the temporal dynamics of whole-brain neuronal networks: A review. Neuroimage. (2018) 180:577–93. doi: 10.1016/j.neuroimage.2017.11.062
47. Brechet L and Michel CM. Eeg microstates in altered states of consciousness. Front Psychol. (2022) 13:856697. doi: 10.3389/fpsyg.2022.856697
48. Tarailis P, Koenig T, Michel CM, and Griskova-Bulanova I. The functional aspects of resting eeg microstates: A systematic review. Brain topography. (2024) 37:181–217. doi: 10.1007/s10548-023-00958-9
49. Al Zoubi O, Mayeli A, Tsuchiyagaito A, Misaki M, Zotev V, Refai H, et al. EEG microstates temporal dynamics differentiate individuals with mood and anxiety disorders from healthy subjects. Front Hum Neurosci. (2019) 13:56. doi: 10.3389/fnhum.2019.00056
50. Koenig T, Lehmann D, Merlo MC, Kochi K, Hell D, and Koukkou M. A deviant eeg brain microstate in acute, neuroleptic-naive schizophrenics at rest. Eur Arch Psychiatry Clin Neurosci. (1999) 249:205–11. doi: 10.1007/s004060050088
51. Koenig T, Prichep L, Lehmann D, Sosa PV, Braeker E, Kleinlogel H, et al. Millisecond by millisecond, year by year: normative eeg microstates and developmental stages. Neuroimage. (2002) 16:41–8. doi: 10.1006/nimg.2002.1070
52. von Wegner F, Wiemers M, Hermann G, Todt I, Tagliazucchi E, and Laufs H. Complexity measures for eeg microstate sequences: concepts and algorithms. Brain topography. (2024) 37:296–311. doi: 10.1007/s10548-023-01006-2
53. Murphy M, Whitton AE, Deccy S, Ironside ML, Rutherford A, Beltzer M, et al. Abnormalities in electroencephalographic microstates are state and trait markers of major depressive disorder. Neuropsychopharmacology. (2020) 45:2030–7. doi: 10.1038/s41386-020-0749-1
54. Giordano GM, Koenig T, Mucci A, Vignapiano A, Amodio A, Di Lorenzo G, et al. Neurophysiological correlates of avolition-apathy in schizophrenia: A resting-eeg microstates study. NeuroImage Clin. (2018) 20:627–36. doi: 10.1016/j.nicl.2018.08.031
55. Jia H and Yu D. Aberrant intrinsic brain activity in patients with autism spectrum disorder: insights from eeg microstates. Brain topography. (2019) 32:295–303. doi: 10.1007/s10548-018-0685-0
56. D’Croz-Baron DF, Baker M, Michel CM, and Karp T. Eeg microstates analysis in young adults with autism spectrum disorder during resting-state. Front Hum Neurosci. (2019) 13:173. doi: 10.3389/fnhum.2019.00173
57. Bertelli MO, Bianco A, Salvador-Carulla L, and Javed A. Wpa working group on defining and managing autism spectrum disorder: spreading knowledge for the next generations of psychiatrists. World Psychiatry. (2023) 22:168–9. doi: 10.1002/wps.21051
58. Wu G, Zhao X, Luo X, Li H, Chen Y, Dang C, et al. Microstate dynamics and spectral components as markers of persistent and remittent attention-deficit/hyperactivity disorder. Clin Neurophysiol. (2024) 161:147–56. doi: 10.1016/j.clinph.2024.02.027
59. Ferat V, Arns M, Deiber MP, Hasler R, Perroud N, Michel CM, et al. Electroencephalographic microstates as novel functional biomarkers for adult attention-deficit/hyperactivity disorder. Biol Psychiatry Cogn Neurosci Neuroimaging. (2022) 7:814–23. doi: 10.1016/j.bpsc.2021.11.006
60. Schiller B, Sperl MFJ, Kleinert T, Nash K, and Gianotti LRR. Eeg microstates in social and affective neuroscience. Brain topography. (2024) 37:479–95. doi: 10.1007/s10548-023-00987-4
61. Retsa C, Turpin H, Geiser E, Ansermet F, Muller-Nix C, and Murray MM. Longstanding auditory sensory and semantic differences in preterm born children. Brain topography. (2024) 37:536–51. doi: 10.1007/s10548-023-01022-2
62. Schiller B, Gianotti LR, Baumgartner T, Nash K, Koenig T, and Knoch D. Clocking the social mind by identifying mental processes in the iat with electrical neuroimaging. Proc Natl Acad Sci United States America. (2016) 113:2786–91. doi: 10.1073/pnas.1515828113
63. Galderisi S, Bucci P, Mucci A, Bernardo A, Koenig T, and Maj M. Brain electrical microstates in subjects with panic disorder. Brain Res Bull. (2001) 54:427–35. doi: 10.1016/s0361-9230(01)00439-7
64. Perrottelli A, Giordano GM, Koenig T, Caporusso E, Giuliani L, Pezzella P, et al. Electrophysiological correlates of reward anticipation in subjects with schizophrenia: an erp microstate study. Brain topography. (2024) 37:1–19. doi: 10.1007/s10548-023-00984-7
65. Pascual-Marqui RD, Michel CM, and Lehmann D. Low resolution electromagnetic tomography: A new method for localizing electrical activity in the brain. Int J Psychophysiol. (1994) 18:49–65. doi: 10.1016/0167-8760(84)90014-x
66. Grave de Peralta Menendez R, Murray MM, Michel CM, Martuzzi R, and Gonzalez Andino SL. Electrical neuroimaging based on biophysical constraints. Neuroimage. (2004) 21:527–39. doi: 10.1016/j.neuroimage.2003.09.051
67. Pascual-Marqui RD. Standardized low-resolution brain electromagnetic tomography (Sloreta): technical details. Methods findings Exp Clin Pharmacol. (2002) 24 Suppl D:5–12.
68. Perrottelli A, Giordano GM, Brando F, Giuliani L, and Mucci A. Eeg-based measures in at-risk mental state and early stages of schizophrenia: A systematic review. Front Psychiatry. (2021) 12:653642. doi: 10.3389/fpsyt.2021.653642
69. Chivu A, Pascal SA, Damborska A, and Tomescu MI. Eeg microstates in mood and anxiety disorders: A meta-analysis. Brain topography. (2024) 37:357–68. doi: 10.1007/s10548-023-00999-0
70. Leichsenring F, Fonagy P, Heim N, Kernberg OF, Leweke F, Luyten P, et al. Borderline personality disorder: A comprehensive review of diagnosis and clinical presentation, etiology, treatment, and current controversies. World Psychiatry. (2024) 23:4–25. doi: 10.1002/wps.21156
71. Berchio C, Kumar S, and Destro MF. Microstate analyses to study face processing in healthy individuals and psychiatric disorders: A review of erp findings. Brain topography. (2024) 38:1. doi: 10.1007/s10548-024-01083-x
72. Page MJ, McKenzie JE, Bossuyt PM, Boutron I, Hoffmann TC, Mulrow CD, et al. The prisma 2020 statement: an updated guideline for reporting systematic reviews. BMJ. (2021) 372:n71. doi: 10.1136/bmj.n71
73. von Wegner F, Knaut P, and Laufs H. EEG microstate sequences from different clustering algorithms are information-theoretically invariant. Front Comput Neurosci. (2018) 12:70. doi: 10.3389/fncom.2018.00070
74. Gierisch JM, Beadles C, Shapiro A, McDuffie JR, Cunningham N, Bradford D, et al. Appendix B: Newcastle-Ottawa Scale Coding Manual for Cohort Studies. Washington (DC: Department of Veterans Affairs (US (2014). Available online at: https://www.ncbi.nlm.nih.gov/books/NBK299087/.
75. Kleinlogel H, Strik W, and Begre S. Increased nogo-anteriorisation in first-episode schizophrenia patients during continuous performance test. Clin Neurophysiol. (2007) 118:2683–91. doi: 10.1016/j.clinph.2007.08.022
76. Antonova I, van Swam C, Hubl D, Griskova-Bulanova I, Dierks T, and Koenig T. Altered visuospatial processing in schizophrenia: an event-related potential microstate analysis comparing patients with and without hallucinations with healthy controls. Neuroscience. (2021) 479:140–56. doi: 10.1016/j.neuroscience.2021.10.014
77. Begre S, Kleinlogel H, Kiefer C, Strik W, Dierks T, and Federspiel A. White matter anisotropy related to electrophysiology of first episode schizophrenia during nogo inhibition. Neurobiol Dis. (2008) 30:270–80. doi: 10.1016/j.nbd.2008.01.013
78. Chang Q, Li C, Zhang J, and Wang C. Dynamic brain functional network based on eeg microstate during sensory gating in schizophrenia. J Neural Eng. (2022) 19:026007. doi: 10.1088/1741-2552/ac5266
79. Kochi K, Koenig T, Strik WK, and Lehmann D. Event-related potential P300 microstate topography during visual one- and two-dimensional tasks in chronic schizophrenics. Eur Arch Psychiatry Clin Neurosci. (1996) 246:288–96. doi: 10.1007/BF02189021
80. Soni S, Muthukrishnan SP, Samanchi R, Sood M, Kaur S, and Sharma R. Pre-trial and pre-response eeg microstates in schizophrenia: an endophenotypic marker. Behav Brain Res. (2019) 371:111964. doi: 10.1016/j.bbr.2019.111964
81. Mucci A, Galderisi S, Kirkpatrick B, Bucci P, Volpe U, Merlotti E, et al. Double dissociation of N1 and P3 abnormalities in deficit and nondeficit schizophrenia. Schizophr Res. (2007) 92:252–61. doi: 10.1016/j.schres.2007.01.026
82. Tschuemperlin RM, Batschelet HM, Moggi F, Koenig T, Roesner S, Keller A, et al. The neurophysiology of implicit alcohol associations in recently abstinent patients with alcohol use disorder: an event-related potential study considering gender effects. Alcohol Clin Exp Res. (2020) 44:2031–44. doi: 10.1111/acer.14444
83. Berchio C, Piguet C, Gentsch K, Kung AL, Rihs TA, Hasler R, et al. Face and gaze perception in borderline personality disorder: an electrical neuroimaging study. Psychiatry Res Neuroimaging. (2017) 269:62–72. doi: 10.1016/j.pscychresns.2017.08.011
84. Haartsen R, Mason L, Garces P, Gui A, Charman T, Tillmann J, et al. Qualitative differences in the spatiotemporal brain states supporting configural face processing emerge in adolescence in autism. Cortex. (2022) 155:13–29. doi: 10.1016/j.cortex.2022.06.010
85. Berchio C, Kung AL, Kumar S, Cordera P, Dayer AG, Aubry JM, et al. Eye-gaze processing in the broader bipolar phenotype revealed by electrical neuroimaging. Psychiatry Res Neuroimaging. (2019) 291:42–51. doi: 10.1016/j.pscychresns.2019.07.007
86. Perizzolo Pointet VC, Moser DA, Vital M, Rusconi Serpa S, Todorov A, and Schechter DS. Violence exposure is associated with atypical appraisal of threat among women: an eeg study. Front Psychol. (2020) 11:576852. doi: 10.3389/fpsyg.2020.576852
87. Zhao L, Zhou D, Hu J, He X, Peng X, Ma L, et al. Changes in microstates of first-episode untreated nonsuicidal self-injury adolescents exposed to negative emotional stimuli and after receiving rtms intervention. Front Psychiatry. (2023) 14:1151114. doi: 10.3389/fpsyt.2023.1151114
88. Mauriello C, Pham E, Kumar S, Piguet C, Deiber MP, Aubry JM, et al. Dysfunctional temporal stages of eye-gaze perception in adults with adhd: A high-density eeg study. Biol Psychol. (2022) 171:108351. doi: 10.1016/j.biopsycho.2022.108351
89. Giordano GM, Brando F, Perrottelli A, Di Lorenzo G, Siracusano A, Giuliani L, et al. Tracing links between early auditory information processing and negative symptoms in schizophrenia: an erp study. Front Psychiatry. (2021) 12:790745. doi: 10.3389/fpsyt.2021.790745
90. Giordano GM, Giuliani L, Perrottelli A, Bucci P, Di Lorenzo G, Siracusano A, et al. Mismatch negativity and P3a impairment through different phases of schizophrenia and their association with real-life functioning. J Clin Med. (2021) 10:5838. doi: 10.3390/jcm10245838
91. Gebreegziabhere Y, Habatmu K, Mihretu A, Cella M, and Alem A. Cognitive impairment in people with schizophrenia: an umbrella review. Eur Arch Psychiatry Clin Neurosci. (2022) 272:1139–55. doi: 10.1007/s00406-022-01416-6
92. Melillo A, Caporusso E, Giordano GM, Giuliani L, Pezzella P, Perrottelli A, et al. Correlations between negative symptoms and cognitive deficits in individuals at first psychotic episode or at high risk of psychosis: a systematic review. J Clin Med. (2023) 12:7095. doi: 10.3390/jcm12227095
93. Carboni M, Brunet D, Seeber M, Michel CM, Vulliemoz S, and Vorderwulbecke BJ. Linear distributed inverse solutions for interictal eeg source localisation. Clin Neurophysiol. (2022) 133:58–67. doi: 10.1016/j.clinph.2021.10.008
94. Michel CM, Brechet L, Schiller B, and Koenig T. Current state of eeg/erp microstate research. Brain topography. (2024) 37:169–80. doi: 10.1007/s10548-024-01037-3
95. Laganaro M. Erp topographic analyses from concept to articulation in word production studies. Front Psychol. (2014) 5:493. doi: 10.3389/fpsyg.2014.00493
96. Pizzagalli D, Regard M, and Lehmann D. Rapid emotional face processing in the human right and left brain hemispheres: an erp study. Neuroreport. (1999) 10:2691–8. doi: 10.1097/00001756-199909090-00001
97. Brunet D, Murray MM, and Michel CM. Spatiotemporal analysis of multichannel eeg: cartool. Comput Intell Neurosci. (2011) 2011:813870. doi: 10.1155/2011/813870
98. Nagabhushan Kalburgi S, Kleinert T, Aryan D, Nash K, Schiller B, and Koenig T. Microstatelab: the eeglab toolbox for resting-state microstate analysis. Brain topography. (2024) 37:621–45. doi: 10.1007/s10548-023-01003-5
99. Koenig T, Kottlow M, Stein M, and Melie-Garcia L. Ragu: A free tool for the analysis of eeg and meg event-related scalp field data using global randomization statistics. Comput Intell Neurosci. (2011) 2011:938925. doi: 10.1155/2011/938925
100. Jajcay N and Hlinka J. Towards a dynamical understanding of microstate analysis of M/eeg data. Neuroimage. (2023) 281:120371. doi: 10.1016/j.neuroimage.2023.120371
101. Zhang G and Luck SJ. Variations in erp data quality across paradigms, participants, and scoring procedures. Psychophysiology. (2023) 60:e14264. doi: 10.1111/psyp.14264
102. McWeeny S and Norton ES. Understanding event-related potentials (Erps) in clinical and basic language and communication disorders research: A tutorial. Int J Lang communication Disord. (2020) 55:445–57. doi: 10.1111/1460-6984.12535
103. Khanna A, Pascual-Leone A, and Farzan F. Reliability of resting-state microstate features in electroencephalography. PLoS One. (2014) 9:e114163. doi: 10.1371/journal.pone.0114163
104. Freedman R, Olsen-Dufour AM, and Olincy A. Consortium on the genetics of S. P50 inhibitory sensory gating in schizophrenia: analysis of recent studies. Schizophr Res. (2020) 218:93–8. doi: 10.1016/j.schres.2020.02.003
105. Shen CL, Chou TL, Lai WS, Hsieh MH, Liu CC, Liu CM, et al. P50, N100, and P200 auditory sensory gating deficits in schizophrenia patients. Front Psychiatry. (2020) 11:868. doi: 10.3389/fpsyt.2020.00868
106. Giordano GM, Perrottelli A, Mucci A, Di Lorenzo G, Altamura M, Bellomo A, et al. Investigating the relationships of P3b with negative symptoms and neurocognition in subjects with chronic schizophrenia. Brain Sci. (2021) 11:1632. doi: 10.3390/brainsci11121632
107. Hamilton HK, Woods SW, Roach BJ, Llerena K, McGlashan TH, Srihari VH, et al. Auditory and visual oddball stimulus processing deficits in schizophrenia and the psychosis risk syndrome: forecasting psychosis risk with P300. Schizophr Bull. (2019) 45:1068–80. doi: 10.1093/schbul/sby167
108. Li Y, Wang W, Liu T, Ren L, Zhou Y, Yu C, et al. Source analysis of P3a and P3b components to investigate interaction of depression and anxiety in attentional systems. Sci Rep. (2015) 5:17138. doi: 10.1038/srep17138
109. Koenig T, Diezig S, Kalburgi SN, Antonova E, Artoni F, Brechet L, et al. Eeg-meta-microstates: towards a more objective use of resting-state eeg microstate findings across studies. Brain topography. (2024) 37:218–31. doi: 10.1007/s10548-023-00993-6
110. Vignapiano A, Mucci A, Ford J, Montefusco V, Plescia GM, Bucci P, et al. Reward anticipation and trait anhedonia: an electrophysiological investigation in subjects with schizophrenia. Clin Neurophysiol. (2016) 127:2149–60. doi: 10.1016/j.clinph.2016.01.006
111. Vignapiano A, Mucci A, Merlotti E, Giordano GM, Amodio A, Palumbo D, et al. Impact of reward and loss anticipation on cognitive control: an event-related potential study in subjects with schizophrenia and healthy controls. Clin EEG Neurosci. (2018) 49:46–54. doi: 10.1177/1550059417745935
112. Giordano GM, Pezzella P, Quarantelli M, Bucci P, Prinster A, Soricelli A, et al. Investigating the relationship between white matter connectivity and motivational circuits in subjects with deficit schizophrenia: A diffusion tensor imaging (Dti) study. J Clin Med. (2021) 11:61. doi: 10.3390/jcm11010061
113. Zeng J, Yan J, Cao H, Su Y, Song Y, Luo Y, et al. Neural substrates of reward anticipation and outcome in schizophrenia: A meta-analysis of fmri findings in the monetary incentive delay task. Transl Psychiatry. (2022) 12:448. doi: 10.1038/s41398-022-02201-8
114. Batschelet HM, Tschuemperlin RM, Moggi F, Soravia LM, Koenig T, Pfeifer P, et al. Neurophysiological correlates of alcohol-specific inhibition in alcohol use disorder and its association with craving and relapse. Clin Neurophysiol. (2021) 132:1290–301. doi: 10.1016/j.clinph.2021.02.389
115. Martins JS, Bartholow BD, Cooper ML, Irvin KM, and Piasecki TM. Interactive effects of naturalistic drinking context and alcohol sensitivity on neural alcohol cue-reactivity responses. Alcohol Clin Exp Res. (2019) 43:1777–89. doi: 10.1111/acer.14134
116. Egenolf Y, Stein M, Koenig T, Grosse Holtforth M, Dierks T, and Caspar F. Tracking the implicit self using event-related potentials. Cognit Affect Behav Neurosci. (2013) 13:885–99. doi: 10.3758/s13415-013-0169-3
117. Gainotti G. Unconscious processing of emotions and the right hemisphere. Neuropsychologia. (2012) 50:205–18. doi: 10.1016/j.neuropsychologia.2011.12.005
118. Li W, Qin W, Liu H, Fan L, Wang J, Jiang T, et al. Subregions of the human superior frontal gyrus and their connections. Neuroimage. (2013) 78:46–58. doi: 10.1016/j.neuroimage.2013.04.011
119. Adamaszek M, Kirkby KC, D’Agata F, Olbrich S, Langner S, Steele C, et al. Neural correlates of impaired emotional face recognition in cerebellar lesions. Brain Res. (2015) 1613:1–12. doi: 10.1016/j.brainres.2015.01.027
120. Bruchhage MMK, Bucci M-P, and Becker EBE. Chapter 4 - cerebellar involvement in autism and adhd. In: Manto M and Huisman TAGM, editors. Handbook of Clinical Neurology, vol. 155. Amsterdam: Elsevier (2018). p. 61–72.
121. Pokorny VJ, Klein SD, Teich CD, Sponheim SR, Olman CA, and Wilson S. Atypical use of visuospatial context in psychotic psychopathology: A meta-analysis. Schizophr Bull. (2025) 51:983–96. doi: 10.1093/schbul/sbae081
122. Hardoy MC, Carta MG, Catena M, Hardoy MJ, Cadeddu M, Dell’Osso L, et al. Impairment in visual and spatial perception in schizophrenia and delusional disorder. Psychiatry Res. (2004) 127:163–6. doi: 10.1016/j.psychres.2004.03.002
123. Donde C, Kantrowitz JT, Medalia A, Saperstein AM, Balla A, Sehatpour P, et al. Early auditory processing dysfunction in schizophrenia: mechanisms and implications. Neurosci Biobehav Rev. (2023) 148:105098. doi: 10.1016/j.neubiorev.2023.105098
124. Fivel L, Mondino M, Brunelin J, and Haesebaert F. Basic auditory processing and its relationship with symptoms in patients with schizophrenia: A systematic review. Psychiatry Res. (2023) 323:115144. doi: 10.1016/j.psychres.2023.115144
125. Liu J, Xu J, Zou G, He Y, Zou Q, and Gao JH. Reliability and individual specificity of eeg microstate characteristics. Brain topography. (2020) 33:438–49. doi: 10.1007/s10548-020-00777-2
126. Popov T, Trondle M, Baranczuk-Turska Z, Pfeiffer C, Haufe S, and Langer N. Test-retest reliability of resting-state eeg in young and older adults. Psychophysiology. (2023) 60:e14268. doi: 10.1111/psyp.14268
127. Kleinert T, Koenig T, Nash K, and Wascher E. On the reliability of the eeg microstate approach. Brain topography. (2024) 37:271–86. doi: 10.1007/s10548-023-00982-9
128. Jouen AL, Lancheros M, and Laganaro M. Microstate erp analyses to pinpoint the articulatory onset in speech production. Brain topography. (2021) 34:29–40. doi: 10.1007/s10548-020-00803-3
129. Laganaro M. Inter-study and inter-individual consistency and variability of eeg/erp microstate sequences in referential word production. Brain topography. (2017) 30:785–96. doi: 10.1007/s10548-017-0580-0
130. Darque A, Del Zotto M, Khateb A, and Pegna AJ. Attentional modulation of early erp components in response to faces: evidence from the attentional blink paradigm. Brain topography. (2012) 25:167–81. doi: 10.1007/s10548-011-0199-5
Keywords: electroencephalogram (EEG), event-related potentials (ERP), microstates (MS), source localization, mental disorders, neurodevelopmental disorders, psychiatry
Citation: Perrottelli A, Marzocchi FF, Di Lorenzo G, D’Amelio C, Sansone N, Giuliani L, Pezzella P, Caporusso E, Melillo A, Giordano GM, Bucci P, Mucci A and Galderisi S (2025) Detecting electrophysiological alterations in psychiatric disorders through event-related microstates: a systematic review. Front. Psychiatry 16:1591079. doi: 10.3389/fpsyt.2025.1591079
Received: 10 March 2025; Accepted: 22 August 2025;
Published: 17 September 2025.
Edited by:
Alireza Mohammadi, Baqiyatallah University of Medical Sciences, IranReviewed by:
Bastian Schiller, University of Freiburg, GermanySarah Kerins, King’s College London, United Kingdom
You Wang, Southern Medical University, China
Copyright © 2025 Perrottelli, Marzocchi, Di Lorenzo, D’Amelio, Sansone, Giuliani, Pezzella, Caporusso, Melillo, Giordano, Bucci, Mucci and Galderisi. This is an open-access article distributed under the terms of the Creative Commons Attribution License (CC BY). The use, distribution or reproduction in other forums is permitted, provided the original author(s) and the copyright owner(s) are credited and that the original publication in this journal is cited, in accordance with accepted academic practice. No use, distribution or reproduction is permitted which does not comply with these terms.
*Correspondence: Giorgio Di Lorenzo, ZGkubG9yZW56b0BtZWQudW5pcm9tYTIuaXQ=; Armida Mucci, YXJtaWRhLm11Y2NpQGdtYWlsLmNvbQ==
†These authors have contributed equally to this work and share first authorship