 Sijie He
 Houhong Li1
- 1Department of Pharmacy, Maternal and Child Health Hospital of Hubei Province, Tongji Medical College, Huazhong University of Science and Technology, Wuhan, China
- 2Department of Obstetrics and Gynecology, Maternal and Child Health Hospital of Hubei Province, Tongji Medical College, Huazhong University of Science and Technology, Wuhan, China
Background: Depression is a significant mental health concern among women. The objective of this study was to explore the relationship between reproductive factors such as parity and the frequency of different modes of delivery and depression.
Methods: The analysis was conducted based on the National Health and Nutrition Examination Survey (NHANES) 2005-2014, involving 5,401 non-pregnant women aged 20 years or older. Depression was evaluated using the Patient Health Questionnaire-9 (PHQ-9), while information on parity and delivery modes was self-reported. Multivariable logistic regression models were employed to investigate the association between parity, the frequency of vaginal and cesarean deliveries, and depression. Additionally, smooth curve fitting and subgroup analysis were performed.
Results: After adjusting for all covariates, higher parity (OR: 1.12, 95% CI: 1.06-1.19) and an increased frequency of vaginal deliveries (OR: 1.12, 95% CI: 1.06-1.18) were both associated with a higher prevalence of depression. Women with four or more total births exhibited a 1.78-fold greater prevalence of depression relative to those with no births. Similarly, compared to women with no vaginal deliveries or cesarean sections, the prevalence was 1.81 times higher in those with four or more vaginal deliveries and 2.03 times higher in those with four or more cesarean deliveries.
Conclusions: Greater parity, particularly a higher frequency vaginal deliveries, is significantly associated to an elevated prevalence of depression among women. The findings highlight the need to consider reproductive history in mental screening for women, especially those with multiple vaginal deliveries.
1 Introduction
Depression is a mood disorder characterized by persistent sadness and diminished capacity for pleasure accompanied by impairments in daily activities (1). Epidemiological studies consistently demonstrate a gender disparity, with women exhibiting higher prevalance compared to men (2). On the basis of this broad definition, the lifetime incidence of depression in the United States is more than 12% in men and 20% in women (3). The overall 12-month prevalence of depression is approximately 6%, while lifetime prevalence ranges from 15% to 18%, indicating that roughly 1 in 5 individuals will experience depression at some point in their lifetime (4). In the United States, 9% of adults experience major depressive disorder annually, with lifetime prevalence rates of 30% for women and 17% for men (5). Major depressive disorder places substantial economic burdens on both individual and societal levels, primarily due to high healthcare costs and lost productivity (6). The World Health Organization projects that by 2030, major depressive disorder could become the primary contributor to the global disease burden (7, 8). Depression can severely disrupt an individual’s work, education, and daily life, and may lead to serious outcomes such as suicide (9). Since depression often presents with nonspecific symptoms in its early stages, early diagnosis can be challenging. Understanding the risk factors contributing to its development is crucial for timely intervention.
The mode of delivery has been significantly linked to depression scores (10). An observational cohort study reported that depression prevalence at six weeks postpartum was higher in women who had cesarean section compared to those who had vaginal deliveries (3.79% vs. 2.35%) (11). However, no research has specifically investigated the link between the frequency of vaginal and cesarean deliveries and depression. Much of the current research on pregnancy and parity has focused on their effects on conditions such as retinopathy and nephropathy (12), periodontal disease (13), bone mineral density (14), type 2 diabetes mellitus (15, 16), and cancers (17, 18), with limited studies examining their relationship with depression. Systematic reviews have identified higher parity as a risk factor for postnatal depression (19). An observational study found a strong correlation between having four or more births and antenatal depression (β = 1.808, P = 0.020), but no significant link with postpartum depression (20). A previous study has explored the relationship between parity and cognitive function, depression, and chronic diseases among Chinese women with a history of childbirth, using the 15-item Geriatric Depression Scale to evaluate depressive symptoms. The study found no significant connection between parity and depression after accounting for confounding variables (21). Therefore, the correlation between parity and depression remains inconclusive.
To fill this gap, a large-scale cross-sectional study was conducted using data from the 2005–2014 National Health and Nutrition Examination Survey (NHANES) to investigate the association between parity, the frequency of vaginal and cesarean deliveries, and depression in U.S. women.
2 Methods
2.1 Data source and study population
The NHANES represents a nationally representative cross-sectional survey carried out in 2-year cycles. It comprises non-institutionalized civilian U.S. citizens who complete a comprehensive interview and undergo a medical and physiological examination, including laboratory tests. The study received approval from the National Centre for Health Statistics ethics review board, and all participants gave informed consent. All methods were performed in accordance with the relevant guidelines and regulations.
For this research, we utilized data from the 2005–2014 cycles of the NHANES, as only these cycles included detailed information on both the frequency of vaginal deliveries and cesarean deliveries. As shown in Figure 1, of the 50,790 individuals initially enrolled, we excluded males (n = 25,165), participants under 20 years old (n = 11,008), those who were pregnant (n = 469) or breastfeeding (n = 165), and those with incomplete data on depression (n = 2,228) or parity (n = 6,354), resulting in a final sample of 5,401 individuals.
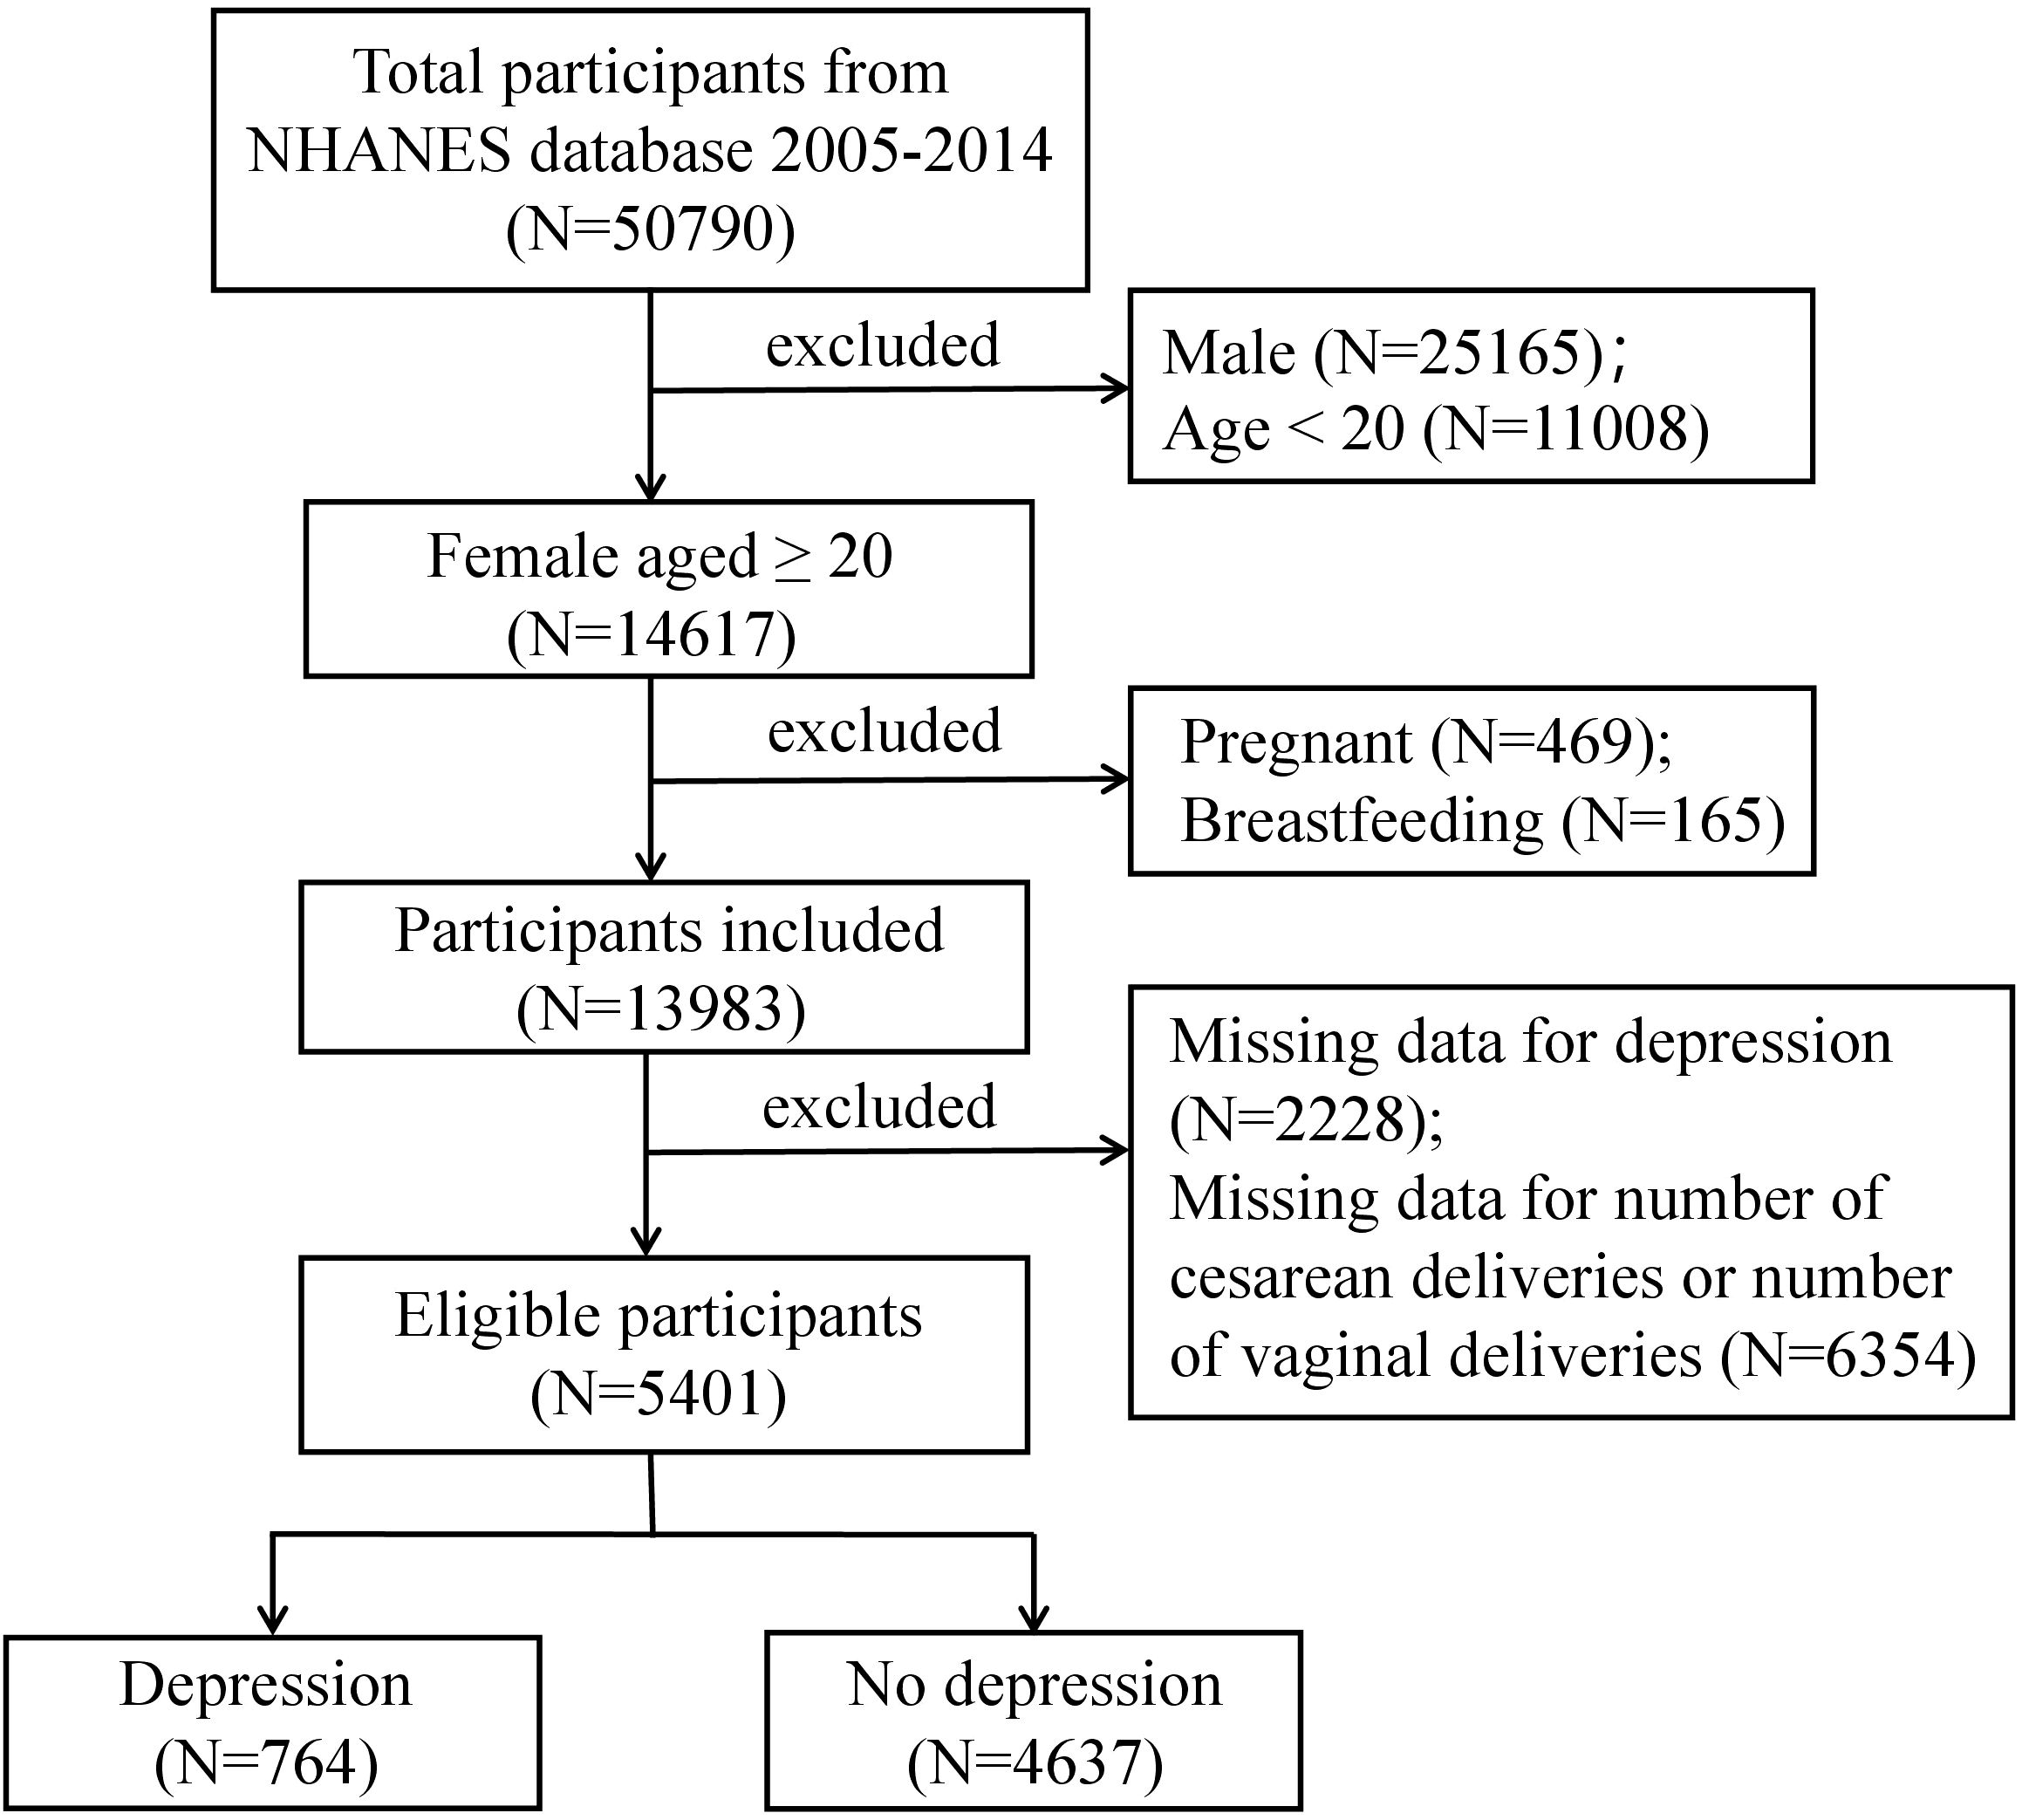
Figure 1. Flowchart of participants selection. A total of 50,790 participants were included, and after exclusions, the final number of participan was 5,401.
2.2 Study variables
The NHANES utilizes the Patient Health Questionnaire (PHQ-9) to assess the presence and severity of depression among participants. This self-reported questionnaire evaluates the past two weeks using nine criteria from the DSM-IV for diagnosing depression. Each of the nine questions is rated on a scale from “0” (not at all) to “3” (nearly every day). The total score, ranging between 0 and 27, is calculated by summing the responses to the nine questions (22). A score of 10 or above indicates the presence of depression, while a score below 10 suggests its absence (23, 24). The frequency of vaginal deliveries is assessed using the questionnaire item coded RHQ166 (“How many vaginal deliveries have you had?”), and the frequency of cesarean deliveries is captured through RHQ169 (“How many cesarean deliveries have you had?”). Both measures include stillbirths and live births. The sum of these two values represents the total parity. Based on previous research and clinical practice experience, several potential confounding factors that could influence the association between parity, the frequency of vaginal deliveries and cesarean deliveries, and depression were accounted for (25), including demographic characteristics, lifestyle factors, physical examinations, and physical conditions. Demographic factors considered in this study included age, race/ethnicity, marital status, and education level. Race/ethnicity was divided into four categories: Mexican American, non-Hispanic White, non-Hispanic Black, and other races. Marital status was categorized as married/living with partner, widowed/divorced/separated, and never married. Education level was grouped into two categories: less than high school and high school or higher. Lifestyle factors included smoking status, which was defined as either “no” (smoked fewer than 100 cigarettes in life) or “yes” (smoked at least 100 cigarettes in life). Physical examination measures focused on body mass index (BMI). Physical conditions included diabetes, hypertension, and cancer or malignancy.
2.3 Statistical analysis
All estimates were calculated using sampling weights following the National Center for Health Statistics guidelines, ensuring the representativeness of the NHANES data for the civilian non-institutionalized populations in the U.S. These weights were adjusted by dividing by the number of cycles included. The mean ± SD was used for continuous variables to express central tendency and dispersion. Group differences in baseline data were assessed using t-tests for continuous variables with a normally distributed and the Mann-Whitney U test for non-normally distributed variables in two-group comparisons. For multi-group comparisons, One-way ANOVA was used for continuous variables with a normal distribution, while the Kruskal-Wallis test was applied for continuous variables with a non-normal distribution. Categorical variables were expressed as percentages and analyzed using the χ2 test. Weighted multivariable logistic regression analysis was conducted to evaluate the relationship between parity, the frequency of vaginal deliveries and cesarean deliveries, and depression. Odds ratios (ORs) and 95% confidence intervals (CIs) were computed to assess the strength and precision (26). Three models were developed for the multivariable test. Model 1 did not include any adjustments. Model 2 included adjustments for age and race/ethnicity, while Model 3 incorporated adjustments for all covariates. Smooth curve fitting was applied further to clarify the trend between the relationship between parity, the frequency of vaginal deliveries, and depression. Subgroup analyses were also performed to investigate potential differences in the relationship between parity, vaginal deliveries, and depression across different populations. Packages R (The R Foundation: http://www.r-project.org; version 4.4.1) and Empower Stats (www.empowerstats.com, X&Y solutions, Inc. Boston, Massachusetts) were applied to statistical analysis, with a P-less than 0.05 regarded as statistically significant.
3 Results
3.1 Baseline characteristics of the depression group versus the non-depression group
Table 1 presents the weighted baseline characteristics of the study participants based on their depression status. Unweighted baseline data is provided in the Supplementary Table S1 online. This study included 5,401 women aged over 20 years, with 764 being categorized as having depression and 4,637 not having it. The average age of the participants was 48.40 ± 14.81 years. Women with depression tended to be younger (46.27 years vs 48.68 years), had lower education levels (less than High school: 27.24% vs 15.64%), had lower rates of being unmarried (never married: 49.87% vs 64.82%) and higher rates of obesity (≥ 30: 51.69% vs 39.32%). Additionally, they showed a higher prevalence of diabetes (16.20% vs 8.04%), hypertension (45.20% vs 32.00%), and cancer or malignancy (14.08% vs 10.88%), and were more likely to have a smoking history (61.78% vs 43.67%).
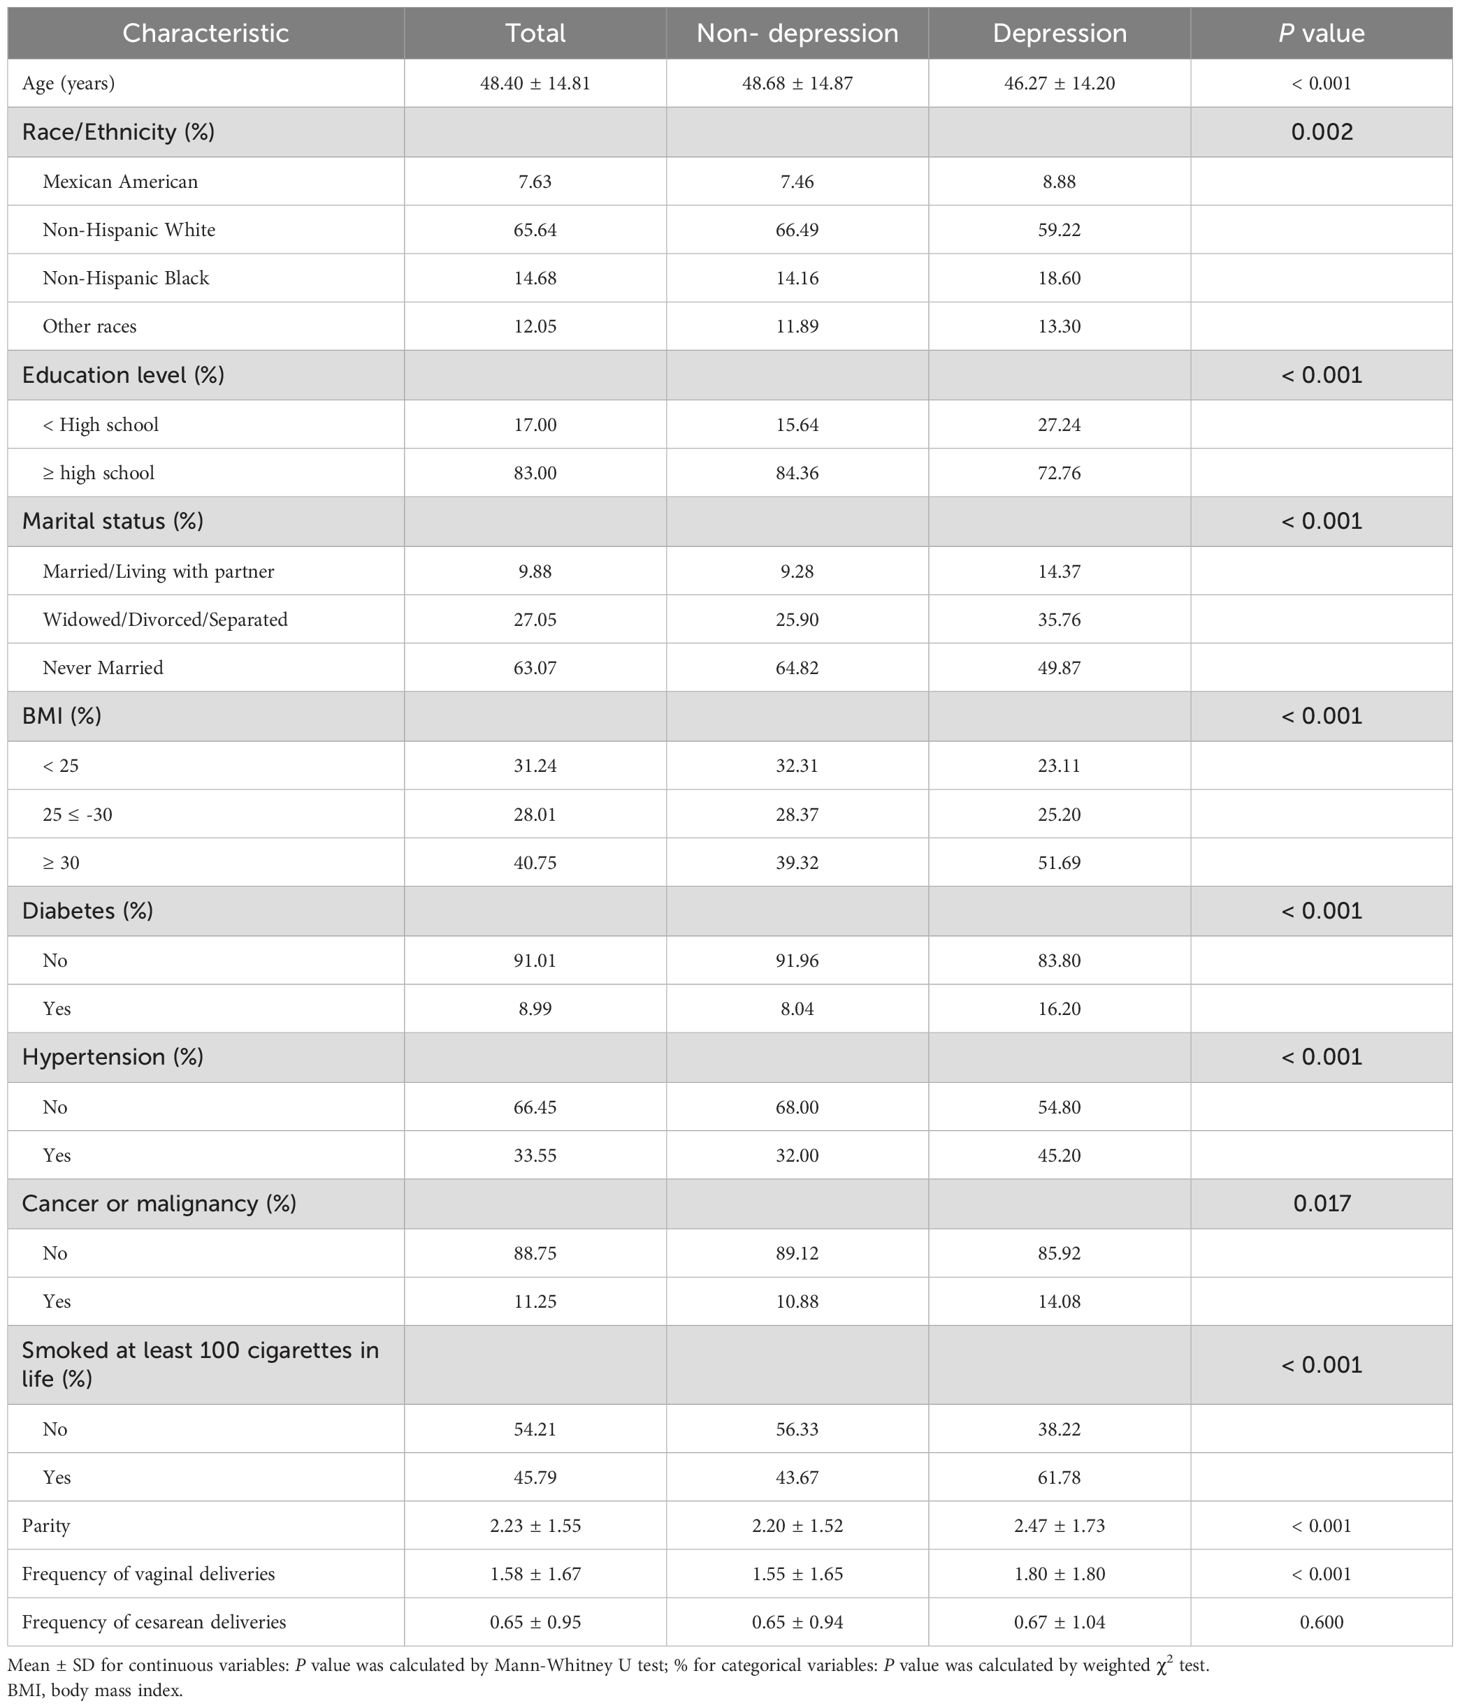
Table 1. Baseline characteristics of study participants based on the presence of depression.
3.2 Baseline characteristics according to parity categories
The study population was divided into five parity groups: nulliparous (no births), one birth, two births, three births, and four or more births. Significant differences in baseline characteristics were observed across these groups (Table 2). Higher parity was associated with older age, a higher proportion of Mexican Americans, lower educational attainment, and lower marriage rates (P < 0.05). Additionally, women with higher parity had greater BMI and higher rates of diabetes, hypertension, cancer, smoking history, and depression (P < 0.05).
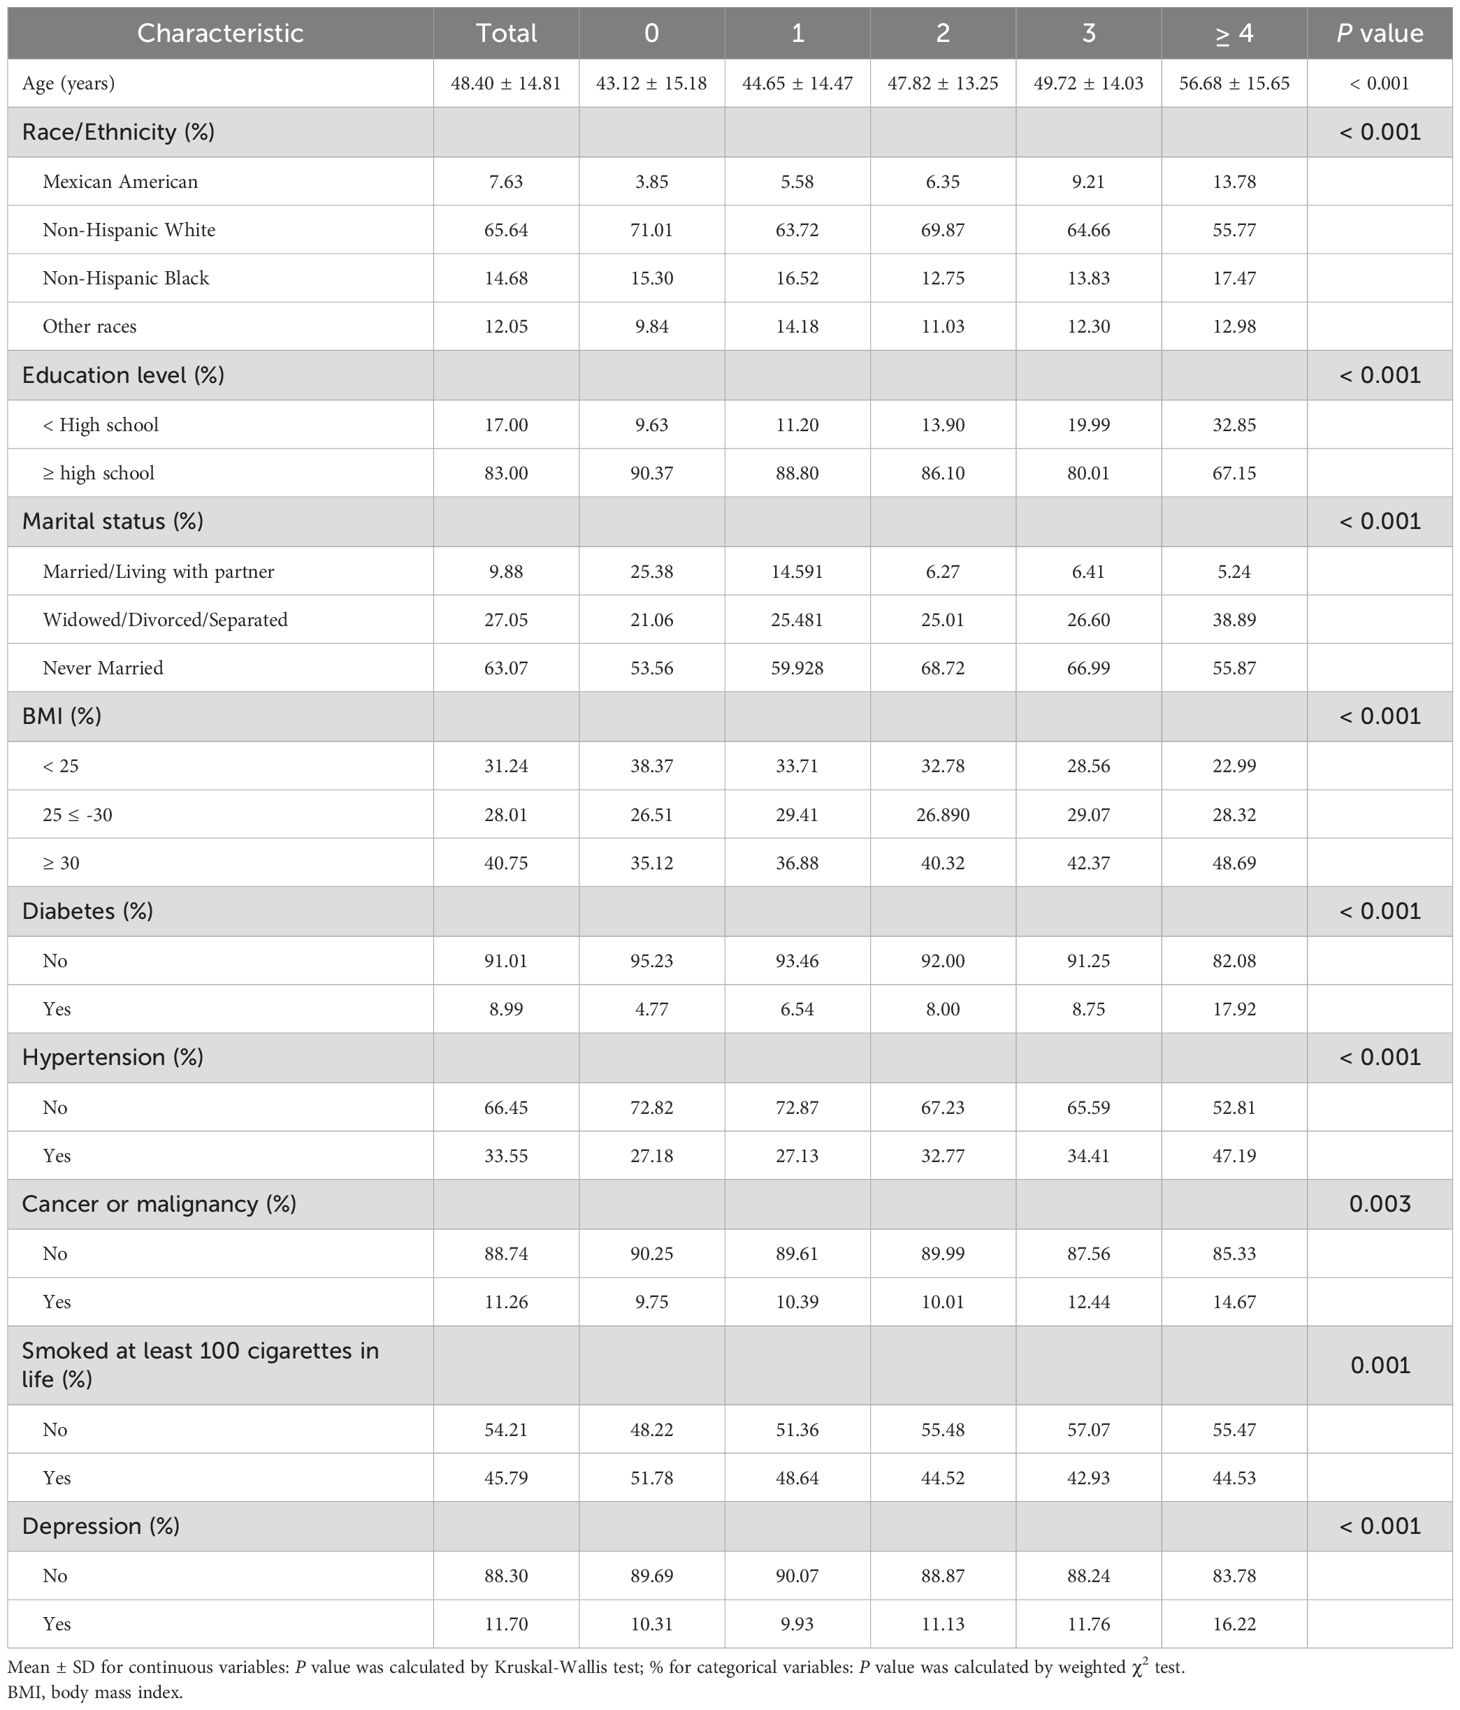
Table 2. Baseline characteristics according to parity categories.
3.3 Linear relationship between parity and depression
Table 3 presents the ORs, 95% CIs, and corresponding P values of the relationship between parity and depression. In the unadjusted model, each additional birth corresponded to an 11% rise in the prevalence of depression (OR: 1.11, 95% CI: 1.06-1.17). In Model 2, which accounted for age and race/ethnicity, the prevalence of depression increased by 16% with each additional birth (OR: 1.16, 95% CI: 1.09-1.122). In Model 2, higher parity was consistently associated with a higher prevalence of depression (OR: 1.12, 95% CI: 1.06-1.19). Furthermore, in Model 3, women who had given birth four or more times experienced a 1.78-fold higher prevalence of depression than women who had never given birth. As shown in Figure 2A, smooth curve fittings demonstrated a strong linear relationship between parity and depression.
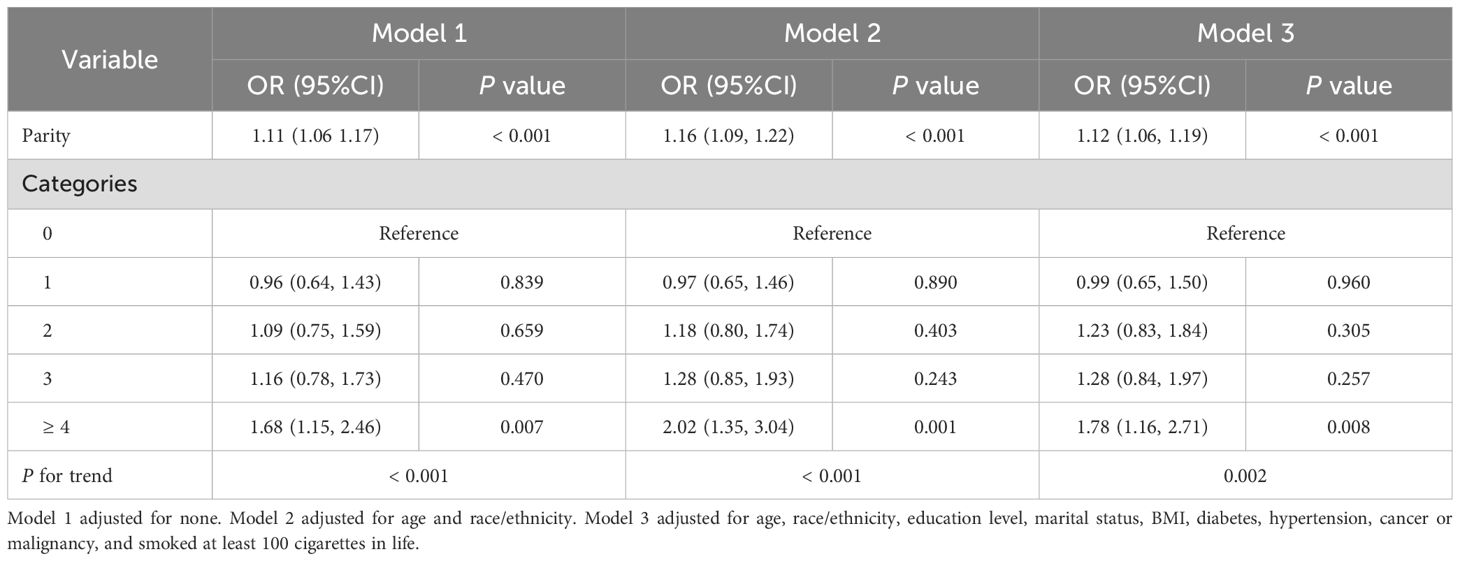
Table 3. Association between parity and depression.
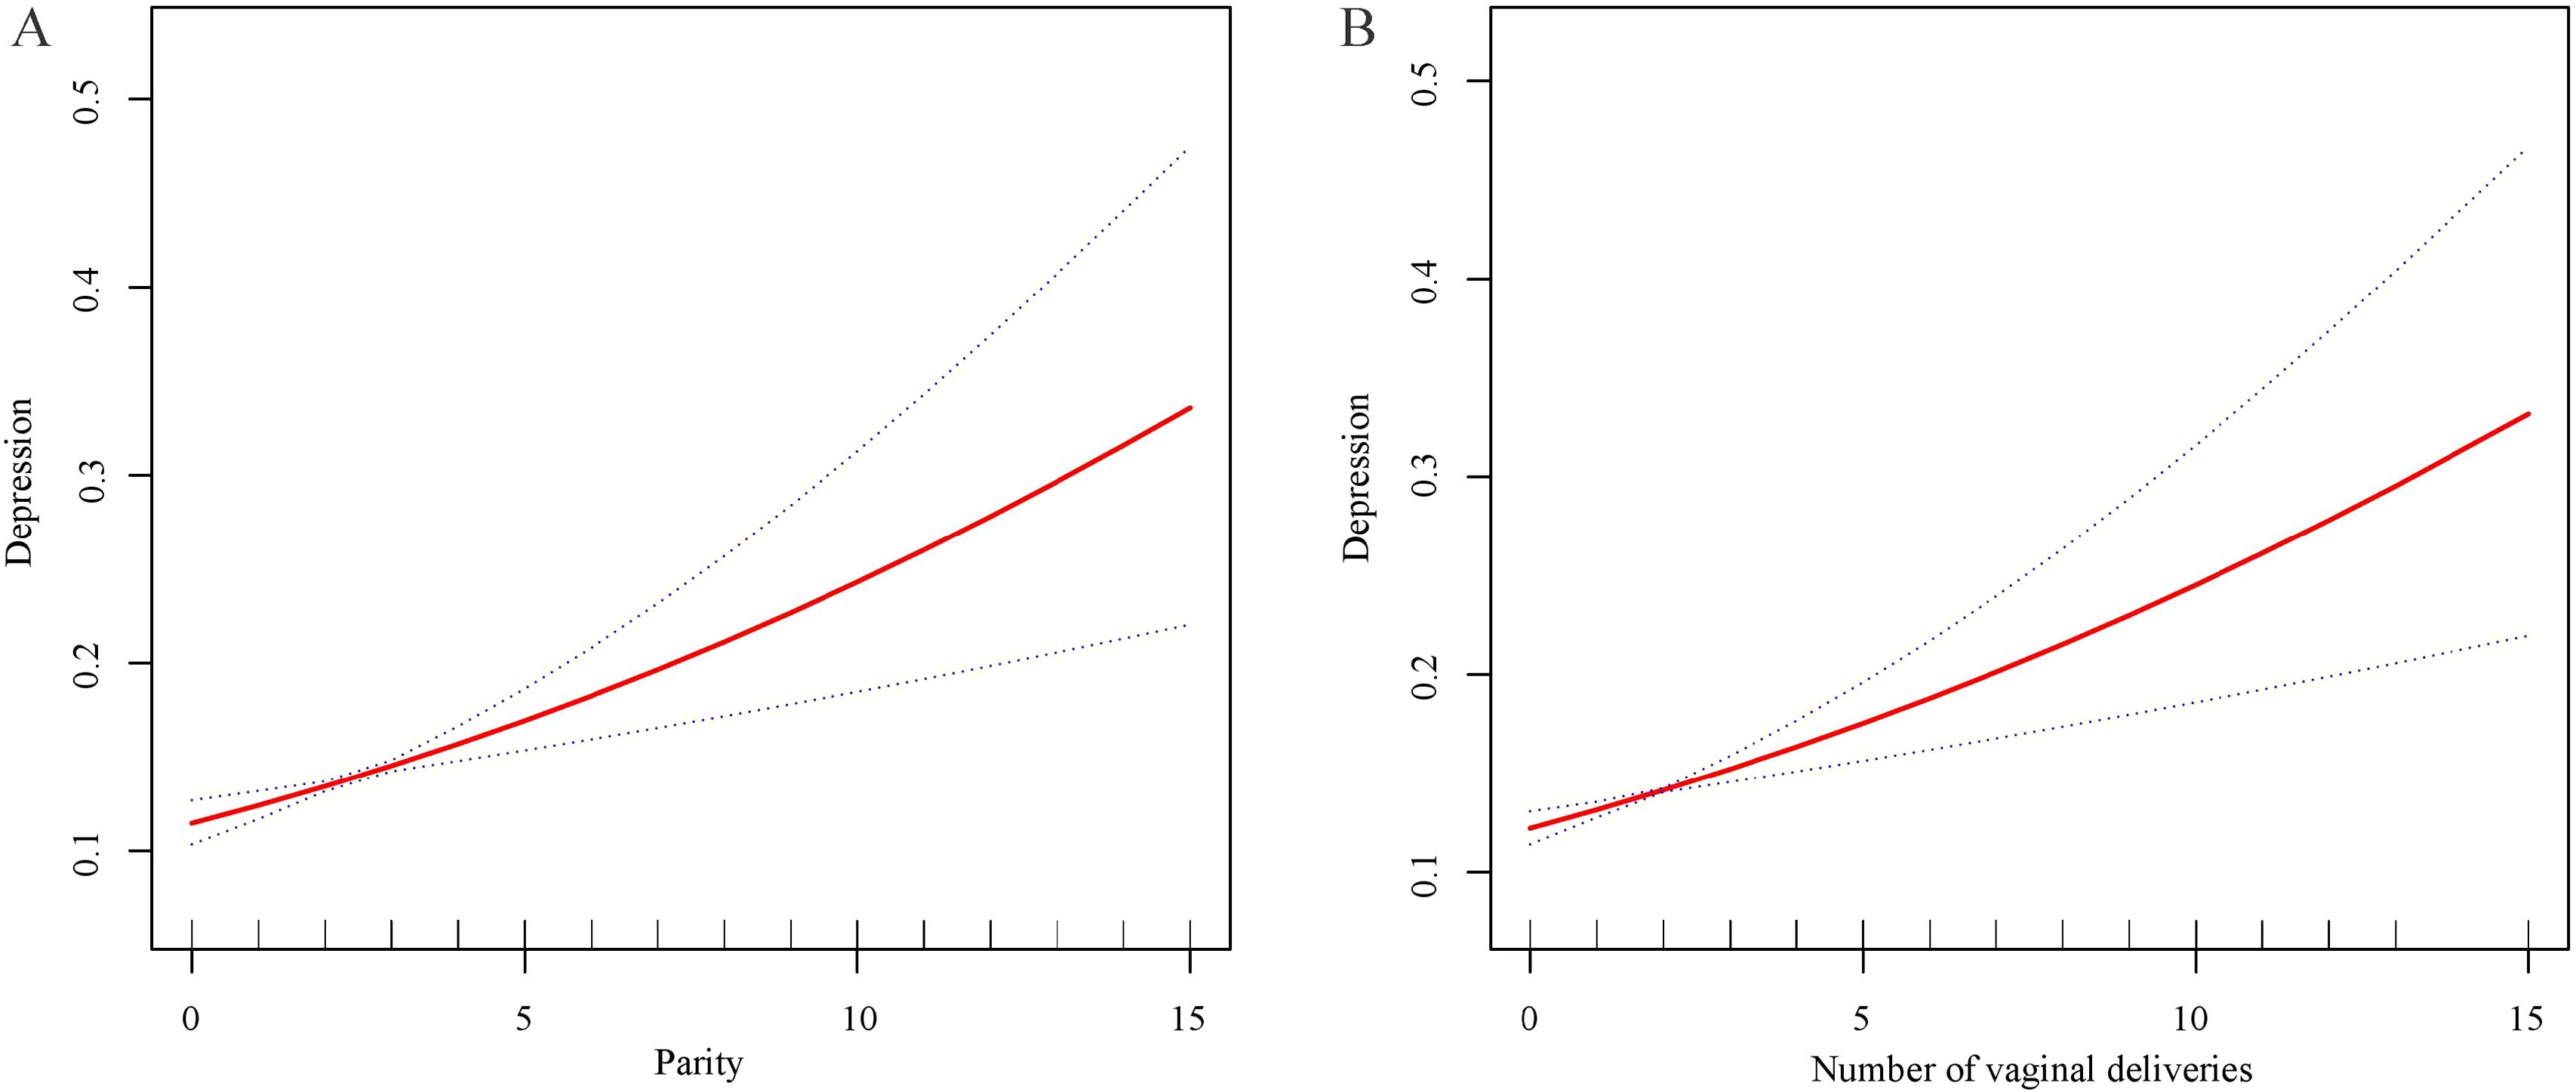
Figure 2. Smooth curve fittings. (A) The trend of the association between parity and depression. (B) The trend of the association between the frequency of vaginal deliveries and depression.
3.4 Association between the frequency of vaginal deliveries and cesarean deliveries with depression
The relationship between the frequency of vaginal deliveries and cesarean deliveries and depression was further explored (Table 4). In Model 1, each additional vaginal delivery increases the prevalence of depression by 9% (OR: 1.09, 95% CI: 1.04-1.14). After adjusting for age and race/ethnicity in Model 2, each additional vaginal delivery increases the prevalence of depression by 14% (OR: 1.14, 95% CI: 1.08-1.20). In the fully adjusted model, this positive correlation persisted, with each additional vaginal delivery increasing the prevalence of depression by 12% (OR: 1.12, 95% CI: 1.06-1.18). Specifically, the findings indicated significant positive associations among women with two (OR: 1.55, 95% CI: 1.15-2.10), three (OR: 1.46, 95% CI: 1.04-2.07), and four or more times (OR: 1.81, 95% CI: 1.31-2.51) vaginal deliveries compared to those with no vaginal deliveries. Smooth curve fittings further confirmed a linear relationship between vaginal delivery frequency and depression (Figure 2B). Additionally, when the frequency of cesarean deliveries was treated as a continuous variable, no significant association with depression was observed (Table 4). However, after converting the frequency of cesarean sections into a categorical variable, women who had undergone four or more cesarean deliveries had a 2.03 times higher depression prevalence compared to individuals who had never experienced a cesarean section (OR: 2.03, 95% CI: 1.01-4.10) (Table 4).
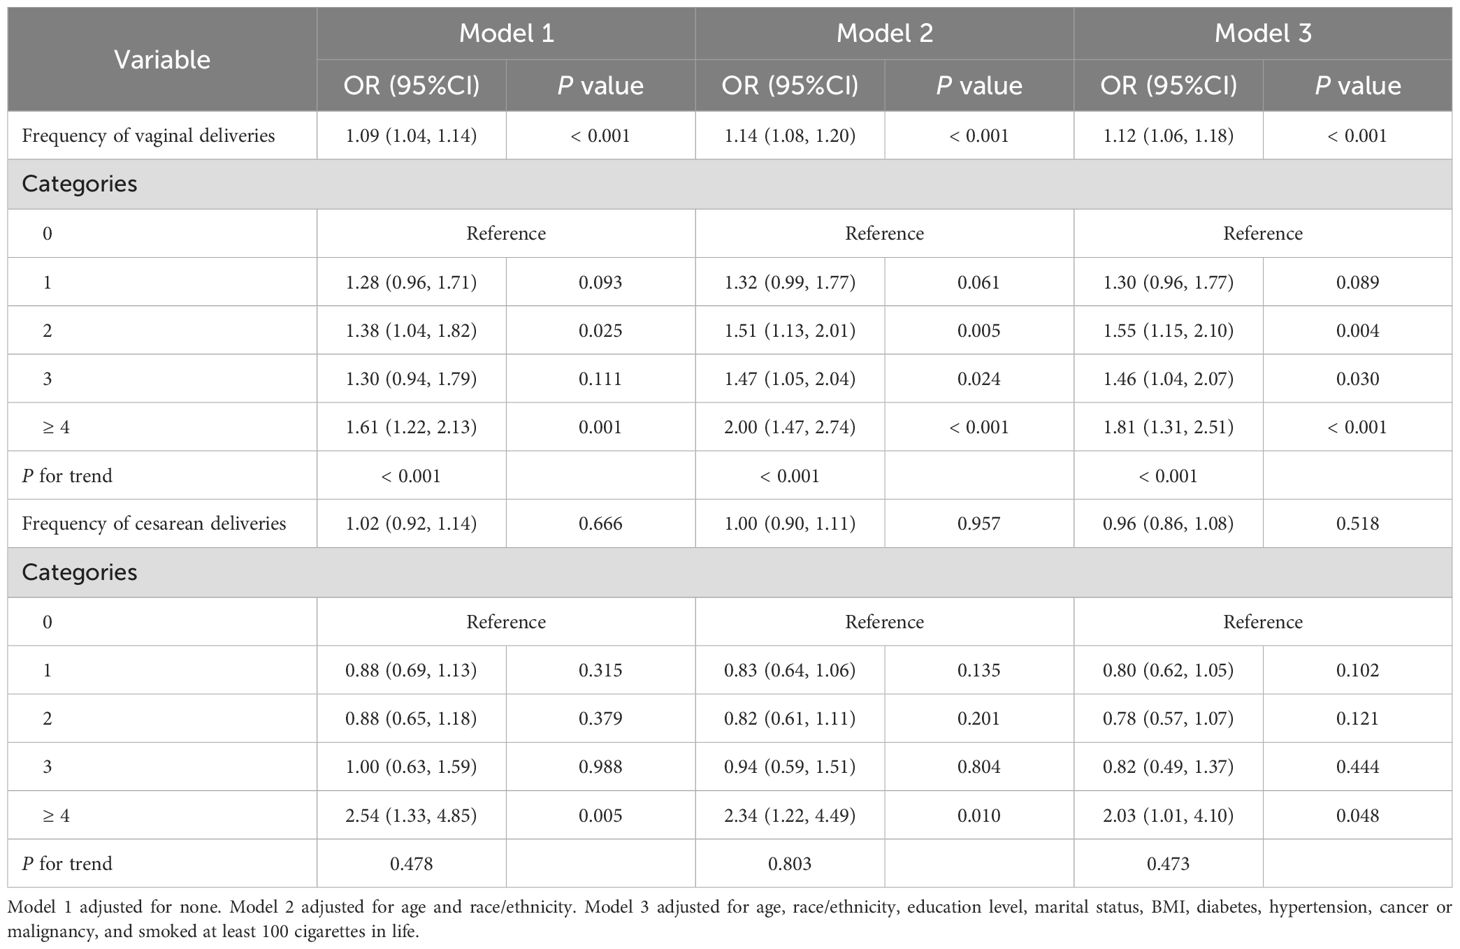
Table 4. Association between the frequency of vaginal deliveries, the frequency of cesarean deliveries, and depression.
3.5 Subgroup analysis
The robustness of the relationship between parity, the frequency of vaginal deliveries, and depression was further evaluated by subgroup analyses. A significant association between parity and depression was identified among women aged 20–40 years (OR: 1.20, 95% CI: 1.07-1.35), those with a BMI < 25 (OR: 1.26, 95% CI: 1.13-1.41), a BMI between 25 and 30 (OR: 1.18, 95% CI: 1.05-1.33), women without hypertension (OR: 1.21 95% CI: 1.11-1.31), and those who had smoked at least 100 cigarettes in life (OR: 1.17, 95% CI: 1.08-1.26) (Table 5). While no associations were found in women aged 41–55 years and 56–85 years, those with a BMI ≥ 30, hypertension, or those who had a smoking history. Moreover, the relationship between parity and depression persisted consistently across the rest of the subgroups, including race/ethnicity, education level, marital status, diabetes, and cancer or malignancy (P for interaction > 0.05) (Table 5).
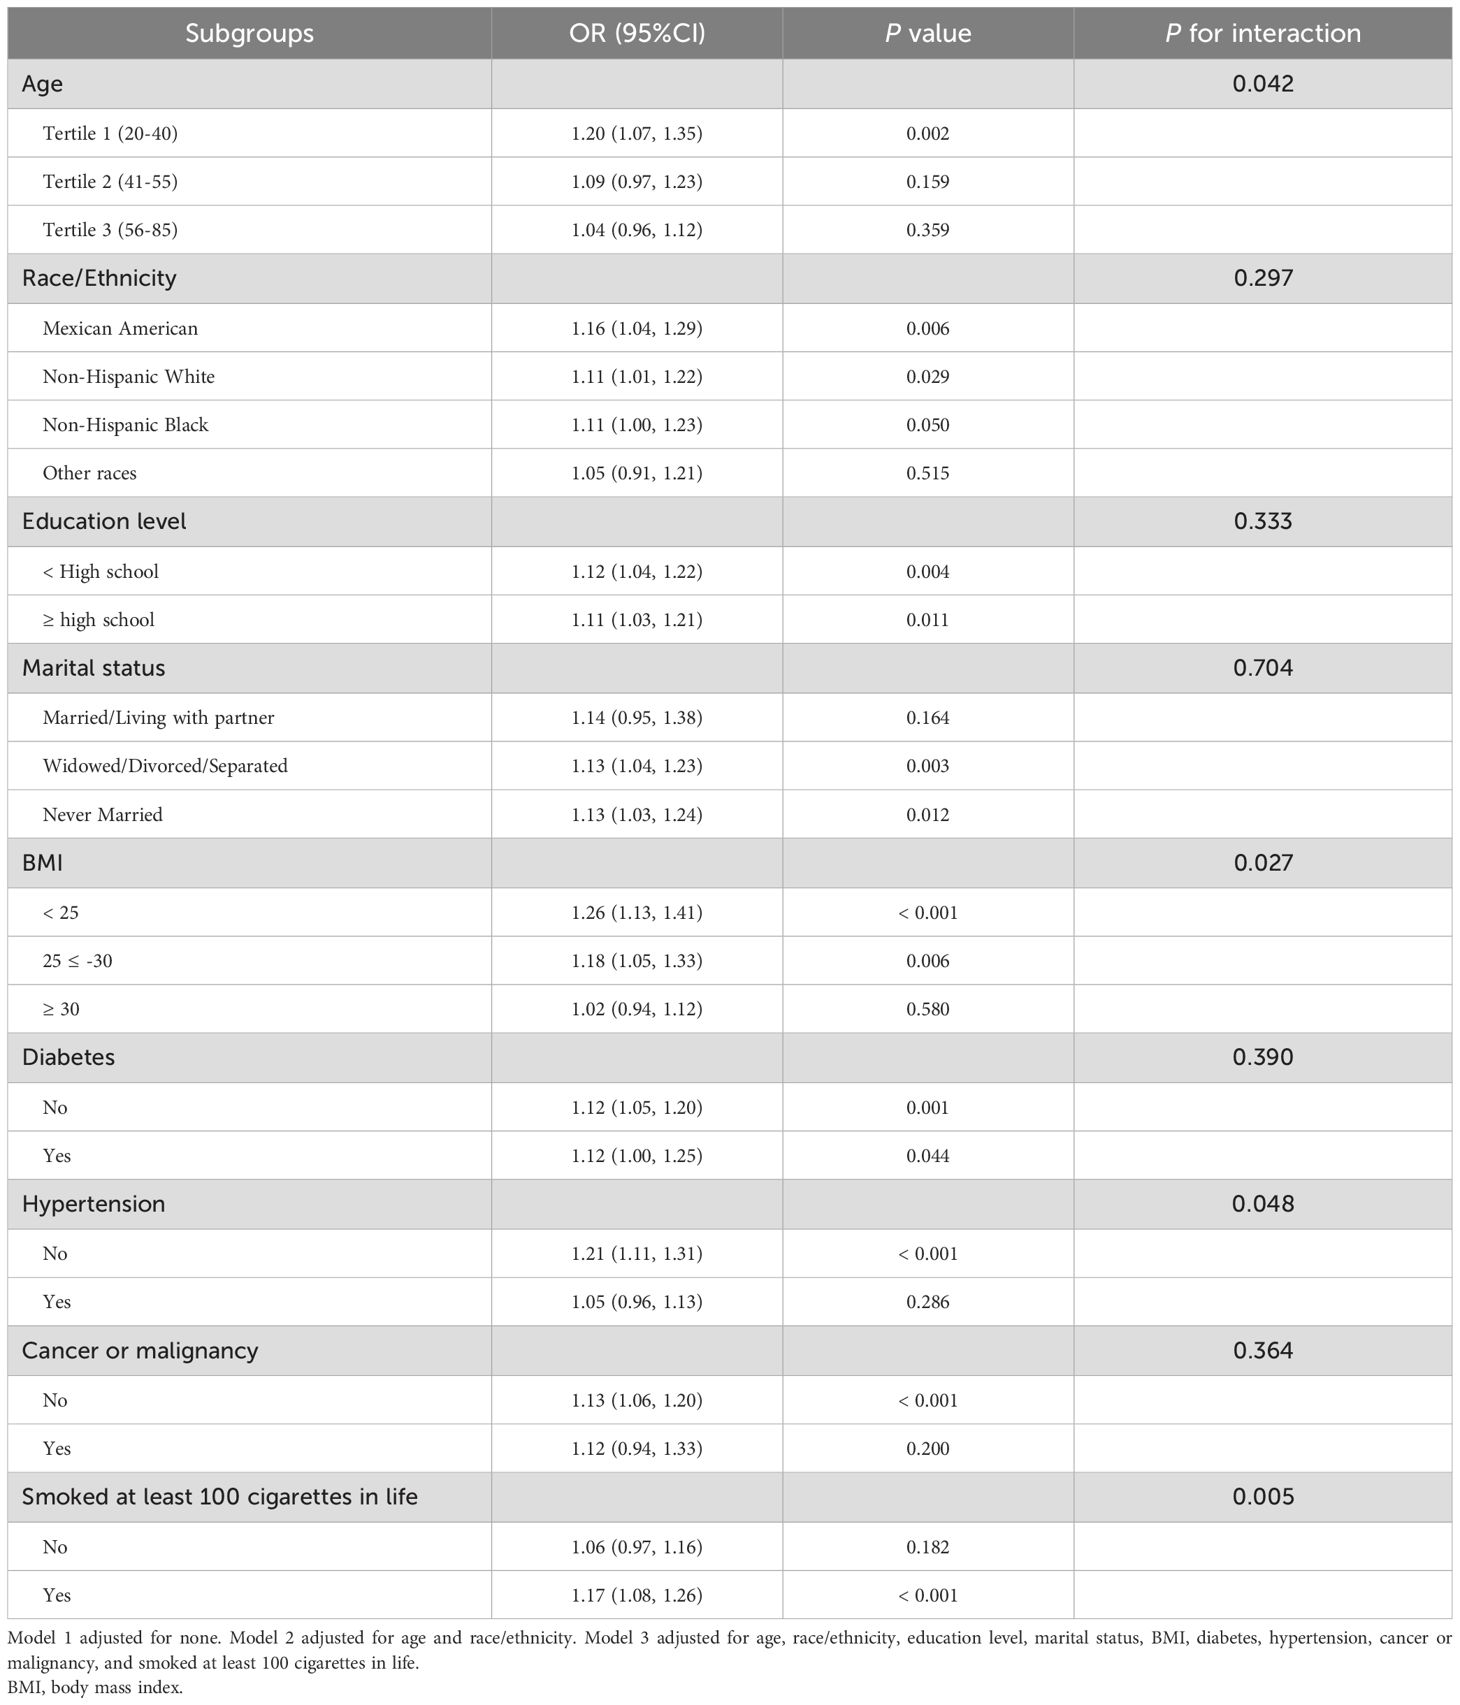
Table 5. Subgroup analysis for the associations between parity and depression.
Similarly, a significant relationship between vaginal delivery frequency and depression was observed among women aged 20–40 years (OR: 1.24, 95% CI: 1.11-1.38) and 42–56 years (OR: 1.12, 95% CI: 1.01-1.24), women with a BMI < 25 (OR: 1.25, 95% CI: 1.12-1.39), a BMI between 25 and 30 (OR: 1.19, 95% CI: 1.06-1.33), those without cancer or malignancy (OR: 1.14, 95% CI: 1.08-1.21), and those who had a smoking history (OR: 1.19, 95% CI: 1.11-1.28) (Table 6). No significant associations were found among women aged 41–55 years, 56–85 years, those with a BMI ≥ 30, cancer or malignancy, or those who smoked less than 100 cigarettes in life. Furthermore, the relationship between vaginal delivery frequency and depression persisted consistently across race/ethnicity, education level, marital status, diabetes, and hypertension (P for interaction > 0.05) (Table 6).

Table 6. Subgroup analysis for the associations between the frequency of vaginal deliveries and depression.
4 Discussion
This study presented positive linear correlations between parity, the frequency of vaginal deliveries, and depression. The prevalence of depression was 1.78, 1.81, and 2.03 times higher in women with four or more total births, vaginal deliveries, and cesarean deliveries, respectively, compared to those with no history of childbirth, vaginal delivery, or cesarean section. The findings emphasize the critical role of parity and the frequency of vaginal deliveries and cesarean deliveries in understanding the likelihood of getting depression.
As far as we know, this is the pioneering work that looks into the association between parity, as well as the frequency of vaginal and cesarean deliveries, with depression. Current epidemiological evidence is limited. Prior research has primarily explored the association between parity and other health outcomes, including cognition (27), bone mineral density (28), inflammation (29), and thyroid autoimmunity (30). While multiple studies have identified a relationship between fertility and depression in women, particularly during the perinatal period, which is a high-risk time for developing depression (31–33), the specific impact of the frequency of vaginal or cesarean deliveries on depression remains unexplored. Bennett et al. reviewed the literature and reported that the incidence of depression during various stages of pregnancy ranges from approximately 7.4% to 12.8% (34). A secondary cohort study conducted between 2015 and 2016 identified operative vaginal delivery as a risk factor for postpartum depression (PPD) (35). Chaaya et al. also reported that vaginal deliveries were related to an increased risk of PPD (36). Consistent with these findings, our study observed that higher parity and more frequent vaginal deliveries were independently linked to a greater prevalence of depression. Nonetheless, a few studies have reported contradictory findings (21, 37, 38). Tammentie et al. conducted a study using the Edinburgh Postnatal Depression Scale (EPDS) and demographic questionnaire mailed to families in Edinburgh, concluding that factors such as parity or delivery method were not correlated with depressive symptoms (37). Similarly, a cross-sectional hospital-based survey of 2305 pregnant and post-partum women (18–48 years) identified parity as a risk factor for antenatal depressive symptoms but not for postnatal depression (20). Several factors may explain the differences between these studies and our findings. One possible reason is the variation in depression assessment tools: the studies cited above used the EPDS to evaluate prenatal and postnatal depression, while our study employed the PHQ-9, which assesses a broader range of depression symptoms. Additionally, these studies focused on different populations, which introduces potential cultural, socioeconomic, and healthcare system differences that may influence the relationship between parity and depressive symptoms. These differences warrant further investigation to fully understand the differences in findings.
The positive association between parity and the frequency of vaginal deliveries and depression may be explained through several potential mechanisms. First, repeated pregnancies and vaginal deliveries can impose cumulative physical and psychological stress on women and increase the risk of depression-related chronic health issues (39–41), such as pelvic floor dysfunction, chronic pain, fatigue, and metabolic syndrome (42). In addition, having multiple children often leads to increased parenting demands, financial strain, and caregiving responsibilities, all of which are known to contribute to depression (43). Second, hormonal changes associated with pregnancy and labor can also contribute to mood regulation, increasing the risk of depression (44, 45). PPD, a well-documented concern (46, 47), may partly explain the connection between higher parity and an elevated risk of depressive symptom. Third, high parity is often associated with greater economic challenges, longer work hours, and lower savings, which may contribute to long-term depression (21). Furthermore, the relationship between the frequency of vaginal deliveries and depression may be partially explained by the physical discomfort and pain experienced during and after procedures such as episiotomies, tear repairs, or forceps application, which could be an underlying mechanism (48).
Subgroup analyses indicated that the correlation between parity, vaginal delivery frequency, and depression was more pronounced among certain demographic groups. Women with lower BMI and younger age may experience heightened reproductive pressure, hormonal changes, and caregiving demands, all of which are known contributors to depression risk (45, 49, 50). Smokers, who may already have a higher predisposition to mental health challenges (51), could be more vulnerable to the negative effects of childbirth on mental well-being. Additionally, the association between parity and depression was more pronounced in women without hypertension, while it was not significant in those with hypertension. This may be explained by the chronic burden of hypertension masking the influence of childbirth on depression. Similarly, the correlation between vaginal delivery frequency and depression was notable among women without cancer but was not significant among cancer patients. The complex physical and psychological stressors associated with cancer may reduce the effect of delivery mode on depression risk. Further investigation is essential to verify these results and explore the pathways behind these subgroup differences.
This study possesses multiple strengths. First, it utilized nationally representative NHANES data with a large sample size, allowing generalization to the broader U.S. female population. Second, we adjusted for several potential confounding factors, which strengthens the reliability of the results. Third, detailed subgroup analyses were conducted, revealing specific relationships between parity, the frequency of vaginal deliveries, and depression in certain groups, offering a foundation for future research. However, several limitations need to be noted. As a cross-sectional study, causal relationships between depression and parity or the frequency of vaginal deliveries cannot be established. Future research could benefit from using a prospective cohort design to follow women over time, examining changes in reproductive history and depression to clarify potential causal relationships. Additionally, although multiple confounders were controlled, unmeasured variables such as social support or economic stress could still influence the observed relationship between childbirth and depression. Furthermore, self-reported data on depression and childbirth could result in recall or reporting bias, potentially affecting the reliability of the results. However, NHANES employs standardized questionnaires to minimize reporting bias. Future studies could incorporate clinical diagnoses of depression to enhance the accuracy of the findings.
5 Conclusion
Our findings highlight a potential connection between parity, the frequency of vaginal deliveries, the frequency of cesarean deliveries, and depression in women, with particularly significant relationships observed in certain subgroups. These findings provide valuable insights for public health policymakers and clinicians, emphasizing the need for mental health screening and targeted mental health interventions for women with a history of multiple childbirths, especially those with repeated vaginal deliveries.
Data availability statement
Publicly available datasets were analyzed in this study. This data can be found here: https://www.cdc.gov/nchs/nhanes/index.htm.
Ethics statement
The studies involving humans were approved by NCHS Ethics Review Board (ERB) Approval. The studies were conducted in accordance with the local legislation and institutional requirements. The participants provided their written informed consent to participate in this study.
Author contributions
SH: Conceptualization, Data curation, Investigation, Methodology, Software, Writing – original draft, Writing – review & editing. HL: Investigation, Writing – review & editing. FX: Investigation, Writing – review & editing. WL: Investigation, Writing – review & editing. LW: Investigation, Writing – review & editing. HZ: Software, Writing – review & editing.
Funding
The author(s) declare that no financial support was received for the research and/or publication of this article.
Conflict of interest
The authors declare that the research was conducted in the absence of any commercial or financial relationships that could be construed as a potential conflict of interest.
Generative AI statement
The author(s) declare that no Generative AI was used in the creation of this manuscript.
Publisher’s note
All claims expressed in this article are solely those of the authors and do not necessarily represent those of their affiliated organizations, or those of the publisher, the editors and the reviewers. Any product that may be evaluated in this article, or claim that may be made by its manufacturer, is not guaranteed or endorsed by the publisher.
Supplementary material
The Supplementary Material for this article can be found online at: https://www.frontiersin.org/articles/10.3389/fpsyt.2025.1595829/full#supplementary-material
References
1. McCarron RM, Shapiro B, Rawles J, and Luo J. Depression. Ann Internal Med. (2021) 174:Itc65–itc80. doi: 10.7326/aitc202105180
2. Global incidence, prevalence, years lived with disability (YLDs), disability-adjusted life-years (DALYs), and healthy life expectancy (HALE) for 371 diseases and injuries in 204 countries and territories and 811 subnational locations, 1990-2021: a systematic analysis for the Global Burden of Disease Study 2021. Lancet. (2024) 403:2133–61. doi: 10.1016/s0140-6736(24)00757-8
3. Belmaker RH and Agam G. Major depressive disorder. New Engl J Med. (2008) 358:55–68. doi: 10.1056/NEJMra073096
4. Malhi GS and Mann JJ. Depression. Lancet (London England). (2018) 392:2299–312. doi: 10.1016/s0140-6736(18)31948-2
5. Simon GE, Moise N, and Mohr DC. Management of depression in adults: A review. Jama. (2024) 332:141–52. doi: 10.1001/jama.2024.5756
6. Greenberg P, Chitnis A, Louie D, Suthoff E, Chen SY, Maitland J, et al. The economic burden of adults with major depressive disorder in the United States (2019). Adv Ther. (2023) 40:4460–79. doi: 10.1007/s12325-023-02622-x
8. Wang P, Shen X, Wang Y, and Jia X. Association between constipation and major depression in adult Americans: evidence from NHANES 2005-2010. Front Psychiatry. (2023) 14:1152435. doi: 10.3389/fpsyt.2023.1152435
9. Misiak B, Szewczuk-Bogusławska M, Samochowiec J, Moustafa AA, and Gawęda Ł. Unraveling the complexity of associations between a history of childhood trauma, psychotic-like experiences, depression and non-suicidal self-injury: A network analysis. J Affect Disord. (2023) :337:11–17. doi: 10.1016/j.jad.2023.05.044
10. Bhakta M, Satapathy DM, Padhy M, Dalai S, Panda JN, Marandi P, et al. Assessing the prevalence and risk factors of postpartum depression: A cross-sectional study conducted in the urban areas of ankuli in southern odisha. Cureus. (2024) 16:e61503. doi: 10.7759/cureus.61503
11. Doke PP, Vaidya VM, Narula APS, Datar MC, Patil AV, Panchanadikar TM, et al. Assessment of difference in postpartum depression among caesarean and vaginally delivered women at 6-week follow-up in hospitals in Pune District, India: an observational cohort study. BMJ Open. (2021) 11:e052008. doi: 10.1136/bmjopen-2021-052008
12. Zurawska-Klis M and Cypryk K. The impact of pregnancy and parity on type 1 diabetes complications. Curr Diabetes Rev. (2019) 15:429–34. doi: 10.2174/1573399815666190115143538
13. Morelli EL, Broadbent JM, Leichter JW, and Thomson WM. Pregnancy, parity and periodontal disease. Aust Dental J. (2018) 63:270–8. doi: 10.1111/adj.12623
14. Song SY, Kim Y, Park H, Kim YJ, Kang W, and Kim EY. Effect of parity on bone mineral density: A systematic review and meta-analysis. Bone. (2017) 101:70–6. doi: 10.1016/j.bone.2017.04.013
15. Guo P, Zhou Q, Ren L, Chen Y, and Hui Y. Higher parity is associated with increased risk of Type 2 diabetes mellitus in women: A linear dose-response meta-analysis of cohort studies. J Diabetes its Complic. (2017) 31:58–66. doi: 10.1016/j.jdiacomp.2016.10.005
16. Li P, Shan Z, Zhou L, Xie M, Bao W, Zhang Y, et al. MECHANISMS IN ENDOCRINOLOGY: Parity and risk of type 2 diabetes: a systematic review and dose-response meta-analysis. Eur J Endocrinol. (2016) 175:R231–45. doi: 10.1530/eje-16-0321
17. Dahabreh IJ, Trikalinos TA, and Paulus JK. Parity and risk of lung cancer in women: systematic review and meta-analysis of epidemiological studies. Lung Cancer (Amsterdam Netherlands). (2012) 76:150–8. doi: 10.1016/j.lungcan.2011.10.014
18. Fishman A. The effects of parity, breastfeeding, and infertility treatment on the risk of hereditary breast and ovarian cancer: a review. Int J Gynecol Cancer. (2010) 20:S31–3. doi: 10.1111/IGC.0b013e3181f60d4d
19. Howard LM, Molyneaux E, Dennis CL, Rochat T, Stein A, and Milgrom J. Non-psychotic mental disorders in the perinatal period. Lancet (London England). (2014) 384:1775–88. doi: 10.1016/s0140-6736(14)61276-9
20. Barat S, Shahrokhi S, Mirtabar SM, Kheirkhah F, Basirat Z, Shirafkan H, et al. Prevalence and risk factors of prenatal and postnatal depressive symptoms in babol pregnancy mental health registry: A cross-sectional study. Int J Fertil Steril. (2024) 18:271–7. doi: 10.22074/ijfs.2023.1983056.1412
21. Zhou L, Chen X, Zhang G, Sui Y, Hou L, Hu F, et al. Associations of parity and cognitive decline, depression, and chronic comorbidity in West China: Results from WCHAT study. Int J Gynaecol Obstet. (2024) 167:1010–6. doi: 10.1002/ijgo.15754
22. Kroenke K, Spitzer RL, and Williams JB. The PHQ-9: validity of a brief depression severity measure. J Gen Internal Med. (2001) 16:606–13. doi: 10.1046/j.1525-1497.2001.016009606.x
23. Yang D, Yang M, Bai J, Ma Y, and Yu C. Association between physical activity intensity and the risk for depression among adults from the national health and nutrition examination survey 2007-2018. Front Aging Neurosci. (2022) 14:844414. doi: 10.3389/fnagi.2022.844414
24. Wang Y, Wei R, Chen Z, Tang Y, Liu L, Qiao P, et al. The association between the number of pregnancies and depressive symptoms: A population-based study. J Affect Disord. (2024) 350:411–9. doi: 10.1016/j.jad.2024.01.161
25. Zhu X, Yue Y, Li L, Zhu L, Cai Y, and Shu Y. The relationship between depression and relative fat mass (RFM): A population-based study. J Affect Disord. (2024) 356:323–8. doi: 10.1016/j.jad.2024.04.031
26. He S and Wan L. Associations between smoking status and infertility: a cross-sectional analysis among USA women aged 18–45 years. Front Endocrinol. (2023) 14:1140739. doi: 10.3389/fendo.2023.1140739
27. Araujo-Menendez CEE, Saelzler UG, Stickel AM, Sundermann EE, Banks SJ, Paipilla A, et al. Associations between parity and cognition: race/ethnic differences. J Alzheimer’s Dis: JAD. (2023) 94:1157–68. doi: 10.3233/jad-221210
28. Yang Y, Wang S, and Cong H. Association between parity and bone mineral density in postmenopausal women. BMC Women’s Health. (2022) 22:87. doi: 10.1186/s12905-022-01662-9
29. Rosenberg N, Daviglus ML, DeVon HA, Park CG, and Eldeirawi K. The association between parity and inflammation among mexican-american women of reproductive age varies by acculturation level: results of the national health and nutrition examination survey (1999-2006). Women’s Health Issues. (2017) 27:485–92. doi: 10.1016/j.whi.2017.03.002
30. Yehuda M, Wang CH, Pak Y, Chiu KC, and Gianoukakis AG. Parity and risk of thyroid autoimmunity based on the NHANES (2001-2002, 2007-2008, 2009-2010, and 2011-2012). J Clin Endocrinol Metab. (2017) 102:3437–42. doi: 10.1210/jc.2017-00290
31. Hahn-Holbrook J, Cornwell-Hinrichs T, and Anaya I. Economic and health predictors of national postpartum depression prevalence: A systematic review, meta-analysis, and meta-regression of 291 studies from 56 countries. Front Psychiatry. (2017) 8:248. doi: 10.3389/fpsyt.2017.00248
32. Farren J, Jalmbrant M, Ameye L, Joash K, Mitchell-Jones N, Tapp S, et al. Post-traumatic stress, anxiety and depression following miscarriage or ectopic pregnancy: a prospective cohort study. BMJ Open. (2016) 6:e011864. doi: 10.1136/bmjopen-2016-011864
33. Dennis CL and Dowswell T. Psychosocial and psychological interventions for preventing postpartum depression. Cochrane Database Syst Rev. (2013) 2:Cd001134. doi: 10.1002/14651858.CD001134.pub3
34. Bennett HA, Einarson A, Taddio A, Koren G, and Einarson TR. Prevalence of depression during pregnancy: systematic review. Obstet Gynecol. (2004) 103:698–709. doi: 10.1097/01.AOG.0000116689.75396.5f
35. Froeliger A, Deneux-Tharaux C, Loussert L, Bouchghoul H, Madar H, and Sentilhes L. Prevalence and risk factors for postpartum depression 2 months after a vaginal delivery: a prospective multicenter study. Am J Obstet Gynecol. (2024) 230:S1128–37. doi: 10.1016/j.ajog.2023.08.026
36. Chaaya M, Campbell OM, El Kak F, Shaar D, Harb H, and Kaddour A. Postpartum depression: prevalence and determinants in Lebanon. Arch Women’s Ment Health. (2002) 5:65–72. doi: 10.1007/s00737-002-0140-8
37. Tammentie T, Tarkka MT, Astedt-Kurki P, and Paavilainen E. Sociodemographic factors of families related to postnatal depressive symptoms of mothers. Int J Nurs Pract. (2002) 8:240–6. doi: 10.1046/j.1440-172x.2002.00373.x
38. Nasralla K, Omar S, Alharbi G, Aljarallah F, AlHabardi N, and Adam I. Factors associated with postpartum depression among women in eastern Sudan: A cross-sectional study. Med (Kaunas Lithuania). (2024) 60:1167. doi: 10.3390/medicina60071167
39. Peinado-Molina RA, Hernández-Martínez A, Martínez-Vázquez S, Rodríguez-Almagro J, and Martínez-Galiano JM. Pelvic floor dysfunction: prevalence and associated factors. BMC Public Health. (2023) 23:2005. doi: 10.1186/s12889-023-16901-3
40. Branham V, Thomas J, Jaffe T, Crockett M, South M, Jamison M, et al. Levator ani abnormality 6 weeks after delivery persists at 6 months. Am J Obstet Gynecol. (2007) 197:65. doi: 10.1016/j.ajog.2007.02.040
41. Reis AM, Brito LGO, Lunardi ALB, Pinto ESMP, and Juliato CRT. Depression, anxiety, and stress in women with urinary incontinence with or without myofascial dysfunction in the pelvic floor muscles: A cross-sectional study. Neurourol Urodynamics. (2021) 40:334–9. doi: 10.1002/nau.24563
42. Vladutiu CJ, Siega-Riz AM, Sotres-Alvarez D, Stuebe AM, Ni A, Tabb KM, et al. Parity and components of the metabolic syndrome among US hispanic/latina women: results from the hispanic community health study/study of latinos. Circ Cardiovasc Qual Outcomes. (2016) 9:S62–9. doi: 10.1161/circoutcomes.115.002464
43. Nomaguchi K and Milkie MA. Parenthood and well-being: A decade in review. J Marriage Family. (2020) 82:198–223. doi: 10.1111/jomf.12646
44. Zhang K, He L, Li Z, Ding R, Han X, Chen B, et al. Bridging neurobiological insights and clinical biomarkers in postpartum depression: A narrative review. Int J Mol Sci. (2024) 25:8835. doi: 10.3390/ijms25168835
45. Bloch M, Daly RC, and Rubinow DR. Endocrine factors in the etiology of postpartum depression. Compr Psychiatry. (2003) 44:234–46. doi: 10.1016/s0010-440x(03)00034-8
46. Nielsen AM, Stika CS, and Wisner KL. The pathophysiology of estrogen in perinatal depression: conceptual update. Arch Women’s Ment Health. (2024) 27:887–97. doi: 10.1007/s00737-024-01494-6
47. Bloch M, Tevet M, Onn R, Fried-Zaig I, and Aisenberg-Romano G. The long-term course and prognosis of postpartum depression: a retrospective longitudinal cohort study. Arch Women’s Ment Health. (2024) 27:99–107. doi: 10.1007/s00737-023-01373-6
48. Eisenach JC, Pan PH, Smiley R, Lavand’homme P, Landau R, and Houle TT. Severity of acute pain after childbirth, but not type of delivery, predicts persistent pain and postpartum depression. Pain. (2008) 140:87–94. doi: 10.1016/j.pain.2008.07.011
49. van der Steeg JW, Steures P, Eijkemans MJ, Habbema JD, Hompes PG, Burggraaff JM, et al. Obesity affects spontaneous pregnancy chances in subfertile, ovulatory women. Hum Reprod (Oxford England). (2008) 23:324–8. doi: 10.1093/humrep/dem371
50. Frisch RE. The right weight: body fat, menarche and fertility. Proc Nutr Soc. (1994) 53:113–29. doi: 10.1079/pns19940015
Keywords: depression, PHQ-9, parity, vaginal delivery, cesarean delivery, national health and nutrition examination survey
Citation: He S, Li H, Xie F, Li W, Wan L and Zhang H (2025) Association between the frequency of different modes of delivery and depression: a national cross-sectional study. Front. Psychiatry 16:1595829. doi: 10.3389/fpsyt.2025.1595829
Received: 18 March 2025; Accepted: 07 May 2025;
Published: 23 May 2025.
Edited by:
Emilien Jeannot, Centre Hospitalier Universitaire Vaudois (CHUV), SwitzerlandReviewed by:
Shixuan Peng, University of South China, ChinaJiajie Ning, Guangxi Medical University, China
Copyright © 2025 He, Li, Xie, Li, Wan and Zhang. This is an open-access article distributed under the terms of the Creative Commons Attribution License (CC BY). The use, distribution or reproduction in other forums is permitted, provided the original author(s) and the copyright owner(s) are credited and that the original publication in this journal is cited, in accordance with accepted academic practice. No use, distribution or reproduction is permitted which does not comply with these terms.
*Correspondence: Huan Zhang, emhhbmdodWFuMTk4MjAyQDE2My5jb20=