 Siqi Liu1
 Yixiao Chen2Lei Zhang1
 Xu Zhang3Jiali Min1Yaqin Yang4Manru Li1Zheya Cai3Yanwei Sun1
 Jiayi Wang3
 Zhihao Chen5
 Hui Li6
 Fazhan Chen7Jiaojiao Hou8Ruyi Shui2Guoquan Zhou1*†
 Enzhao Zhu3*†
- 1Shanghai Putuo District Mental Health Center, Shanghai, China
- 2Shanghai Tongji Hospital, Tongji Hospital of Tongji University, Shanghai, China
- 3School of Medicine, Tongji University, Shanghai, China
- 4Shanghai Yangpu District Mental Health Center, Shanghai, China
- 5East China University of Science and Technology, Shanghai, China
- 6Shanghai Key Laboratory of Psychotic Disorders, Shanghai Mental Health Center, Shanghai Jiaotong University School of Medicine, Shanghai, China
- 7Clinical Research Center for Mental Disorders, Shanghai Pudong New Area Mental Health Center, School of Medicine, Chinese-German Institute of Mental Health, Tongji University, Shanghai, China
- 8University Clinic of Child and Adolescent Psychiatry, Psychosomatics and Psychotherapy, Rheinisch-Westfälische Technische Hochschule (RWTH) Aachen University, Aachen, Germany
Introduction: While clinical scales for impulsivity assessment in psychiatric settings are widely used, evidence linking laboratory biomarkers to impulsivity remains limited. This study evaluated the prognostic value of routinely collected biomarkers for future impulsivity risk and developed a machine learning–based prediction model.
Methods: We analyzed data from 1,496 first-admission schizophrenia (SCZ) patients across four specialized psychiatric hospitals (2016–2023). A total of 99 features, including 91 routinely tested biomarker measurements, four treatment-related indicators, and four demographic or psychometric variables, were evaluated. Impulsivity was assessed using the Impulsive Behavior Risk Assessment Scale within one week of admission. Five machine learning models were trained with 10-fold cross-validation (n=993) and externally validated in an independent cohort (n=503). Model performance was assessed using the area under the receiver operating characteristic curve (AUROC), and biomarker importance was evaluated using SHapley Additive exPlanations (SHAP).
Results: Of 1,496 SCZ patients, 882 (59.0%) exhibited high impulsivity. CatBoost outperformed other models, achieving an AUROC of 0.749 in cross-validation and 0.719 in external testing. SHAP values identified key biomarkers, revealing heterogeneous response patterns for uric acid (UA), globulin (GLO), apolipoprotein E (APOE), and others. Combining biomarkers with clinical data improved prediction, increasing AUROC from 0.652 to 0.749 in cross-validation and from 0.655 to 0.721 in external testing. Subgroup analyses revealed sex-specific patterns, with exploratory analysis suggesting sex-modified relationships between UA and impulsivity.
Discussion: These findings highlight the utility of routine biomarkers for early identification of high-risk individuals with SCZ and suggest the importance of incorporating sex-specific factors in predictive modeling.
Introduction
Impulsivity is a core feature of multiple psychiatric disorders and represents a major public health challenge (1). Among them, schizophrenia (SCZ) exhibits the most severe and disruptive forms, marked by sudden, uncontrolled acts of violence or self-harm. Individuals with SCZ not only show elevated levels of impulsivity but are also at increased risk of victimization (2, 3). Epidemiological studies report a 49–68% higher risk of violent behavior in this population compared to the general public, underscoring the clinical relevance of impulsivity in SCZ (4, 5). This heightened impulsivity contributes to poorer clinical outcomes, prolonged hospitalization, and substantial healthcare burden. In psychiatric inpatient settings, it also poses a persistent threat to both staff and patients (6). Traditional interventions have shown limited efficacy in preventing impulsivity in SCZ (7). As a result, early identification and targeted prevention of impulsivity are paramount, representing not only a critical step toward improving clinical outcomes but also an urgent public health priority.
In China, the Impulsive Behavior Risk Assessment Scale (IBRAS) (8), a composite of the Modified Overt Aggression Scale and Impulsivity Screening-10, is widely used to screen hospitalized patients with SCZ. While it facilitates risk identification, its reliance on self-report and observer ratings may limit early proactive intervention (9). While tools like the IBRAS are widely adopted and clinically useful, they are primarily designed for contemporaneous risk monitoring during hospitalization, often failing to capture biological signals that precede overt behavioral escalation (10, 11). Developing a robust, data-driven prognostic model could overcome these limitations and support early, individualized intervention. However, most existing studies have focused on cross-sectional associations with current impulsivity (12, 13), rather than longitudinal prediction of future risk. Moreover, many are limited by small sample sizes, single-center designs (14), or insufficient control of confounding factors (15). Additionally, the association between sex and impulsivity in SCZ remains controversial, with studies reporting inconsistent findings (16, 17). Leveraging a large, multicenter real-world dataset, we employed propensity score matching (PSM) to control for confounding and reduce selection bias. This study aimed to elucidate the association between sex and future impulsivity in SCZ, evaluate the predictive value of routine biomarkers, and develop a clinically applicable risk model using machine learning. Early identification of impulsivity risk during the initial days of hospitalization can inform individualized treatment planning, proactive ward management, and preventive interventions (18). Such early warning systems may complement weekly clinical assessments (e.g., IBRAS) by identifying high-risk individuals prior to routine evaluations, offering timely insights that bridge the critical period immediately following admission, thereby potentially improving patient outcomes and ward safety (19).
Methods
Ethics
We first examined the association between routinely collected biomarkers and impulsivity. Subsequently, we applied machine learning algorithms to evaluate their predictive performance and develop a clinically applicable risk model. This study was approved by the Ethics Committee of Shanghai Putuo District Mental Health Center (approval number: M202409) and conducted in accordance with the principles of the Declaration of Helsinki. Reporting followed the Strengthening the Reporting of Observational Studies in Epidemiology (STROBE) guidelines (20).
Data sources
Data were obtained from four psychiatric institutions in Shanghai: Putuo District Mental Health Center, Tongji University Mental Health Center, Changning District Mental Health Center, and the Shanghai Mental Health Center, which is one of China’s four National Medical Centers for Mental Diseases. The dataset comprises comprehensive real-world electronic health records, including admission details, diagnostic codes, psychometric assessments, medical prescriptions, laboratory results, and structured risk evaluations from both inpatient and outpatient settings. This multicenter design enhances the generalizability of findings and reflects the clinical profile of psychiatric inpatients across China.
Study participants
This retrospective cohort study included detailed and comprehensive medical records of psychiatric patients hospitalized from January 2016 to March 2023. The eligibility criteria included (a) 18–70 years old, (b) diagnosis on admission was SCZ based on ICD-10, (c) patients needed to have a baseline Positive and Negative Syndrome Scale (PANSS) total score of 80 points or higher, along with a minimum score of 5 on one positive symptom item or a minimum score of 4 on two positive symptom items (21), (d) first hospitalization, (e) resident in China. Exclusion criteria included (a) loss of demographic information, (b) excessive loss of hospital records (more than 20% of included features), (c) length of hospitalization is less than seven days, (d) accompanied with mental retardation, personality disorder or brain organic disease, (e) accompanied with severe somatic disease, (f) long-term history of psychotropic drug use, and (g) pregnancy or lactation. In addition, patients who were assessed as being at high risk at the time of admission were also excluded. The overall patients’ inclusion process is presented in Figure 1. The analysis was carried out between October 2023 and December 2024.
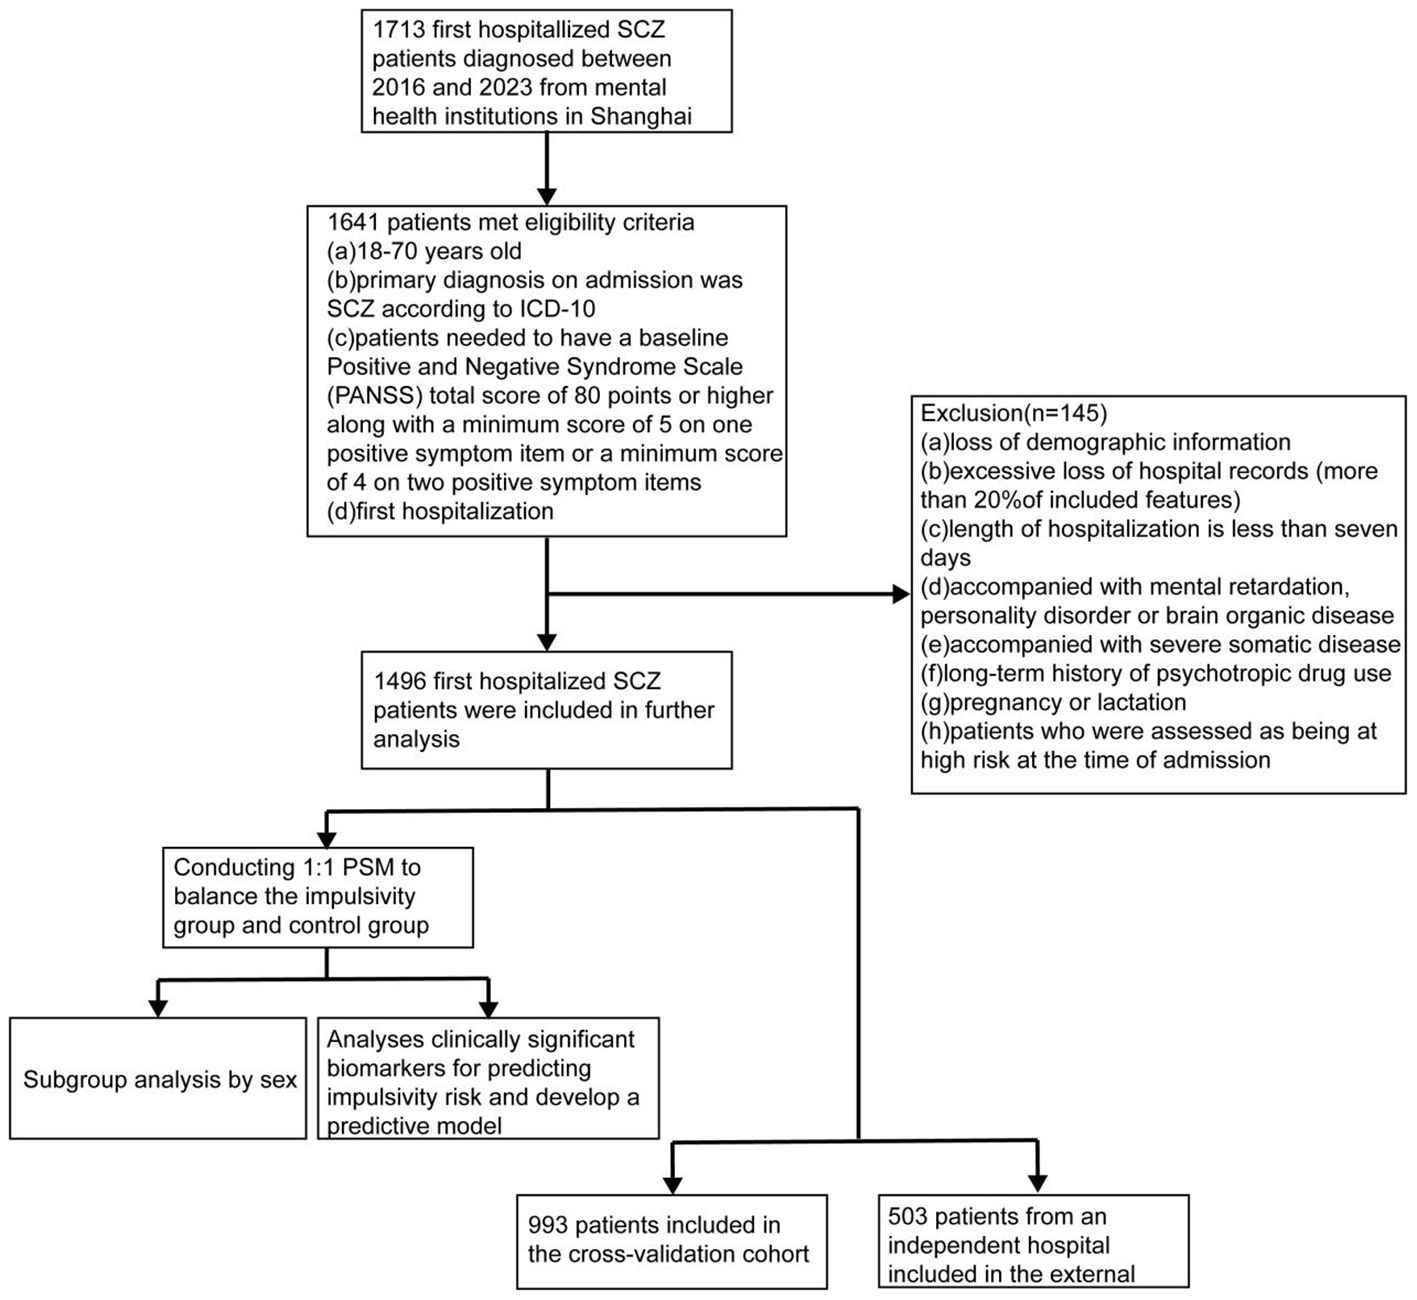
Figure 1. Procedure. SCZ, schizophrenia; PSM, propensity score matching.
Temporal procedures
Each patient was assigned a unique hospitalization identifier, enabling longitudinal tracking across admissions. The first traceable admission was designated as the index hospitalization, from which demographic information was extracted. Medication records and electroconvulsive therapy (ECT) data were obtained from electronic medical orders. Laboratory and auxiliary examinations included complete blood count, urinalysis, liver and renal function panels, immune markers, and other routinely assessed clinical indicators. In total, 99 features were assessed, including 91 biomarkers. Detailed definitions and variable descriptions are provided in Supplementary Table S1.
Laboratory and clinical examination data were obtained on the day of admission or within the preceding week, as some patients may have completed these assessments in outpatient settings prior to hospitalization. Given the delayed onset of psychiatric medication efficacy, medication and ECT records were extracted from one month prior to admission up to the day of admission. To account for cross-institutional treatment, prescription data were retrieved across all participating hospitals within this window. In addition, for patients who exhibited impulsivity during hospitalization, biomarker data within one week following the escalated impulsivity event were collected to enable time trend analysis.
Grouping criteria
After meeting the inclusion criteria, patients were classified into two groups based on their IBRAS assessments within the first seven days of hospitalization. The impulsivity group included those with a maximum IBRAS total score ≥ 5 during this period, indicating high risk (22). The control group comprised patients who had IBRAS total scores < 5 at all available assessments within the same timeframe and did not exhibit any escalation in risk thereafter. Patients with missing IBRAS data or ambiguous risk trajectories were excluded to ensure diagnostic consistency. To ensure temporal precedence, only impulsivity events that occurred after the baseline biomarker collection (i.e., after admission) were included for model training. This design ensures that predictors temporally precede the outcome, supporting a prognostic modeling framework.
Statistical analyses
To enhance transparency and reproducibility, all code used for data preprocessing, model development, and analysis has been made publicly available at: https://github.com/huahaoXie/SCZ/tree/master. Initial data curation was conducted using PostgreSQL 4.2, and all statistical analyses were performed in R (v4.1.3). Continuous variables were summarized as means with standardized deviations (SDs), and categorical variables as counts and percentages (%). Normality was assessed using the Anderson–Darling test. Depending on distribution, continuous variables were compared using the Welch t-test or Mann–Whitney U test; categorical variables were analyzed using the χ² test or Fisher’s exact test, as appropriate. Multiple comparisons were corrected using the Holm–Bonferroni method. All P values were two-sided, with significance defined as P < 0.05. In the data cleaning process, to prevent sample bias and ensure accurate results, data with missing values exceeding 30% were deleted. For data with missing values below 30%, imputation using chained equations was performed separately on training, testing, and independent cohorts. To mitigate potential confounding arising from demographic and clinical differences, PSM was performed to balance the impulsivity and control groups on age, sex, and treatment exposure. High-risk patients were matched 1:1 to controls using the nearest-neighbor algorithm, ensuring equal group sizes and covariate balance in the matched cohort. The effectiveness of matching was evaluated using inter-group comparisons and standardized mean differences (SMDs).
Missing values were handled using multiple imputation by chained equations, incorporating all available measurements and participant-level characteristics (23). Feature selection using least absolute shrinkage and selection operator (LASSO) logistic regression, which penalizes less informative features by shrinking their coefficients to zero, was performed exclusively within the cross-validation cohort. This strategy was adopted to prevent data leakage and to ensure an unbiased assessment of model performance. The odds ratios (OR) were obtained using random effects logistic regression models, in which the source hospital of the data was treated as a random effect (24). Confidence intervals (CIs) for changes before and after the onset of impulsivity were estimated using paired Welch’s t-test or Mann–Whitney U test for continuous variables, and bootstrapping for categorical variables, as appropriate. Bootstrapping was performed with 1,000 resamples, applying bias-corrected and accelerated adjustments. Subgroup analyses by sex were performed for both regression models and time trend evaluations. A post hoc sample size calculation was conducted assuming a conservative anticipated model R² of 0.10, an outcome prevalence of 49%, and 31 selected candidate predictors (25). The minimum required sample size was estimated to be approximately 900 patients to ensure a shrinkage factor ≥ 0.9 and optimism < 5%. Our final dataset included 1,496 patients, including 882 impulsivity events, which exceeds this threshold and supports robust model development and external validation.
Predictive modeling
To evaluate the predictive utility of biomarkers for future impulsivity, we developed and compared a series of machine learning and deep learning models. All models were implemented in Python 3.8 using the following packages: XGBoost (v1.7.2), CatBoost (v1.2.7), LightGBM (v3.3.3), and scikit-learn (v1.1.3). Ten algorithms were applied: XGBoost, CatBoost, AdaBoost, LightGBM, gradient boosting machine (GBM), random forest (RF), multilayer perceptron (MLP), Bayesian network (BN), support vector machine (SVM), and logistic regression (LR). These approaches have been widely used in clinical prediction and demonstrate reliable performance across diverse healthcare applications (26, 27).
The Shanghai Mental Health Center was randomly designated as the external testing cohort, with the remaining sites used for model training and validation. The models were trained based on 10-fold cross-validation repeated ten times in the training cohort for the best replicability. Hyperparameter tuning was performed via randomized search (n=100 iterations) during cross-validation. For tree-based models (CatBoost, XGBoost, LightGBM, GBM, RF), we optimized parameters such as maximum tree depth (range: 3–10), learning rate (0.01–0.1), number of estimators (100–1000), L2 regularization (λ = 0–10), and minimum child weight (1–10). In CatBoost, categorical feature encoding was handled internally using ordered boosting to mitigate overfitting. For SVM, radial basis function kernels were used, with tuning of the regularization parameter C (0.1–10) and kernel coefficient γ (0.01–1). For LR, we tuned the inverse regularization strength (C) over a log-uniform grid from 0.001 to 100 and selected the optimal penalty (L1 vs. L2). For BN, we applied constraint-based structure learning (PC algorithm) with significance thresholds ranging from 0.01 to 0.2, followed by maximum likelihood estimation of parameters. Network structure stability was evaluated via repeated subsampling to ensure consistent edge selection. For the MLP, we tested network architectures with 1–3 hidden layers and 64–256 neurons per layer. ReLU activation, dropout (0.1–0.5), and L2 regularization (α = 1e–5 to 1e–3) were tuned jointly. Models were trained using the Adam optimizer with early stopping based on validation loss, using a patience of 10 epochs. Batch size was fixed at 64, and the maximum number of epochs was set to 100. Class imbalance was addressed using oversampling of the minority class within the training data. All preprocessing was performed separately within each cross-validation loop to avoid data leakage.
Model performance was primarily assessed using the area under the receiver operating characteristic curve (AUROC), supplemented by F1 score, area under the precision–recall curve (AUPRC), sensitivity, and specificity to capture both discrimination and class-specific performance. A blank model containing no predictors was included as a reference. To evaluate the incremental predictive value of biomarkers, model performance was compared with and without biomarker features. Model performance metrics were compared using Nadeau and Bengio’ s corrected resampled t-test (28), which accounts for the statistical dependence introduced by repeated sampling. Feature importance was quantified using gain-based (F1 score improvement) metrics and visualized via SHAP values (29) to facilitate model interpretability.
Results
Patients and matching
A total of 1,496 patients with first-time admission for schizophrenia met the inclusion criteria. Specifically, participants were enrolled from four centers as follows: Putuo District Mental Health Center (n=230), Tongji University Mental Health Center (n=540), Changning District Mental Health Center (n=223), and the Shanghai Mental Health Center (n=503). The latter served as the external validation cohort. Among them, 882 (59.0%) developed high impulsivity within one week of hospitalization, while the remaining 614 served as controls. Male patients were more likely to exhibit high impulsivity compared with females (54.4% vs 45.6%; P=0.001; Supplementary Figure S2).
After propensity score matching, 547 high-impulsivity patients were matched 1:1 to controls. Post-matching, baseline characteristics were balanced: the mean age was 46.3 ± 13.7 years in the impulsivity group and 48.8 ± 14.0 years in controls, with male proportions of 54.7% and 51.0%, respectively. Covariate balance was evaluated using inter-group comparisons and SMDs (Supplementary Table S2, Supplementary Figure S1). Detailed patient characteristics are presented in Supplementary Table S2.
Data imputation
In data preprocessing, three biomarkers with missingness >30% were excluded. For the remaining 91 biomarkers, 13 had missing values <30% and were retained for analysis. Missing values were imputed using multiple imputation by chained equations. To avoid data leakage, imputation was performed separately within the training, internal testing, and external validation cohorts. In total, 16,473 (12.1%) of all biomarker feature datapoints were imputed.
The association of biomarkers and future impulsivity risk
LASSO regression was applied to 91 clinical biomarkers, yielding 31 variables with non-zero coefficients as potential predictors of impulsivity. Corresponding regression coefficients are provided in Supplementary Table S3.
Subsequently, univariate and multivariate logistic regression analyses were performed on the selected biomarkers, identifying several with statistically significant associations with impulsivity (Supplementary Table S4). The high-risk indicators identified by ORs were mean platelet width (PDW), prealbumin (PALB), uric acid (UA), hepatitis B virus surface antibody (HBsAb), natrium (Na), urinary nitrite (NIT), fasting glucose (GLU), urine ketones (KET) negative; While the low-risk indicators included mean corpuscular hemoglobin concentration (MCHC), total bile acid (TBA), globulin (GLO), kalium (K), tetraiodothyronine (T4) (Figure 2).
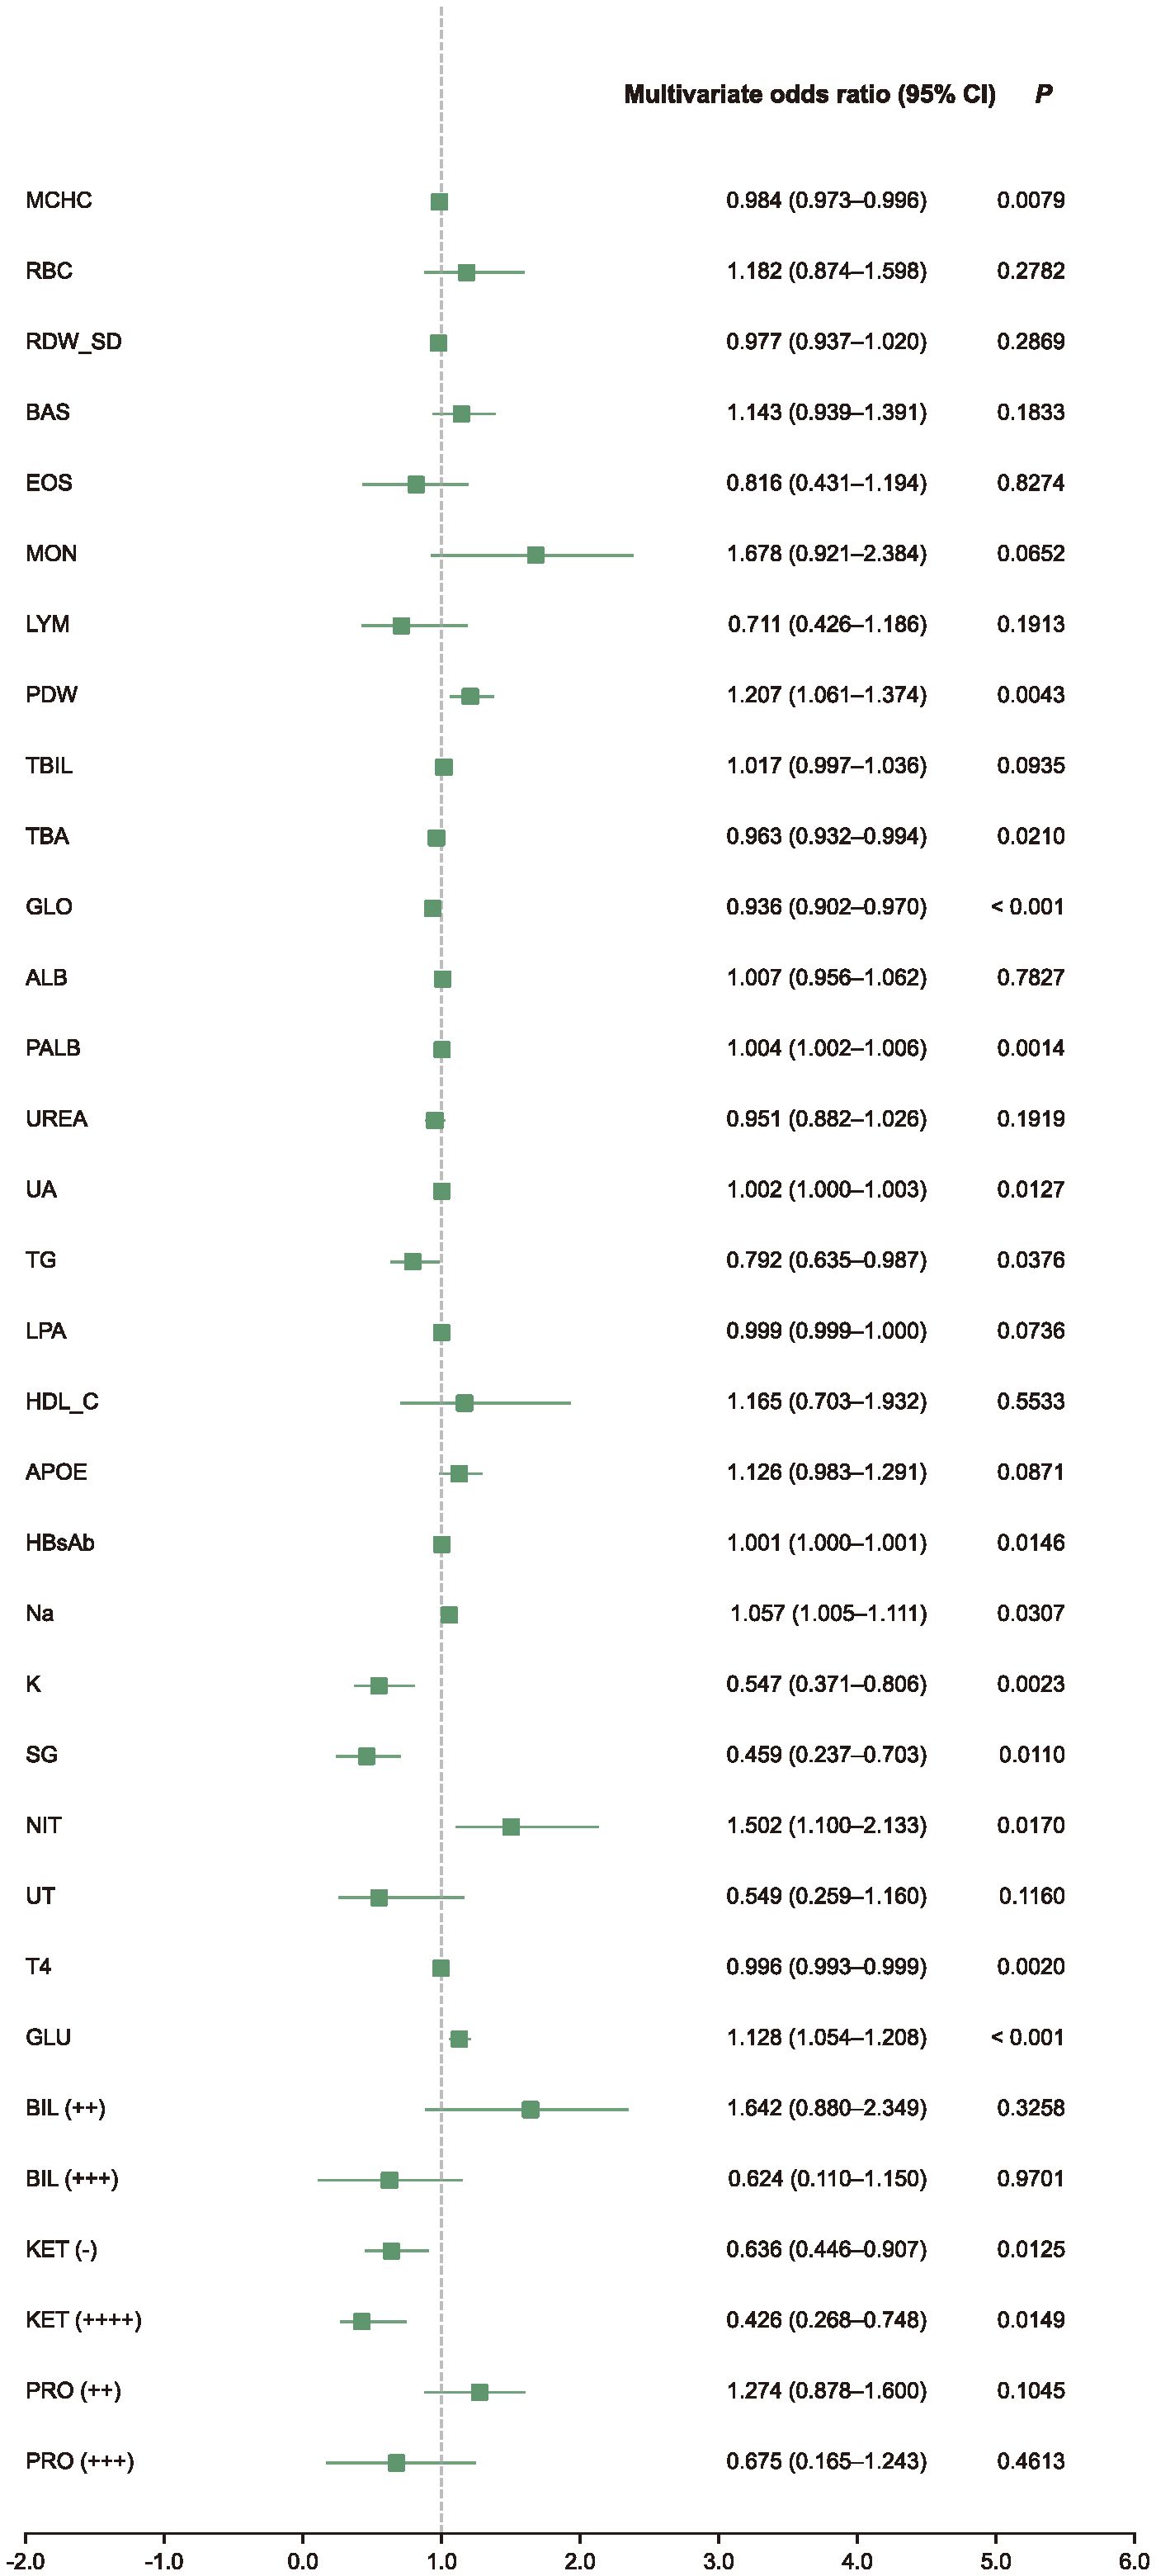
Figure 2. Multivariate analysis forest plot. This forest plot shows multivariate-adjusted odds ratios (ORs) and 95% confidence intervals (CIs) for selected biomarkers retained after LASSO feature selection. The analysis was conducted using logistic regression adjusted for study site as a random effect. Biomarkers with OR > 1 were associated with increased impulsivity risk, while those with OR < 1 were associated with decreased risk.
Subgroup analyses revealed both overlapping and sex-specific patterns. Several indicators, such as UA, GLO, Na, NIT, and HBcAb, showed consistent associations across subgroups, aligning with the overall trend. In male group, additional predictors included basophil count (BAS), lipoprotein (LPA), free thyroxine (FT4), and KET positivity (Figure 3A). In female group, MCHC, PALB, HBsAb, K, and GLU emerged as significant (Figure 3B). Furthermore, exploratory interaction analysis suggested a potential modifying effect of sex on the relationship between UA and impulsivity risk (P=0.012; Supplementary Table S4).
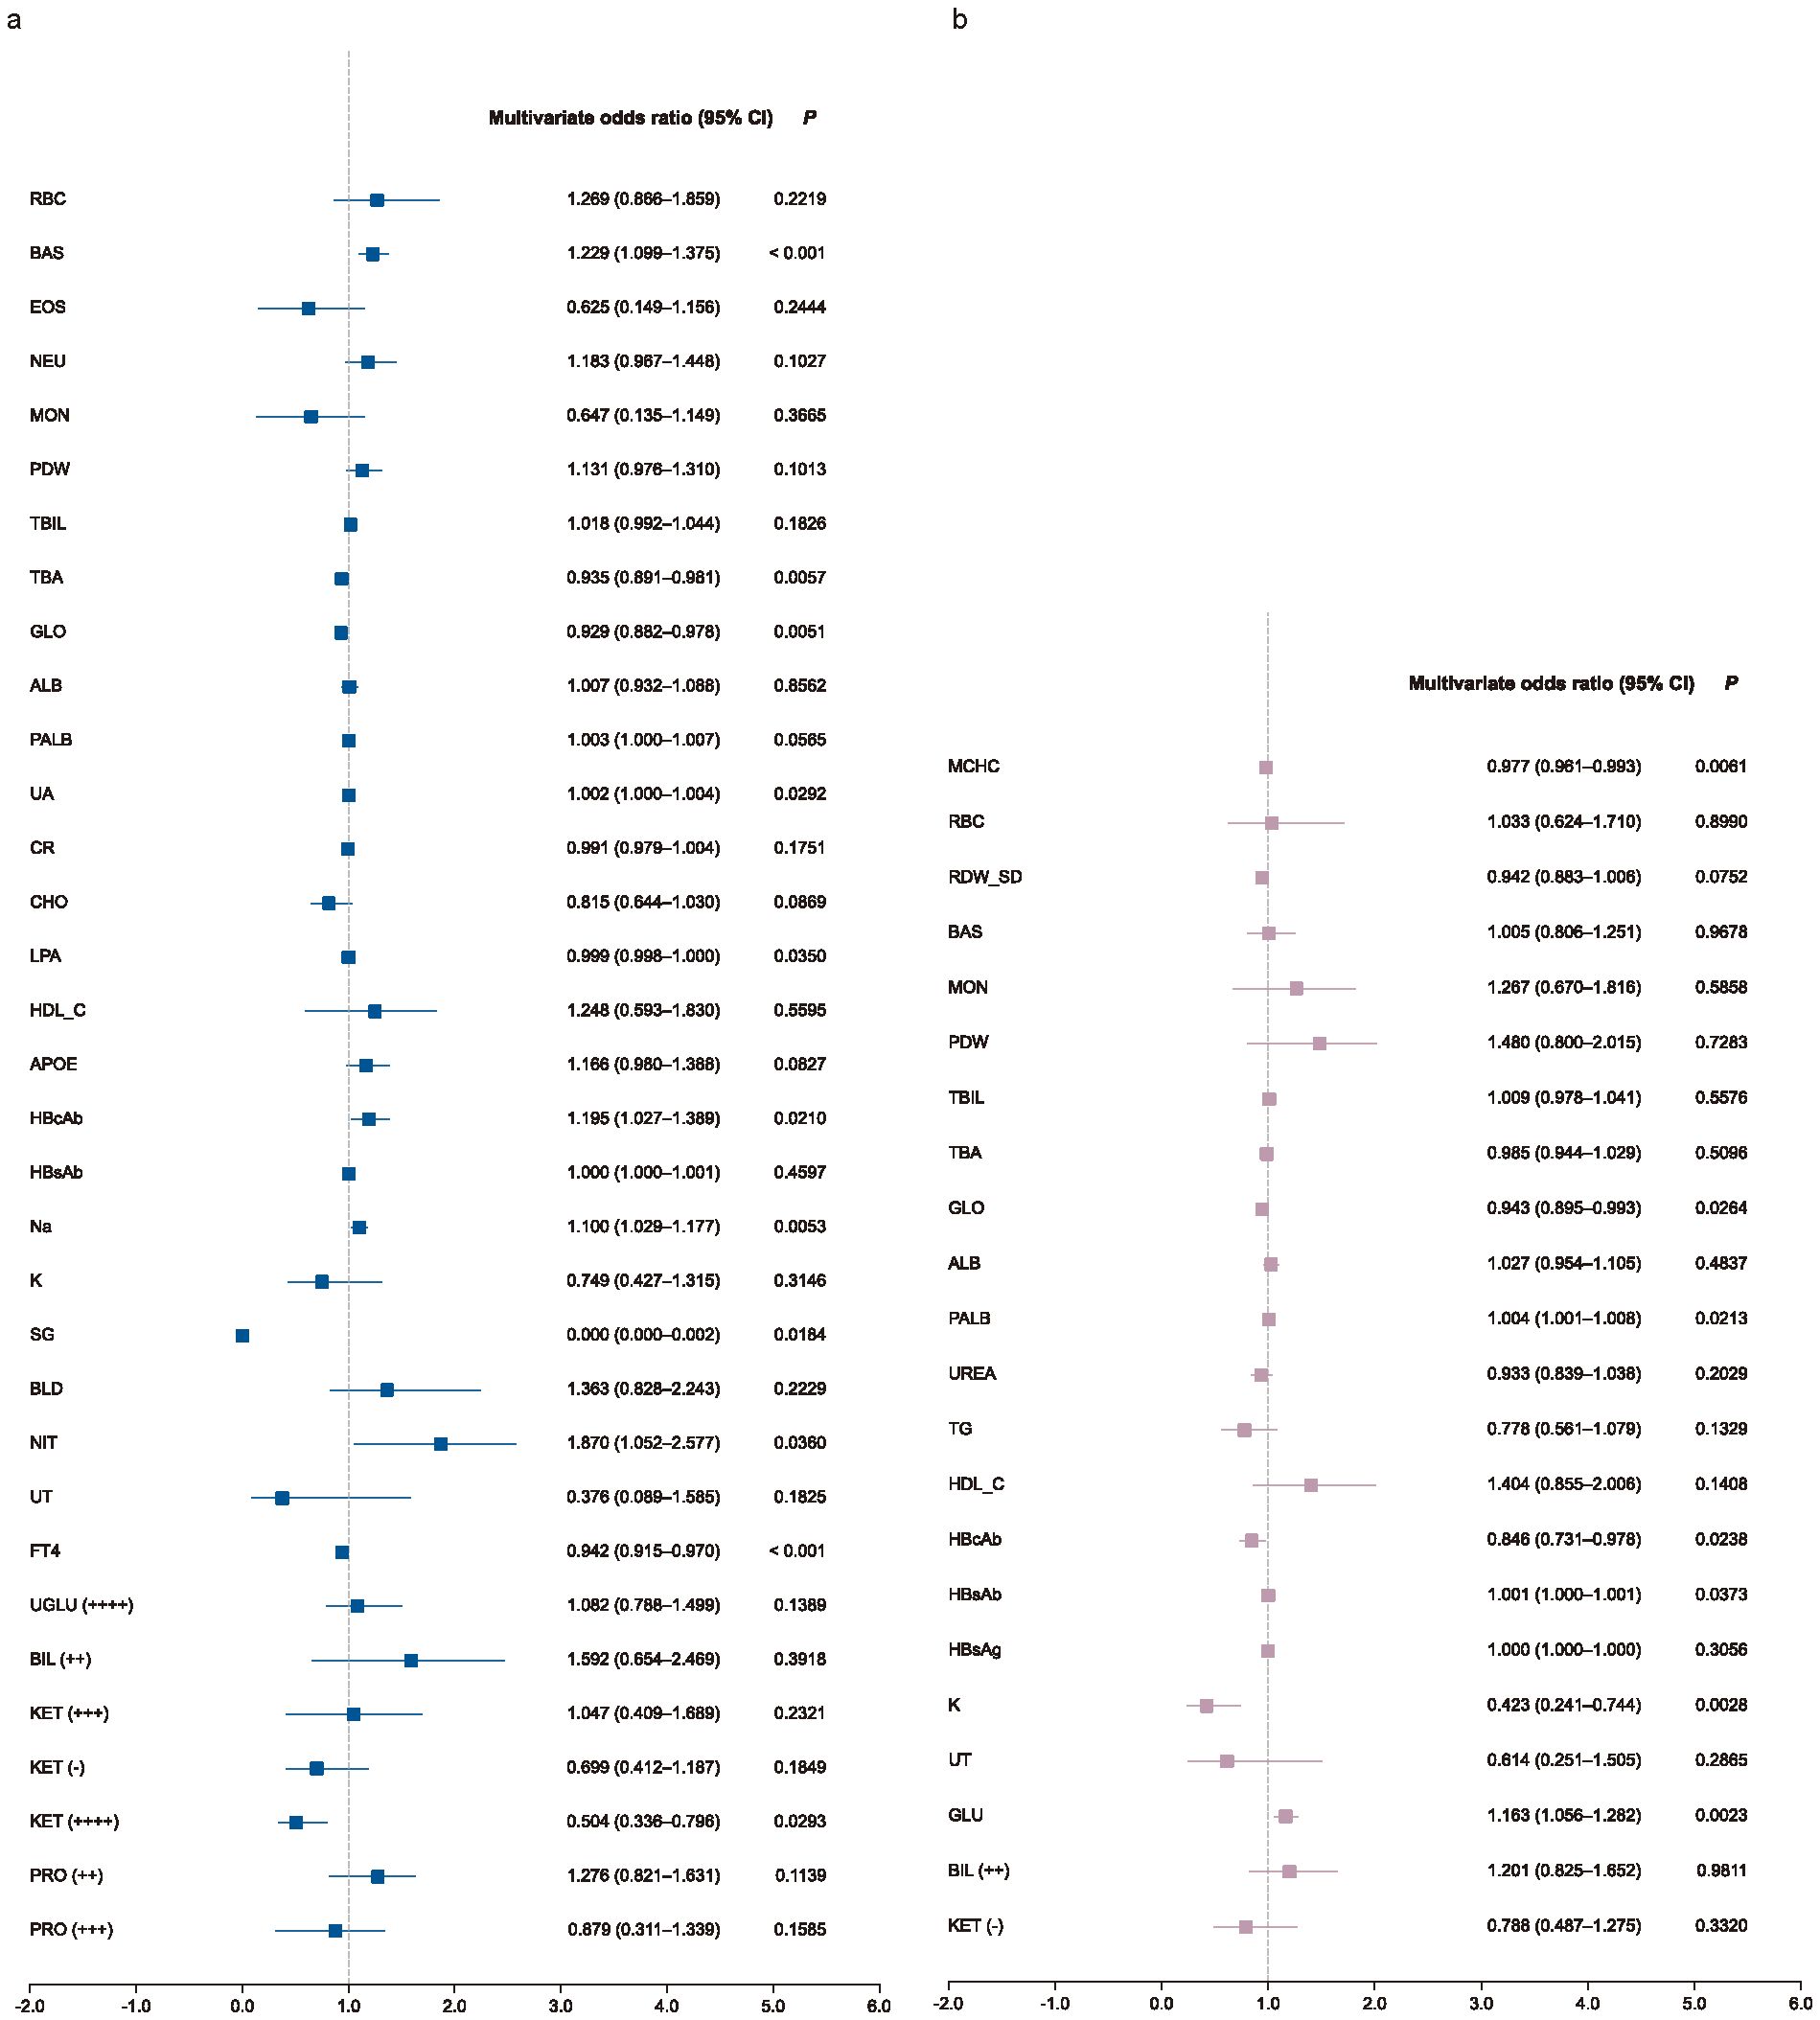
Figure 3. Subgroup multivariate analysis forest plot. Forest plots show multivariate-adjusted odds ratios (ORs) and 95% confidence intervals (CIs) for selected biomarkers in male (a) and female (b) patients. Logistic regression models were adjusted for study site as a random effect. Biomarkers with OR > 1 indicate increased risk; those with OR < 1 indicate protective associations.
To explore the temporal dynamics of biomarkers associated with impulsivity, we analyzed follow-up data from the impulsivity group at seven days after risk escalation (Supplementary Table S5). Several biomarkers previously identified as significant in the regression analysis, including UA, PALB, TBA, Na, and K, exhibited notable longitudinal changes (Figure 4). Additional indicators with significant time trends included red blood cell count (RBC), basophils (BAS), eosinophils (EOS), monocytes (MON), lymphocytes (LYM), total bilirubin (TBIL), urea nitrogen (UREA), triglycerides (TG), and apolipoprotein E (APOE). Subgroup analyses revealed sex-specific trends: RBC and UREA showed more pronounced changes in male group (Figure 5A), whereas TBA and Na exhibited greater variability in female group (Figure 5B). Several indicators, including MON, TBIL, PALB, UA, TG, and K, demonstrated consistent time-dependent changes in both sexes, further supporting their potential relevance in risk monitoring.
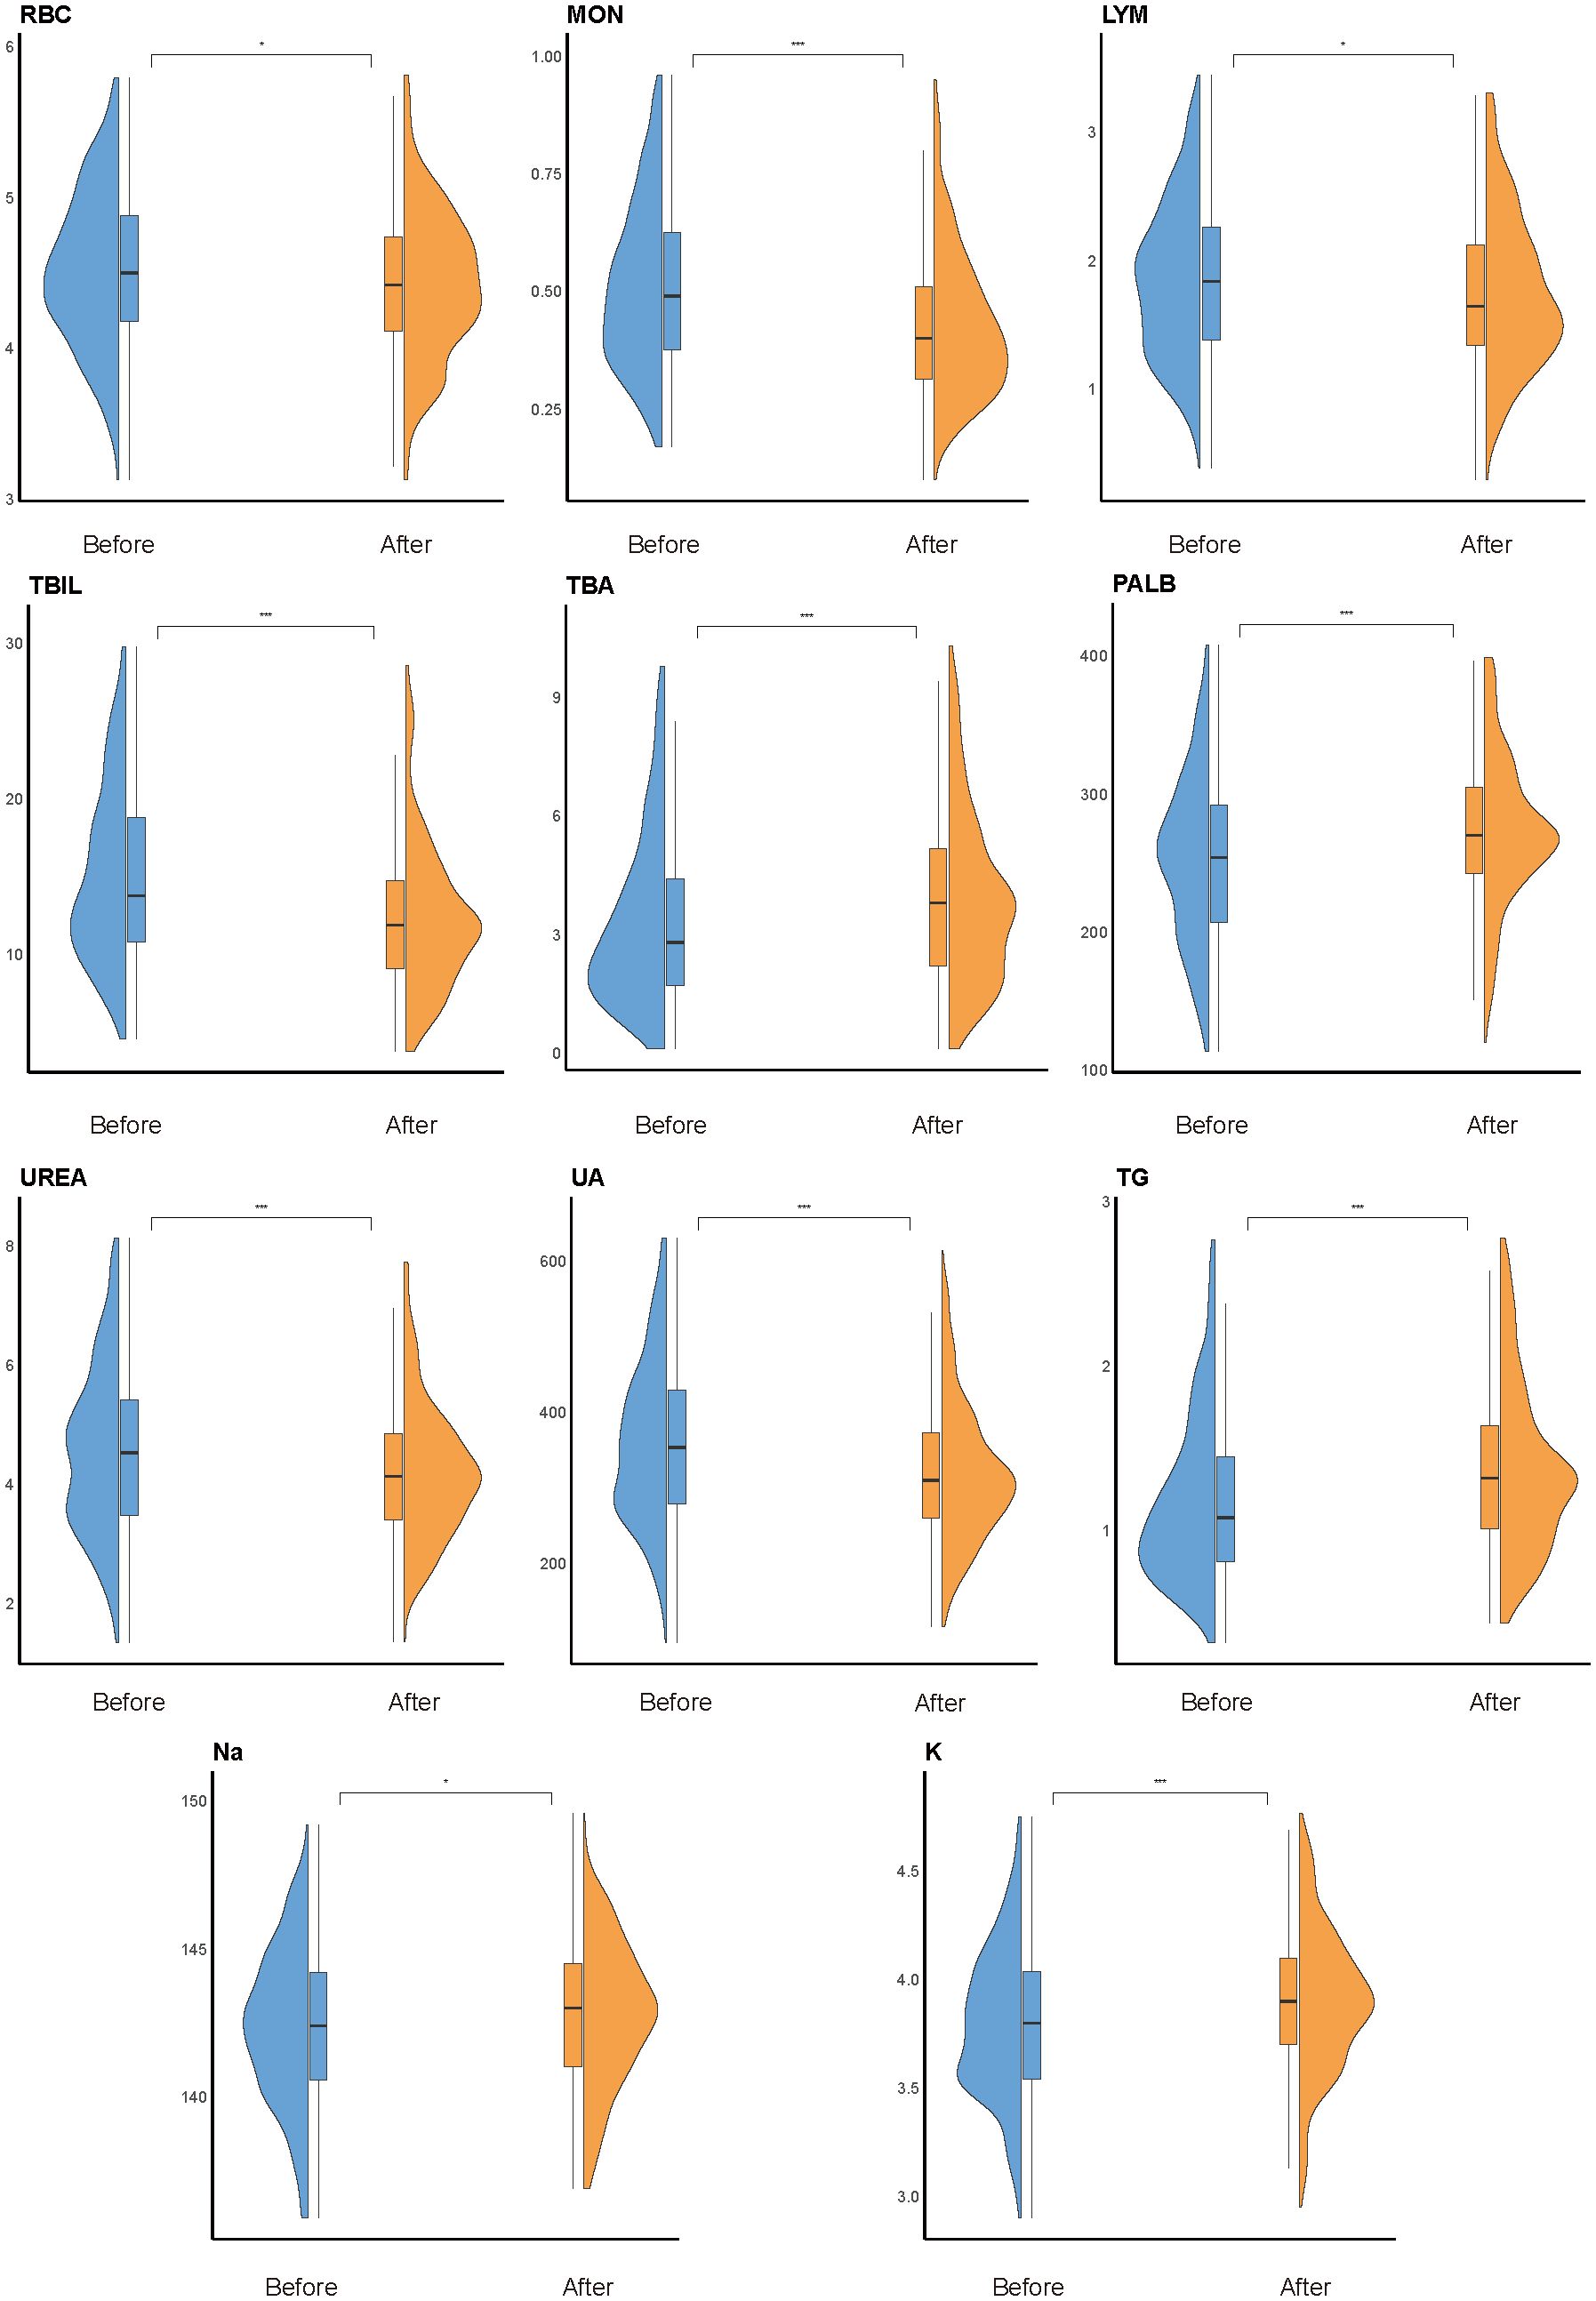
Figure 4. Overall time-trend analysis. Violin plots show longitudinal changes in the distribution of key biomarkers within the impulsivity group, comparing levels within one week of admission (“before”) and 180 days after escalation (“after”). Statistical significance was determined using paired Welch’s t-tests; *P < 0.05, **P < 0.01, ***P < 0.001. Box plots within violins represent the median and interquartile range.
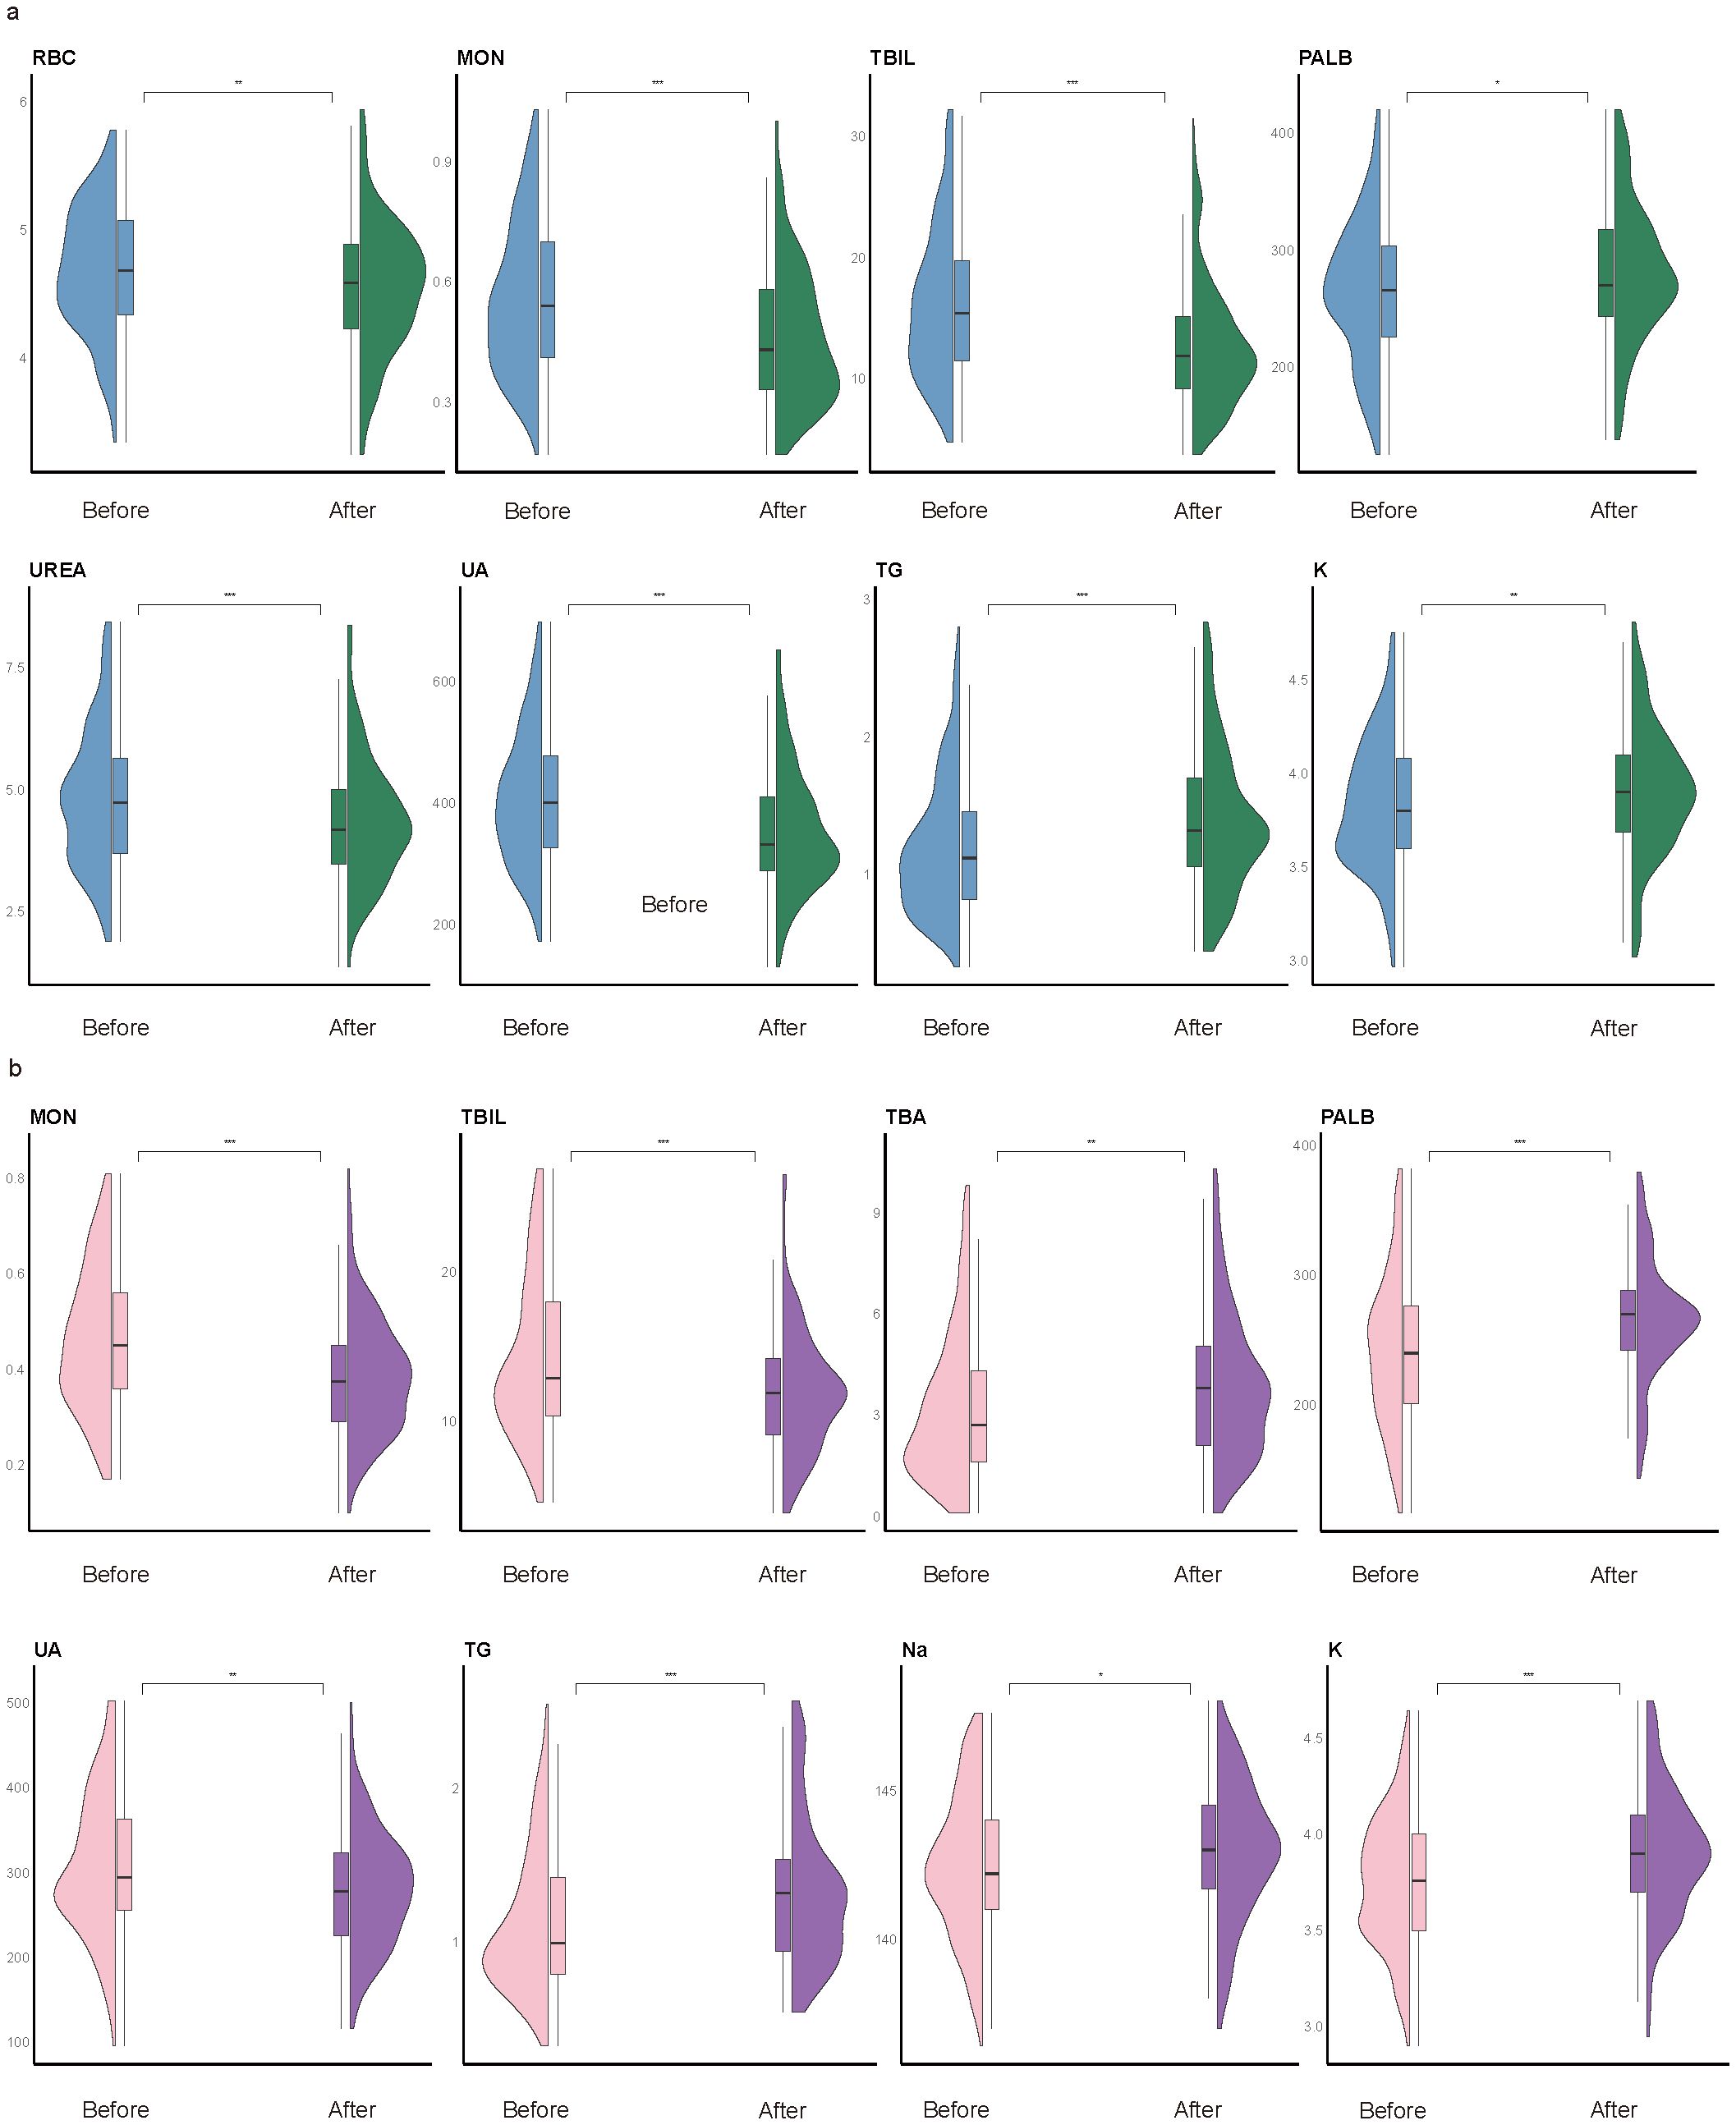
Figure 5. Subgroup time-trend analysis. Violin plots illustrate longitudinal changes in biomarker levels from within one week of admission (“before”) to 180 days after impulsivity escalation (“after”), stratified by sex. (a) Male subgroup. Significant temporal changes were observed in red blood cell count (RBC), monocytes (MON), total bilirubin (TBIL), prealbumin (PALB), uric acid (UA), triglycerides (TG), potassium (K), and urea (UREA). (b) Female subgroup. Significant variation was found in MON, TBIL, total bile acid (TBA), PALB, UA, TG, sodium (Na), and K. Notably, MON, TBIL, PALB, UA, TG, and K exhibited consistent time-dependent changes in both sexes. Statistical comparisons were conducted using paired Welch’s t-tests; *P < 0.05, **P < 0.01, ***P < 0.001. Box plots indicate medians and interquartile ranges.
Model performance and feature importance
CatBoost outperformed other models in both the cross-validation and external testing cohorts, achieving the highest AUROC of 0.749 (95% CI 0.714–0.783) and 0.719 (95% CI 0.664–0.767), respectively. It also showed superior F1 scores (0.794, 95% CI 0.768–0.824) and sensitivity (0.910, 95% CI 0.886–0.934), demonstrating its robust predictive performance across cohorts (Table 1, Figures 6B, C).
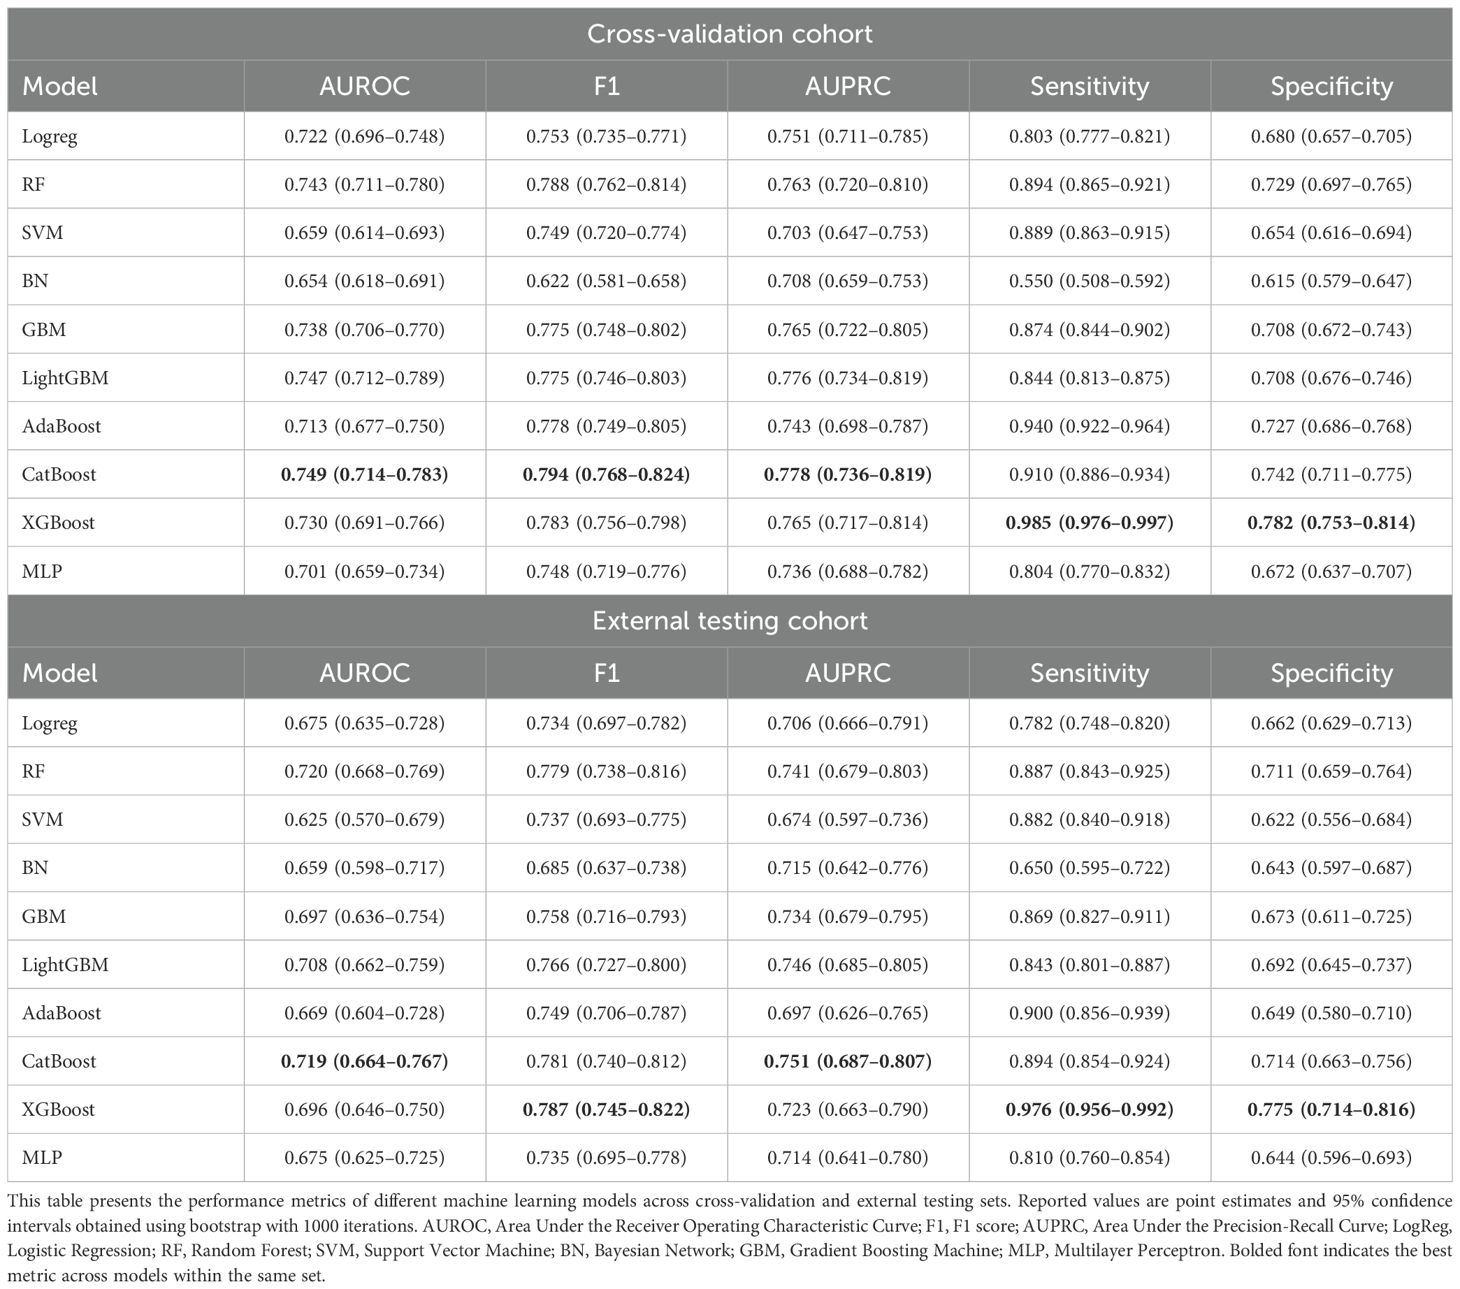
Table 1. Model performance.
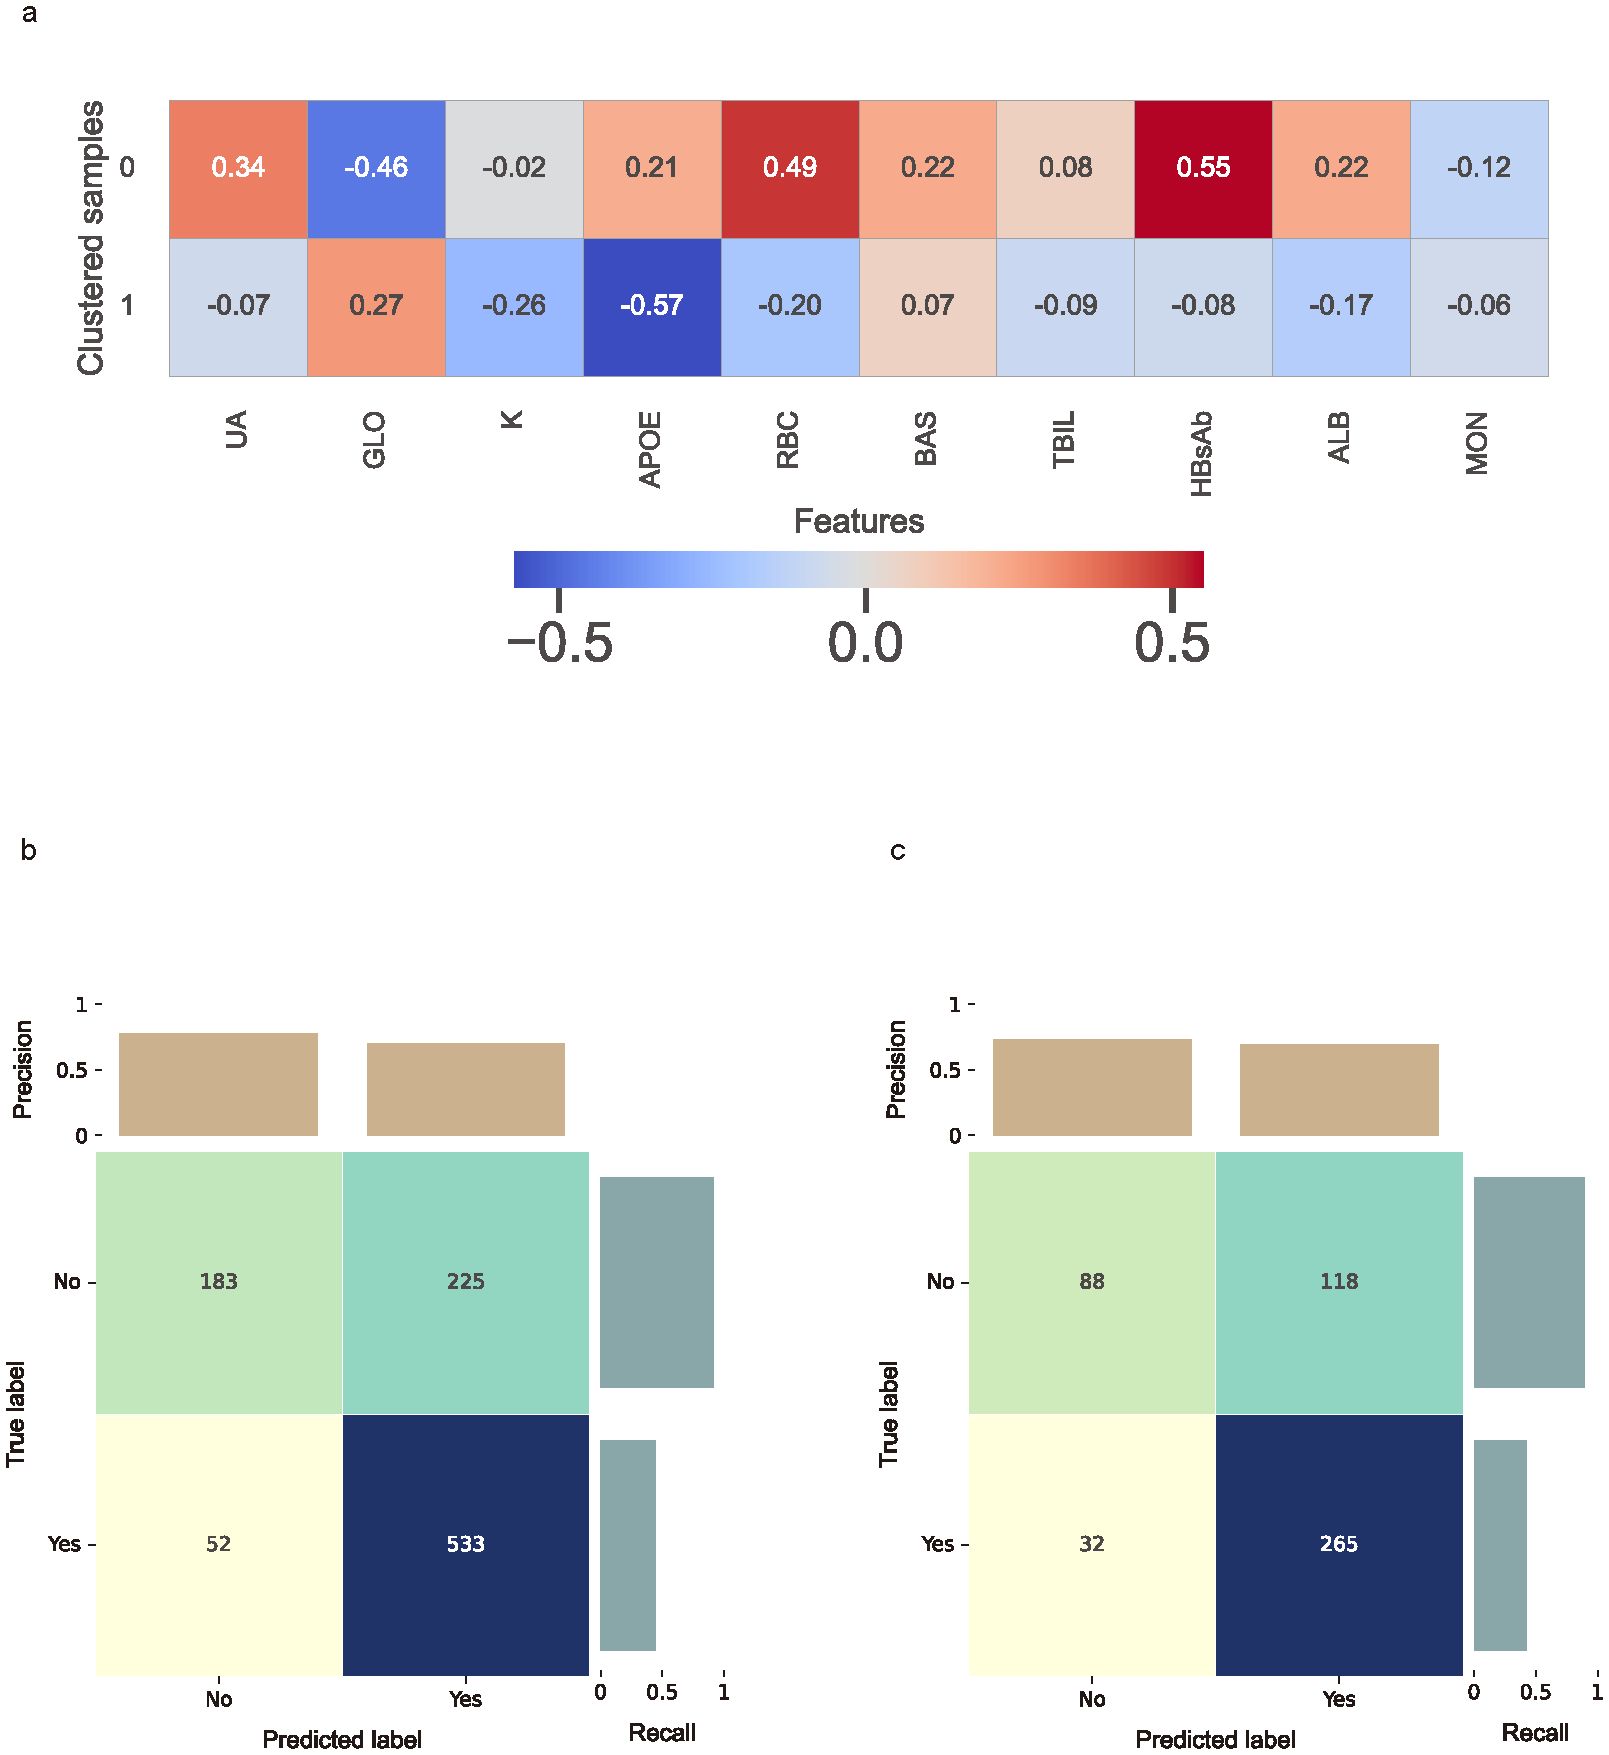
Figure 6. Clustered SHAP values heatmap and the confusion matrix. (a) Clustered SHAP (Shapley Additive Explanations) heatmap showing distinct feature attribution patterns across patient subgroups, based on top 10 biomarkers. Clustering was performed using K-means based on individual SHAP value profiles. Color intensity reflects mean SHAP values per biomarker within each cluster, with red indicating increased predicted risk and blue indicating reduced contribution. (b) Confusion matrix for the cross-validation cohort. (c) Confusion matrix for the external testing cohort. Confusion matrices present true and predicted labels for impulsivity, with darker cells representing higher counts.
In the CatBoost model, the ten most important features, ranked by average gain across the cross-validated cohort, included TBIL, ALB, T4, UREA, RBC, APOE, K, HBsAb, GLO, and UA (Supplementary Figure S3A). In the external testing cohort, SHAP analysis identified UA, GLO, K, APOE, RBC, BAS, TBIL, HBsAb, ALB, and MON as the top contributors to model predictions (Supplementary Figure S3B).
To capture group-level feature contributions while accounting for potential interactions, individual SHAP values were clustered using the K-means algorithm. The optimal number of clusters was determined to be two based on the silhouette score (Supplementary Figure S4). The clustered SHAP heatmap (Figure 6A) revealed heterogeneous response patterns for UA, GLO, APOE, RBC, TBIL, HBsAb and ALB in relation to predicted impulsivity.
Added benefits of biomarkers
Integrating biomarkers with the baseline clinical data significantly improved model performance. In the cross-validation cohort, the combined model showed a higher AUROC (difference = 0.087; 95% CI, 0.047–0.126), F1, AUPRC, sensitivity, and specificity compared to the model without biomarkers (P < 0.001; Figure 7A). In the external testing cohort, the addition of biomarkers also led to a significant improvement in AUROC, F1 score, sensitivity, and specificity (Figure 7B).
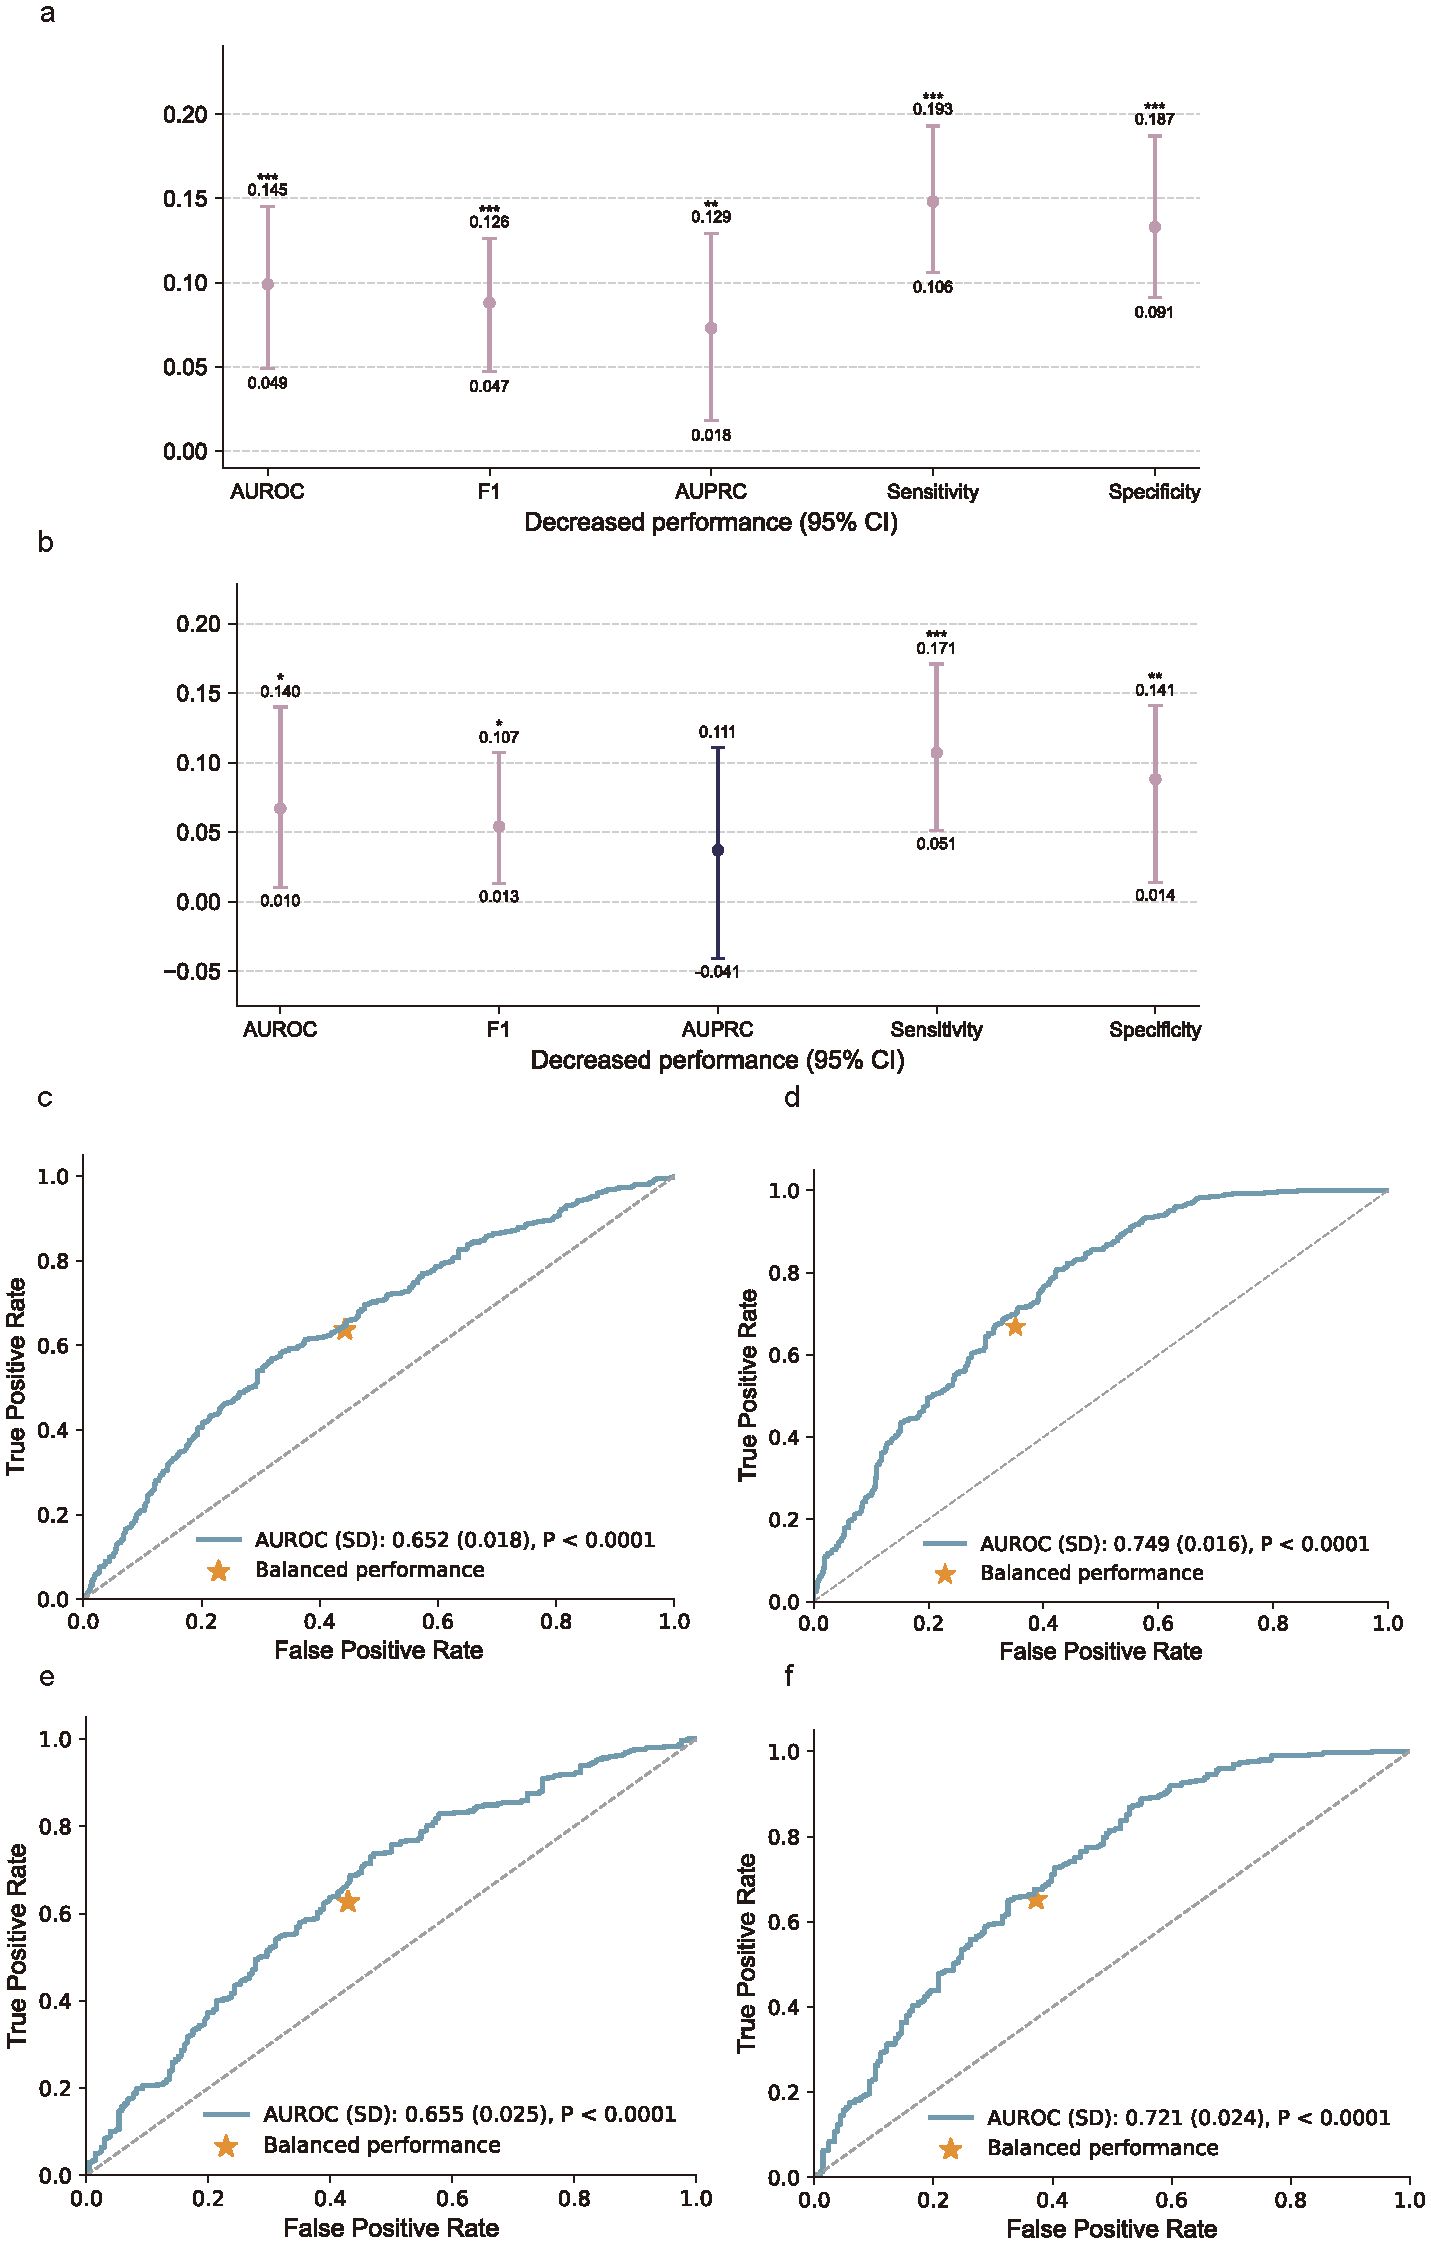
Figure 7. Added benefits of biomarker measurements and the receiver operating characteristic curves (ROC). (a) Performance gain from incorporating biomarker features in the cross-validation cohort, assessed using AUROC, F1 score, AUPRC, sensitivity, and specificity. (b) Performance gain in the external testing cohort. Bars indicate absolute differences in model performance between models with and without biomarkers, with 95% confidence intervals. P values were calculated using Nadeau and Bengio’s corrected resampled t-test; *P < 0.05, **P < 0.01, ***P < 0.001. (c–f), Receiver operating characteristic (ROC) curves comparing models without (c, e) and with (d, f) biomarker inputs in the cross-validation cohort (c, d) and external testing cohort (e, f). Inclusion of biomarkers substantially improved model discrimination, as indicated by increased AUROC values and more favorable balance points.
By comparing the results of the cross-validation cohort and the external testing cohort, we aim to enhance the assessment of the model’s generalization performance. In the cross-validation cohort, the ROC curve for the model without biomarkers (Figure 7C) showed an AUROC of 0.652 (SD 0.018), which improved to 0.749 (SD 0.016) when biomarkers were included (Figure 7D). In the external testing cohort, the AUROC increased from 0.655 (SD 0.025) without biomarkers (Figure 7E) to 0.721 (SD 0.024) with biomarkers (Figure 7F). These results demonstrate that incorporating biomarkers significantly enhances model performance in both cohorts.
Discussion
Main findings
Our findings highlight that integrating biomarker measurements with clinical data enables effective prediction of future impulsivity risk (30). Univariate and multivariate logistic regression, along with time trend analyses, identified several biomarkers associated with impulsivity. These biomarkers, when combined with clinical data, significantly enhanced model performance, as demonstrated by a marked increase in AUROC and other metrics. Notably, the model yielded similar performance in both cross-validation and external cohorts, indicating good generalizability across datasets (31). Furthermore, subgroup analyses revealed a sex-specific interaction, with differences in the expression levels of key biomarkers between males and females, suggesting that sex may modulate the predictive value of these biomarkers for impulsivity risk. Results interpretation is strengthened by our study design, which ensured that biomarker and clinical data were collected at admission, before any impulsivity escalation occurred. By restricting outcomes to events within the first week post-admission, the model captures prospective risk rather than concurrent behavioral states.
Our study identifies several biomarkers that are significantly associated with future impulsivity. While UA (32), GLO (33), K (34), APOE (35), and MON (36) has been previously linked to impulsivity, biomarkers such as RBC, BAS, TBIL, HBsAb, and ALB have not been widely studied in this context. These biomarkers likely reflect underlying physiological processes, including metabolic (37) and immune system dysfunctions (38), which may contribute to the development of impulsivity. The observed temporal changes in biomarkers like UA, TBA, and K further suggest that impulsivity risk is dynamic and influenced by ongoing biological alterations (39). These findings emphasize the potential for biomarkers to serve as indicators of impulsivity risk and highlight the need for further exploration of the mechanisms linking these biomarkers to impulsivity.
CatBoost, the best-performing model, demonstrated the highest AUROC in both the cross-validation and external testing cohorts. The inclusion of biomarkers notably improved model performance, further validating the importance of biomarkers in enhancing predictive capabilities. Feature importance analysis, performed using CatBoost and SHAP, identified biomarkers such as UA, as the most influential predictors, confirming their critical role in the prediction of impulsivity (40). The SHAP heatmap analysis revealed complex, heterogeneous response patterns for biomarkers like UA, GLO, APOE, RBC, TBIL, HBsAb, and ALB, highlighting that feature interactions may be intricate and difficult to capture with traditional methods. This underscores the advantage of using machine learning techniques, which are better equipped to recognize and model such complex relationships in predictive tasks (41).
Several biomarkers exhibited significant different responses between male and female groups, and notable changes were observed over time following the occurrence of impulsivity. These differences may reflect underlying sex-specific physiological processes, such as hormonal regulation (42) and metabolic pathways (43), which could potentially modulate impulsivity risk and biomarker expression over time. Furthermore, an interaction between sex and the biomarker UA was identified, suggesting that the predictive value of UA for impulsivity risk may vary between males and females. This finding aligns with the previously discussed significant role of UA in predicting impulsivity risk (37). These results underscore the importance of considering sex differences in predictive models and suggest that further investigation into the underlying mechanisms of these biomarkers, particularly UA, is warranted.
Notably, although the model predicts impulsivity within a short time window, this prediction precedes routine clinical risk assessments and behavioral escalation, and thus provides clinically actionable information. In real-world psychiatric wards, where IBRAS or similar scales are administered weekly, our model can enable proactive identification of high-risk patients, allowing for timely implementation of targeted interventions, staffing adjustments, and personalized safety protocols. In this way, the model complements, rather than replaces, existing clinical assessments, and bridges a critical gap between admission and routine risk detection.
Strengths and limitations
This analysis is strengthened by the use of a well-characterized, multicenter, and longitudinal real-world cohort, offering robust evidence derived from a large sample size and a rigorous study design. However, several limitations should be considered. The data were exclusively from hospitalized patients in a single city, which may limit the generalizability of the findings and introduce potential selection bias. Furthermore, missing data could introduce confounding factors, affecting the consistency and reliability of the results.
Conclusions
This cohort study identifies a reproducible biomarker signature that is significantly correlated with future impulsivity risk in SCZ patients, enhancing the predictive accuracy and clinical utility of models based on routinely accessible patient data. Furthermore, we observed a significant correlation between sex and impulsivity risk, suggesting that sex-specific factors may influence impulsivity, which warrants further investigation into this potential relationship.
Data availability statement
The raw data supporting the conclusions of this article will be made available by the authors, without undue reservation.
Author contributions
SL: Conceptualization, Funding acquisition, Visualization, Resources, Project administration, Writing – original draft, Formal Analysis, Validation, Investigation, Writing – review & editing, Data curation, Methodology, Software. YC: Writing – original draft, Formal Analysis, Conceptualization, Investigation, Writing – review & editing. LZ: Writing – original draft, Writing – review & editing. XZ: Writing – review & editing, Writing – original draft. JM: Writing – review & editing, Writing – original draft. YY: Writing – original draft, Writing – review & editing. ML: Writing – review & editing, Writing – original draft. ZhC: Data curation, Formal Analysis, Writing – review & editing, Writing – original draft. YS: Writing – review & editing, Writing – original draft. JW: Writing – review & editing, Writing – original draft. ZCh: Writing – review & editing, Writing – original draft. HL: Writing – review & editing, Writing – original draft. FC: Writing – review & editing, Writing – original draft. JH: Writing – original draft, Conceptualization, Writing – review & editing, Supervision. RS: Writing – review & editing, Data curation, Supervision, Formal analysis, Investigation, Resources, Software. GZ: Writing – original draft, Supervision, Writing – review & editing. EZ: Writing – original draft, Funding acquisition, Software, Formal Analysis, Visualization, Resources, Methodology, Supervision, Project administration, Writing – review & editing, Investigation, Conceptualization, Validation, Data curation.
Funding
The author(s) declare financial support was received for the research and/or publication of this article. This work was supported by projects from Shanghai Putuo District Municipal Health Committee (ptkwws202413).
Conflict of interest
The authors declare that the research was conducted in the absence of any commercial or financial relationships that could be construed as a potential conflict of interest.
Generative AI statement
The author(s) declare that no Generative AI was used in the creation of this manuscript.
Any alternative text (alt text) provided alongside figures in this article has been generated by Frontiers with the support of artificial intelligence and reasonable efforts have been made to ensure accuracy, including review by the authors wherever possible. If you identify any issues, please contact us.
Publisher’s note
All claims expressed in this article are solely those of the authors and do not necessarily represent those of their affiliated organizations, or those of the publisher, the editors and the reviewers. Any product that may be evaluated in this article, or claim that may be made by its manufacturer, is not guaranteed or endorsed by the publisher.
Supplementary material
The Supplementary Material for this article can be found online at: https://www.frontiersin.org/articles/10.3389/fpsyt.2025.1620131/full#supplementary-material.
References
1. Eronen M, Angermeyer MC, and Schulze B. The psychiatric epidemiology of violent behaviour. Soc Psychiatry Psychiatr Epidemiol. (1998) 33 Suppl 1:S13–23. doi: 10.1007/s001270050205
2. Maniglio R. Severe mental illness and criminal victimization: a systematic review. Acta Psychiatr Scand. (2009) 119:180–91. doi: 10.1111/j.1600-0447.2008.01300.x
4. van Nieuwenhuijzen M, de Castro BO, van der Valk I, Wijnroks L, Vermeer A, and Matthys W. Do social information-processing models explain aggressive behaviour by children with mild intellectual disabilities in residential care? J Intellect Disabil Res. (2006) 50:801–12. doi: 10.1111/j.1365-2788.2005.00773.x
5. Fazel S, Grann M, Carlström E, Lichtenstein P, and Långström N. Risk factors for violent crime in Schizophrenia: a national cohort study of 13,806 patients. J Clin Psychiatry. (2009) 70:362–9. doi: 10.4088/JCP.08m04274
6. Quintal SA. Violence against psychiatric nurses. An untreated epidemic? J Psychosoc Nurs Ment Health Serv. (2002) 40:46–53. doi: 10.3928/0279-3695-20020101-12
7. Darmedru C, Demily C, and Franck N. Cognitive remediation and social cognitive training for violence in schizophrenia: a systematic review. Psychiatry Res. (2017) 251:266–74. doi: 10.1016/j.psychres.2016.12.062
8. Yudofsky SC, Silver JM, Jackson W, Endicott J, and Williams D. The Overt Aggression Scale for the objective rating of verbal and physical aggression. Am J Psychiatry. (1986) 143:35–9. doi: 10.1176/ajp.143.1.35
9. Saha S, Chant D, Welham J, and McGrath J. A systematic review of the prevalence of schizophrenia. PloS Med. (2005) 2:e141. doi: 10.1371/journal.pmed.0020141
10. Korzekwa M, Links P, and Steiner M. Biological markers in borderline personality disorder: new perspectives. Can J Psychiatry. (1993) 38 Suppl 1:S11–5.
11. Freudenberg F, Alttoa A, and Reif A. Neuronal nitric oxide synthase (NOS1) and its adaptor, NOS1AP, as a genetic risk factors for psychiatric disorders. Genes Brain Behav. (2015) 14:46–63. doi: 10.1111/gbb.12193
12. Kozyrev EA, Ermakov EA, Boiko AS, Mednova IA, Kornetova EG, Bokhan NA, et al. Building predictive models for schizophrenia diagnosis with peripheral inflammatory biomarkers. Biomedicines. (2023) 11:1990. doi: 10.3390/biomedicines11071990
13. Tong Z, Zhu J, Wang JJ, Yang YJ, and Hu W. The neutrophil-lymphocyte ratio is positively correlated with aggression in schizophrenia. BioMed Res Int. (2022) 2022:4040974. doi: 10.1155/2022/4040974
14. Gassó P, Rodríguez N, Martínez-Pinteño A, Mezquida G, Ribeiro M, González-Peñas J, et al. A longitudinal study of gene expression in first-episode schizophrenia; exploring relapse mechanisms by co-expression analysis in peripheral blood. Transl Psychiatry. (2021) 11:539. doi: 10.1038/s41398-021-01645-8
15. Wang YM, Zhang YY, Wang Y, Cao Q, and Zhang M. Task-related brain activation associated with violence in patients with schizophrenia: A meta-analysis. Asian J Psychiatr. (2024) 97:104080. doi: 10.1016/j.ajp.2024.104080
16. Jauhar S, Johnstone M, and McKenna PJ. Schizophrenia. Lancet. (2022) 399:473–86. doi: 10.1016/S0140-6736(21)01730-X
17. Lindström E and von Knorring L. Symptoms in schizophrenic syndromes in relation to age, sex, duration of illness and number of previous hospitalizations. Acta Psychiatr Scand. (1994) 89:274–8. doi: 10.1111/j.1600-0447.1994.tb01513.x
18. Leucht S, Kane JM, Kissling W, Hamann J, Etschel E, and Engel RR. What does the PANSS mean? Schizophr Res. (2005) 79:231–8. doi: 10.1016/j.schres.2005.04.008
19. Zhu E, Wang J, Zhou G, Li C, Chen F, Ju K, et al. A highly scalable deep learning language model for common risks prediction among psychiatric inpatients. BMC Med. (2025) 23:308. doi: 10.1186/s12916-025-04150-7
20. von Elm E, Altman DG, Egger M, Pocock SJ, Gøtzsche PC, and Vandenbroucke JP. The Strengthening the Reporting of Observational Studies in Epidemiology (STROBE) Statement: guidelines for reporting observational studies. Int J Surg. (2014) 12:1495–9. doi: 10.1016/j.ijsu.2014.07.013
21. Weiden PJ, Breier A, Kavanagh S, Miller AC, Brannan SK, and Paul SM. Antipsychotic efficacy of karXT (Xanomeline-trospium): post hoc analysis of positive and negative syndrome scale categorical response rates, time course of response, and symptom domains of response in a phase 2 study. J Clin Psychiatry. (2022) 83:21m14316. doi: 10.4088/JCP.21m14316
22. Anderson KK and Jenson CE. Violence risk&x2013;assessment screening tools for acute care mental health settings: Literature review. Arch Psychiatr Nurs. (2019) 33:112–9. doi: 10.1016/j.apnu.2018.08.012
23. Azur MJ, Stuart EA, Frangakis C, and Leaf PJ. Multiple imputation by chained equations: what is it and how does it work? Int J Methods Psychiatr Res. (2011) 20:40–9. doi: 10.1002/mpr.329
24. Jager KJ, Zoccali C, Macleod A, and Dekker FW. Confounding: what it is and how to deal with it. Kidney Int. (2008) 73:256–60. doi: 10.1038/sj.ki.5002650
25. Riley RD, Ensor J, Snell KIE, Harrell FE, Martin GP, Reitsma JB, et al. Calculating the sample size required for developing a clinical prediction model. BMJ. (2020) 368:m441. doi: 10.1136/bmj.m441
26. Krittanawong C, Virk HUH, Bangalore S, Wang Z, Johnson KW, Pinotti R, et al. Machine learning prediction in cardiovascular diseases: a meta-analysis. Sci Rep. (2020) 10:16057. doi: 10.1038/s41598-020-72685-1
27. El-Sofany H, Bouallegue B, and El-Latif YMA. A proposed technique for predicting heart disease using machine learning algorithms and an explainable AI method. Sci Rep. (2024) 14:23277. doi: 10.1038/s41598-024-74656-2
28. Nadeau C and Bengio Y. Inference for the generalization error. Mach Learn. (2003) 52:239–81. doi: 10.1023/A:1024068626366
29. Lee S-I and Lundberg SM. (2017). A unified approach to interpreting model predictions, in: Neural Information Processing Systems 30 (NeurIPS 2017). Long Beach (CA): Neural Information Processing Systems Foundation; 2017. p. 4765–74.
30. Nahm FS. Receiver operating characteristic curve: overview and practical use for clinicians. Korean J Anesthesiol. (2022) 75:25–36. doi: 10.4097/kja.21209
31. Feng G, Xu H, Wan S, Wang H, Chen X, Magari R, et al. Twelve practical recommendations for developing and applying clinical predictive models. Innovation Med. (2024) 2(4):100105. doi: 10.59717/j.xinn-med.2024.100105
32. Ortiz R, Ulrich H, Zarate CA Jr., and MaChado-Vieira R. Purinergic system dysfunction in mood disorders: a key target for developing improved therapeutics. Prog Neuropsychopharmacol Biol Psychiatry. (2015) 57:117–31. doi: 10.1016/j.pnpbp.2014.10.016
33. Gorwood P. Biological markers for suicidal behavior in alcohol dependence. Eur Psychiatry. (2001) 16:410–7. doi: 10.1016/S0924-9338(01)00599-5
34. Rucklidge JJ, Eggleston MJF, Darling KA, Stevens AJ, Kennedy MA, and Frampton CM. Can we predict treatment response in children with ADHD to a vitamin-mineral supplement? An investigation into pre-treatment nutrient serum levels, MTHFR status, clinical correlates and demographic variables. Prog Neuropsychopharmacol Biol Psychiatry. (2019) 89:181–92. doi: 10.1016/j.pnpbp.2018.09.007
35. Angelopoulou E, Koros C, Hatzimanolis A, Stefanis L, Scarmeas N, and Papageorgiou SG. Exploring the genetic landscape of mild behavioral impairment as an early marker of cognitive decline: an updated review focusing on alzheimer’s disease. Int J Mol Sci. (2024) 25:2645. doi: 10.3390/ijms25052645
36. Courtet P, Giner L, Seneque M, Guillaume S, Olie E, and Ducasse D. Neuroinflammation in suicide: Toward a comprehensive model. World J Biol Psychiatry. (2016) 17:564–86. doi: 10.3109/15622975.2015.1054879
37. He Q, You Y, Yu L, Yao L, Lu H, Zhou X, et al. Uric acid levels in subjects with schizophrenia: A systematic review and meta-analysis. Psychiatry Res. (2020) 292:113305. doi: 10.1016/j.psychres.2020.113305
38. Beumer W, Gibney SM, Drexhage RC, Pont-Lezica L, Doorduin J, Klein HC, et al. The immune theory of psychiatric diseases: a key role for activated microglia and circulating monocytes. J Leukoc Biol. (2012) 92:959–75. doi: 10.1189/jlb.0212100
39. Faulkner IE, Pajak RZ, Harte MK, Glazier JD, and Hager R. Voltage-gated potassium channels as a potential therapeutic target for the treatment of neurological and psychiatric disorders. Front Cell Neurosci. (2024) 18:1449151. doi: 10.3389/fncel.2024.1449151
40. Ma H, Cheng N, and Zhang C. Schizophrenia and alarmins. Medicina (Kaunas). (2022) 58:694. doi: 10.3390/medicina58060694
41. Zaka A, Mustafiz C, Mutahar D, Sinhal S, Gorcilov J, Muston B, et al. Machine-learning versus traditional methods for prediction of all-cause mortality after transcatheter aortic valve implantation: a systematic review and meta-analysis. Open Heart. (2025) 12. doi: 10.1136/openhrt-2024-002779
42. Misiak B, Stańczykiewicz B, Wiśniewski M, Bartoli F, Carra G, Cavaleri D, et al. Thyroid hormones in persons with schizophrenia: A systematic review and meta-analysis. Prog Neuropsychopharmacol Biol Psychiatry. (2021) 111:110402. doi: 10.1016/j.pnpbp.2021.110402
43. Hatta K, Takahashi T, Nakamura H, Yamashiro H, Endo H, Fujii S, et al. Abnormal physiological conditions in acute schizophrenic patients on emergency admission: dehydration, hypokalemia, leukocytosis and elevated serum muscle enzymes. Eur Arch Psychiatry Clin Neurosci. (1998) 248:180–8. doi: 10.1007/s004060050036
Keywords: schizophrenia, impulsivity, machine learning, biomarkers, causal inference
Citation: Liu S, Chen Y, Zhang L, Zhang X, Min J, Yang Y, Li M, Cai Z, Sun Y, Wang J, Chen Z, Li H, Chen F, Hou J, Shui R, Zhou G and Zhu E (2025) Biomarker signatures as predictors of future impulsivity in schizophrenia: a multi-center study. Front. Psychiatry 16:1620131. doi: 10.3389/fpsyt.2025.1620131
Received: 29 April 2025; Accepted: 25 August 2025;
Published: 29 September 2025.
Edited by:
Megha Agarwal, Jaypee Institute of Information Technology, IndiaReviewed by:
Satyajeet Pramod Khare, Symbiosis International University, IndiaQing Ma, East China Normal University, China
Copyright © 2025 Liu, Chen, Zhang, Zhang, Min, Yang, Li, Cai, Sun, Wang, Chen, Li, Chen, Hou, Shui, Zhou and Zhu. This is an open-access article distributed under the terms of the Creative Commons Attribution License (CC BY). The use, distribution or reproduction in other forums is permitted, provided the original author(s) and the copyright owner(s) are credited and that the original publication in this journal is cited, in accordance with accepted academic practice. No use, distribution or reproduction is permitted which does not comply with these terms.
*Correspondence: Guoquan Zhou, MTk4MjEyOTIxNzFAMTM5LmNvbQ==; Enzhao Zhu, emh1ZW56aGFvQG91dGxvb2suY29t
†These authors have contributed equally to this work