 Wei Zhang1
 Na Li2*
- 1Department of Emergency, Hebei Provincial Hospital of Traditional Chinese Medicine, Shijiazhuang, China
- 2Department of Psychiatric and Psychological, Hebei Provincial Hospital of Traditional Chinese Medicine, Shijiazhuang, China
Background: Individuals with bipolar disorder (BD) exhibit a significantly increased risk of cardiovascular disease, yet the specific mechanisms linking heart failure (HF) and BD remain poorly understood. This study aimed to identify common potential diagnostic biomarkers associated with both conditions.
Methods: Differentially expressed genes (DEGs) were analyzed separately in HF (GSE57338) and BD (GSE5389) datasets. Key module genes for each condition were identified through co-expression network analysis and intersected with DEGs to pinpoint candidate genes. Subsequently, a protein-protein interaction (PPI) network, receiver operating characteristic (ROC) analysis, and expression validation were employed to identify potential diagnostic biomarkers. Gene set enrichment analysis (GSEA) and drug predictions were also conducted. Clinical validation of biomarker expression was performed via quantitative polymerase chain reaction (qPCR).
Results: A total of 44 candidate genes were identified as being associated with both HF and BD. Six potential diagnostic biomarkers (UBE2E3, FZD2, EXT1, DCHS1, BMP4, and ALDH1A2) were selected. These biomarkers were predominantly linked to the “cytokine-cytokine receptor interaction” and “ECM receptor interaction” pathways. Additionally, four potential drugs—VANTICTUMAB, RETINOL, HYDROCHLOROTHIAZIDE, and ATENOLOL—were identified as targets for these biomarkers. Expression trends of FZD2, DCHS1, BMP4, and ALDH1A2 validated by qPCR were consistent with dataset findings.
Conclusion: This study preliminarily explored the common molecular mechanisms between HF and BD, and identified 6 potential biomarkers for early detection, providing a solid theoretical basis for future research on HF and BD.
1 Introduction
Bipolar disorder (BD) is a severe mental disorder that typically first appears in adolescence or young adulthood (1). Studies have shown that the incidence rate of BD ranges from 1% to 3% (2, 3). The disease is mainly characterized by significant mood swings, neuropsychological deficits, and major changes in the physiological and immune systems. These changes may lead to dysfunction and are accompanied by a higher mortality rate (4, 5). BD includes three main phases: depressive phase, manic phase, and hypomanic phase. Patients experience recurrent episodes between these phases, going through periodic mood swings (6). Concurrently, societal advances, shifts in lifestyle, and an aging population have contributed to a significant rise in heart failure (HF) cases, placing considerable strain on public health (7, 8). Notably, research has demonstrated that individuals with severe mental illnesses, such as BD, schizophrenia, and major depression, carry a disproportionate cardiovascular disease (CVD) burden compared to the general population, resulting in a life expectancy reduction of approximately 20 years for these individuals (9, 10). These findings underscore the urgent need for targeted interventions to prevent cardiovascular mortality in these high-risk groups.
The heightened cardiovascular risk in BD can be attributed to several factors, including lifestyle choices, adverse effects of psychotropic medications, and shared genetic predispositions between severe psychiatric disorders and CVD (11, 12). Furthermore, patients with BD often exhibit autonomic nervous system dysfunction, leading to reduced heart rate variability compared to healthy individuals, which further elevates the risk of cardiovascular events (12). Psychological stressors, such as emotional fluctuations and heightened anxiety, are common among patients with BD and may exacerbate cardiac dysfunction through neuroendocrine pathways, intensifying HF symptoms (13). Recent studies have highlighted the significance of the heart-brain axis in regulating cardiac function, particularly in patients with HF. This bidirectional feedback system can lead to both acute and chronic functional impairments (14). Studies have shown that excessive activation of the sympathetic nerve in patients with heart failure (HF) may lead to myocardial remodeling, while abnormal processing of stress signals in the prefrontal cortex of patients with bipolar disorder (BD) may exacerbate their mood swings (15). Additionally, cytokines such as TNF-α and IL-6 play key roles in myocardial fibrosis in HF and neuroinflammation in mental disorders (16, 17). However, effective biomarkers and therapeutic strategies are currently lacking to address the complex pathology of such patients. Against this backdrop, this study aims to identify potential biomarkers associated with HF and BD through bioinformatics approaches, providing theoretical support for the development of more precise treatment regimens.
The precise mechanisms underlying the co-occurrence of BD and HF remain unclear, and key molecular factors linking the two conditions have yet to be thoroughly explored. Furthermore, the absence of comprehensive information regarding the risk factors for HF in patients with BD hampers the development of effective management strategies aimed at reducing mortality. To address this critical gap, our study aims to identify potential common potential diagnostic biomarkers for BD and HF through bioinformatics approaches, evaluate their diagnostic value, and predict potential therapeutic targets for these biomarkers, with the goal of uncovering novel treatment strategies for BD individuals with HF.
2 Materials and methods
2.1 Data acquisition
The GEOquery package was used to download the expression matrix data and GPL platform annotation files for HF and BD-related datasets from the GEO database (https://www.ncbi.nlm.nih.gov/geo/), and the expression matrix and sample metadata were extracted. The distinct function was used to remove duplicate genes, avoiding biases caused by gene repetition. Gene names were standardized to ensure consistency in gene identification. The expression values were log2 transformed to make the data conform more closely to the normal distribution assumption, while outliers (values less than or equal to 0) were handled for subsequent statistical analysis. The GSE57338 dataset included 136 normal heart tissue samples and 177 HF samples, while the GSE5389 dataset comprised 11 normal brain tissue samples and 10 BD samples. The GSE16499 dataset (15 ischemic heart failure samples and 15 age- and sex-matched control heart samples) and the GSE18312 dataset (9 BD samples and 8 controls samples) were used as validation sets.
2.2 Construction of co-expression networks
For the GSE57338 dataset, hierarchical clustering (complete linkage method) was employed to compute Euclidean distances between samples. Outliers were identified based on a cutting height (cutHeight = 110), and any identified outlier samples were removed. A co-expression network was then constructed using weighted gene co-expression network analysis (WGCNA) (2), selecting an appropriate soft threshold to ensure an R2 value exceeding 0.85 and connectivity tending to 0. Dynamic tree cutting was applied to classify genes into distinct modules. Pearson correlation was calculated between HF and the modules, with the modules showing the strongest positive and negative correlations selected as the key modules (P-value < 0.05). The genes within these modules were defined as key module genes (18, 19). The same approach was applied to identify key module genes related to BD.
2.3 Differential and enrichment analysis
Differentially expressed genes (DEGs) in the HF (GSE57338) and BD (GSE5389) datasets were identified using the ‘limma’ package (version 3.9) (20), applying thresholds of P < 0.05 and |log2Fold Change (FC)| > 0 (21). DEGs were visualized through volcano plots and heatmaps generated using the ‘ggplot2’ package (22). A Venn diagram was used to identify common DEGs (either upregulated or downregulated) between HF and BD. These common DEGs were further overlapped with BD-ModuleGenes and HF-ModuleGenes to pinpoint candidate genes. Enrichment analysis was performed on these candidate genes using the ‘clusterProfiler’ package (23), covering Gene Ontology (GO) and Kyoto Encyclopedia of Genes and Genomes (KEGG) pathways (P-value < 0.05).
2.4 Protein-protein interaction network and ROC analysis
To explore the protein-level interactions of candidate genes, a PPI network was constructed using the STRING database (https://STRING-db.org/) with a confidence score threshold of > 0.15 (24). The interaction types included weighted integration of experimental validation evidence, database inclusion evidence, predictive interaction evidence, and cross-species conservation evidence (25). The Degree algorithm within the CytoHubba plugin was used to calculate the Degree values of each gene in the network, with the top 10 genes ranked by Degree identified as hub genes. Diagnostic potential was assessed using the ‘pROC’ package (26), with genes that demonstrated diagnostic value (AUC > 0.7) and consistent expression patterns in the BD and HF training sets defined as potential diagnostic biomarkers. Additionally, further validation of biomarkers was conducted using the GSE16499 dataset related to HF and the GSE18312 dataset related to BD.
2.5 Gene set enrichment analysis
In the GSE57338 and GSE5389 datasets, disease samples were categorized into high- and low-expression groups based on the median expression levels of the potential diagnostic biomarkers. Differential expression analysis was then performed, and genes were ranked according to their log2FC values. To explore the potential KEGG pathways associated with the potential diagnostic biomarkers, GSEA was applied using the ‘clusterProfiler’ package (27), with an adjusted P-value threshold of < 0.05 for pathway selection.
2.6 Molecular network
To investigate the transcriptional regulation mechanisms of potential diagnostic biomarkers, the miRNet database was used to predict the transcription factors (TFs) and microRNAs (miRNAs) targeting these biomarkers. The ‘miRNA-mRNA-TF’ regulatory network was subsequently constructed using Cytoscape (version 3.9.1) software (28).
2.7 Potential drug prediction
Potential therapeutic drugs targeting the potential diagnostic biomarkers were identified through the DGIdb database (https://dgidb.org/). A gene-drug interaction network was then visualized using Cytoscape software.
2.8 Quantitative PCR
For experimental validation, total RNA was isolated from 10 pairs of frozen whole blood samples (10 HF samples vs. 10 control samples) using Trizol reagent (Ambion, Inc., A Thermo Fisher Scientific Company). cDNA synthesis was performed using the Reverse Transcription PrimeScript 1st Strand cDNA Synthesis Kit (Clontech Laboratories, Inc., A Takara Bio Company), and quantitative PCR was carried out with SYBR PremixExTaq™ (Clontech Laboratories, Inc., A Takara Bio Company). mRNA expression was measured using the CFX 96 system. The following primer sequences were employed for the PCR (Table 1).
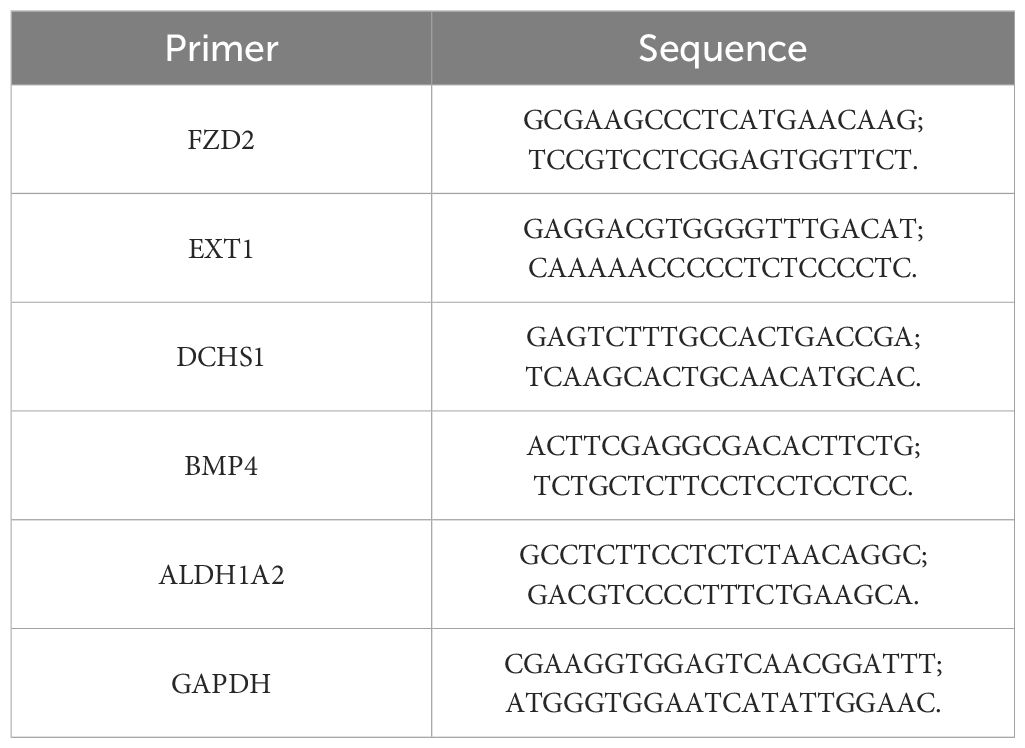
Table 1. Primer information.
The PCR conditions were as follows: pre-denaturation at 95°C for 5 minutes, denaturation at 95°C for 15 seconds, annealing at 62°C for 30 seconds for 40 cycles, and final extension at 72°C for 30 seconds. qPCR data analysis was performed using the 2-ΔΔCt method.
2.9 Statistical analysis
All statistical analyses were conducted using R software (version 4.2.2) (R Core Team (2021). R: A language and environment for statistical computing. R Foundation for Statistical Computing, Vienna, Austria. https://www.R-project.org/). The Wilcoxon rank-sum test was used for comparing differences between the two groups in the bioinformatics analysis, and Pearson correlation was applied for correlation analysis. For RT-qPCR, the t-test was used to compare differences between groups. A P-value < 0.05 was considered statistically significant, and the significance threshold for the GSEA was set at an adjusted P-value < 0.05.
3 Results
3.1 Identification of differential and module genes for HF
A total of 11,665 DEGs were identified in the GSE57338 dataset for HF, including 6,347 downregulated and 5,318 upregulated genes (Figures 1A, B). Following clustering, two outlier samples were excluded (Supplementary Figure S1). A soft threshold of 5 was selected to construct the co-expression network (Figure 1C). The network was partitioned into eight distinct modules (Figure 1D), with the black and green modules showing significant associations with HF, making them key modules (Figure 1E). The number of genes in each module is shown in Table 2. A total of 1,691 genes were identified as key module genes related to HF.
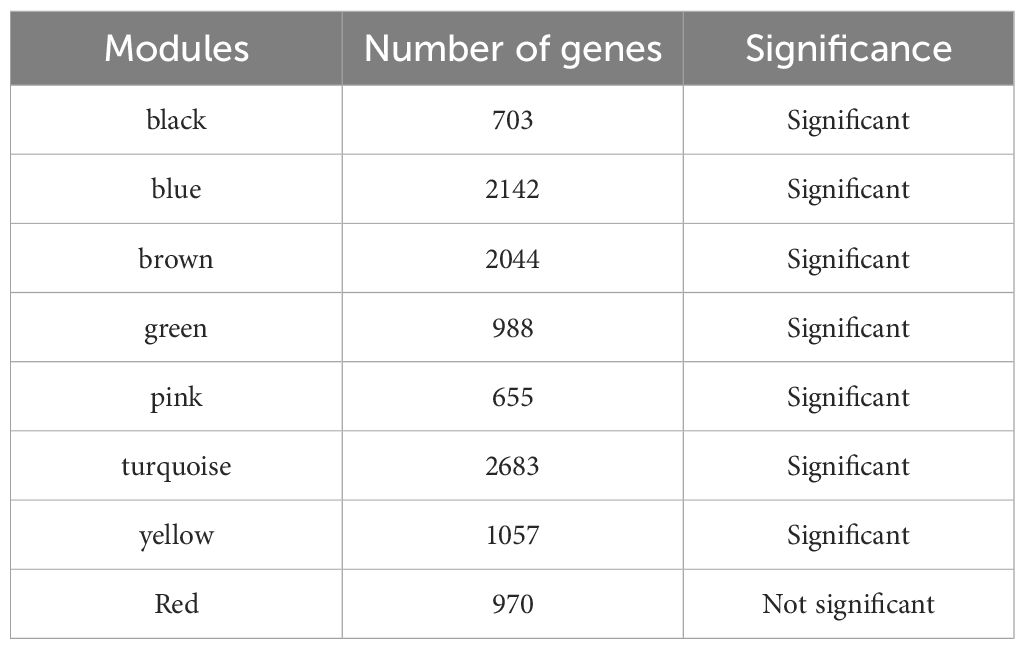
Table 2.. The number of genes in each module of GSE57338.
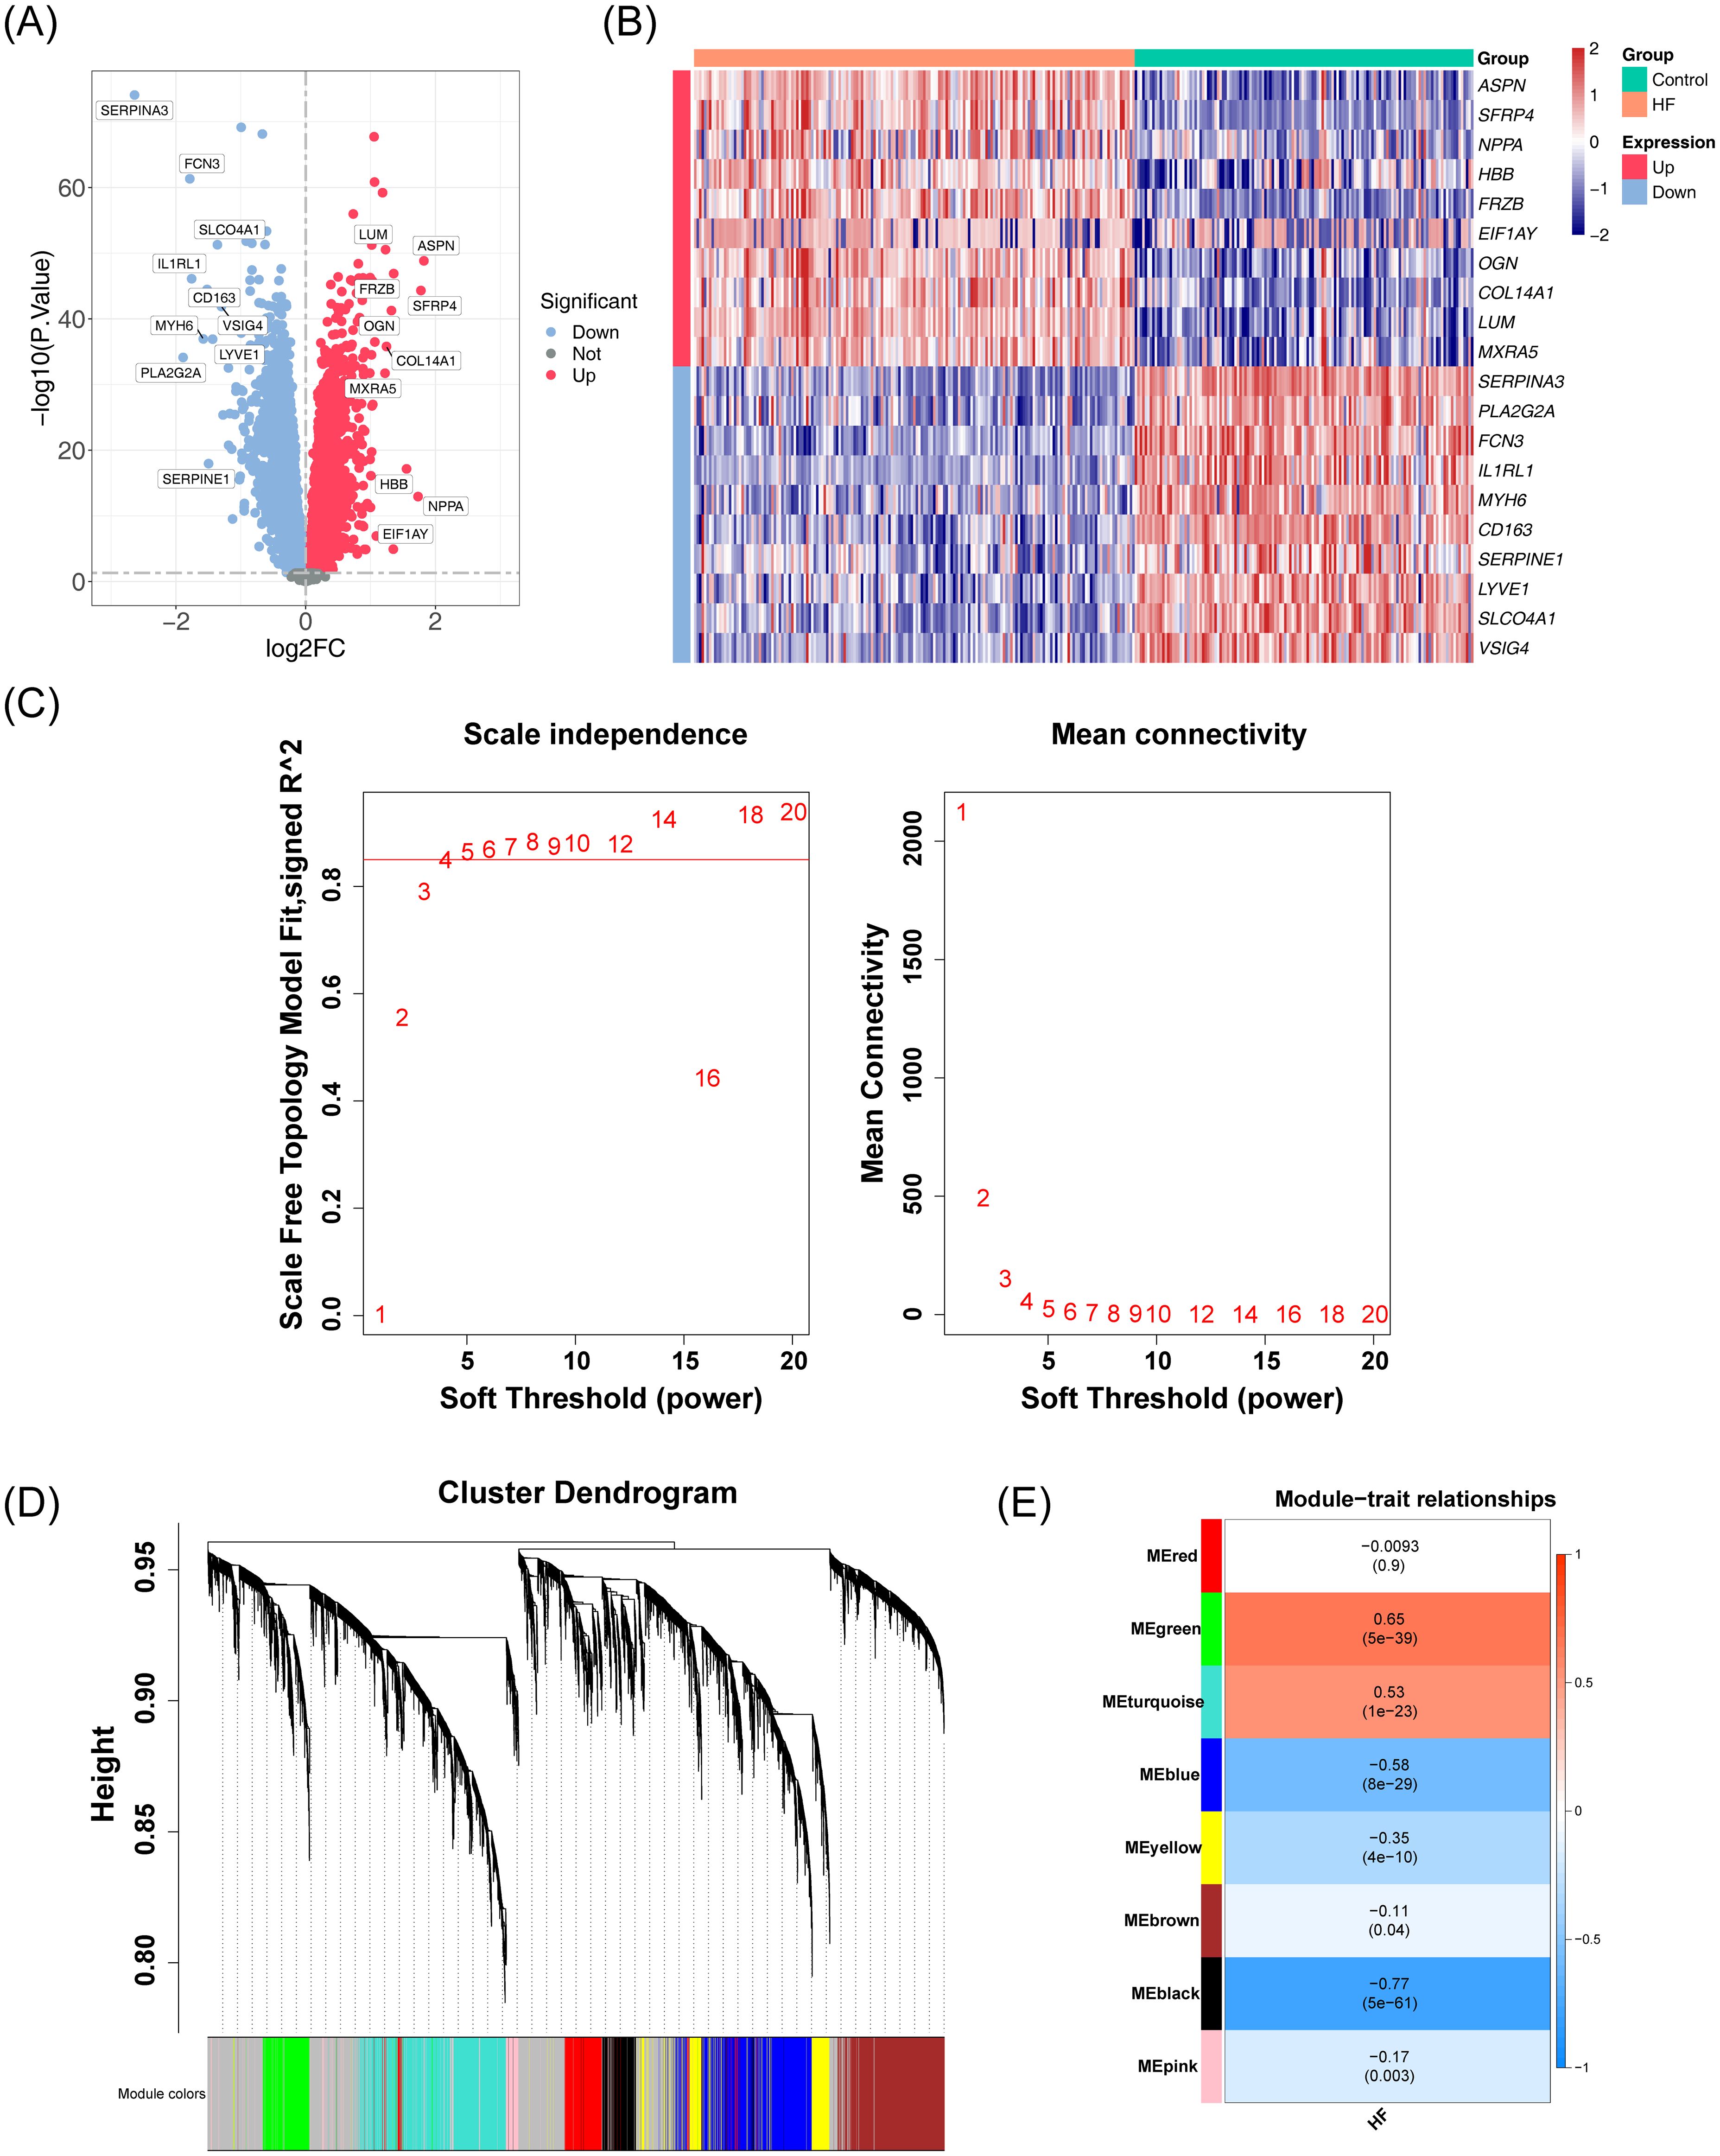
Figure 1. Analysis of DEGs and co-expression modules in the GSE57338 dataset. (A) Volcano plot displaying the distribution of DEGs in the GSE57338 dataset. A total of 11,665 DEGs were identified. Each point represents a gene: red indicates upregulated genes, blue indicates downregulated genes, and gray represents genes with no significant differential expression. (B) Heatmap illustrating the distribution of DEGs in the GSE57338 dataset. Gene expression levels are color-coded: red represents high expression, blue represents low expression, with the intensity of color reflecting the magnitude of gene expression. (C) Soft threshold screening. The scale-free fit index (left) and mean connectivity (right) are shown. A soft threshold of 5 was chosen for the network construction. (D) Hierarchical clustering tree of co-expression modules, with distinct colors representing different modules. A total of eight modules were identified. (E) Heatmap of module-trait correlations. Positive correlations are shown in red, while negative correlations are shown in blue. The horizontal axis represents traits, and the vertical axis represents the modules. Correlation coefficients are displayed in each grid, with larger absolute values indicating stronger correlations. Significance P-values are provided in parentheses, with smaller P-values indicating more statistically significant results.
3.2 Identification of differential and module genes for BD
In the GSE5389 dataset for BD, 2,549 DEGs were identified, including 1,073 downregulated and 1,476 upregulated genes (Figures 2A, B). No outlier samples were detected after clustering the data (Supplementary Figure S2). A soft threshold of 9 was selected for constructing the co-expression network (Figure 2C), resulting in the identification of seven modules (Figure 2D). The number of genes in each module is shown in Table 3. Among these, the turquoise and green modules showed significant associations with BD (Figure 2E), with 3,935 genes identified as key module genes associated with BD.
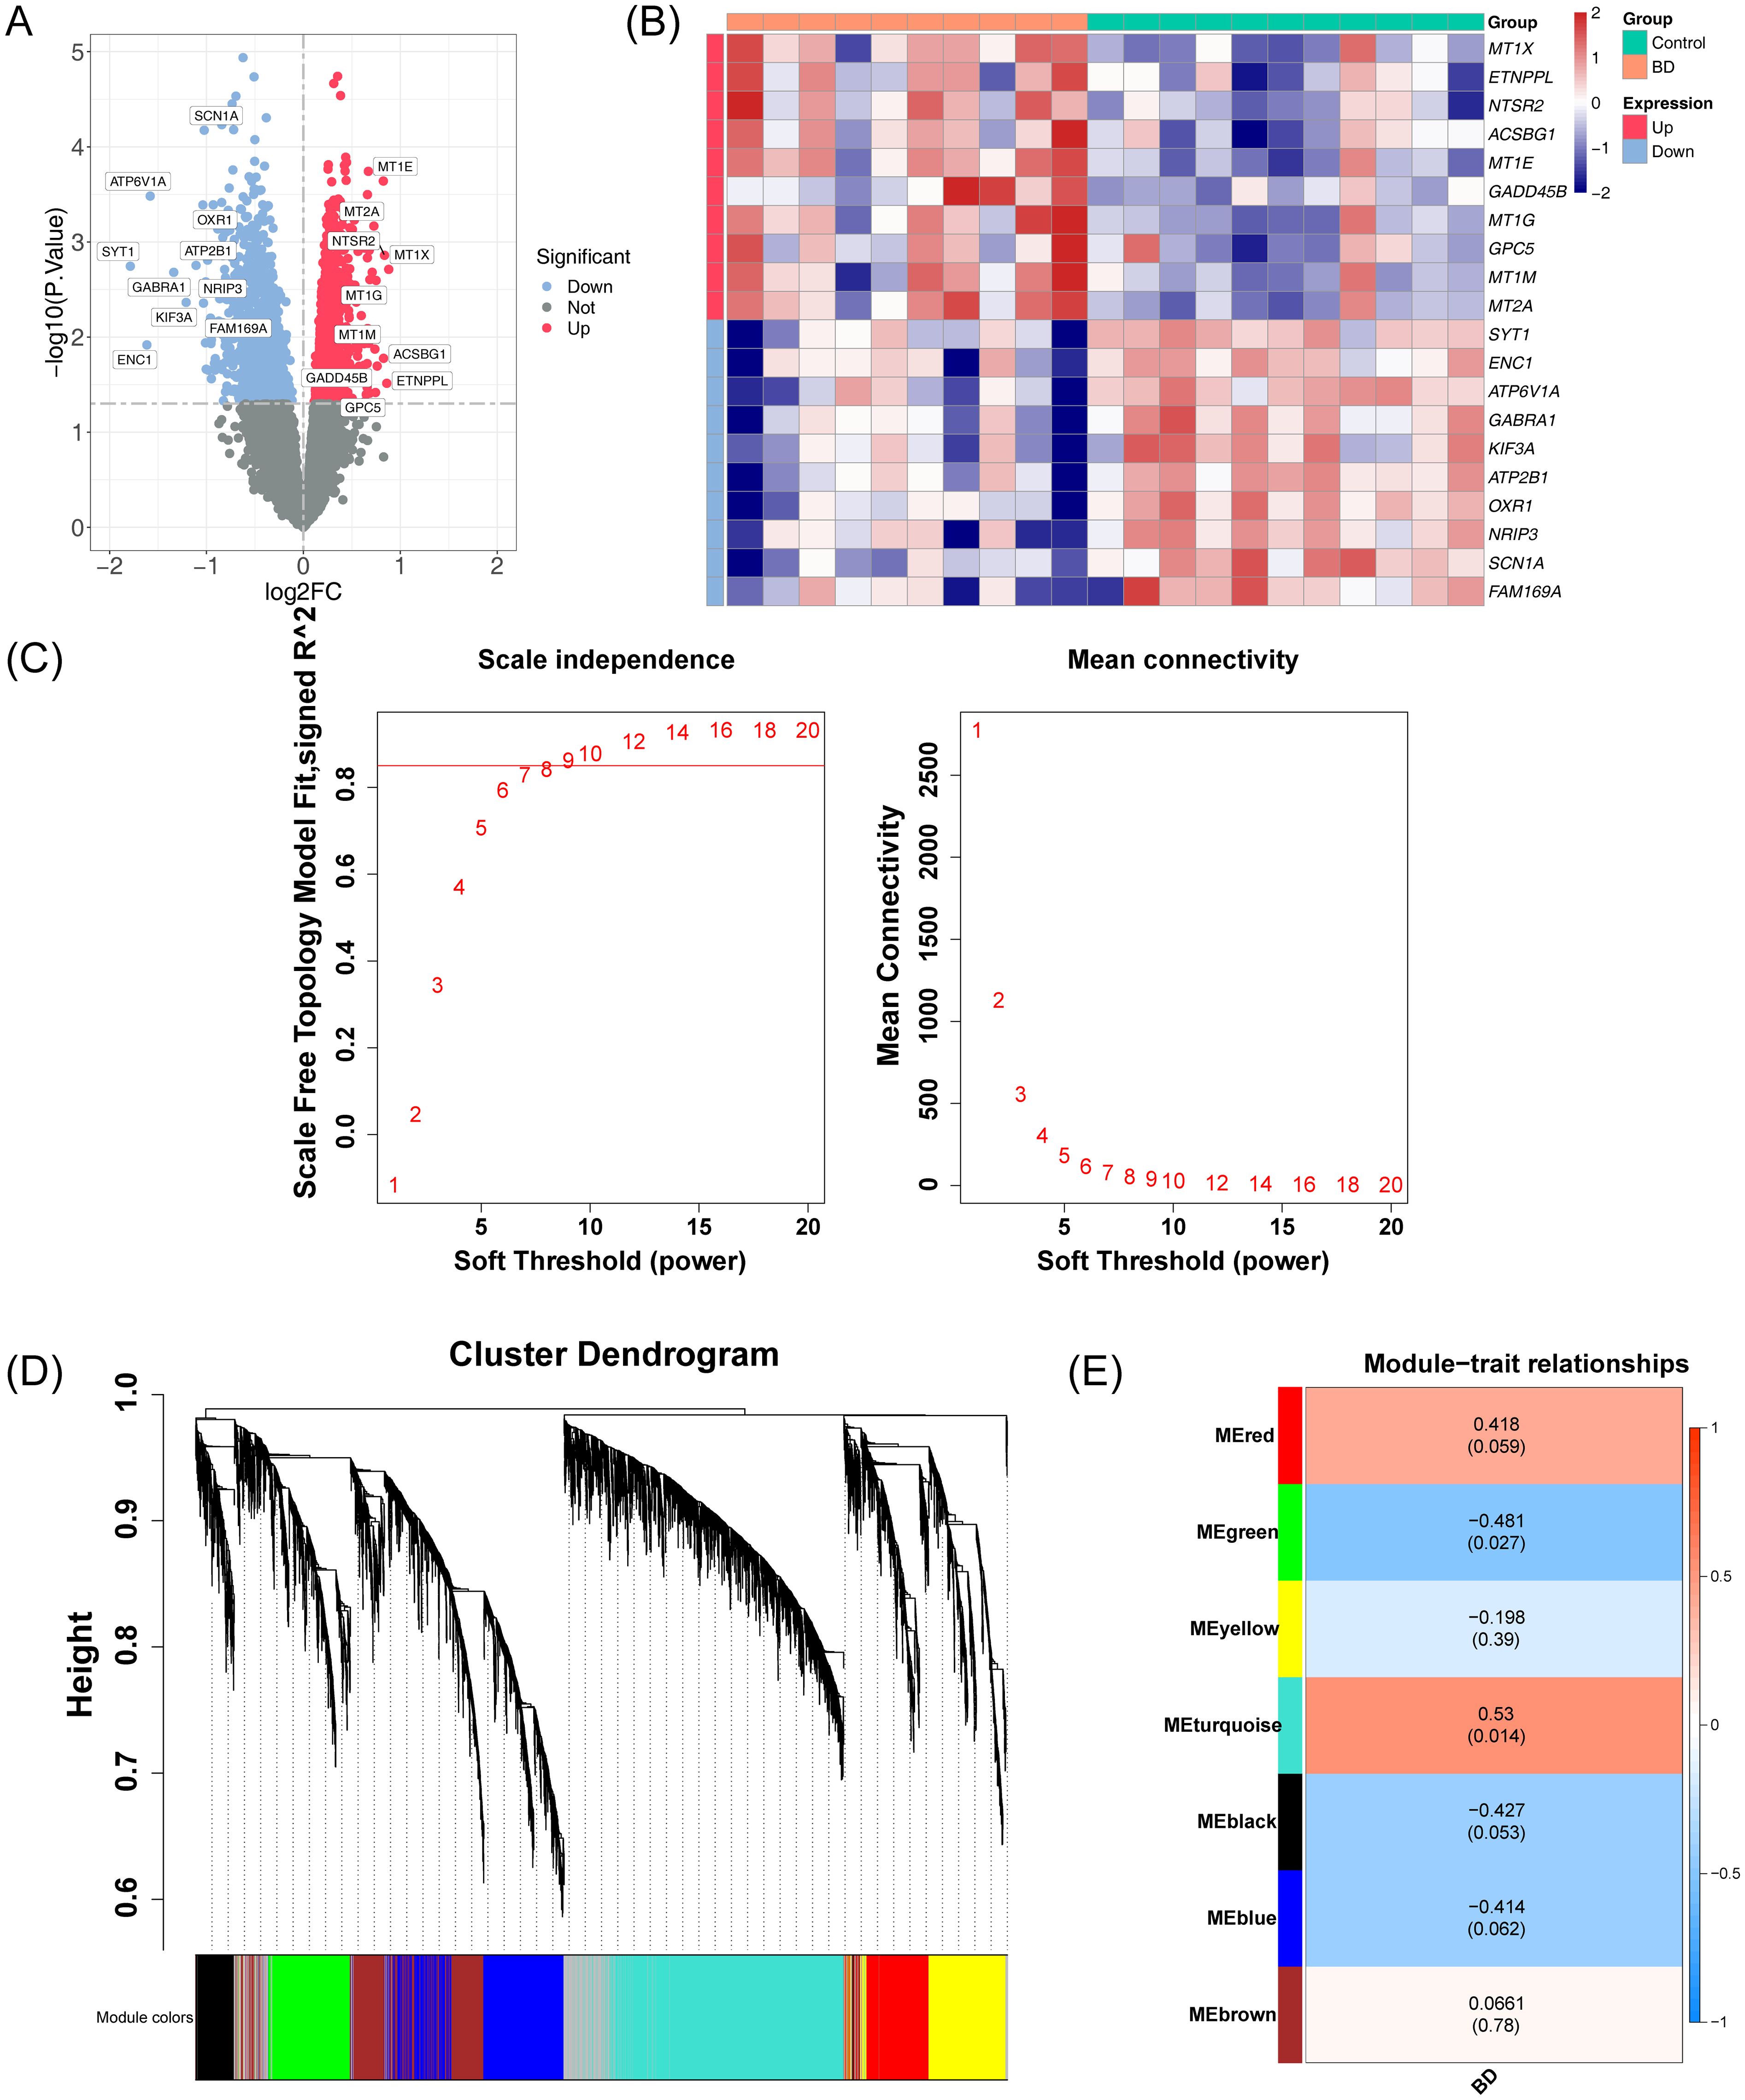
Figure 2. Integrated analysis of DEGs and co-expression modules in the GSE5389 dataset. (A) Volcano plot illustrating the distribution of DEGs in the GSE5389 dataset. A total of 2,549 DEGs were identified. Each point represents a gene: red indicates upregulated genes, blue indicates downregulated genes, and gray represents genes with no significant differential expression. (B) Heatmap showing the distribution of DEGs in the GSE5389 dataset. The intensity of the color represents the gene expression level, with red indicating high expression and blue indicating low expression. (C) Soft threshold screening. The scale-free fit index (left) and mean connectivity (right) are shown. A soft threshold of 9 was selected for the network construction. (D) Hierarchical clustering tree of co-expression modules, with distinct colors representing different modules. Seven modules were identified. (E) Heatmap of module-trait correlations. Positive correlations are depicted in red, while negative correlations are shown in blue. The horizontal axis represents traits, and the vertical axis represents the modules. Each grid shows the correlation coefficient values, with larger absolute values indicating stronger correlations. The significance P-values are displayed in parentheses, with smaller P-values indicating more statistically significant results.
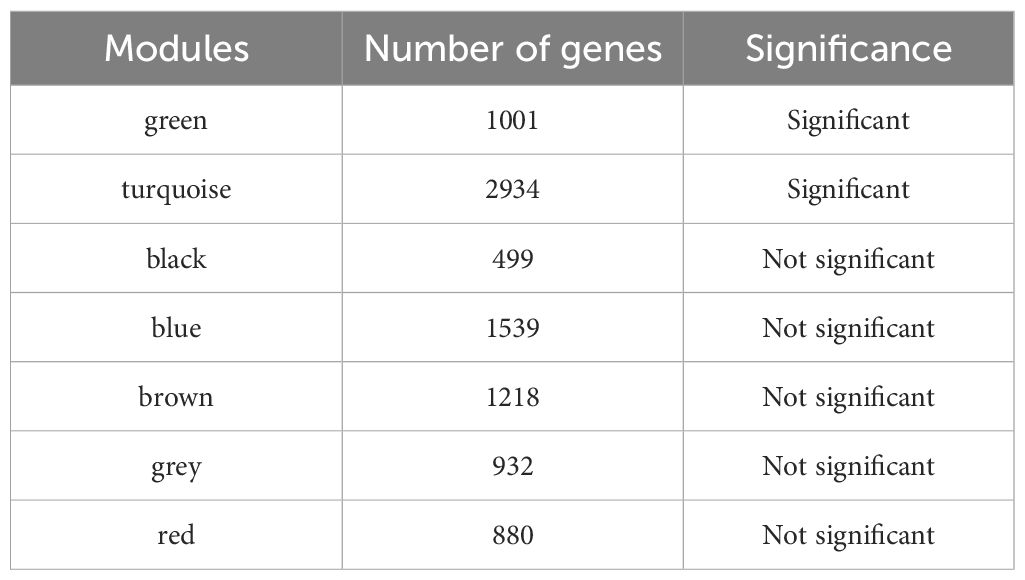
Table 3. The number of genes in each module of GSE5389.
3.3 Biomarkers screening in HF and BD
A total of 572 common DEGs were identified through the intersection of DEGs in HF and BD, comprising 279 upregulated genes (Figure 3A) and 293 downregulated genes (Figure 3B). Additionally, 572 common DEGs, 1,691 module genes strongly associated with HF in the GSE57338 dataset, and 3,967 module genes associated with BD in the GSE5389 dataset were intersected, resulting in 44 candidate genes (Figure 3C). To explore the potential mechanisms of the 44 candidate genes, functional enrichment analysis was performed. The top five GO terms indicated a predominant association with ‘neural tube development’ (Figure 3D). The top eight KEGG pathways highlighted strong involvement in the ‘RIG-I-like receptor signaling pathway’ and the ‘cAMP signaling pathway’ (Figure 3E). Furthermore, a PPI network encompassing 31 nodes and 44 edges was constructed for the candidate genes (Figure 3F). Ten hub genes (UBE2E3, FZD2, GLI3, EXT1, DCHS1, MYH11, BMP4, LOX, LFNG, and ALDH1A2) were identified using the Degree algorithm (Figure 3G).
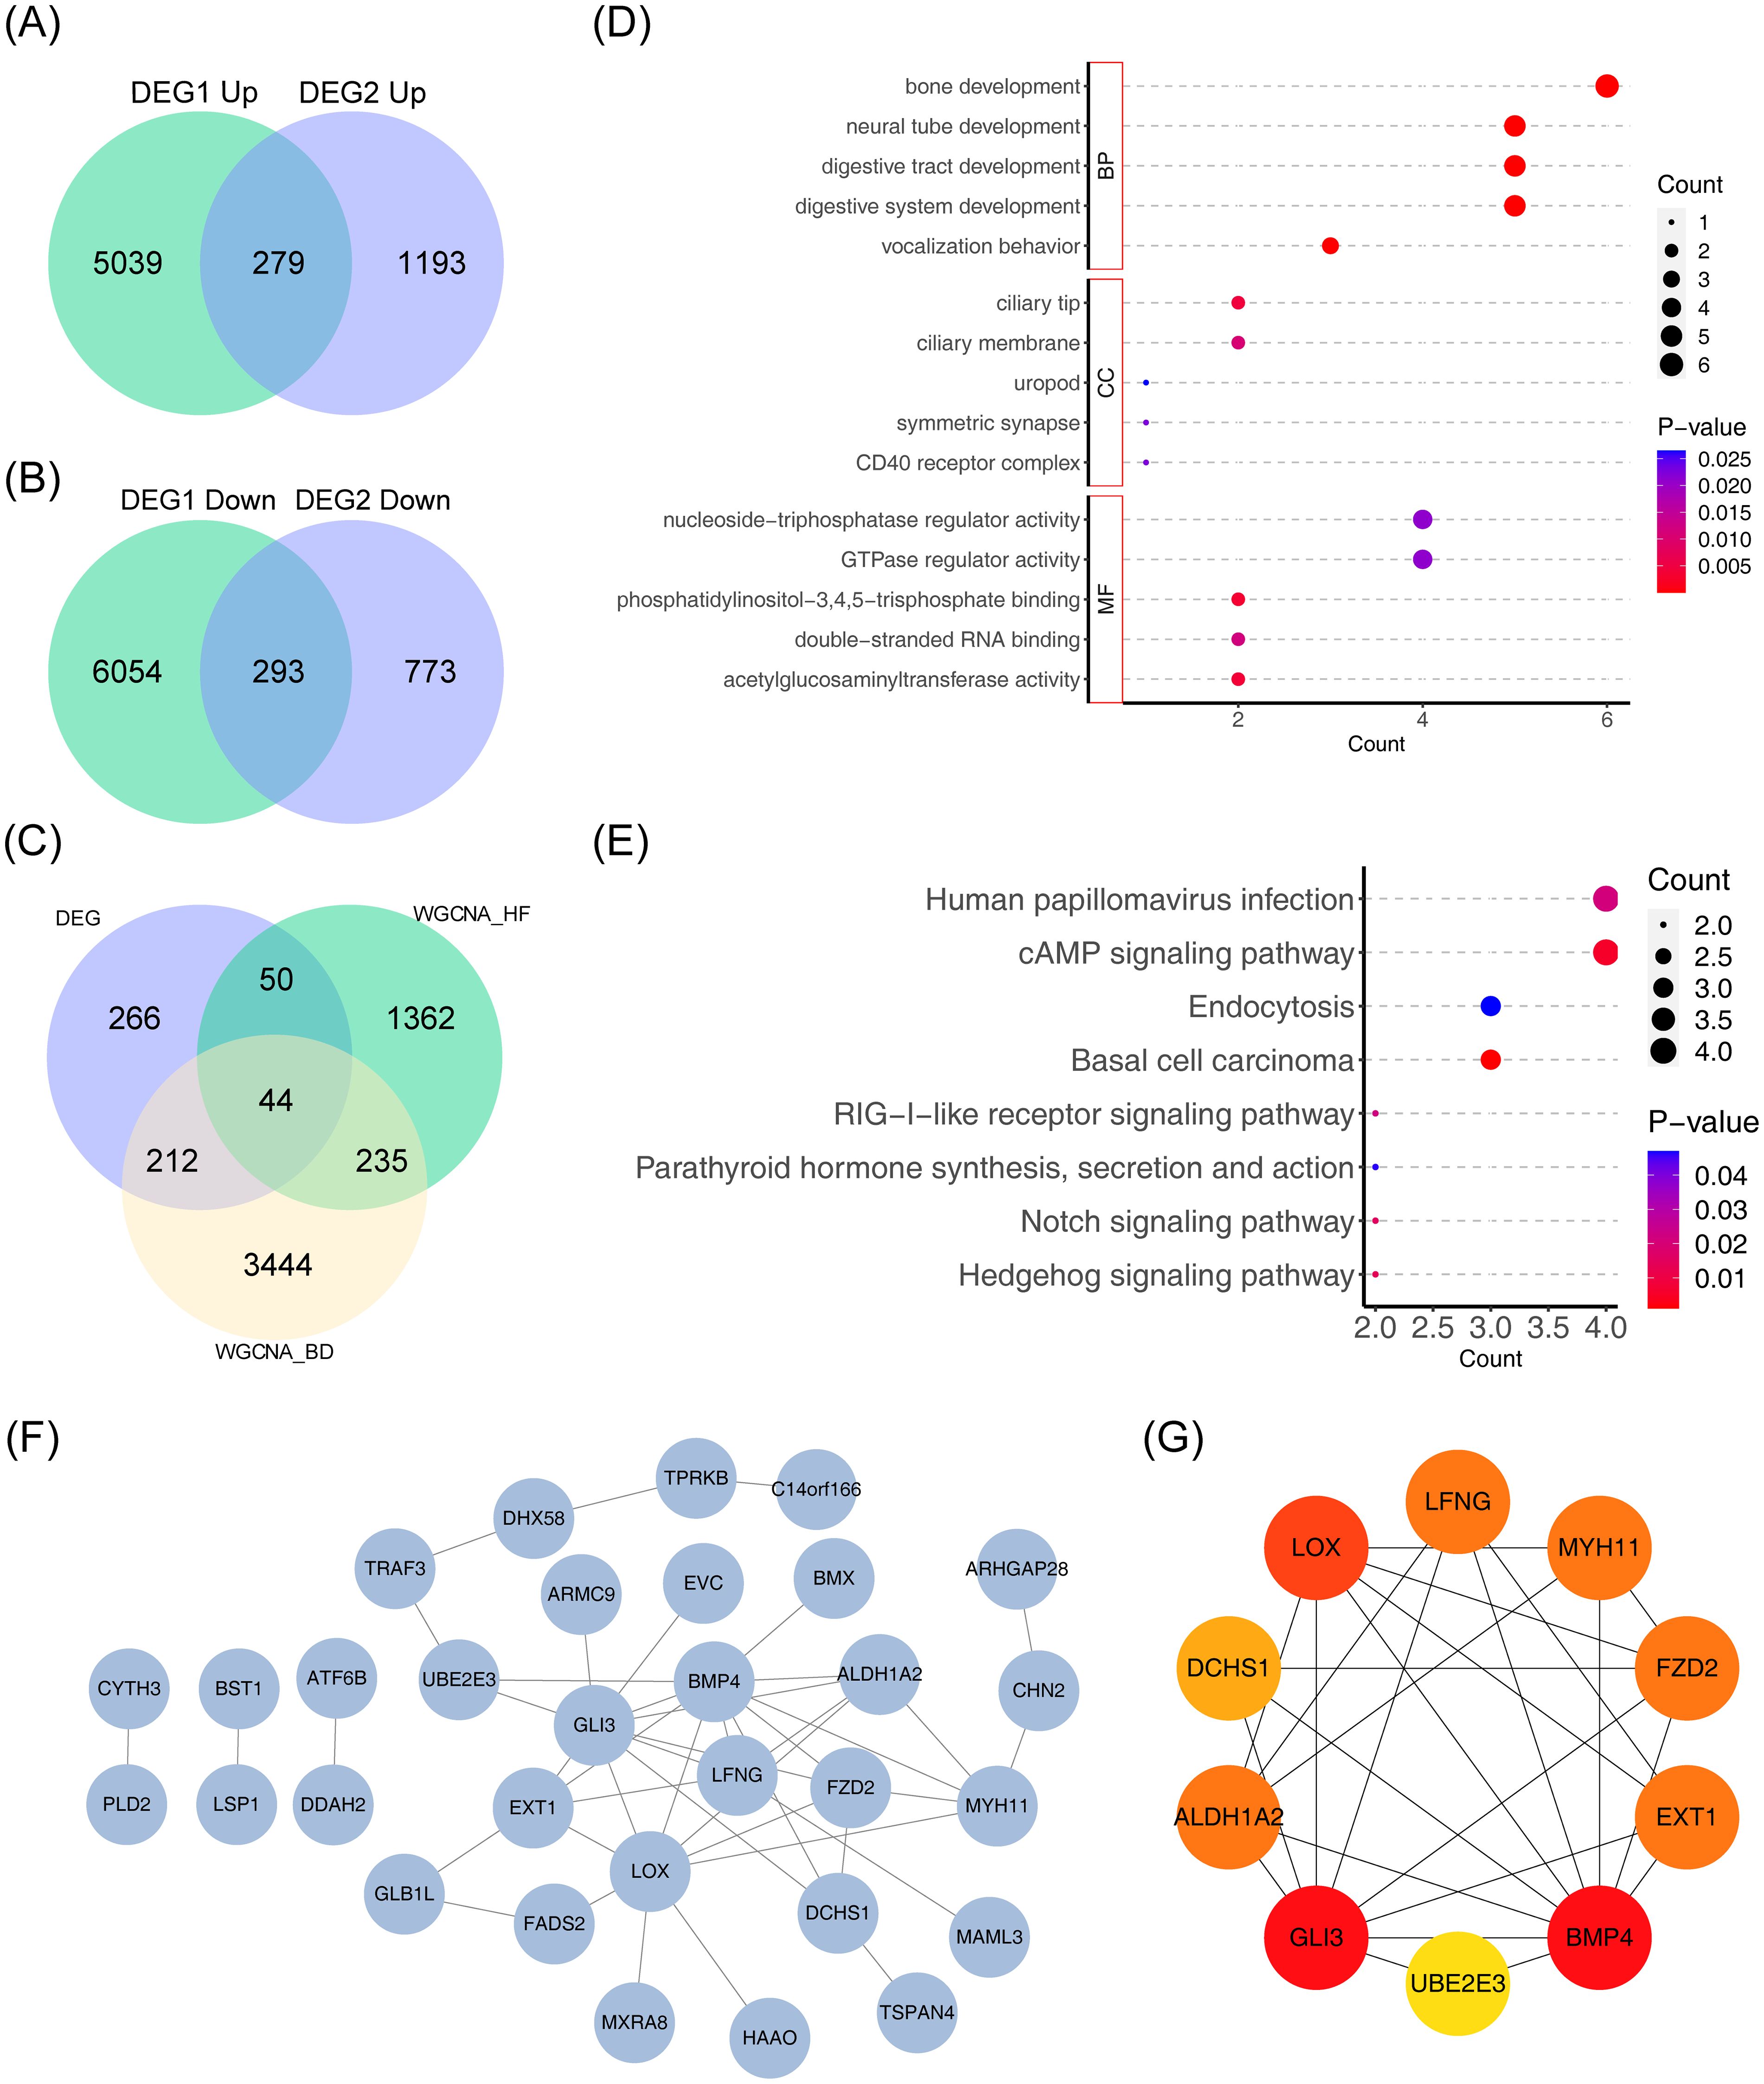
Figure 3. Genomic analysis visualizations: Venn diagrams, intersection analysis, enrichment plots, and protein network. (A) Venn diagram depicting the intersection of differentially upregulated genes across the two datasets. (B) Venn diagram depicting the intersection of differentially downregulated genes across the two datasets. (C) Venn diagram for gene intersections of shared variance modules. (D, E) Bubble plots of GO and KEGG enrichment analysis. The vertical axis represents pathway names, while the horizontal axis indicates the number of genes enriched in each pathway. Larger bubbles correspond to a greater gene count. A color gradient from blue to red reflects increasing significance. (F) Protein interaction network diagram. (G) Degree-based top 10 gene interaction network, with color changes from yellow to red denoting increasing Degree values.
3.4 Potential diagnostic biomarkers screening in HF and BD
The diagnostic accuracy of the hub genes for HF and BD was assessed using ROC curves (Figures 4A, B). The analysis revealed that six genes (UBE2E3, FZD2, EXT1, DCHS1, BMP4, and ALDH1A2) exhibited strong diagnostic performance for both HF and BD (AUC > 0.7). Additionally, increased expression of FZD2, EXT1, DCHS1, BMP4, and ALDH1A2 was observed in the disease group (HF and BD), whereas UBE2E3 showed low expression (Figures 5A, B). Consequently, these six genes were defined as potential diagnostic biomarkers for HF and BD. In the validation set GSE16499, the diagnostic performance of UBE2E3, EXT1, DCHS1, BMP4, and ALDH1A2 was relatively good (AUC > 0.6), while the diagnostic performance of FZD2 was relatively low (Supplementary Figure 1). In the validation set GSE18312, UBE2E3, EXT1, DCHS1, and FZD2 demonstrated relatively good diagnostic performance (AUC > 0.6), while the diagnostic performance of BMP4 and ALDH1A2 was relatively low (Supplementary Figure 2).
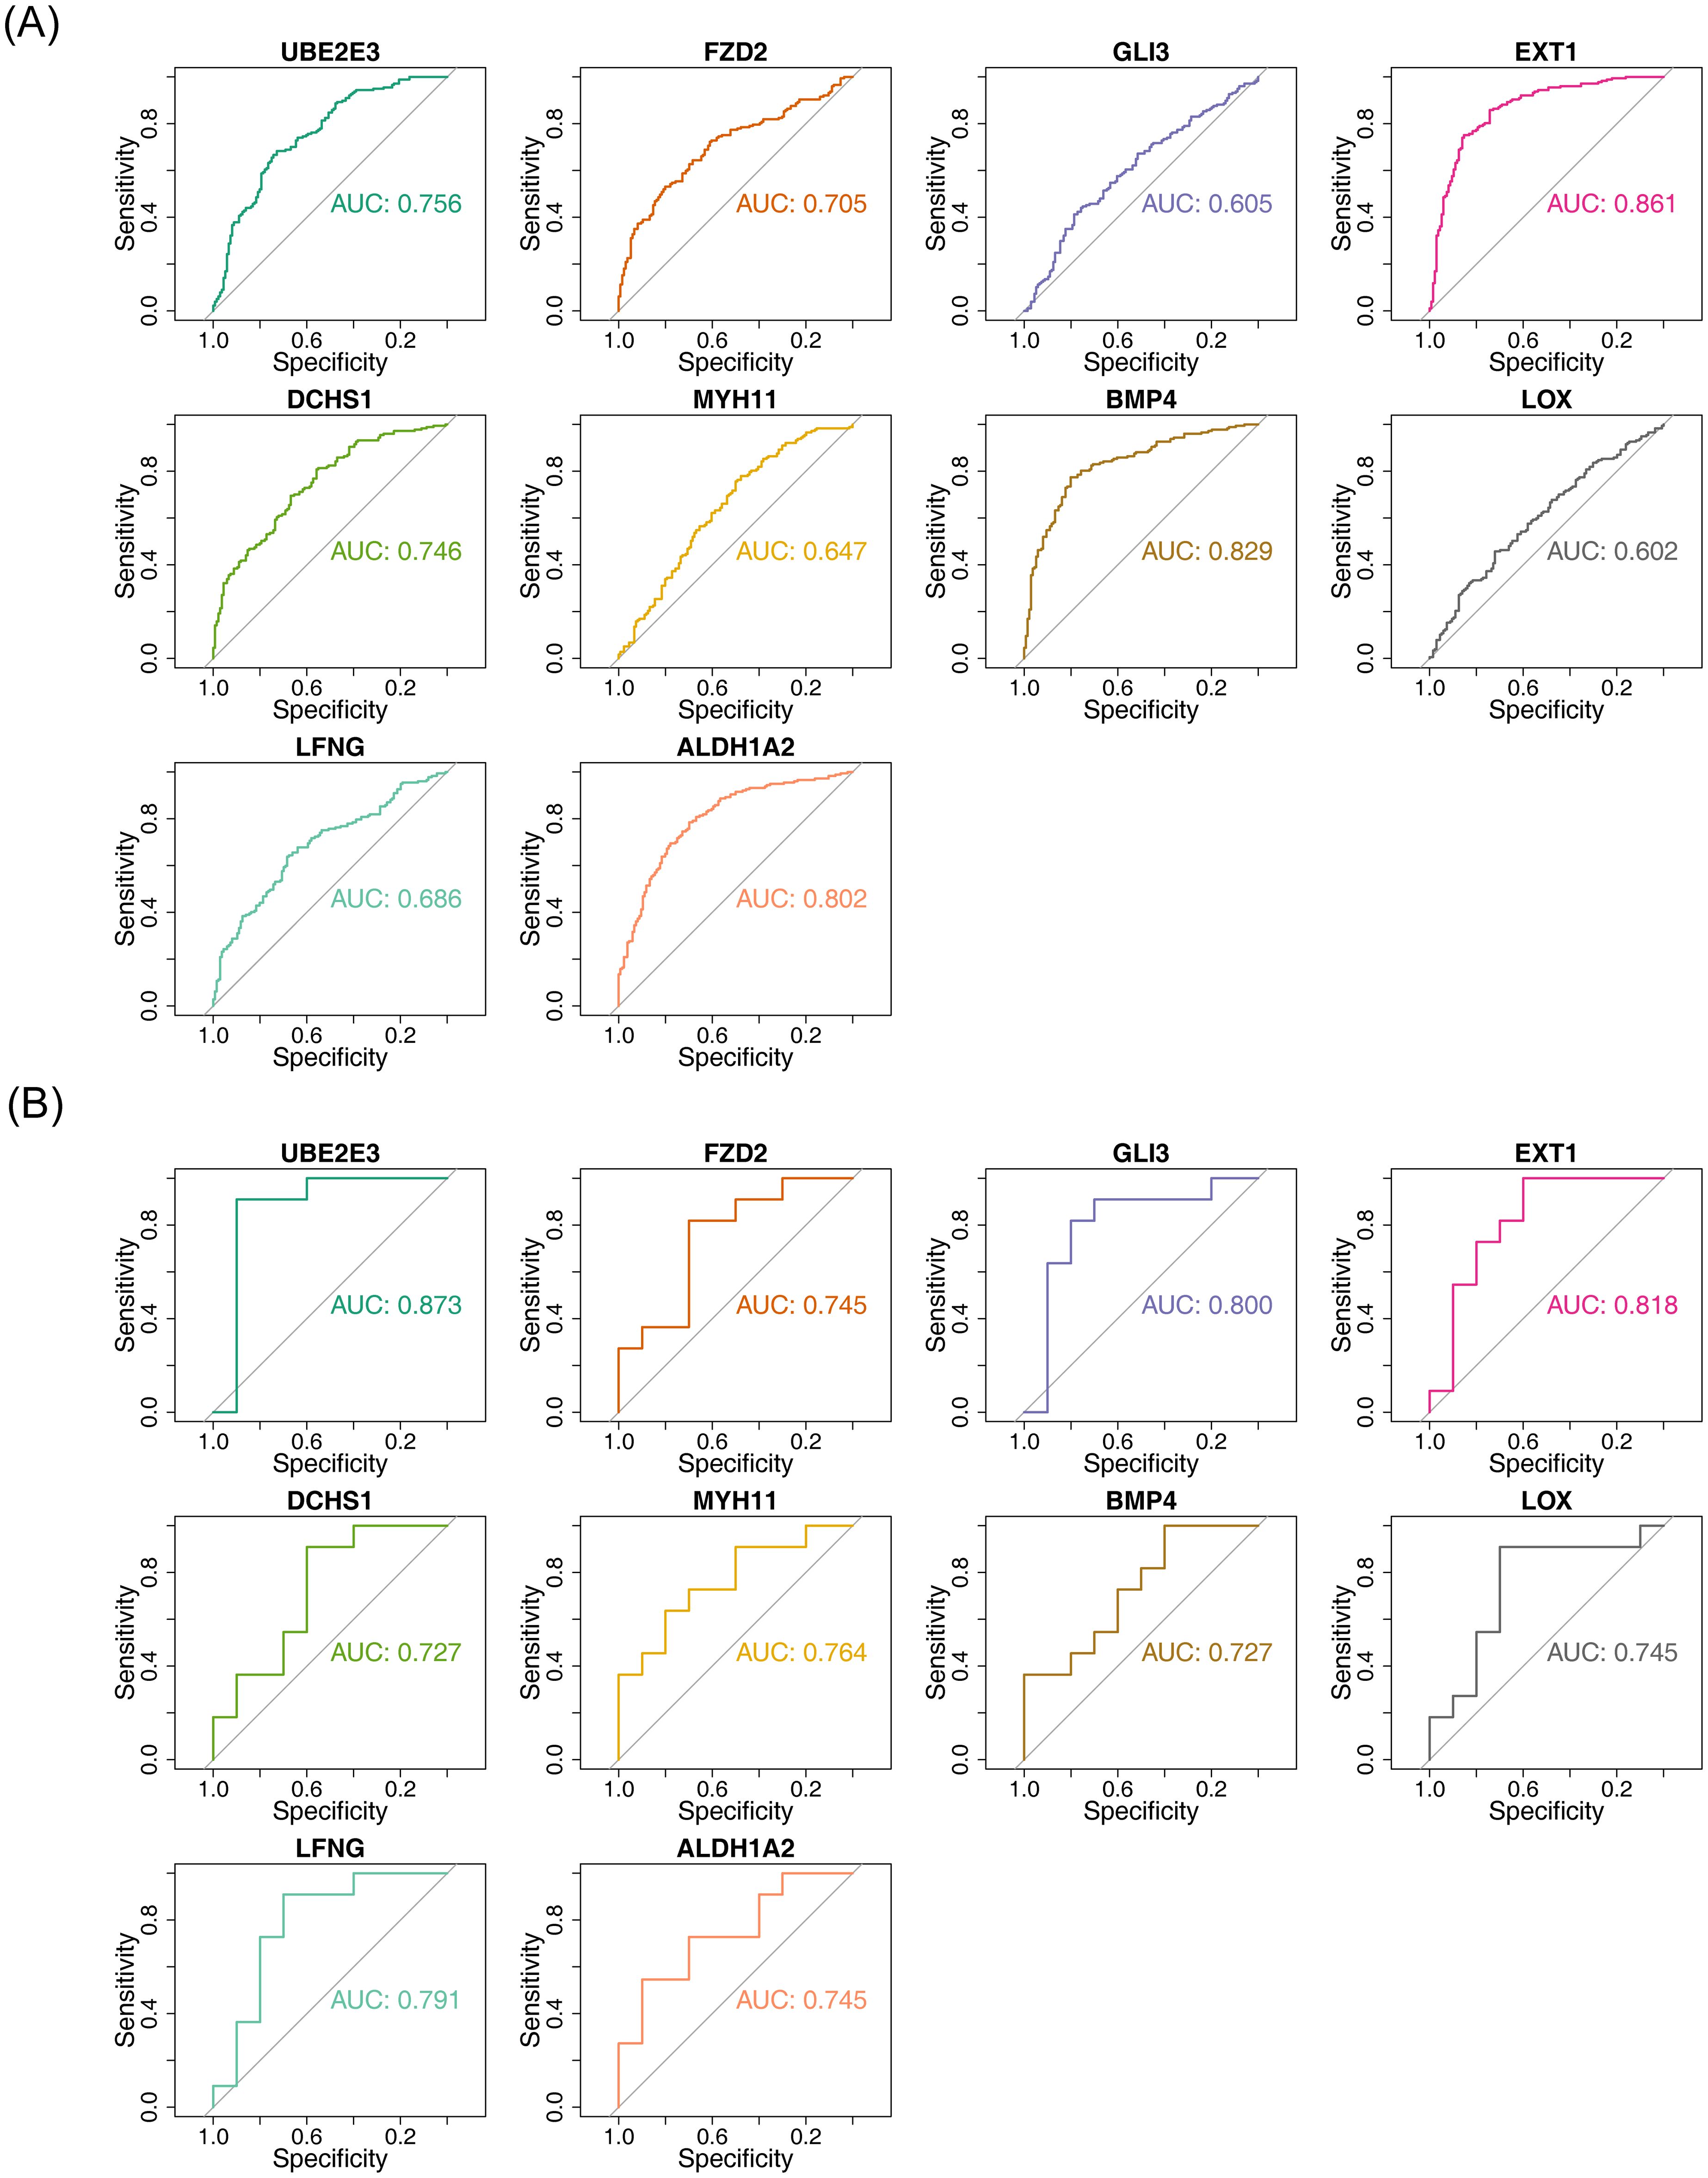
Figure 4. ROC analysis of hub genes (GSE57338 vs GSE5389). (A) ROC analysis for hub genes in GSE57338, where an AUC greater than 0.7 indicates relatively high diagnostic accuracy for HF. (B) ROC analysis for hub genes in GSE5389, with an AUC greater than 0.7 suggesting high diagnostic accuracy for BD.
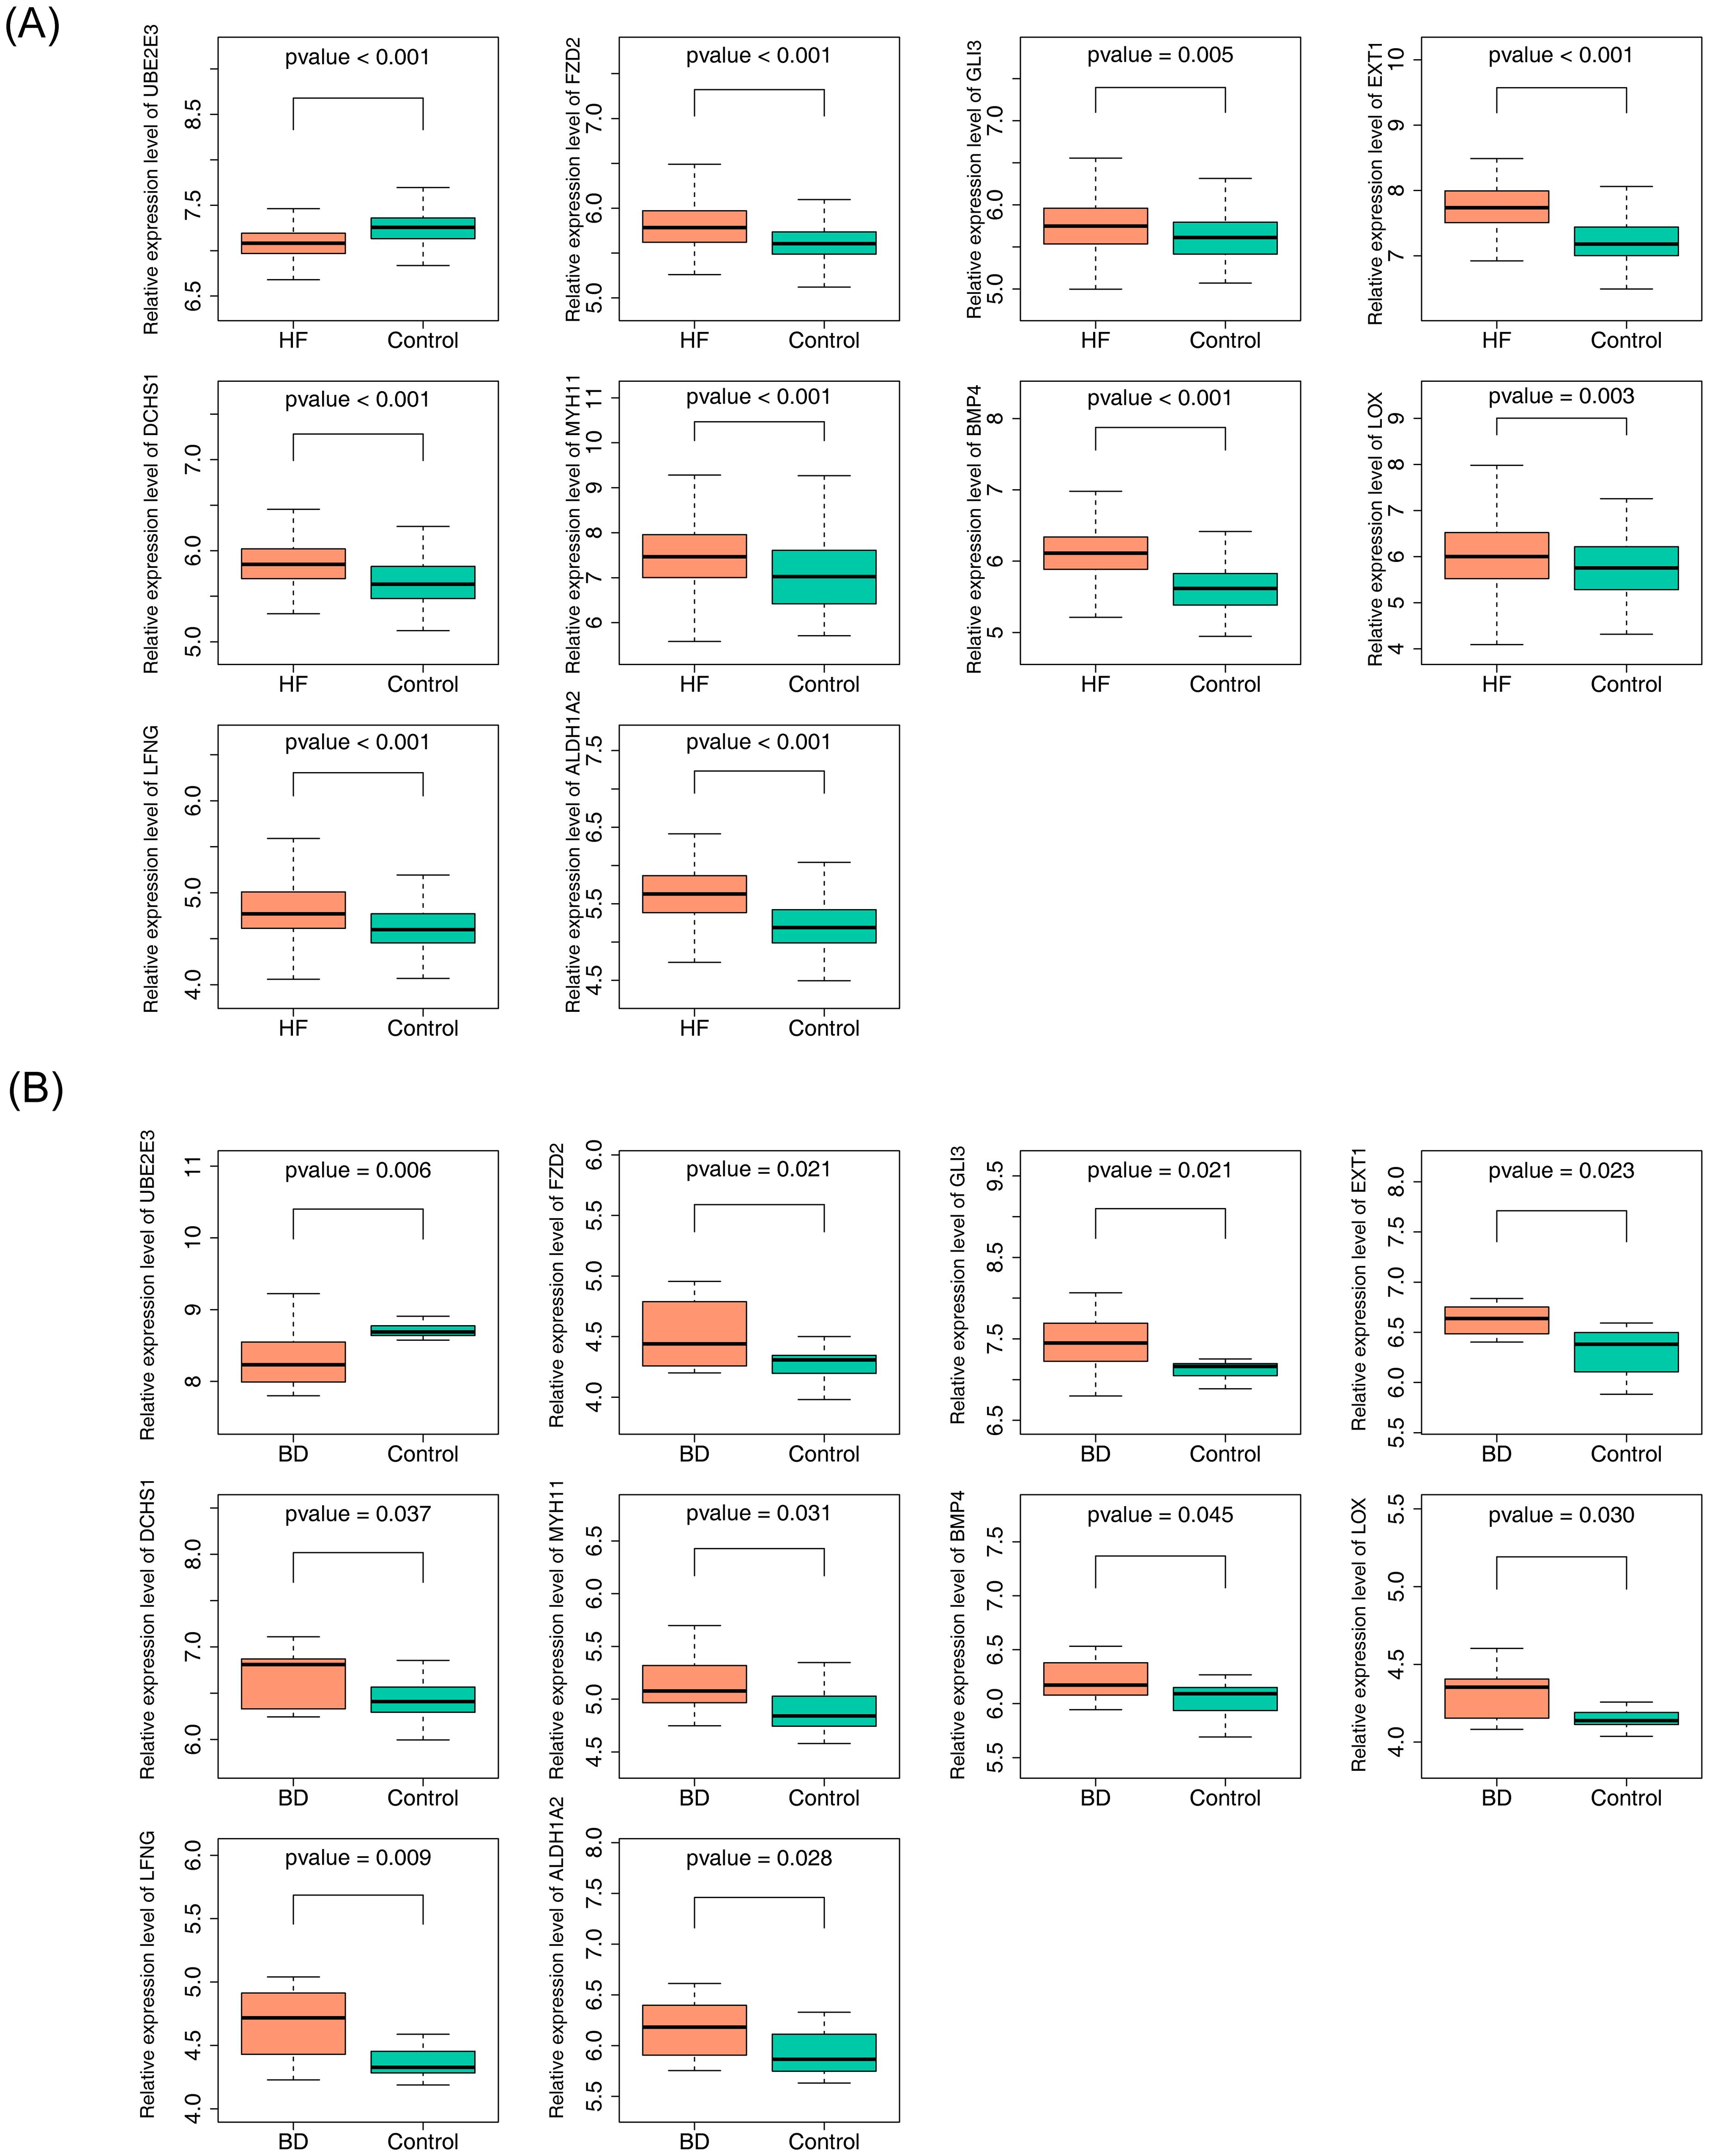
Figure 5. Expression analysis of hub genes (GSE57338 vs GSE5389). (A) Expression analysis of hub genes in GSE57338. (B) Expression analysis of hub genes in GSE5389.
3.5 GSEA of potential diagnostic biomarkers
To explore the potential roles of the six potential diagnostic biomarkers, single-gene GSEA was performed ALDH1A2 was primarily associated with ‘cytokine-cytokine receptor interaction’ in HF and ‘ubiquitin-mediated proteolysis’ in BD (Figures 6A, 7A). BMP4 was predominantly involved in ‘ribosome’ and ‘cytokine-cytokine receptor interaction’ pathways in HF and BD, respectively (Figures 6B, 7B). DCHS1 was chiefly linked to ‘cytokine-cytokine receptor interaction’ in BD and ‘ECM receptor interaction’ in HF (Figures 6C, 7C). EXT1 was enriched in ‘ECM receptor interaction’ in HF and ‘calcium signaling pathway’ in BD (Figures 6D, 7D). FZD2 was primarily associated with the ‘JAK-STAT signaling pathway’ in HF and ‘cytokine-cytokine receptor interaction’ in BD (Figures 6E, 7E). UBE2E3 was primarily enriched in the ‘ribosome’ pathway in HF and the ‘proteasome’ pathway in BD (Figures 6F, 7F).
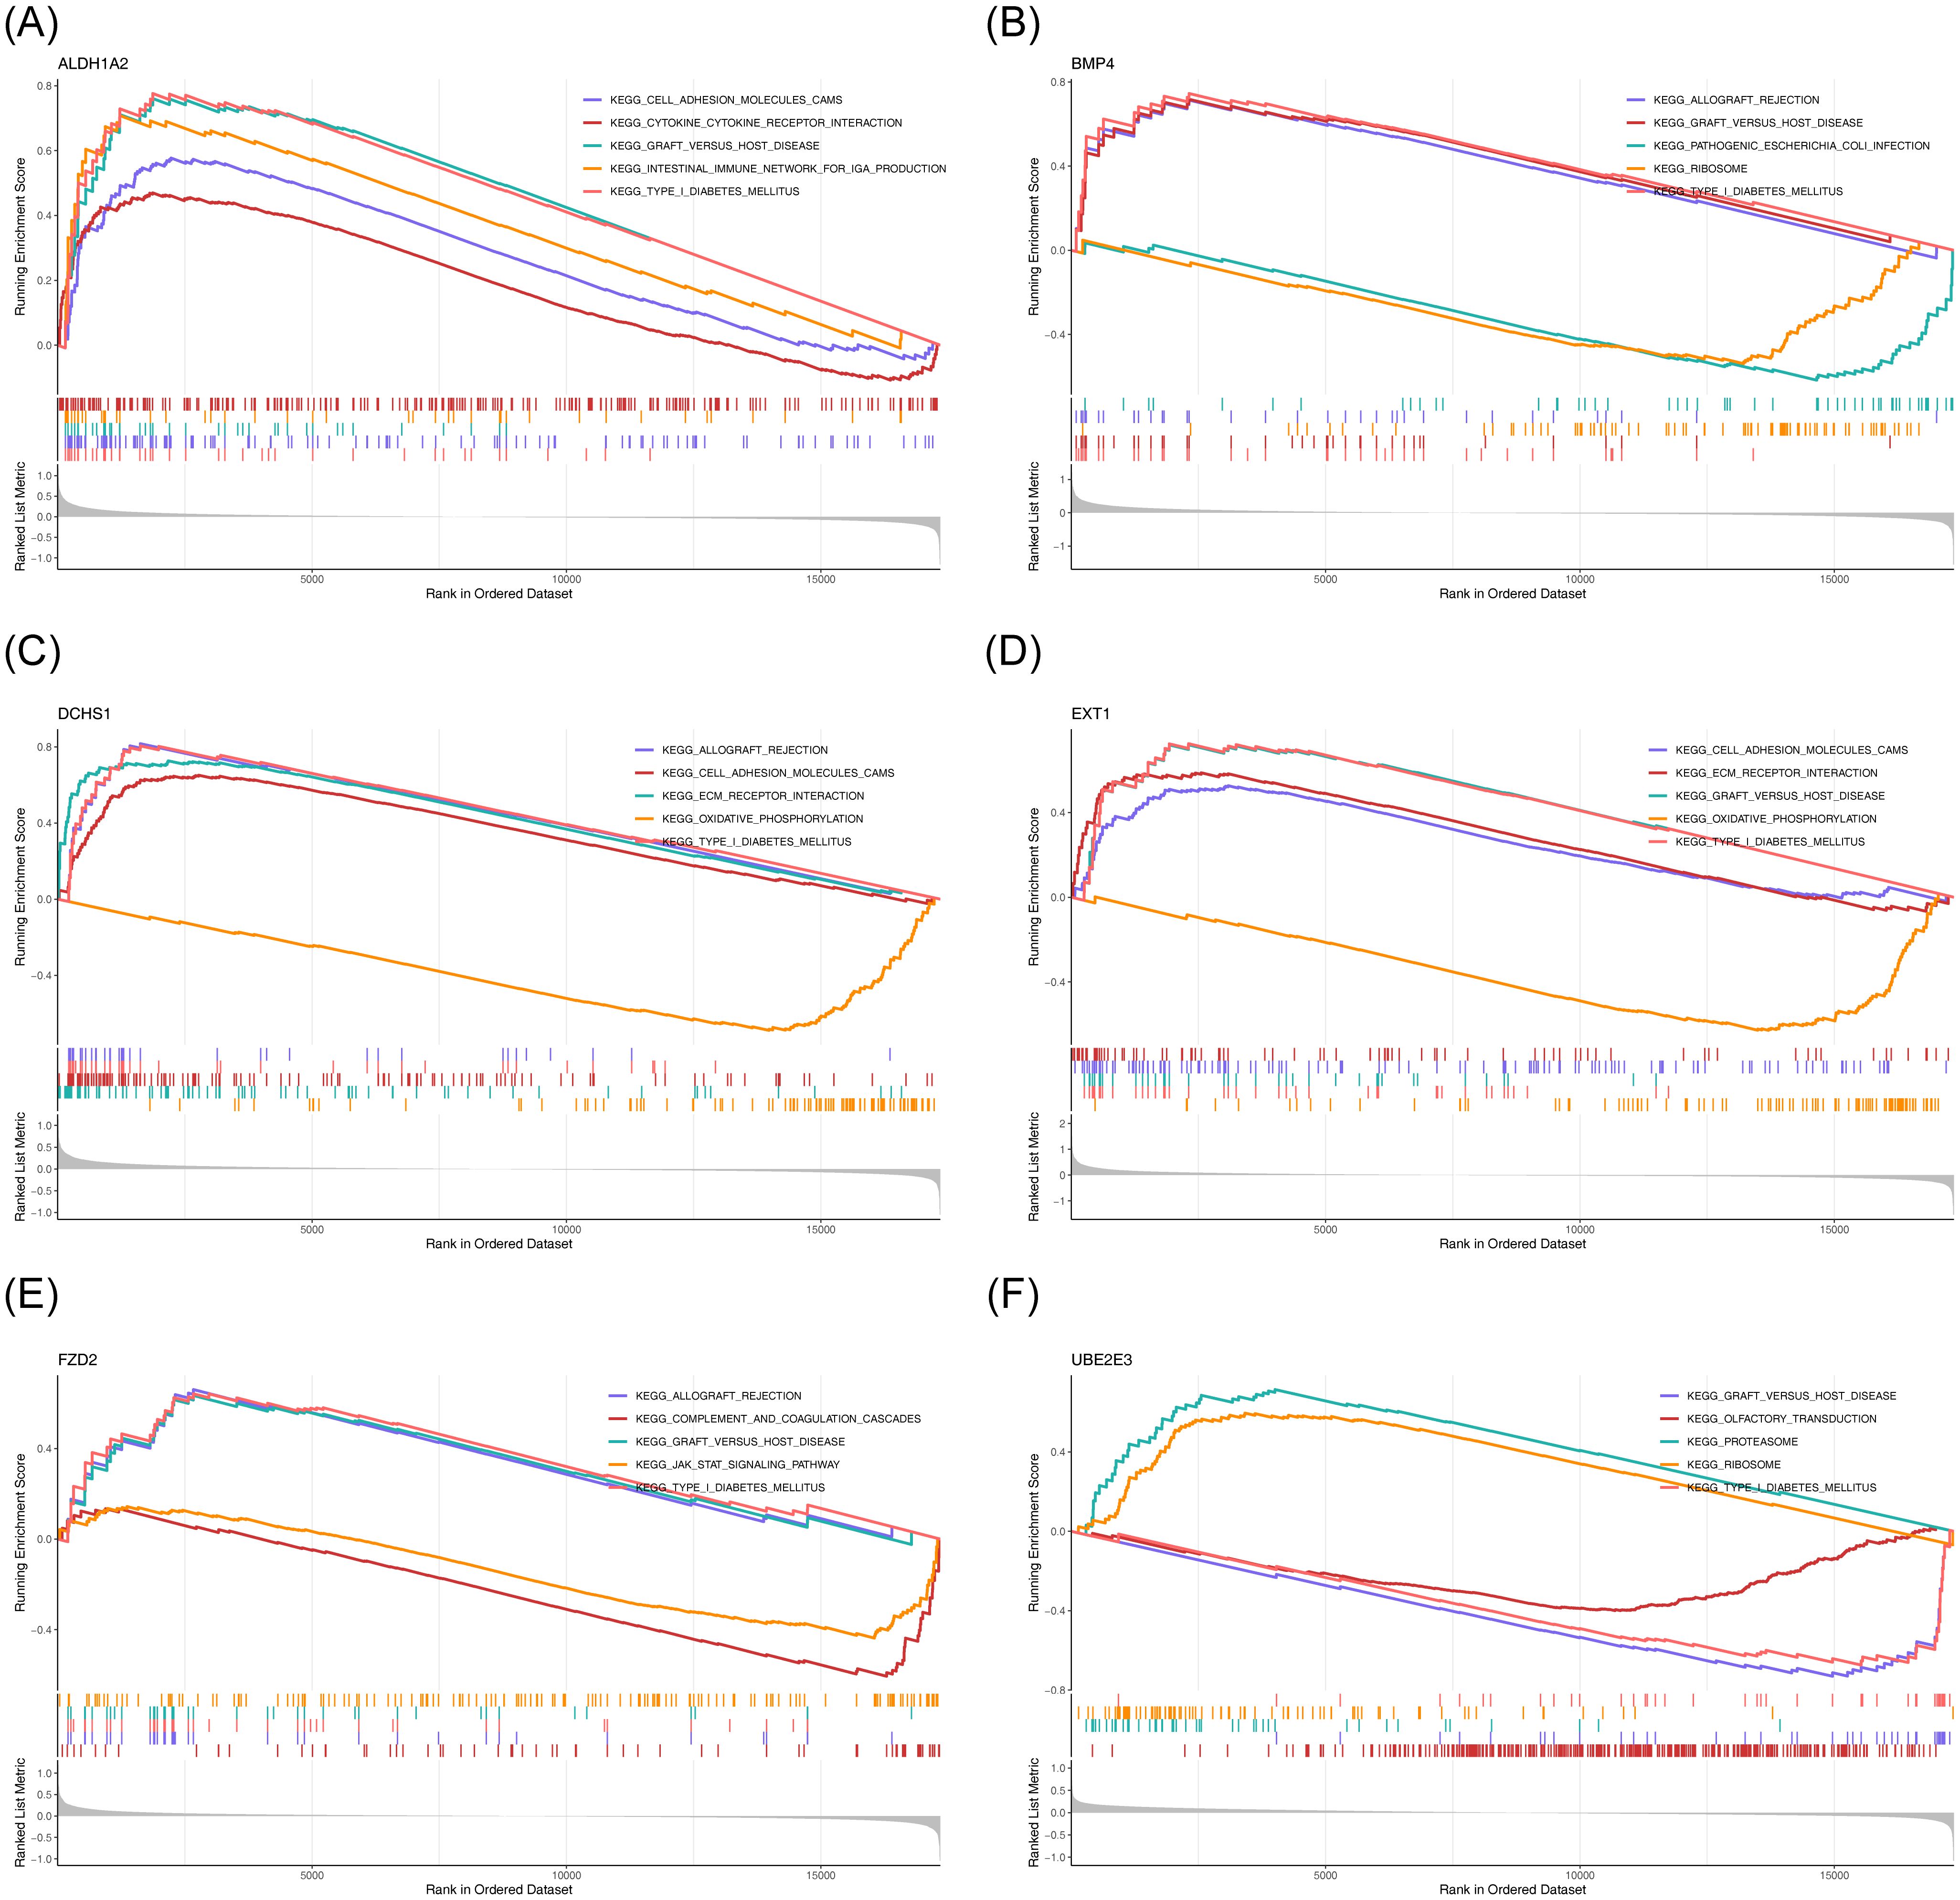
Figure 6. GSEA results for ALDH1A2 (A), BMP4 (B), DCHS1 (C), EXT1 (D), FZD2 (E), and UBE2E3 (F) in GSE57338. Each sub-Figure is composed of three components: the top section displays an enrichment score line graph, with each line representing a distinct pathway. The second section highlights the genes within the gene set using lines, while the third section illustrates the distribution of rank values for all genes.
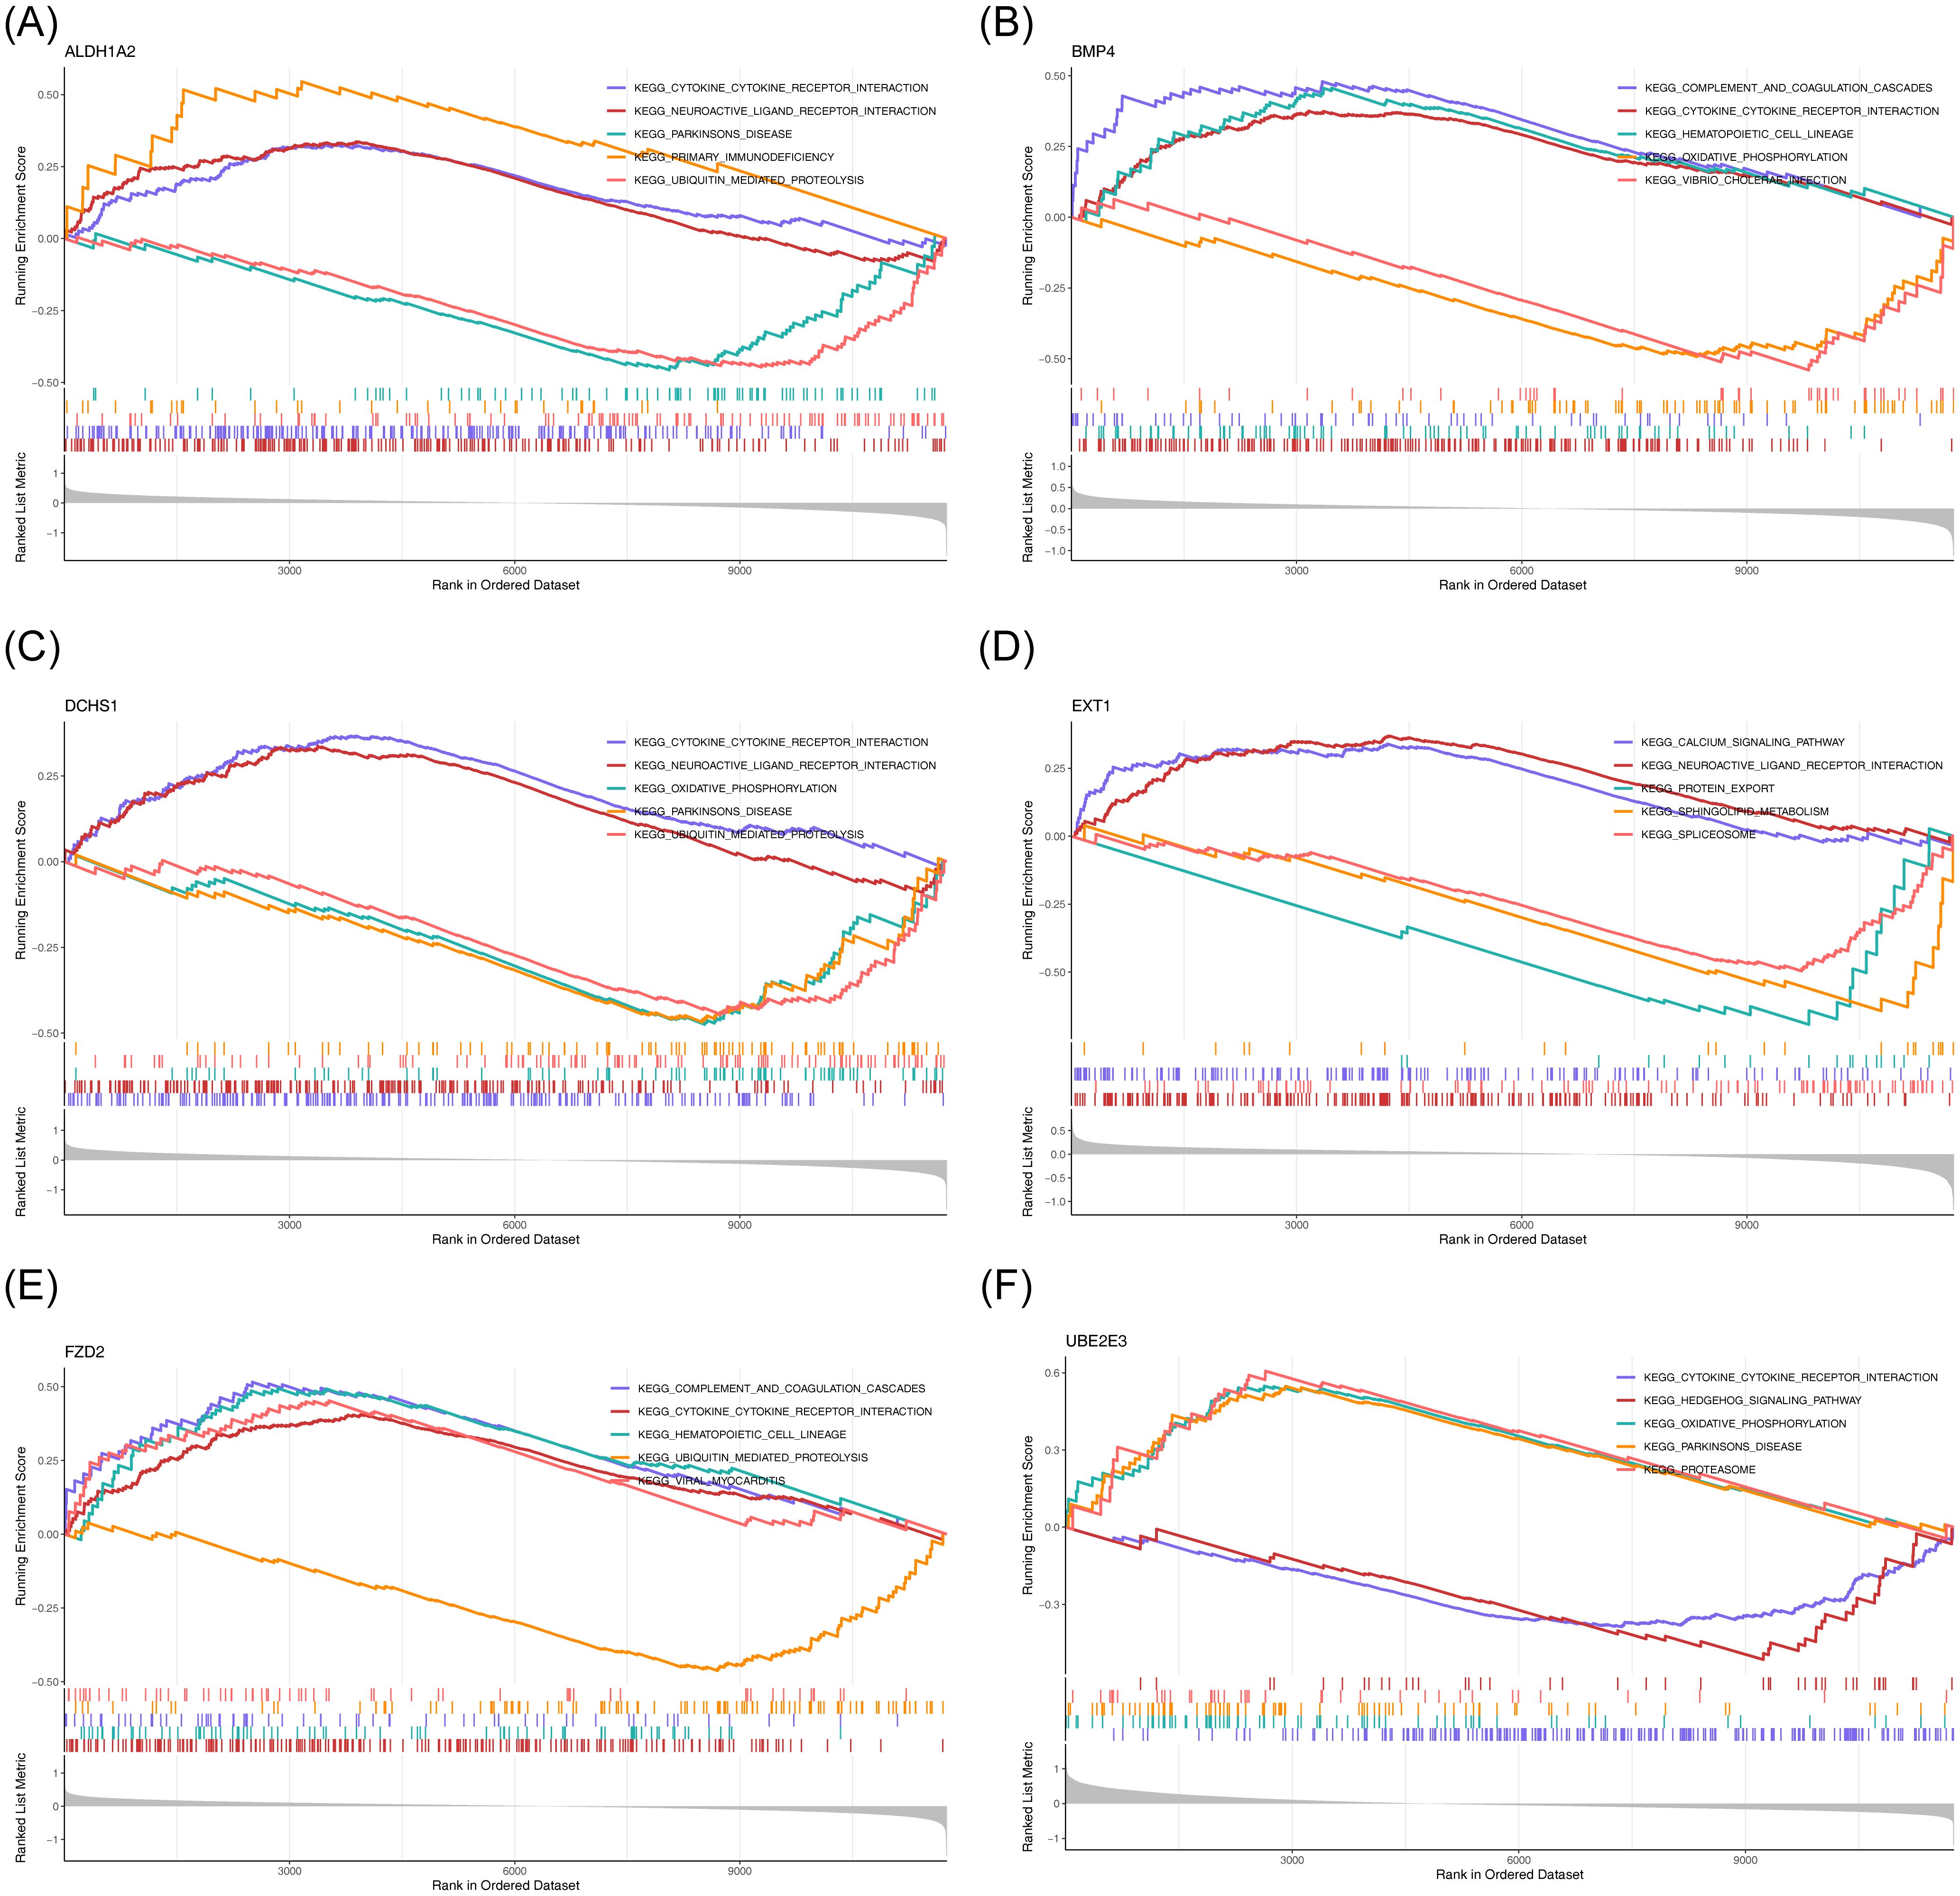
Figure 7. GSEA results for ALDH1A2 (A), BMP4 (B), DCHS1 (C), EXT1 (D), FZD2 (E), and UBE2E3 (F) in GSE5389.
3.6 Analysis of regulatory relationships
To investigate the regulatory mechanisms of the potential diagnostic biomarkers, a ‘miRNA-mRNA-TF’ network was constructed (Figure 8A), comprising 52 nodes and 199 edges. Notably, hsa-miR-1343-3p was linked to ALDH1A2, BMP4, and FZD2. Furthermore, four drugs—VANTICTUMAB, RETINOL, HYDROCHLOROTHIAZIDE, and ATENOLOL—were identified as potential therapeutics for ALDH1A2 and FZD2 (Figure 8B; Supplementary Table 1).
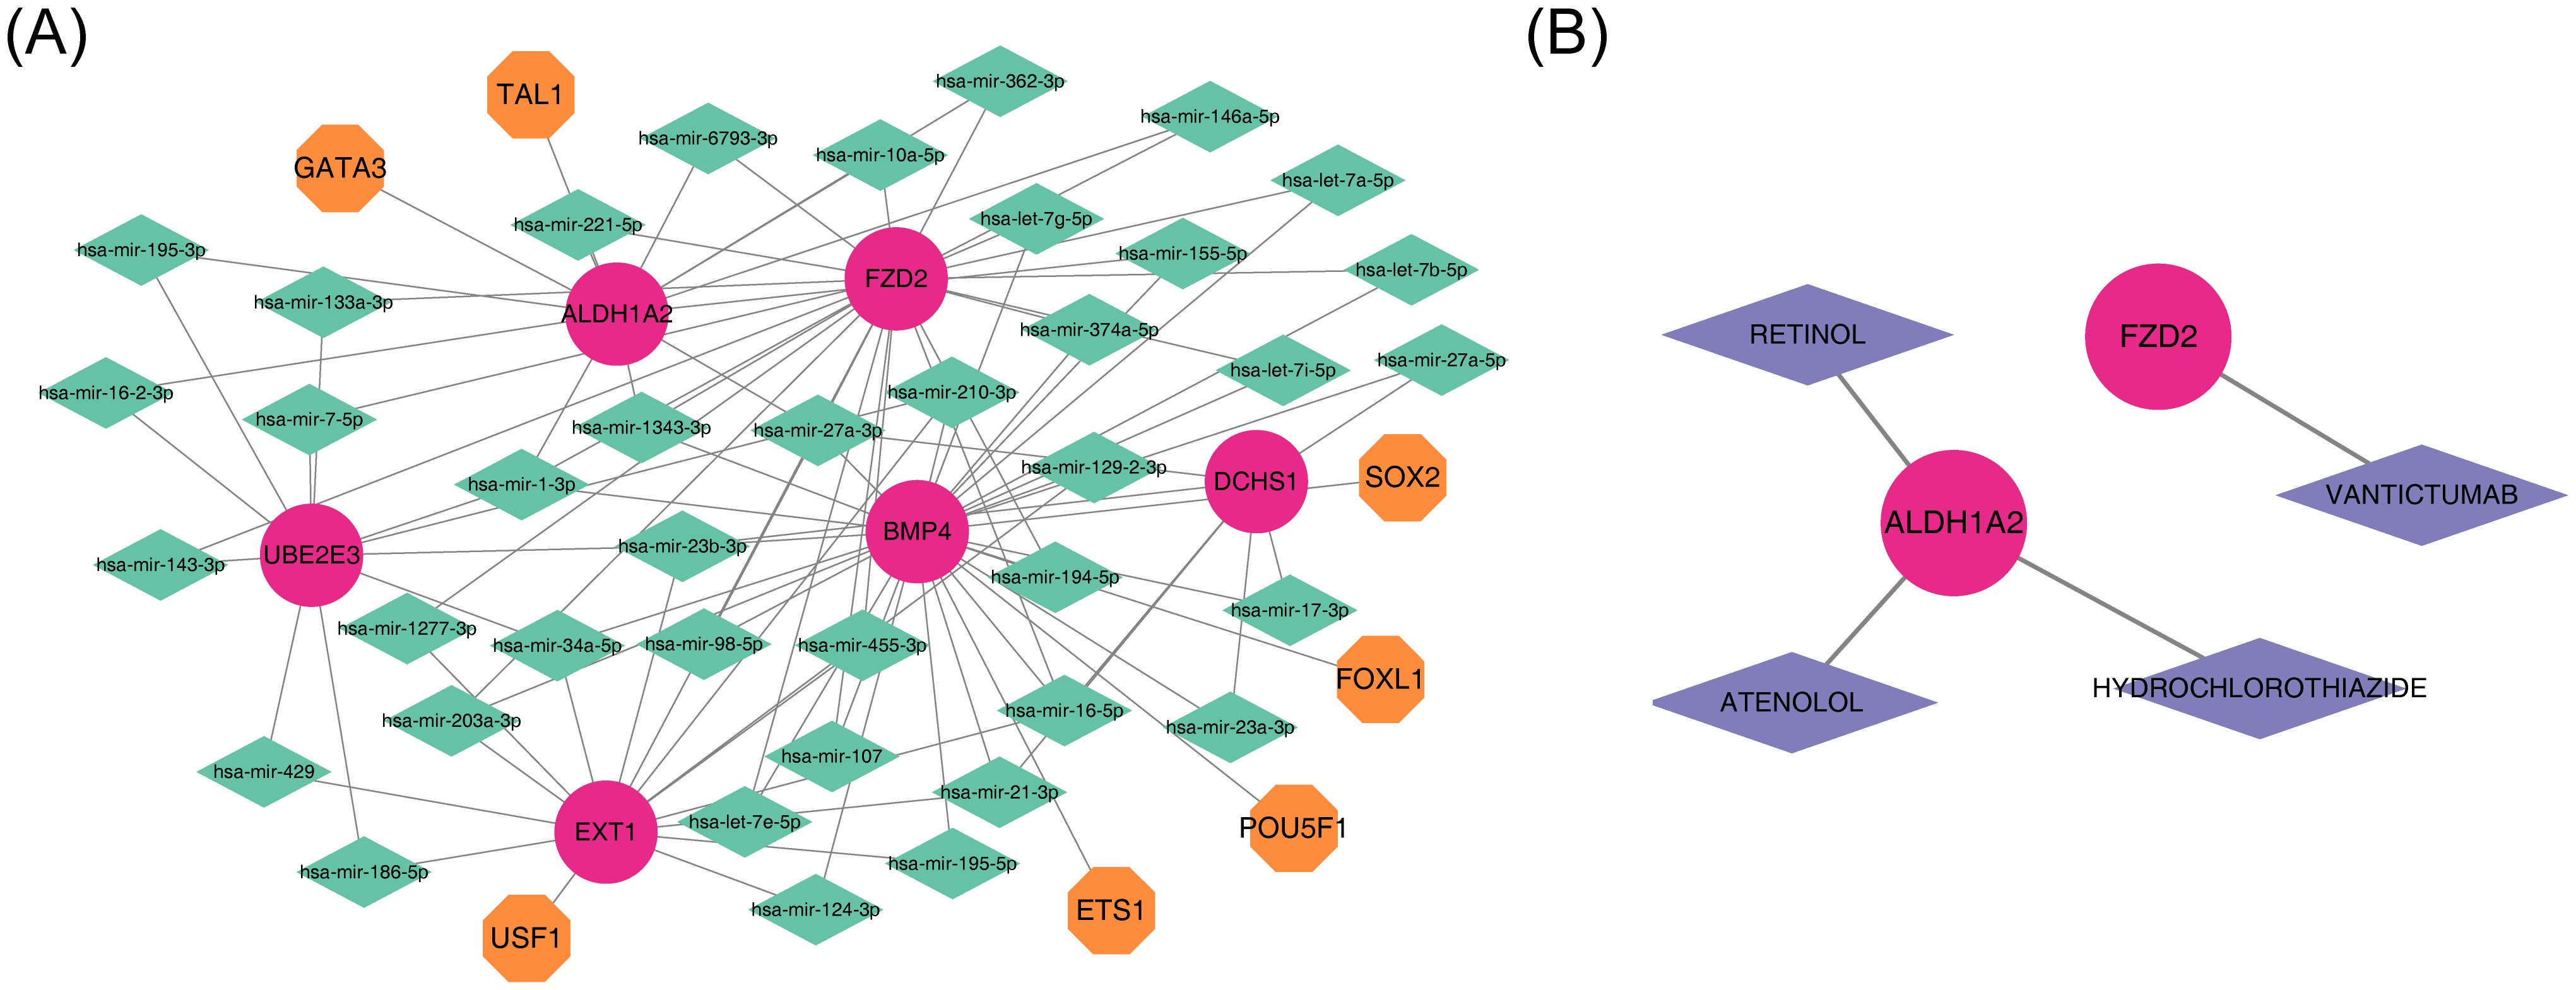
Figure 8. Integrated regulatory network and gene-drug interaction in diagnostics. (A) Diagram of the miRNA-mRNA-TF regulatory network, with red representing diagnostic markers, orange indicating TFs, and green representing miRNAs. (B) Diagnostic gene-drug interaction network, with red for diagnostic markers and purple for drugs.
3.7 Expression levels of FZD2, EXT1, DCHS1, BMP4, and ALDH1A2
qPCR results validated that the expression patterns of FZD2, EXT1, DCHS1, BMP4, and ALDH1A2 were consistent with the dataset observations. In comparison to healthy controls, FZD2, DCHS1, BMP4, and ALDH1A2 were significantly upregulated in HF samples (P < 0.05, Figure 9).
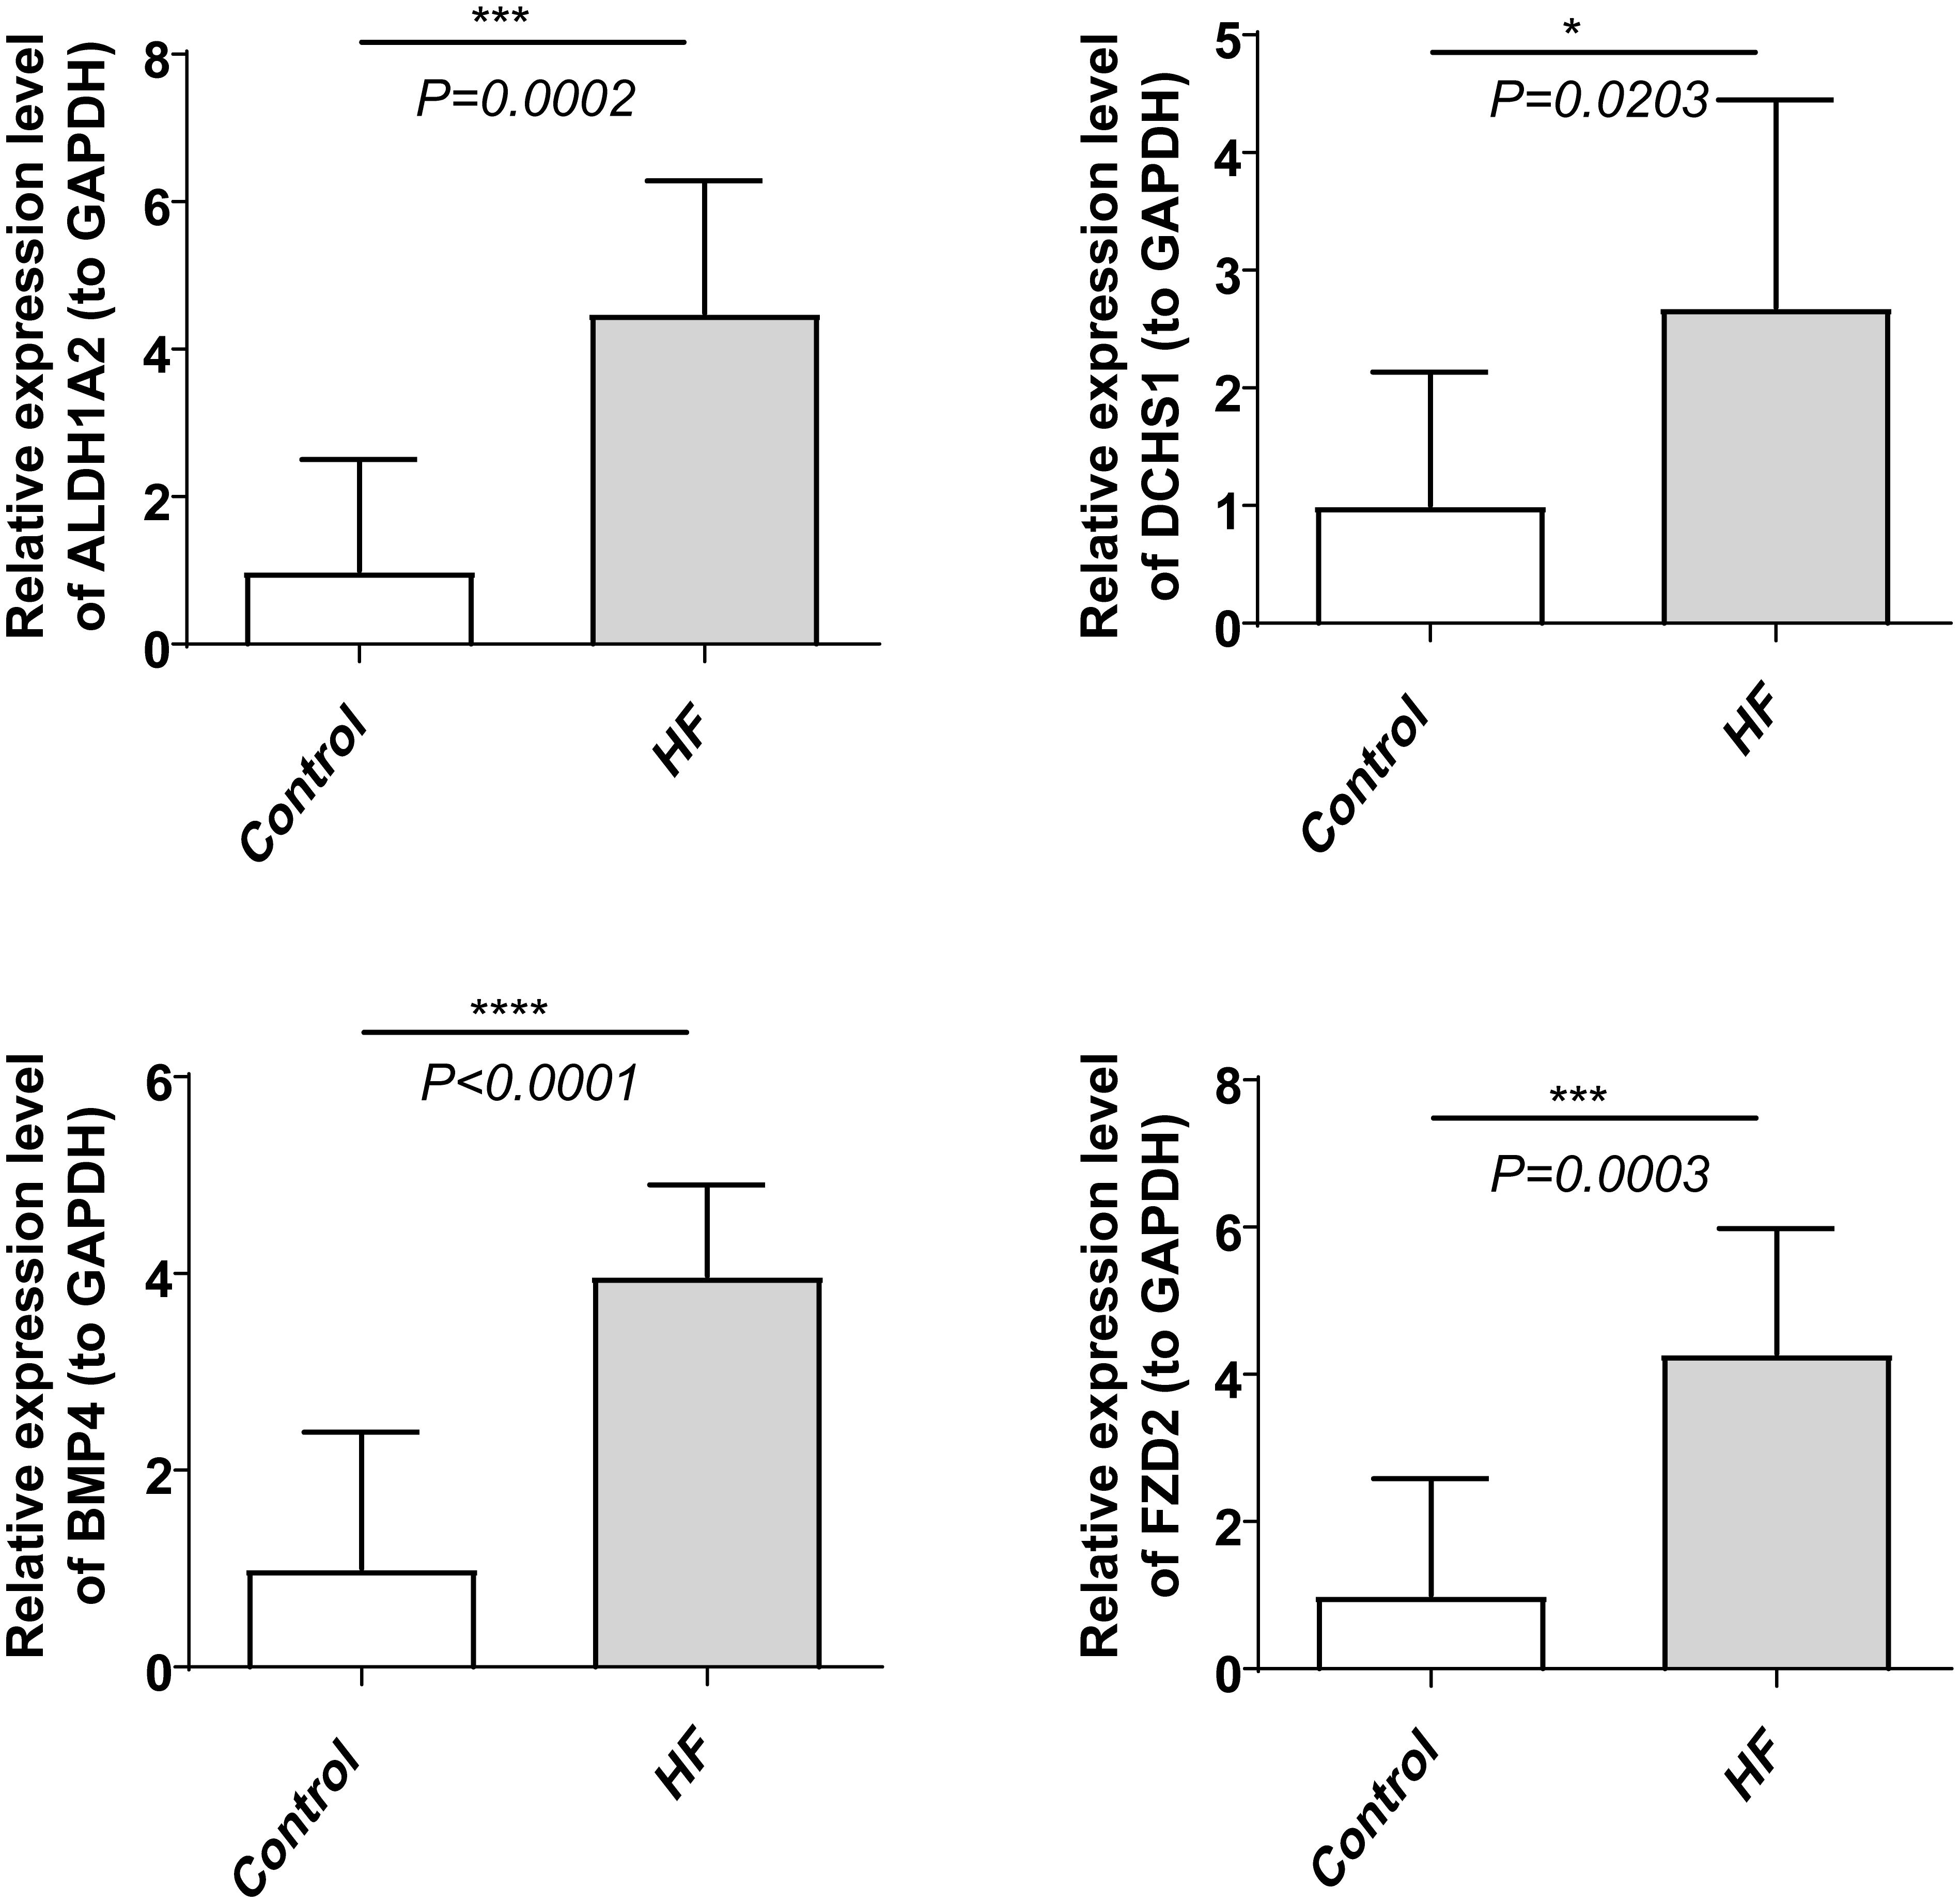
Figure 9. Expression patterns of FZD2, DCHS1, BMP4, and ALDH1A2 in HF and control groups. ****indicates P < 0.0001, ***indicates P < 0.001, and *indicates P < 0.05.
4 Discussion
Research showed that patients with BD have a life expectancy of 8–12 years shorter than healthy individuals, possibly due to a higher prevalence of diabetes, metabolic syndrome, and CVD (1, 11, 29). CVD represents a significant mortality risk factor in manic BD, with patients with BD suffering from CVD having an 8-fold higher mortality rate than healthy individuals under 40 years of age (30). Previous studies have identified common risk factors for CVD mortality in patients with mental illness, including smoking, poor diet, inflammatory factors, and psychotropic drug use (31). Despite being a prevalent CVD, the relationship between HF and BD remains unclear. This study used bioinformatics methods to analyze potential common diagnostic biomarkers between BD and HF, aiming to provide a new theoretical basis for future research on the common biological mechanism of HF and BD.
A joint analysis of two datasets from the GEO database was conducted to identify common DEGs in BD and HF. This analysis, combined with WGCNA, allowed for the identification of module genes associated with each disease. A total of 44 common differential module genes were uncovered. These genes were subjected to enrichment analysis, and a PPI network was constructed using the STRING database to identify hub genes, resulting in the identification of 10 hub genes. ROC analysis of these hub genes led to the identification of six genes (UBE2E3, FZD2, EXT1, DCHS1, BMP4, and ALDH1A2) with diagnostic potential. Finally, qPCR validation of five upregulated genes (FZD2, EXT1, DCHS1, BMP4, and ALDH1A2) in HF blood samples confirmed that the expression trends of FZD2, DCHS1, BMP4, and ALDH1A2 were consistent with those observed in the GEO database.
Dachsous cadherin-related 1 (DCHS1), a gene involved in tissue development and organization, encodes a calcium-dependent cell-adhesion protein. DCHS1 plays critical roles in regulating the proliferation and differentiation of neuroprogenitor cells. It is also essential for proper mitral valve morphogenesis in the heart, regulating cell migration during valve formation (6, 32). Whole-exome sequencing has identified 122 BD-related genes, including DCHS1 (33). Moreover, abnormal neurodevelopment is considered a potential cause of BD (34), in which DCHS1 plays a pivotal role. As a key gene in cerebral cortex development, alterations in DCHS1 expression or function can lead to abnormalities in neuronal migration, differentiation, and synaptic connections, increasing the risk of BD (35). Additionally, DCHS1 is involved in regulating the Hippo signaling pathway (36), which is crucial in cell proliferation, apoptosis, and differentiation. Dysregulation of this pathway can impact neuron survival and function, contributing to the onset and progression of mental illnesses (37, 38). In our dataset, DCHS1 expression was upregulated in both HF and BD, suggesting its potential as a target gene for further study in BD individuals with concurrent HF.
Bone morphogenetic protein 4 (BMP4), a member of the TGF-beta superfamily, acts as a growth factor involved in several biological processes, including vascular development and angiogenesis (39, 40). Numerous studies have highlighted the critical role of BMP4 in the pathogenesis of HF, identifying it as a key therapeutic target for intervention (41–43). In our dataset, BMP4 expression was upregulated in both HF and BD, which aligns with findings from Wu et al. (43), who observed elevated levels of BMP4 precursor protein in mouse hearts 24 hours after infarction. Their study further demonstrated that recombinant BMP4 had protective effects on cultured cardiomyocytes. Additionally, Wen et al. showed that BMP4 mediates various aspects of pathological cardiac hypertrophy, including cardiac hypertrophy, apoptosis, fibrosis, and ion channel remodeling (41). BMP4 also downregulates the activation of naive CD4+ T cells and inhibits IFN-γ production by these cells, without increasing regulatory T cell numbers. Furthermore, BMP4 can influence T cell glycolysis and Hif1α expression (44), suggesting that BMP4 may inhibit IFN-γ production by CD4+ T cells in vivo, potentially affecting immune responses and contributing to BD development. However, no reports have yet linked BMP4 to BD directly.
Frizzled-2 (FZD2) functions as a receptor for Wnt proteins, with most frizzled receptors associated with the canonical beta-catenin signaling pathway. This pathway involves the activation of disheveled proteins, inhibition of GSK-3 kinase, nuclear accumulation of beta-catenin, and subsequent activation of Wnt target genes (45). Research suggests that FZD family members may act as predisposition genes for schizophrenia (46, 47). Additionally, studies indicate that FZD2 prevents adult mouse cardiomyocytes from re-entering the cell cycle by inhibiting Yes-associated protein (YAP), thus protecting the myocardium after myocardial infarction by preventing excessive cardiomyocyte proliferation and fibrosis. As a receptor for Wnt, FZD2 may also influence neurodevelopment via the Wnt/β-catenin pathway (48), suggesting its potential role in the development of BD. Further investigation of FZD2’s mechanism in BD pathogenesis is warranted. Aldehyde Dehydrogenase 1, Family Member A2 (ALDH1A2), which encodes retinal dehydrogenase 2, plays a pivotal role in synthesizing retinoic acid from vitamin A during early development and is strongly associated with heart disease (49, 50). ALDH1A2 is vital for cardiac development. Regulating its expression can impact cardiac lesions, particularly in the context of chronic inflammation and fibrosis in HF (51). Additionally, ALDH1A2 is involved in retinoic acid synthesis, a critical component of the retinoic acid signaling pathway, which is essential for neurodevelopment (49, 51). Dysregulation of ALDH1A2 may result in abnormal retinoic acid levels, which in turn can affect the development, differentiation, and function of neurons, thereby increasing the risk of developing BD. However, no studies have yet explored the role of ALDH1A2 in BD.
GSEA results indicated that genes such as ALDH1A2, DCHS1, and EXT1 were significantly enriched in pathways including cytokine-cytokine receptor interaction and ECM-receptor interaction. The Cytokine-Cytokine Receptor Interaction pathway plays a pivotal role in the progression of HF. On one hand, this pathway promotes the over-activation of pro-inflammatory cytokines, such as tumor necrosis factor-alpha (TNF-α), exacerbating the inflammatory response, inducing cardiomyocyte damage and apoptosis, reducing myocardial contractility, and accelerating the deterioration of HF (52). On the other hand, interleukin 6 (IL-6) triggers downstream signaling pathways that lead to myocardial remodeling, altering the heart’s structure and decreasing its pumping function (53). The ECM-receptor interaction pathway is pivotal in the pathogenesis of both HF and BD, influencing each disease through different mechanisms. In the context of HF, an imbalance in ECM-receptor interactions disrupts the synthesis and degradation of extracellular matrix proteins, such as collagen (54, 55). Excessive ECM deposition increases myocardial stiffness, impairing diastolic function and affecting the heart’s filling capacity. Additionally, abnormal activation of ECM receptors, such as integrins, promotes the activation and proliferation of cardiac fibroblasts through downstream signaling pathways, accelerating myocardial fibrosis and further reducing the heart’s compliance and contractile function (56, 57). In BD, ECM-receptor interactions in the brain are also crucial. ECM receptors on neurons and glial cells modulate the plasticity of nerve synapses by regulating intercellular signaling (58, 59). Dysregulation of ECM receptor signaling may alter neurotransmitter transmission and disrupt neuronal connections, contributing to emotional regulation disorders, increasing the risk of BD, or influencing its progression (60, 61). The involvement of these pathways in both HF and BD offers valuable insights into the comorbidity mechanisms of these diseases and presents potential targets for future therapeutic interventions.
Analysis of the regulatory network revealed that hsa-mir-1343-3p simultaneously targets ALDH1A2, BMP4, and FZD2. hsa-mir-1343-3p is a miRNA, a class of small non-coding RNA molecules that regulate gene expression by binding to target mRNAs. These molecules play pivotal roles in various physiological and pathological cellular processes (62). hsa-mir-1343-3p inhibits autophagy by targeting ATG7 (63), a critical process for maintaining cardiomyocyte health, which is linked to the onset and progression of HF (64). Consequently, the regulation of autophagy by hsa-mir-1343-3p may influence cardiomyocyte survival and function, thereby modulating HF progression. Furthermore, hsa-mir-1343-3p may regulate dopamine synthases, transporters, and receptors, affecting the development of BD (65–67). In conclusion, as a potential key regulatory molecule, hsa-mir-1343-3p targets multiple critical genes and modulates autophagy- and dopamine-related processes, may playing a significant role in the pathogenesis of both HF and BD and offering valuable insights for the exploration of these diseases’ mechanisms and the development of novel therapeutic strategies.
This study identified four drugs with potential therapeutic effects on ALDH1A2 and FZD2, including VANTICTUMAB, RETINOL, HYDROCHLOROTHIAZIDE, and ATENOLOL, which may prove beneficial for treating BD individuals with HF. The study results showed that patients treated with ATENOLOL demonstrated significant improvements in aggravated heart failure and death events (68). Another study indicated that a combination pill containing ATENOLOL and HYDROCHLOROTHIAZIDE significantly reduced low-density lipoprotein cholesterol and systolic blood pressure, with a lower incidence of cardiovascular events compared to the placebo group, effectively decreasing the incidence of cardiovascular events in individuals with higher cardiovascular risk (69). Studies have shown that when hydrochlorothiazide is used in combination with Dapagliflozin, it can synergistically improve hemodynamics and ejection fraction in early intervention, and reduce plasma B-type natriuretic peptide concentration. Moreover, hydrochlorothiazide enhances the inhibitory effect of Dapagliflozin on NHE activity by inhibiting the expression of NHE1, thereby further improving cardiac function (70). These medications may improve the cardiovascular status of BD patients by stabilizing their blood pressure. This finding provides new therapeutic insights for BD patients with comorbid hypertension and HF. However, considering the potential and limitations of these medications in clinical application, their efficacy in BD patients with comorbid HF cannot be fully proven. Although these medications may affect relevant disease pathways by acting on diagnostic genes, their actual efficacy in BD and HF still needs to be validated by further experimental and clinical studies.
The six diagnostic genes identified in this study hold significant potential and can serve as a foundation for future research. To date, no conjoint analysis of BD and HF has been reported. By leveraging public databases and bioinformatics methods, this study preliminarily explored the shared pathogenesis of BD and HF, revealing a potential common underlying mechanism and offering new opportunities for diagnosing and treating patients affected by both conditions. However, the study still has some limitations. First, relying on existing databases and the small sample sizes of BD datasets and qPCR validation may increase the risk of overfitting and false-positive module detection, which may affect the generalizability and accuracy of the results. Second, although some findings were validated by qPCR, we recognize that the BD dataset was derived from brain tissue and the HF dataset from heart tissue, and current validation was only performed in HF samples. Tissue differences may affect the universality of the results. In future studies, we plan to seek samples from individuals with both BD and HF for more comprehensive analysis. Additionally, as this study is still in the preliminary exploration stage, to capture more potential biological differences, we used |log2FC| > 0 and uncorrected P-values as thresholds for screening DEGs, as well as a slightly lower STRING confidence threshold, which may include some biologically irrelevant changes. In the future, we will combine stricter threshold criteria to optimize the analysis process and ensure that the screened genes are more consistent with the actual biological context. Finally, future research will expand the sample size and introduce more brain-derived data, including brain specimens or autopsy samples from BD patients, to further confirm the performance of these genes in the brain. Meanwhile, CRISPR-Cas9 technology will be used to knockout or overexpress these genes, and through cell proliferation, apoptosis, and metabolism experiments, the effects of these genes on myocardial cells and nerve cells will be evaluated to further clarify their roles in HF and BD. In addition, more experiments will be needed in the future to verify the specific common mechanisms between BD and HF.
Data availability statement
The datasets presented in this study can be found in online repositories. The names of the repository/repositories and accession number(s) can be found in the article/Supplementary Material.
Ethics statement
The studies involving humans were approved by Medical Ethics Committee of Hebei Provincial Hospital of Traditional Chinese Medicine. The studies were conducted in accordance with the local legislation and institutional requirements. The participants provided their written informed consent to participate in this study. Written informed consent was obtained from the individual(s) for the publication of any potentially identifiable images or data included in this article.
Author contributions
WZ: Conceptualization, Data curation, Validation, Visualization, Writing – original draft, Writing – review & editing. NL: Data curation, Validation, Visualization, Writing – review & editing.
Funding
The author(s) declare that no financial support was received for the research, and/or publication of this article.
Acknowledgments
We would like to express our sincere gratitude to all individuals and organizations who supported and assisted us throughout this research. We extend our thanks to everyone who has supported and assisted us along the way. Without your support, this research would not have been possible.
Conflict of interest
The authors declare that the research was conducted in the absence of any commercial or financial relationships that could be construed as a potential conflict of interest.
Generative AI statement
The author(s) declare that no Generative AI was used in the creation of this manuscript.
Any alternative text (alt text) provided alongside figures in this article has been generated by Frontiers with the support of artificial intelligence and reasonable efforts have been made to ensure accuracy, including review by the authors wherever possible. If you identify any issues, please contact us.
Publisher’s note
All claims expressed in this article are solely those of the authors and do not necessarily represent those of their affiliated organizations, or those of the publisher, the editors and the reviewers. Any product that may be evaluated in this article, or claim that may be made by its manufacturer, is not guaranteed or endorsed by the publisher.
Supplementary material
The Supplementary Material for this article can be found online at: https://www.frontiersin.org/articles/10.3389/fpsyt.2025.1627105/full#supplementary-material
Abbreviations
BD, bipolar disorder; HF, heart failure; DEGs, differentially expressed genes; GSEA, gene set enrichment analysis; qPCR, quantitative PCR; CVD, cardiovascular disease; GO, Gene Ontology; KEGG, Kyoto Encyclopedia of Genes and Genomes; PPI, protein-protein interaction; DCHS1, dachsous cadherin-related 1; BMP4, bone morphogenetic protein 4 ; FZD2, Frizzled-2; ALDH1A2, Aldehyde Dehydrogenase 1, Family Member A2.
References
1. Chen PH, Tsai SY, Pan CH, Chang HM, Chen YL, Su SS, et al. Incidence and risk factors of sudden cardiac death in bipolar disorder across the lifespan. J Affect Disord. (2020) 274:210–7. doi: 10.1016/j.jad.2020.05.094
2. Langfelder P and Horvath S. WGCNA: an R package for weighted correlation network analysis. BMC Bioinf. (2008) 9:559. doi: 10.1186/1471-2105-9-559
3. Stahl EA, Breen G, Forstner AJ, McQuillin A, Ripke S, Trubetskoy V, et al. Genome-wide association study identifies 30 loci associated with bipolar disorder. Nat Genet. (2019) 51:793–803. doi: 10.1038/s41588-019-0397-8
4. Wartchow KM, Scaini G, and Quevedo J. Glial-neuronal interaction in synapses: A possible mechanism of the pathophysiology of bipolar disorder. Adv Exp Med Biol. (2023) 1411:191–208. doi: 10.1007/978-981-19-7376-5_9
5. Xu E, Nguyen L, Hu R, Stavish CM, Leibenluft E, and Linke JO. The uncinate fasciculus in individuals with and at risk for bipolar disorder: A meta-analysis. J Affect Disord. (2022) 297:208–16. doi: 10.1016/j.jad.2021.10.045
6. Wolfers T, Doan NT, Kaufmann T, Alnaes D, Moberget T, Agartz I, et al. Mapping the heterogeneous phenotype of schizophrenia and bipolar disorder using normative models. JAMA Psychiatry. (2018) 75:1146–55. doi: 10.1001/jamapsychiatry.2018.2467
7. Mohan IK, Baba K, Iyyapu R, Thirumalasetty S, and Satish OS. Advances in congestive heart failure biomarkers. Adv Clin Chem. (2023) 112:205–48. doi: 10.1016/bs.acc.2022.09.005
8. Vrachatis DA, Papathanasiou KA, Giotaki SG, Raisakis K, Kaoukis A, Kossyvakis C, et al. Advances in the management of heart failure with reduced ejection fraction; the role of SGLT2is, ARNI, myotropes, vericiguat, and anti-inflammatory agents: A mini-review. Curr Pharm Des. (2023) 29:509–18. doi: 10.2174/1381612829666230316142450
9. Gladigau EL, Fazio TN, Hannam JP, Dawson LM, and Jones SG. Increased cardiovascular risk in patients with severe mental illness. Intern Med J. (2014) 44:65–9. doi: 10.1111/imj.12319
10. Nielsen RE, Banner J, and Jensen SE. Cardiovascular disease in patients with severe mental illness. Nat Rev Cardiol. (2021) 18:136–45. doi: 10.1038/s41569-020-00463-7
11. Chen PH, Chiang SJ, Hsiao CY, Shen RS, Lin YK, Chung KH, et al. Echocardiographic study of cardiac structure and function in people with bipolar disorder after midlife. J Affect Disord. (2022) 296:428–33. doi: 10.1016/j.jad.2021.09.089
12. Ortiz A, Bradler K, Moorti P, MacLean S, Husain MI, Sanches M, et al. Reduced heart rate variability is associated with higher illness burden in bipolar disorder. J Psychosom Res. (2021) 145:110478. doi: 10.1016/j.jpsychores.2021.110478
13. Ski CF, Taylor RS, McGuigan K, Long L, Lambert JD, Richards SH, et al. Psychological interventions for depression and anxiety in patients with coronary heart disease, heart failure or atrial fibrillation. Cochrane Database Syst Rev. (2024) 4:CD013508. doi: 10.1002/14651858.CD013508.pub3
14. Doehner W, Celutkiene J, Yilmaz MB, and Coats AJS. Heart failure and the heart-brain axis. QJM. (2023) 116:897–902. doi: 10.1093/qjmed/hcad179
15. Díaz HS, Toledo C, Andrade DC, Marcus NJ, and Del Rio R. Neuroinflammation in heart failure: new insights for an old disease. J Physiol. (2020) 598:33–59. doi: 10.1113/JP278864
16. Dihoum A, Brown AJ, McCrimmon RJ, Lang CC, and Mordi IR. Dapagliflozin, inflammation and left ventricular remodelling in patients with type 2 diabetes and left ventricular hypertrophy. BMC Cardiovasc Disord. (2024) 24:356. doi: 10.1186/s12872-024-04022-7
17. Miller AH, Maletic V, and Raison CL. Inflammation and its discontents: the role of cytokines in the pathophysiology of major depression. Biol Psychiatry. (2009) 65:732–41. doi: 10.1016/j.biopsych.2008.11.029
18. Lv JH, Hou AJ, Zhang SH, Dong JJ, Kuang HX, Yang L, et al. WGCNA combined with machine learning to find potential biomarkers of liver cancer. Med (Baltimore). (2023) 102:e36536. doi: 10.1097/MD.0000000000036536
19. Zeng J, Lai C, Luo J, and Li L. Functional investigation and two-sample Mendelian randomization study of neuropathic pain hub genes obtained by WGCNA analysis. Front Neurosci. (2023) 17:1134330. doi: 10.3389/fnins.2023.1134330
20. Colaprico A, Silva TC, Olsen C, Garofano L, Cava C, Garolini D, et al. TCGAbiolinks: an R/Bioconductor package for integrative analysis of TCGA data. Nucleic Acids Res. (2016) 44:e71. doi: 10.1093/nar/gkv1507
21. Yan B, Ren F, Shang W, and Gong X. Transcriptomic analysis reveals genetic cross-talk between periodontitis and hypothyroidism. Dis Markers. (2022) 2022:5736394. doi: 10.1155/2022/5736394
22. Ito K and Murphy D. Application of ggplot2 to pharmacometric graphics. CPT Pharmacometrics Syst Pharmacol. (2013) 2:e79. doi: 10.1038/psp.2013.56
23. Yu G, Wang LG, Han Y, and He QY. clusterProfiler: an R package for comparing biological themes among gene clusters. OMICS. (2012) 16:284–7. doi: 10.1089/omi.2011.0118
24. Chen XM, Zhao Y, Wu XD, Wang MJ, Yu H, Lu JJ, et al. Novel findings from determination of common expressed plasma exosomal microRNAs in patients with psoriatic arthritis, psoriasis vulgaris, rheumatoid arthritis, and gouty arthritis. Discov Med. (2019) 28:47–68.
25. Szklarczyk D, Gable AL, Lyon D, Junge A, Wyder S, Huerta-Cepas J, et al. STRING v11: protein-protein association networks with increased coverage, supporting functional discovery in genome-wide experimental datasets. Nucleic Acids Res. (2019) 47:D607–d13. doi: 10.1093/nar/gky1131
26. Robin X, Turck N, Hainard A, Tiberti N, Lisacek F, Sanchez JC, et al. pROC: an open-source package for R and S+ to analyze and compare ROC curves. BMC Bioinf. (2011) 12:77. doi: 10.1186/1471-2105-12-77
27. Kumar L and EF M. Mfuzz: a software package for soft clustering of microarray data. Bioinformation. (2007) 2:5–7. doi: 10.6026/97320630002005
28. Shannon P, Markiel A, Ozier O, Baliga NS, Wang JT, Ramage D, et al. Cytoscape: a software environment for integrated models of biomolecular interaction networks. Genome Res. (2003) 13:2498–504. doi: 10.1101/gr.1239303
29. Lu MLR, De Venecia TA, Goyal A, Rodriguez Ziccardi M, Kanjanahattakij N, Shah MK, et al. Psychiatric conditions as predictors of rehospitalization among African American patients hospitalized with heart failure. Clin Cardiol. (2017) 40:1020–5. doi: 10.1002/clc.22760
30. Coello K, Kjaerstad HL, Stanislaus S, Melbye S, Faurholt-Jepsen M, Miskowiak KW, et al. Thirty-year cardiovascular risk score in patients with newly diagnosed bipolar disorder and their unaffected first-degree relatives. Aust N Z J Psychiatry. (2019) 53:651–62. doi: 10.1177/0004867418815987
31. Russo V, Bottino R, Rago A, Papa AA, Liccardo B, Proietti R, et al. The effect of sacubitril/valsartan on device detected arrhythmias and electrical parameters among dilated cardiomyopathy patients with reduced ejection fraction and implantable cardioverter defibrillator. J Clin Med. (2020) 9:1111. doi: 10.3390/jcm9041111
32. Moore R, Moore K, Stairley R, Fulmer D, Guo L, and Norris R. Abstract MP173: loss of DCHS1 promotes mitral valve prolapse through cytoskeleton destabilization. Circ Res. (2020) 127. doi: 10.1161/res.127.suppl_1.MP173
33. Han MR, Han KM, Kim A, Kang W, Kang Y, Kang J, et al. Whole-exome sequencing identifies variants associated with structural MRI markers in patients with bipolar disorders. J Affect Disord. (2019) 249:159–68. doi: 10.1016/j.jad.2019.02.028
34. Kloiber S, Rosenblat JD, Husain MI, Ortiz A, Berk M, Quevedo J, et al. Neurodevelopmental pathways in bipolar disorder. Neurosci Biobehav Rev. (2020) 112:213–26. doi: 10.1016/j.neubiorev.2020.02.005
35. Cappello S, Gray MJ, Badouel C, Lange S, Einsiedler M, Srour M, et al. Mutations in genes encoding the cadherin receptor-ligand pair DCHS1 and FAT4 disrupt cerebral cortical development. Nat Genet. (2013) 45:1300–8. doi: 10.1038/ng.2765
36. Kuta A, Mao Y, Martin T, Ferreira de Sousa C, Whiting D, Zakaria S, et al. Fat4-Dchs1 signalling controls cell proliferation in developing vertebrae. Development. (2016) 143:2367–75. doi: 10.1242/dev.131037
37. Mao B, Gao Y, Bai Y, and Yuan Z. Hippo signaling in stress response and homeostasis maintenance. Acta Biochim Biophys Sin (Shanghai). (2015) 47:2–9. doi: 10.1093/abbs/gmu109
38. O’Neill AC, Kyrousi C, Einsiedler M, Burtscher I, Drukker M, Markie DM, et al. Mob2 insufficiency disrupts neuronal migration in the developing cortex. Front Cell Neurosci. (2018) 12:57. doi: 10.3389/fncel.2018.00057
39. Park ES, Woods DC, and Tilly JL. Bone morphogenetic protein 4 promotes mammalian oogonial stem cell differentiation via Smad1/5/8 signaling. Fertil Steril. (2013) 100:1468–75. doi: 10.1016/j.fertnstert.2013.07.1978
40. Sun L and Sucosky P. Bone morphogenetic protein-4 and transforming growth factor-beta1 mechanisms in acute valvular response to supra-physiologic hemodynamic stresses. World J Cardiol. (2015) 7:331–43. doi: 10.4330/wjc.v7.i6.331
41. Guo WT and Dong DL. Bone morphogenetic protein-4: a novel therapeutic target for pathological cardiac hypertrophy/heart failure. Heart Fail Rev. (2014) 19:781–8. doi: 10.1007/s10741-014-9429-8
42. Majerczak J, Filipowska J, Tylko G, Guzik M, Karasinski J, Piechowicz E, et al. Impact of long-lasting spontaneous physical activity on bone morphogenetic protein 4 in the heart and tibia in murine model of heart failure. Physiol Rep. (2020) 8:e14412. doi: 10.14814/phy2.14412
43. Wu X, Sagave J, Rutkovskiy A, Haugen F, Baysa A, Nygård S, et al. Expression of bone morphogenetic protein 4 and its receptors in the remodeling heart. Life Sci. (2014) 97:145–54. doi: 10.1016/j.lfs.2013.12.030
44. Huang F, Hu L, Zhang Y, Qu X, and Xu J. BMP4 moderates glycolysis and regulates activation and interferon-gamma production in CD4+ T cells. Front Immunol. (2021) 12:702211. doi: 10.3389/fimmu.2021.702211
45. Saal HM, Prows CA, Guerreiro I, Donlin M, Knudson L, Sund KL, et al. A mutation in FRIZZLED2 impairs Wnt signaling and causes autosomal dominant omodysplasia. Hum Mol Genet. (2015) 24:3399–409. doi: 10.1093/hmg/ddv088
46. Wang P, Mokhtari R, Pedrosa E, Zheng D, and Lachman H. SU14 - Transcriptome analysis of wnt7a-mediated gene expression in human neural progenitor cells derived from control and chd8 haploinsufficient induced pluripotent stem cells. Eur Neuropsychopharmacol. (2019) 29:S894. doi: 10.1016/j.euroneuro.2017.08.203
47. Rizig MA, McQuillin A, Ng A, Robinson M, Harrison A, Zvelebil M, et al. A gene expression and systems pathway analysis of the effects of clozapine compared to haloperidol in the mouse brain implicates susceptibility genes for schizophrenia. J Psychopharmacol. (2012) 26:1218–30. doi: 10.1177/0269881112450780
48. Zhu X, Xu M, Leu NA, Morrisey EE, and Millar SE. FZD2 regulates limb development by mediating beta-catenin-dependent and -independent Wnt signaling pathways. Dis Model Mech. (2023) 16.
49. Leon E, Nde C, Ray RS, Preciado D, and Zohn IE. ALDH1A2-related disorder: A new genetic syndrome due to alteration of the retinoic acid pathway. Am J Med Genet A. (2023) 191:90–9. doi: 10.1002/ajmg.a.62991
50. Steiner MB, Vengoechea J, and Collins RT 2nd. Duplication of the ALDH1A2 gene in association with pentalogy of Cantrell: a case report. J Med Case Rep. (2013) 7:287. doi: 10.1186/1752-1947-7-287
51. Beecroft SJ, Ayala M, McGillivray G, Nanda V, Agolini E, Novelli A, et al. Biallelic hypomorphic variants in ALDH1A2 cause a novel lethal human multiple congenital anomaly syndrome encompassing diaphragmatic, pulmonary, and cardiovascular defects. Hum Mutat. (2021) 42:506–19. doi: 10.1002/humu.24179
52. Mohamed TM, Zi M, Prehar S, Maqsood A, Abou-Leisa R, Nguyen L, et al. The tumour suppressor Ras-association domain family protein 1A (RASSF1A) regulates TNF-alpha signalling in cardiomyocytes. Cardiovasc Res. (2014) 103:47–59. doi: 10.1093/cvr/cvu111
53. Li H and Bian Y. Fibroblast-derived interleukin-6 exacerbates adverse cardiac remodeling after myocardial infarction. Korean J Physiol Pharmacol. (2024) 28:285–94. doi: 10.4196/kjpp.2024.28.3.285
54. Andenaes K, Lunde IG, Mohammadzadeh N, Dahl CP, Aronsen JM, Strand ME, et al. The extracellular matrix proteoglycan fibromodulin is upregulated in clinical and experimental heart failure and affects cardiac remodeling. PloS One. (2018) 13:e0201422. doi: 10.1371/journal.pone.0201422
55. Shih YC, Chen CL, Zhang Y, Mellor RL, Kanter EM, Fang Y, et al. Endoplasmic reticulum protein TXNDC5 augments myocardial fibrosis by facilitating extracellular matrix protein folding and redox-sensitive cardiac fibroblast activation. Circ Res. (2018) 122:1052–68. doi: 10.1161/CIRCRESAHA.117.312130
56. Frangogiannis NG. The extracellular matrix in ischemic and nonischemic heart failure. Circ Res. (2019) 125:117–46. doi: 10.1161/CIRCRESAHA.119.311148
57. Liu X, Li J, Yang X, Li X, Kong J, Qi D, et al. Carcinoma-associated fibroblast-derived lysyl oxidase-rich extracellular vesicles mediate collagen crosslinking and promote epithelial-mesenchymal transition via p-FAK/p-paxillin/YAP signaling. Int J Oral Sci. (2023) 15:32. doi: 10.1038/s41368-023-00236-1
58. Dityatev A, Seidenbecher C, and Morawski M. Brain extracellular matrix: An upcoming target in neurological and psychiatric disorders. Eur J Neurosci. (2021) 53:3807–10. doi: 10.1111/ejn.15336
59. Wlodarczyk J, Mukhina I, Kaczmarek L, and Dityatev A. Extracellular matrix molecules, their receptors, and secreted proteases in synaptic plasticity. Dev Neurobiol. (2011) 71:1040–53. doi: 10.1002/dneu.20958
60. Dzyubenko E and Hermann DM. Neuroglia and extracellular matrix molecules. Handb Clin Neurol. (2025) 209:197–211. doi: 10.1016/B978-0-443-19104-6.00010-3
61. Mitterauer BJ. Downregulation and upregulation of glial connexins may cause synaptic imbalances responsible for the pathophysiology of bipolar disorder. CNS Neurosci Ther. (2011) 17:281–93. doi: 10.1111/j.1755-5949.2010.00178.x
62. Piletic K and Kunej T. MicroRNA epigenetic signatures in human disease. Arch Toxicol. (2016) 90:2405–19. doi: 10.1007/s00204-016-1815-7
63. Guo Y, Ding X, Dai C, Wang W, Chen J, Chen S, et al. miR-1343-3p inhibits autophagy by directly targeting ATG7 in multiple myeloma cells. Biomed Rep. (2024) 21:185. doi: 10.3892/br.2024.1873
64. Bielawska M, Warszynska M, Stefanska M, and Blyszczuk P. Autophagy in heart failure: insights into mechanisms and therapeutic implications. J Cardiovasc Dev Dis. (2023) 10:352. doi: 10.3390/jcdd10080352
65. Berk M, Dodd S, Kauer-Sant’anna M, Malhi GS, Bourin M, Kapczinski F, et al. Dopamine dysregulation syndrome: implications for a dopamine hypothesis of bipolar disorder. Acta Psychiatr Scand Suppl. (2007) 116:41–9. doi: 10.1111/j.1600-0447.2007.01058.x
66. Rawani NS, Chan AW, Dursun SM, and Baker GB. The underlying neurobiological mechanisms of psychosis: focus on neurotransmission dysregulation, neuroinflammation, oxidative stress, and mitochondrial dysfunction. Antioxidants (Basel). (2024) 13:709. doi: 10.3390/antiox13060709
67. Zhan L, Kerr JR, Lafuente MJ, Maclean A, Chibalina MV, Liu B, et al. Altered expression and coregulation of dopamine signalling genes in schizophrenia and bipolar disorder. Neuropathol Appl Neurobiol. (2011) 37:206–19. doi: 10.1111/j.1365-2990.2010.01128.x
68. Sturm B, Pacher R, Strametz-Juranek J, Berger R, Frey B, and Stanek B. Effect of beta 1 blockade with atenolol on progression of heart failure in patients pretreated with high-dose enalapril. Eur J Heart Fail. (2000) 2:407–12. doi: 10.1016/S1388-9842(00)00120-3
69. Yusuf S, Joseph P, Dans A, Gao P, Teo K, Xavier D, et al. Polypill with or without Aspirin in Persons without Cardiovascular Disease. N Engl J Med. (2021) 384:216–28. doi: 10.1056/NEJMoa2028220
Keywords: bipolar disorder, heart failure, biomarkers, WGCNA, GSEA
Citation: Zhang W and Li N (2025) Preliminary exploration of potential biomarkers for heart failure and bipolar disorder: an exploratory study based on bioinformatics. Front. Psychiatry 16:1627105. doi: 10.3389/fpsyt.2025.1627105
Received: 13 May 2025; Accepted: 29 July 2025;
Published: 10 September 2025.
Edited by:
Florian Freudenberg, University Hospital Frankfurt, GermanyReviewed by:
Mike Zastrozhin, PGxAI Inc., United StatesBruna Santos Da Silva, Federal University of Health Sciences of Porto Alegre, Brazil
Copyright © 2025 Zhang and Li. This is an open-access article distributed under the terms of the Creative Commons Attribution License (CC BY). The use, distribution or reproduction in other forums is permitted, provided the original author(s) and the copyright owner(s) are credited and that the original publication in this journal is cited, in accordance with accepted academic practice. No use, distribution or reproduction is permitted which does not comply with these terms.
*Correspondence: Na Li, MTUxMzMxMTk4MDBAMTYzLmNvbQ==