 Wen Zhou
 Tianfang Zeng
 Liang Gong
- Neurology Department, Chengdu Second People’s Hospital, Chengdu, Sichuan, China
Background: Parkinson’s disease (PD) is a progressive neurodegenerative disorder frequently associated with anxiety, which can significantly impair patients’ quality of life. Emerging evidence suggests that systemic inflammation may contribute to the development of anxiety in PD. The Systemic Immune-Inflammation Index (SII) and Systemic Inflammation Response Index (SIRI) are composite biomarkers reflecting systemic inflammatory status. However, the relationship between these inflammatory markers and anxiety levels in PD patients remains to be elucidated.
Objective: To investigate the association between SII and SIRI and anxiety levels in PD patients.
Methods: This cross-sectional study utilized data from the PPMI database, including 1,289 PD patients. Anxiety levels were assessed using the State-Trait Anxiety Inventory (STAI), with separate evaluations for state and trait anxiety. Linear regression analyses were performed to assess the associations between SII, SIRI, and anxiety levels. Curve fitting analysis was conducted to explore potential non-linear relationships, and sensitivity and subgroup analyses were performed to verify the robustness of the results.
Results: Linear regression analyses showed significant positive associations between SII and overall STAI scores [β = 0.34 (95% CI 0.07 - 0.6), p = 0.014], STAI-state [β = 0.21 (95% CI 0.06 - 0.36), p = 0.005], and a non-significant association with STAI-trait [β = 0.13 (95% CI - 0.01 - 0.26), p = 0.073]. SIRI was significantly associated with overall STAI scores [β = 0.16 (95% CI 0.04 - 0.27), p = 0.008], STAI-state [β = 0.1 (95% CI 0.04 - 0.17), p = 0.002], and a non-significant association with STAI-trait [β = 0.06 (95% CI 0 - 0.12), p = 0.068]. Curve fitting analysis revealed no significant non-linear relationships between SII/SIRI and anxiety levels, indicating a linear positive correlation. Sensitivity and subgroup analyses confirmed the robustness of these findings.
Conclusion: Our study demonstrates a significant positive linear association between SII and SIRI and anxiety levels, particularly state anxiety, in PD patients. These findings suggest that systemic inflammation may play a role in the development of anxiety in PD and highlight the potential utility of SII and SIRI as biomarkers for anxiety in this population. Future longitudinal studies are warranted to explore the causal relationship and potential therapeutic implications.
1 Introduction
Parkinson’s disease (PD) is a progressive neurodegenerative disorder characterized by motor symptoms such as tremor, rigidity, and bradykinesia. In addition to these motor manifestations, PD is frequently accompanied by a range of non-motor symptoms, among which anxiety is one of the most common neuropsychiatric complications. Anxiety in PD is characterized by persistent feelings of worry, difficulty concentrating, muscle tension, headaches, and insomnia (1). The prevalence of anxiety symptoms in PD patients is substantial, with approximately 31% of patients exhibiting anxiety symptoms (2), and up to 67% of PD patients being diagnosed with anxiety disorders (3). The high prevalence of anxiety and its significant impact on the quality of life of PD patients underscore the importance of early detection and identification of biomarkers and risk factors associated with anxiety in PD (4, 5).
Anxiety in PD patients is associated with worsening disease severity and a significant correlation with poorer quality of life compared to the general population (6). It is positively correlated with the severity of PD (7). Moreover, anxiety in PD has been linked to increased mortality (8). The presence of anxiety and depression in PD is associated with multiple adverse outcomes, including more severe motor symptoms, advanced disease stages, disability, and neuropsychiatric comorbidities such as cognitive impairment, sleep disturbances, and even autonomic dysfunction (9).
In recent years, there has been growing interest in the role of systemic inflammation in the pathogenesis of non-motor symptoms in PD. Two novel inflammatory markers, the Systemic Immune-Inflammation Index (SII) and the Systemic Inflammation Response Index (SIRI), which are assessed based on platelets and three types of white blood cell subtypes, have been proposed and have shown associations with cognitive function, depression and anxiety (10, 11). Previous research has revealed that inflammation and anti-inflammatory cytokines modulate anxiety through their respective receptors within the same basolateral amygdala (12). Various anti-inflammatory treatments have shown certain efficacy in unstratified anxiety patient populations (13, 14). However, the relationship between SII and SIRI and anxiety levels in PD patients remains to be fully elucidated.
Our study aims to investigate the association between SII and SIRI and anxiety levels in PD patients using data from the Parkinson’s Progression Marker Initiative (PPMI) database. Identifying this association could lead to early detection and inform intervention strategies, potentially enhancing patient outcomes. Moreover, understanding this relationship could provide crucial insights into the pathophysiology of anxiety in PD and may uncover new targets for therapeutic interventions aimed at managing anxiety in this patient population.
2 Methods and materials
2.1 Data source and ethical considerations
Data used in the preparation of this article was obtained on [2025-3-21] from the Parkinson’s Progression Markers Initiative (PPMI) database (www.ppmi-info.org/access-data-specimens/download-data), RRID: SCR_006431. For up-to-date information on the study, visit www.ppmi-info.org. The PPMI database is a publicly available resource that includes detailed clinical assessments and laboratory measurements from patients with PD. As this study utilized publicly available and de-identified data from the PPMI database, no additional ethical approval was required. The PPMI study was conducted in accordance with the Declaration of Helsinki, and all participants provided informed consent as part of the PPMI protocol.
2.2 Study population
The study population consisted of PD patients with complete data on anxiety levels, SII, and SIRI (Figure 1). Anxiety levels were assessed using the State-Trait Anxiety Inventory (STAI), which includes both state and trait anxiety subscales. Motor symptoms were evaluated using the Movement Disorder Society-Unified Parkinson’s Disease Rating Scale (MDS-UPDRS), a comprehensive tool that assesses both motor and non-motor symptoms in PD. Laboratory assessments of hematological and biochemical parameters were uniformly conducted at Covance laboratories.

Figure 1. Flowchart of the study cohort.
2.3 Calculation of inflammatory markers
SII= Platelet count × Neutrophil count/Lymphocyte count.
SIRI= Neutrophil count × Monocyte count/Lymphocyte count.
2.4 Statistical analysis
Baseline characteristics were summarized using descriptive statistics. Normally distributed variables were reported as mean ± standard deviation (SD), while non-normally distributed measures were expressed as median (interquartile range, IQR). Categorical data were reported as frequencies and percentages.
To evaluate the association between the inflammatory markers (SII and SIRI) and anxiety levels in PD patients, we employed linear regression models using multiple imputation data. Three models were constructed to adjust for potential confounders based on clinical relevance, existing scientific literature, and their known associations with the outcomes of interest, including cases where they led to a change in the effect estimate exceeding 10%. Model 1 was unadjusted; Model 2 was adjusted for age, sex, body mass index (BMI), and education years; Model 3 was further adjusted for PD duration and MDS-UPDRS Part 3 score; Model 4 was further adjusted for Immunomodulatory drug usage, and SSRIs usage.
Curve fitting analysis was conducted to explore the potential non-linear relationships between SII/SIRI and anxiety levels. Specifically, we used restricted cubic splines to model the relationship between these variables. Sensitivity analysis was performed by excluding patients with any missing data to verify the robustness of the primary findings. Subgroup analyses were conducted to assess the consistency of the associations across different demographic and clinical characteristics. The subgroups included age (<65 years and ≥65 years), sex (male and female), BMI (<25 kg/m2, 25 – 30 kg/m2, and ≥30 kg/m2), PD duration (<3 years and ≥3 years), MDS-UPDRS Part 3 score (<33 and ≥33), PD age-onset group (Early-Onset PD <50 years old, Late-Onset PD ≥50 years old), and PD genetic group (Sporadic PD and Familial PD). Each subgroup analysis was performed using the same linear regression models as described above.
In this study, we aimed to investigate the role of various inflammatory and clinical indices in predicting anxiety status using machine learning algorithms. Anxiety status was defined based on the STAI-state score, with a cutoff value of 40 to determine the presence (STAI-state ≥ 40) or absence (STAI-state < 40) of anxiety symptoms. The dataset comprised features such as SIRI, SII, PD duration, age, sex, education years, race, BMI, UPDRS 3 score, STAI-trait score, and several blood cell ratios including Eosinophil-to-Lymphocyte Ratio (ELR), Neutrophil-to-Lymphocyte Ratio (NLR), Monocyte-to-Lymphocyte Ratio (MLR), Neutrophil-to-Platelet Ratio (NPR), Eosinophil-to-Neutrophil Ratio (ENR), and Platelet-to-Lymphocyte Ratio (PLR). Initially, we employed the Boruta algorithm for feature selection to identify key variables from this pool. Following the selection of significant features by Boruta, we constructed predictive models using these variables. To ensure robustness, models were trained with a phased integration framework involving human-provided data followed by machine processing for adaptive model architecture. We performed 5-fold cross-validation and utilized grid search for hyperparameter optimization. The optimal model was chosen based on the maximum Area Under the Receiver Operating Characteristic Curve (AUC). The Linear Discriminant Analysis (LDA) model emerged as the best-performing model, which was further subjected to hyperparameter tuning and 5-fold cross-validation to ensure optimal performance and reliability. The effectiveness of the LDA model was assessed by comparing AUC values and SHAP-beeswarm plots.
3 Results
3.1 Baseline characteristics of the study population
A total of 1,289 PD patients were included in the study. The demographic and clinical characteristics of the study population are summarized in Table 1. The mean age of the participants was 62.9 ± 9.7 years, with 62.2% being male. The mean age at onset of PD was 59.9 ± 10.3 years, and the median disease duration was 2.1 (IQR 1.2, 3.4) years. The mean MDS-UPDRS Part 3 score was 22.4 ± 10.1, indicating a range of motor symptom severity. Anxiety levels, as assessed by the State-Trait Anxiety Inventory (STAI), showed a mean total score of 65.6 ± 19.0, with mean state anxiety (STAI-state) and trait anxiety (STAI-trait) scores of 32.8 ± 10.3 and 32.8 ± 9.9, respectively. Laboratory assessments revealed a mean SII of 634.8 ± 375.6 and a median SIRI of 0.8 (IQR 0.6, 1.2).
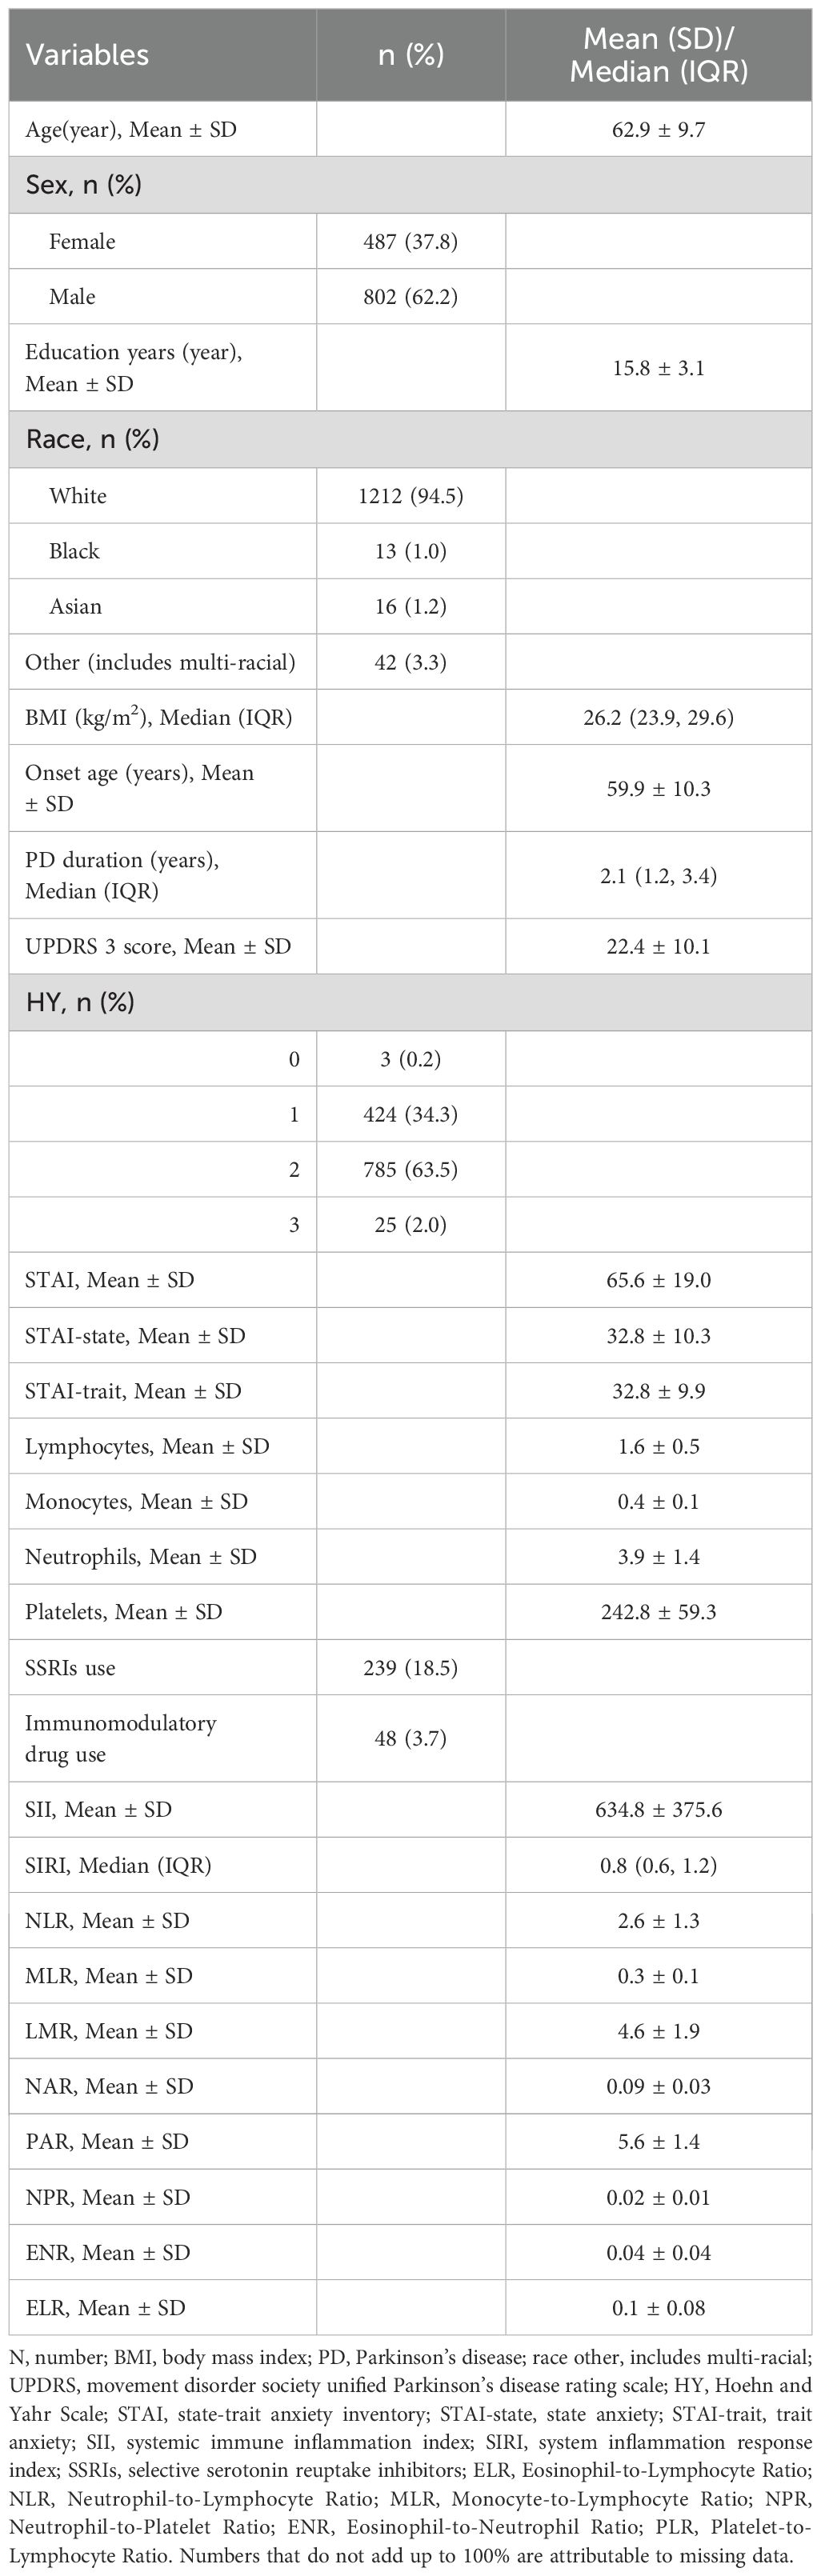
Table 1. Demographic and clinical characteristics of the study population.
3.2 Association between inflammatory markers and anxiety levels
Linear regression analysis was conducted to assess the association between the inflammatory markers (SII and SIRI) and anxiety levels in PD patients, as measured by the STAI. The results are summarized in Table 2. For the total STAI score, a 100-unit increase in SII was associated with a 0.34-point increase in total STAI score (β = 0.34, 95% CI: 0.07 - 0.6, p = 0.014) after adjusting for age, sex, BMI, education years, PD duration, MDS-UPDRS Part 3 score, Immunomodulatory drug usage, and SSRIs usage (Model 4). Similarly, a 0.1-unit increase in SIRI was associated with a 0.16-point increase in total STAI score (β = 0.16, 95% CI: 0.04 - 0.27, p = 0.008) after adjusting for the same covariates. For the state anxiety subscale (STAI-state), a 100-unit increase in SII was associated with a 0.21-point increase in STAI-state score (β = 0.21, 95% CI: 0.06 - 0.36, p = 0.005) (Model 4). A 0.1-unit increase in SIRI was associated with a 0.1-point increase in STAI-state score (β = 0.1, 95% CI: 0.04 - 0.17, p = 0.002). For the trait anxiety subscale (STAI-trait), SII and SIRI did not show a significant association. These findings indicate that higher levels of SII and SIRI are significantly associated with increased state anxiety in PD patients, independent of potential confounders. The association with trait anxiety was not significant.
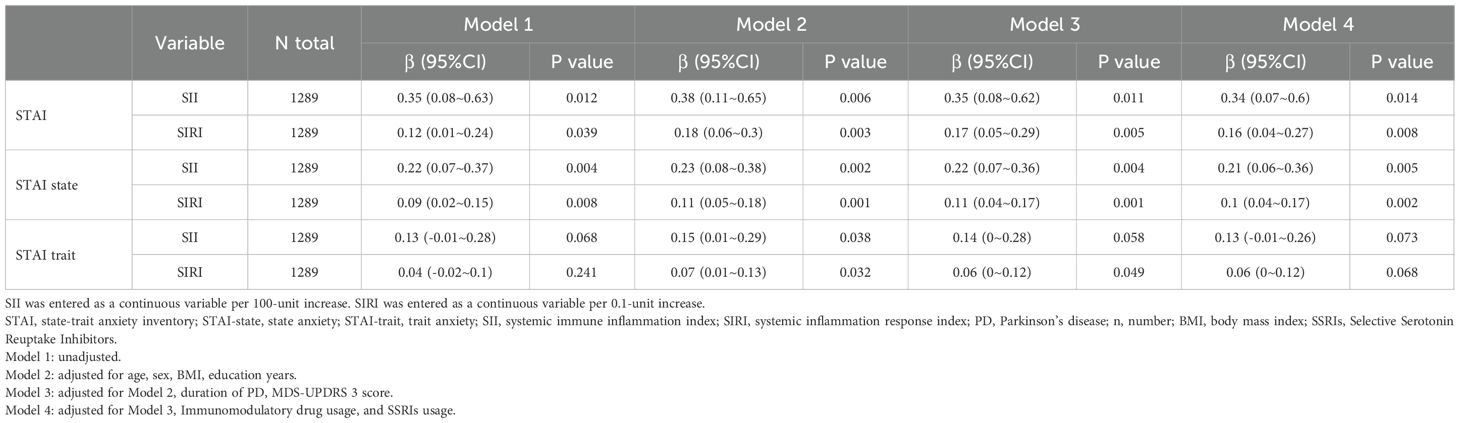
Table 2. Linear regression analysis of the association between inflammatory markers (SII and SIRI) and anxiety levels in PD.
3.3 Curve fitting analysis
Our analysis of the potential non-linear relationships between SII/SIRI and anxiety levels, as measured by total STAI scores and STAI-state scores, revealed that a linear model sufficiently describes these associations (Supplementary Figure 1, all P for non-linearity ≥0.05).
3.4 Sensitivity analysis
To ensure the robustness of our findings, we conducted a sensitivity analysis by excluding patients with any missing data (Table 3). The results from this analysis were consistent with those from the primary analysis, thereby confirming the reliability of our findings.
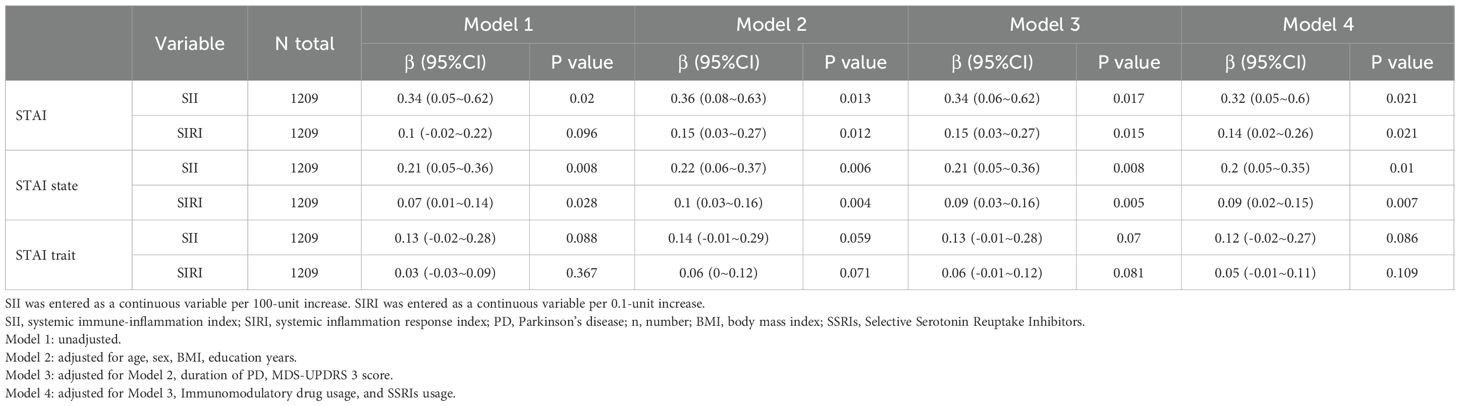
Table 3. Sensitivity analysis of the association between inflammatory markers (SII and SIRI) and anxiety levels in PD.
3.5 Subgroup analysis
We performed subgroup analyses across various demographic and clinical characteristics, including age, sex, BMI, PD duration, MDS UPDRS 3 score, PD age-onset group, and PD genetic group (Figures 2, 3). This suggests that the correlations between SII/SIRI and anxiety levels are both robust and largely unaffected by the characteristics examined in this analysis. Furthermore, the absence of significant interaction effects within these subgroups underscores the stability of these associations.
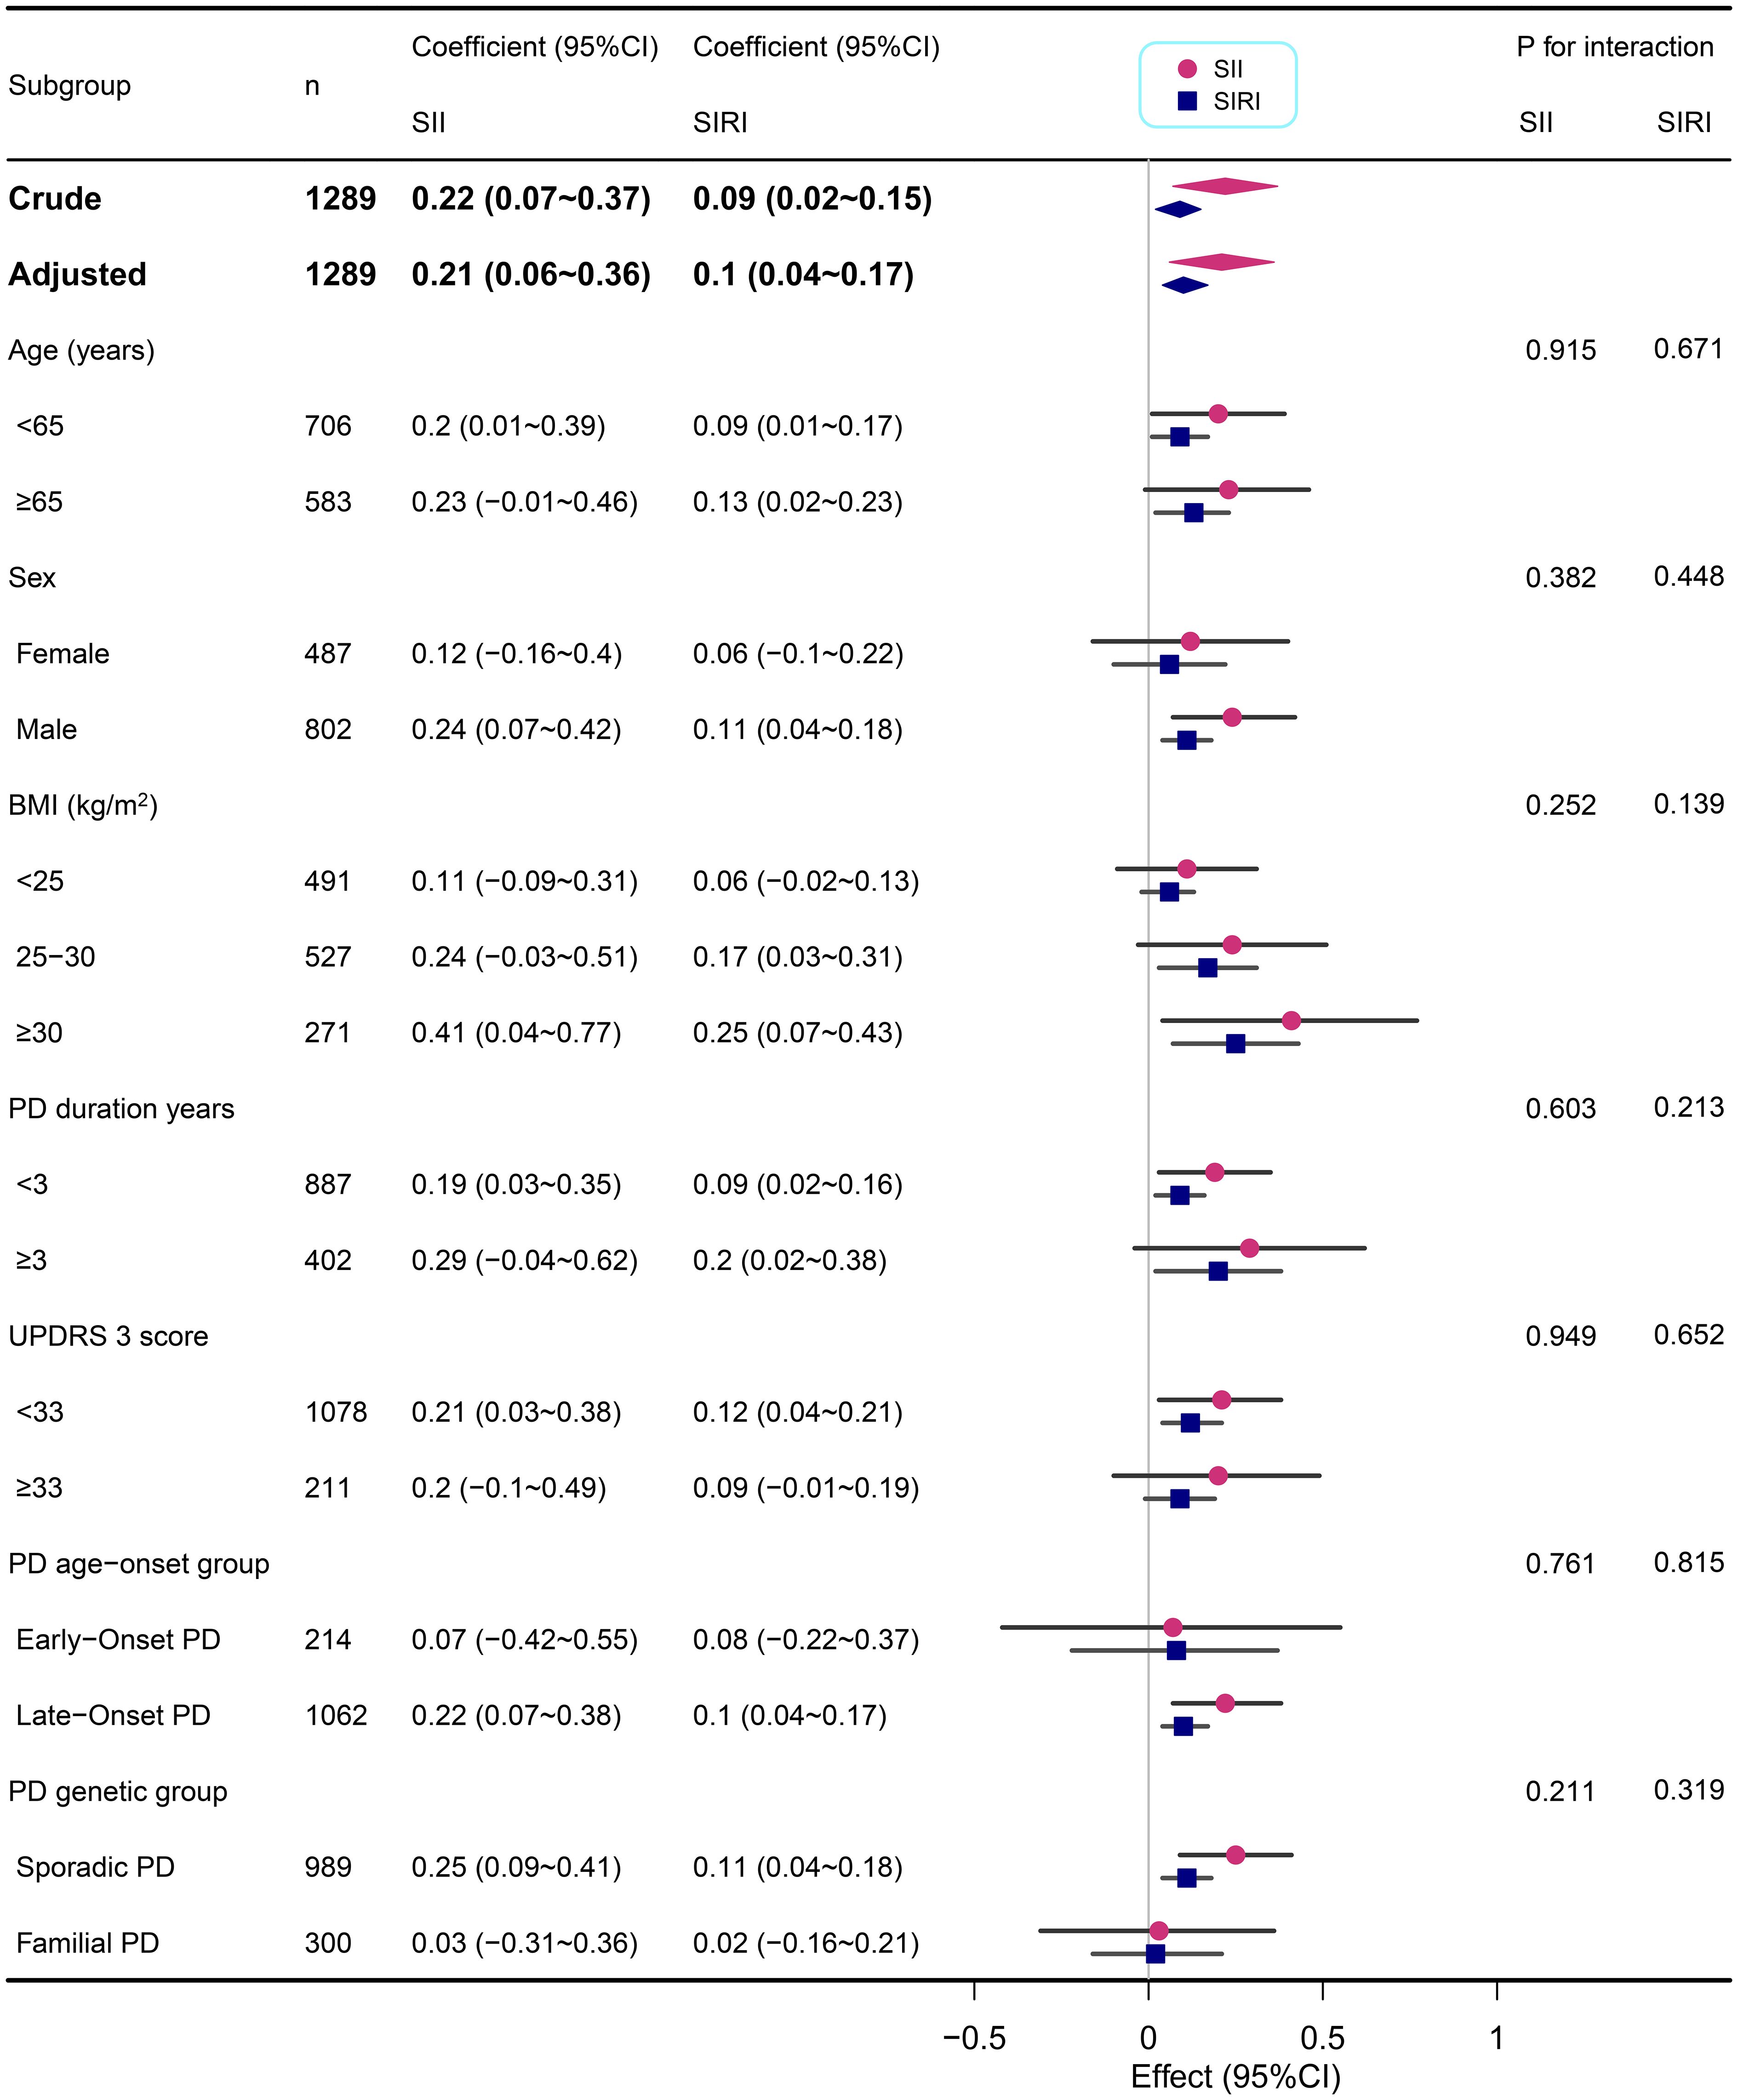
Figure 2. Subgroup analyses of the associations between inflammatory markers (SII and SIRI) and STAI-state in PD adjusted for age, sex, BMI, education years, duration of PD, MDS-UPDRS 3 score, Immunomodulatory drug usage, and SSRIs usage. In each case, the model was not adjusted for the stratification variable.
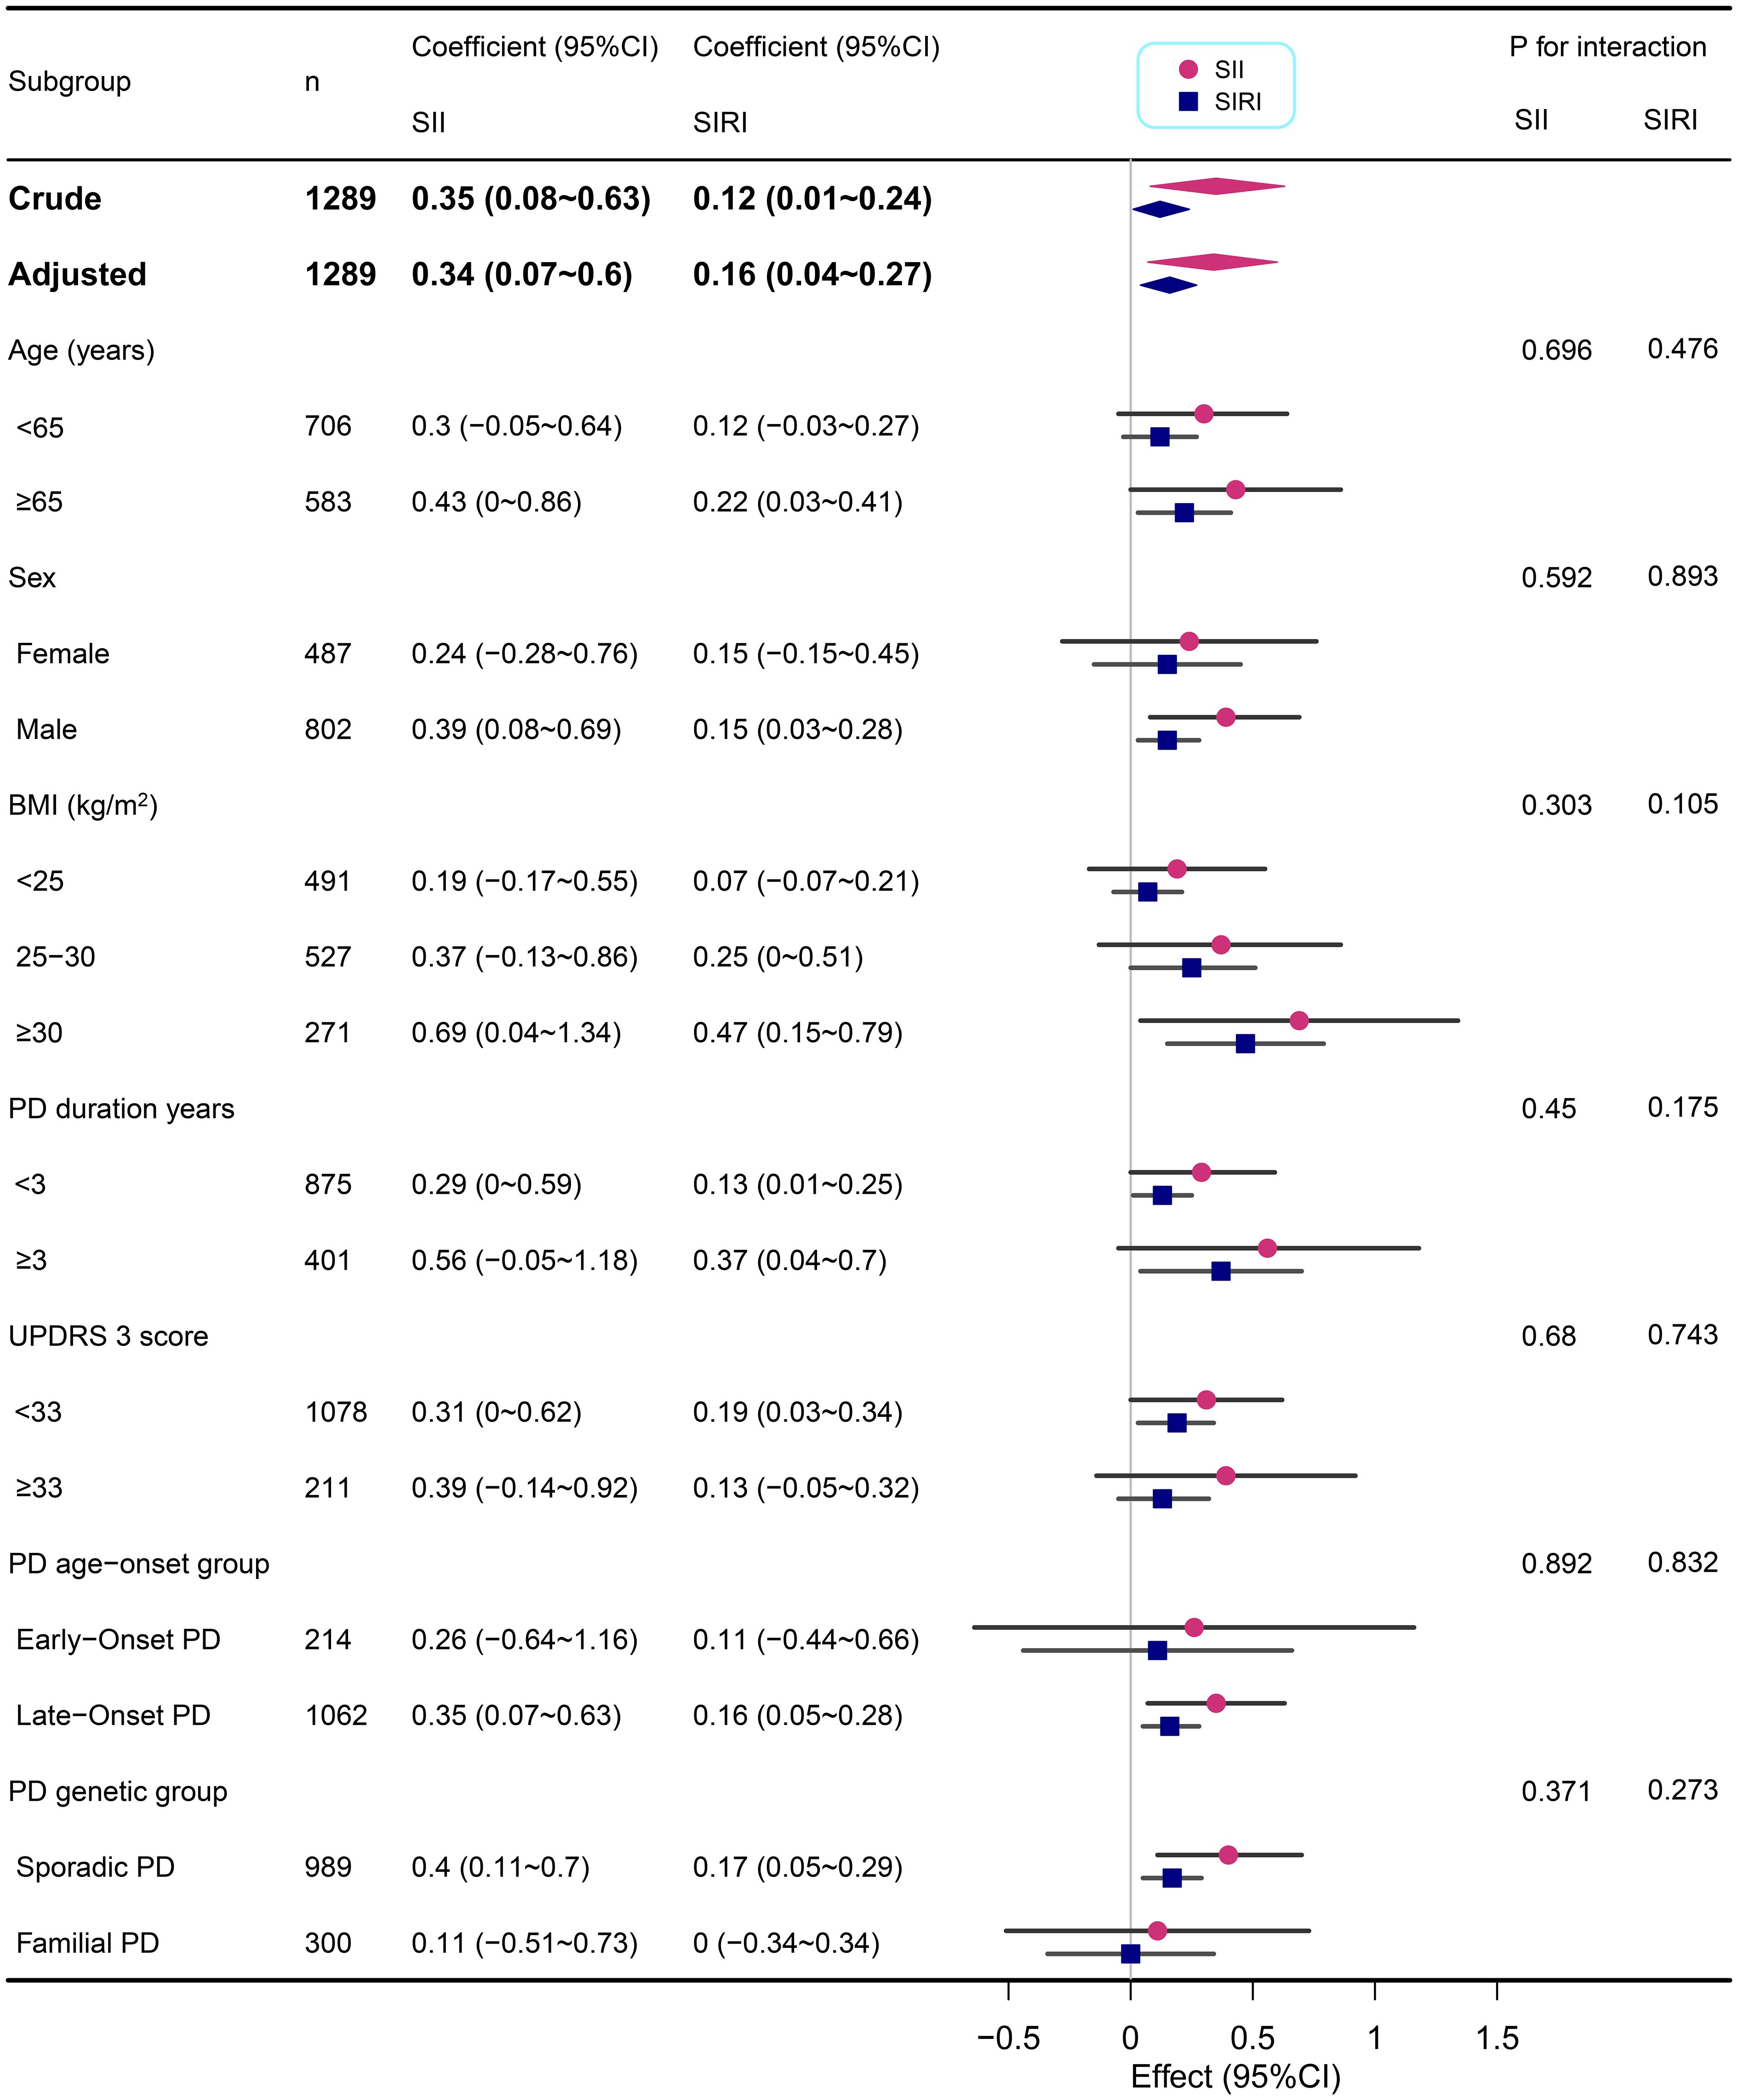
Figure 3. Subgroup analyses of the associations between inflammatory markers (SII and SIRI) and STAI in PD adjusted for age, sex, BMI, education years, duration of PD, MDS-UPDRS 3 score, Immunomodulatory drug usage, and SSRIs usage. In each case, the model was not adjusted for the stratification variable.
3.6 Machine learning performance
During the feature selection phase, we utilized the Boruta algorithm to screen all covariates. As illustrated in Supplementary Figure 2, the variables located in the green area, namely STAI-state, SII, SIRI, education years, PLR, NLR, MLR, ELR, ENR, and NPR, were identified as key factors for the model. These 10 feature variables were ultimately employed to construct the model. When selecting the most effective machine learning method, AUC serves as a pivotal criterion. Consequently, the LDA model was deemed optimal. The LDA model exhibited an average precision of 0.7765, an accuracy of 0.8498, a precision of 0.7765, and an F1 score of 0.673. The AUC values for both the training and test sets were 0.91, as shown in Supplementary Figure 3. It is worth noting that the SHAP-beeswarm plot highlighted the significant roles of SIRI and SII, as inflammatory indices, within the model (Supplementary Figure 4).
4 Discussion
Our study investigated the association between two novel inflammatory markers, SIRI and SII, and anxiety levels in PD patients. After comprehensive adjustment for potential confounders, we found that higher levels of SII and SIRI were significantly associated with increased state anxiety in PD patients. Specifically, a 100-unit increase in SII was associated with a 0.21-point increase in STAI-state score, and a 0.1-unit increase in SIRI was associated with a 0.1-point increase in STAI-state score. The association with trait anxiety was not significant. These findings highlight the potential role of systemic inflammation in the state of anxiety in PD patients.
Previous study has demonstrated increased SII levels are not only related to a higher risk of PD onset (HR = 1.04, 95% CI: 1.01 – 1.06, P = 0.013) but also to increased anxiety risk (HR = 1.03, 95% CI: 1.01 – 1.05, P = 0.025) (15). Logistics regression analysis indicated that higher SII was significantly correlated to the anxiety symptoms (P < 0.05) (11). Moreover, elevated neutrophil counts are significantly associated with increased anxiety risk (HR = 1.07, 95% CI: 1.04 – 1.10, P<0.001) (15). Additionally, higher lymphocyte counts or lymphocyte-to-monocyte ratios are associated with a reduced risk of PD (lymphocytes: HR = 0.73, 95% CI: 0.66 – 0.82, P<0.001; lymphocyte-to-monocyte ratios: HR = 0.78, 95% CI: 0.65 – 0.93, P = 0.013) (15). Low platelet counts are associated with an increased risk of PD onset (HR = 0.89, 95% CI: 0.84 – 0.95, P<0.001) (15). The impact of lower lymphocyte counts on PD risk may be causal (per 1-SD decrease, OR = 1.09, 95% CI: 1.01 – 1.18, P = 0.02) (16). These findings suggest that changes in inflammatory markers may play a significant role in the pathogenesis of PD. Moreover, studies on COVID-19 survivors have revealed a positive correlation between baseline SII and subsequent depression and anxiety scores (17). Elevated SII levels have also been associated with major depressive disorder (p = 0.002) (18), indicating that it may serve as a marker of low-grade inflammation observed in mood disorders (19). These findings underscore the broader relevance of inflammatory indices in neuropsychiatric conditions. Our study findings further support this notion, particularly in the context of anxiety, a non-motor symptom. We found that elevated inflammatory markers are closely correlated with state anxiety levels in PD patients.
The significant correlation between inflammatory indices and state anxiety in PD can be attributed to the complex interplay between peripheral and central inflammatory processes. Long-term activation of neutrophils can lead to tissue damage, as seen in various chronic inflammatory diseases (20–22). Neutrophils further amplify central inflammation by releasing granule proteins such as myeloperoxidase (23). These proteins trigger microglia, the brain’s resident immune cells, to adopt a pro-inflammatory M1 phenotype. M1 microglia secrete additional IL-6 and TNF-α (24). In PD, peripheral neutrophil activity is enhanced, while lymphocyte counts, particularly CD3+ and CD4+ T cells, are significantly reduced (25–27). This alteration may result from the migration of lymphocytes into the central nervous system, where they contribute to neuroinflammation. These infiltrating T cells also release pro-inflammatory cytokines such as TNF-α and IL-6, which directly damage dopaminergic neurons and activate microglia, establishing a positive feedback loop of neuroinflammation (24, 28).
Chronic neuroinflammation disrupts the blood-brain barrier (29), driven by matrix metalloproteinases and pro-inflammatory cytokines released by activated microglia (30). Increased blood-brain barrier permeability allows peripheral neutrophils to infiltrate the central nervous system, where they release reactive oxygen species and neurotoxic molecules, exacerbating oxidative stress and α-synuclein aggregation (29, 31).
Alterations in neuroanatomical circuits, such as the limbic cortex-striato-thalamocortical circuit (32) and the amygdala-insula pathway (33), further contribute to the development of anxiety in PD. The severity of anxiety has been reported to correlate with changes in the fear circuit (34). Prior literature has likewise demonstrated that T-cell subsets and neutrophils, by modulating inflammatory pathways, critically engage in maintaining the dynamic equilibrium of emotion-related neural networks (35, 36). Increased levels of cytokines, such as IL-6 and TNF-α, have been linked to anxiety-related brain regions including the prefrontal and limbic systems (37, 38). These cytokines can directly affect neuronal function and modulate the connectivity between the anterior cingulate cortex and amygdala, contributing to anxiety symptoms (39, 40). Systemic inflammation is a primary route that can lead to neuroinflammation, involving neural pathways, meningeal vessels, transport of cytokines across the blood-brain barrier, and secretion of cytokines by blood-brain barrier cells (41). The increased inflammation is associated with anxiety disorders and can be explained by the toxic effects of neuroinflammation on specific brain regions involved in each anxiety disorder (42). Future research could further explore these mechanistic pathways to clarify the precise role of inflammation in PD-related anxiety.
In this large, multi-center cross-sectional study, robust multivariable analyses, replicated across pre-specified subgroups and sensitivity checks, demonstrate that systemic immune-inflammation indices (SII and SIRI) are selectively associated with state, but not trait, anxiety in PD. These findings not only extend prior evidence for an inflammatory contribution to non-motor manifestations of PD but also highlight the potential clinical utility of SII and SIRI as biomarkers for state anxiety in PD patients. By identifying individuals at higher risk for state anxiety through elevated SII and SIRI scores, clinicians may be better positioned to implement timely surveillance and targeted intervention strategies, potentially improving patient outcomes.
Nevertheless, the design of this study precludes causal inference, residual confounding remains possible, and peripheral markers may imperfectly reflect central neuro-inflammation. These limitations, compounded by data-specific challenges such as a high attrition rate and minimal changes in anxiety scores over five years of follow-up, precluded a comprehensive longitudinal analysis in this study. Future research will address these limitations by incorporating longitudinal assessments, more detailed clinical records, neuroimaging, and cerebrospinal fluid biomarkers to better understand the progression of anxiety in PD, clarify the temporal dynamics of inflammation-driven anxiety, refine individual risk stratification, and inform precision enrollment in future therapeutic trials targeting neuropsychiatric symptoms in PD.
5 Conclusions
This study has revealed a significant association between inflammatory markers (SII and SIRI) and anxiety levels in patients with PD, pointing to inflammation’s possible role in PD-related anxiety. These results provide a foundation for future research exploring the complex relationship between inflammation and anxiety in PD and may inform the development of targeted intervention strategies.
Data availability statement
Publicly available datasets were analyzed in this study. This data can be found here: https://www.ppmi-info.org/access-data-specimens/download-datathe Parkinson’s Progression Markers Initiative (PPMI)PGEgaHJlZj0ibWFpbHRvOnpob3V3ZW42MTFAMTI2LmNvbSI+emhvdXdlbjYxMUAxMjYuY29tPC9hPg==.
Ethics statement
The studies involving humans were approved by The ethics committee/institutional review board for the Parkinson’s Progression Markers Initiative (PPMI) is the Western Institutional Review Board (WCG IRB). The studies were conducted in accordance with the local legislation and institutional requirements. The participants provided their written informed consent to participate in this study. Written informed consent was obtained from the individual(s) for the publication of any potentially identifiable images or data included in this article.
Author contributions
WZ: Funding acquisition, Software, Writing – original draft, Conceptualization, Methodology, Data curation. TZ: Supervision, Writing – original draft, Investigation. DL: Software, Supervision, Writing – original draft. RP: Data curation, Writing – original draft, Visualization. LG: Funding acquisition, Supervision, Methodology, Writing – review & editing, Project administration, Conceptualization.
Funding
The author(s) declare financial support was received for the research and/or publication of this article. This research was supported by Health China: Bu Chang Zhi Yuan Public welfare projects for heart and brain health under Grant, No. HIGHER2023073; Chengdu Medical Research Project No. 2022161; Chengdu Science and Technology Department project, No. 2024-YF05-00958-SN; Sichuan Provincial Science and Technology Department project in China, No. 2024ZYD0136.
Acknowledgments
The authors express their gratitude to the Parkinson’s Progression Markers Initiative (PPMI) for providing the data utilized in this study (www.ppmi-info.org). PPMI – a public-private partnership – is funded by the Michael J. Fox Foundation for Parkinson’s Research and funding partners, including 4D Pharma, Abbvie, AcureX, Allergan, Amathus Therapeutics, Aligning Science Across Parkinson’s, AskBio, Avid Radiopharmaceuticals, BIAL, BioArctic, Biogen, Biohaven, BioLegend, BlueRock Therapeutics, Bristol-Myers Squibb, Calico Labs, Capsida Biotherapeutics, Celgene, Cerevel Therapeutics, Coave Therapeutics, DaCapo Brainscience, Denali, Edmond J. Safra Foundation, Eli Lilly, Gain Therapeutics, GE HealthCare, Genentech, GSK, Golub Capital, Handl Therapeutics, Insitro, Jazz Pharmaceuticals, Johnson & Johnson Innovative Medicine, Lundbeck, Merck, Meso Scale Discovery, Mission Therapeutics, Neurocrine Biosciences, Neuron23, Neuropore, Pfizer, Piramal, Prevail Therapeutics, Roche, Sanofi, Servier, Sun Pharma Advanced Research Company, Takeda, Teva, UCB, Vanqua Bio, Verily, Voyager Therapeutics, the Weston Family Foundation and Yumanity Therapeutics. We also extend our thanks to the editors and reviewers for their constructive feedback during the revision process. Special acknowledgment is extended to Dr. Jie Liu from the Department of Vascular and Endovascular Surgery at the Chinese PLA General Hospital for his invaluable contributions to this study. We are also particularly grateful to Haibo Li, Ph.D., Associate Professor of Biostatistics in the Department of Epidemiology and Health Statistics, School of Public Health, Fujian Maternity and Child Health Hospital, Fujian Medical University, Fuzhou, China, for his expert statistical support and guidance. Their contributions have been essential to the success of this research.
Conflict of interest
The authors declare that the research was conducted in the absence of any commercial or financial relationships that could be construed as a potential conflict of interest.
Generative AI statement
The author(s) declare that no Generative AI was used in the creation of this manuscript.
Any alternative text (alt text) provided alongside figures in this article has been generated by Frontiers with the support of artificial intelligence and reasonable efforts have been made to ensure accuracy, including review by the authors wherever possible. If you identify any issues, please contact us.
Publisher’s note
All claims expressed in this article are solely those of the authors and do not necessarily represent those of their affiliated organizations, or those of the publisher, the editors and the reviewers. Any product that may be evaluated in this article, or claim that may be made by its manufacturer, is not guaranteed or endorsed by the publisher.
Supplementary material
The Supplementary Material for this article can be found online at: https://www.frontiersin.org/articles/10.3389/fpsyt.2025.1635817/full#supplementary-material
Supplementary Figure 1 | Linear dose response relationship between inflammatory markers (SII and SIRI) and anxiety levels in PD. Adjustment factors included age, sex, BMI, education years, duration of PD, MDS-UPDRS 3 score, Immunomodulatory drug usage, and SSRIs usage. The red line and red area represent the estimated values and their corresponding 95% confidence intervals, respectively.
Supplementary Figure 2 | Boruta algorithm (B) are employed during the variable selection phase. The significance of potential predictors of anxiety status was assessed using the Boruta algorithm. The horizontal axis displays the names of the variables, while the vertical axis represents the Z-values for each variable. The box plots illustrate the Z-values during model calculations, with green boxes indicating important variables and red boxes denoting unimportant variables.
Supplementary Figure 3 | The ROC of the machine learning models in train and test set.
Supplementary Figure 4 | SHAP-beeswarm plot illustrating the contribution of each feature to the prediction of anxiety status. Each point represents a single observation from the dataset, positioned according to its SHAP value (horizontal axis) and colored by the value of the corresponding feature (vertical axis). Features are ranked vertically by their total impact on the model’s predictions, with higher values indicating greater influence. Positive SHAP values (right side of the plot) indicate features that contribute to a higher predicted probability of anxiety, while negative SHAP values (left side of the plot) indicate features that contribute to a lower predicted probability. The color gradient reflects the actual value of the feature, with higher values shown in red and lower values in blue.
References
1. Shulman LM, Taback RL, Rabinstein AA, and Weiner WJ. Non-recognition of depression and other non-motor symptoms in parkinson’s disease. Parkinsonism Related Disord. (2002) 8:193–7. doi: 10.1016/S1353-8020(01)00015-3
2. Broen MPG, Narayen NE, Kuijf ML, Dissanayaka NNW, and Leentjens AFG. Prevalence of anxiety in parkinson’s disease: A systematic review and meta-analysis. Mov Disord. (2016) 31:1125–33. doi: 10.1002/mds.26643
3. Menza MA, Robertson-Hoffman DE, and Bonapace AS. Parkinson’s disease and anxiety: Comorbidity with depression. Biol Psychiatry. (1993) 34:465–70. doi: 10.1016/0006-3223(93)90237-8
4. Ojo OO and Fernandez HH. Current understanding of psychosis in parkinson’s disease. Curr Psychiatry Rep. (2016) 18:97. doi: 10.1007/s11920-016-0730-1
5. Schrag A, Siddiqui UF, Anastasiou Z, Weintraub D, and Schott JM. Clinical variables and biomarkers in prediction of cognitive impairment in patients with newly diagnosed parkinson’s disease: A cohort study. Lancet Neurol. (2017) 16:66–75. doi: 10.1016/S1474-4422(16)30328-3
6. Lopez RB, Denny BT, and Fagundes CP. Neural mechanisms of emotion regulation and their role in endocrine and immune functioning: A review with implications for treatment of affective disorders. Neurosci Biobehav Rev. (2018) 95:508–14. doi: 10.1016/j.neubiorev.2018.10.019
7. Dlay JK, Duncan GW, Khoo TK, Williams-Gray CH, Breen DP, Barker RA, et al. Progression of neuropsychiatric symptoms over time in an incident parkinson’s disease cohort (ICICLE-PD). Brain Sci. (2020) 10:78. doi: 10.3390/brainsci10020078
8. Hughes TA, Ross HF, Mindham RHS, and Spokes EGS. Mortality in parkinson’s disease and its association with dementia and depression. Acta Neurol Scand. (2004) 110:118–23. doi: 10.1111/j.1600-0404.2004.00292.x
9. Shi Y, Dobkin R, Weintraub D, Cho HR, Caspell-Garcia C, Bock M, et al. Association of baseline depression and anxiety with longitudinal health outcomes in parkinson’s disease. Mov Disord Clin Pract. (2024) 11:1103–12. doi: 10.1002/mdc3.14145
10. Wang X, Li T, Li H, Li D, Wang X, Zhao A, et al. Association of dietary inflammatory potential with blood inflammation: The prospective markers on mild cognitive impairment. Nutrients. (2022) 14:2417. doi: 10.3390/nu14122417
11. Liu X, Bai X, Ren R, Tan L, Zhang Y, Lan H, et al. Association between depression or anxiety symptoms and immune-inflammatory characteristics in in-patients with tuberculosis: A cross-sectional study. Front Psychiatry. (2022) 13:985823. doi: 10.3389/fpsyt.2022.985823
12. Lee B, Kwon J-T, Jeong Y, Caris H, Oh D, Feng M, et al. Inflammatory and anti-inflammatory cytokines bidirectionally modulate amygdala circuits regulating anxiety. Cell. (2025) 188:2190–2202.e15. doi: 10.1016/j.cell.2025.03.005
13. Sah A and Singewald N. The (neuro)inflammatory system in anxiety disorders and PTSD: Potential treatment targets. Pharmacol Ther. (2025) 269:108825. doi: 10.1016/j.pharmthera.2025.108825
14. Munshi S, Parrilli V, and Rosenkranz JA. Peripheral anti-inflammatory cytokine interleukin-10 treatment mitigates interleukin-1β-induced anxiety and sickness behaviors in adult male rats. Behav Brain Res. (2019) 372:112024. doi: 10.1016/j.bbr.2019.112024
15. Zhong X, Qiang Y, Wang L, Zhang Y, Li J, Feng J, et al. Peripheral immunity and risk of incident brain disorders: A prospective cohort study of 161,968 participants. Transl Psychiatry. (2023) 13:382. doi: 10.1038/s41398-023-02683-0
16. Jensen MP, Jacobs BM, Dobson R, Bandres-Ciga S, Blauwendraat C, Schrag A, et al. International Parkinson’s Disease Genomics Consortium (IPDGC). Lower lymphocyte count is associated with increased risk of parkinson’s disease. Ann Neurol. (2021) 89:803–12. doi: 10.1002/ana.26034
17. Mazza MG, De Lorenzo R, Conte C, Poletti S, Vai B, Bollettini I, et al. Anxiety and depression in COVID-19 survivors: Role of inflammatory and clinical predictors. Brain Behav Immun. (2020) 89:594–600. doi: 10.1016/j.bbi.2020.07.037
18. Zhou L, Ma X, and Wang W. Inflammation and coronary heart disease risk in patients with depression in China mainland: A cross-sectional study. Neuropsychiatr Dis Treat. (2020) 16:81–6. doi: 10.2147/NDT.S216389
19. Benedetti F, Aggio V, Pratesi ML, Greco G, and Furlan R. Neuroinflammation in bipolar depression. Front Psychiatry. (2020) 11:71. doi: 10.3389/fpsyt.2020.00071
20. Mócsai A. Diverse novel functions of neutrophils in immunity, inflammation, and beyond. J Exp Med. (2013) 210:1283–99. doi: 10.1084/jem.20122220
21. Gifford AM and Chalmers JD. The role of neutrophils in cystic fibrosis. Curr Opin Hematol. (2014) 21:16–22. doi: 10.1097/MOH.0000000000000009
22. Wright HL, Moots RJ, and Edwards SW. The multifactorial role of neutrophils in rheumatoid arthritis. Nat Rev Rheumatol. (2014) 10:593–601. doi: 10.1038/nrrheum.2014.80
23. Fricker M, Tolkovsky AM, Borutaite V, Coleman M, and Brown GC. Neuronal cell death. Physiol Rev. (2018) 98:813–80. doi: 10.1152/physrev.00011.2017
24. Tiwari PC and Pal R. The potential role of neuroinflammation and transcription factors in parkinson disease. Dialog Clin Neurosci. (2017) 19:71–80. doi: 10.31887/DCNS.2017.19.1/rpal
25. Kouli A, Camacho M, Allinson K, and Williams-Gray CH. Neuroinflammation and protein pathology in parkinson’s disease dementia. Acta Neuropathol Commun. (2020) 8:211. doi: 10.1186/s40478-020-01083-5
26. Sommer A, Marxreiter F, Krach F, Fadler T, Grosch J, Maroni M, et al. Th17 lymphocytes induce neuronal cell death in a human iPSC-based model of parkinson’s disease. Cell Stem Cell. (2018) 23:123–131.e6. doi: 10.1016/j.stem.2018.06.015
27. Brochard V, Combadière B, Prigent A, Laouar Y, Perrin A, Beray-Berthat V, et al. Infiltration of CD4+ lymphocytes into the brain contributes to neurodegeneration in a mouse model of parkinson disease. J Clin Invest. (2009) 119:182–92. doi: 10.1172/JCI36470
28. Tansey MG, Wallings RL, Houser MC, Herrick MK, Keating CE, and Joers V. Inflammation and immune dysfunction in parkinson disease. Nat Rev Immunol. (2022) 22:657–73. doi: 10.1038/s41577-022-00684-6
29. Kempuraj D, Thangavel R, Selvakumar GP, Zaheer S, Ahmed ME, Raikwar SP, et al. Brain and peripheral atypical inflammatory mediators potentiate neuroinflammation and neurodegeneration. Front Cell Neurosci. (2017) 11:216. doi: 10.3389/fncel.2017.00216
30. Kempuraj D, Thangavel R, Natteru PA, Selvakumar GP, Saeed D, Zahoor H, et al. Neuroinflammation induces neurodegeneration. J Neurol Neurosurg Spine. (2016) 1:1003.
31. Kelly LP, Carvey PM, Keshavarzian A, Shannon KM, Shaikh M, Bakay RAE, et al. Progression of intestinal permeability changes and alpha-synuclein expression in a mouse model of parkinson’s disease. Mov Disord. (2014) 29:999–1009. doi: 10.1002/mds.25736
32. Carey G, Görmezoğlu M, de Jong JJA, Hofman PAM, Backes WH, Dujardin K, et al. Neuroimaging of anxiety in parkinson’s disease: A systematic review. Mov Disord. (2021) 36:327–39. doi: 10.1002/mds.28404
33. Bukalo O, Pinard CR, Silverstein S, Brehm C, Hartley ND, Whittle N, et al. Prefrontal inputs to the amygdala instruct fear extinction memory formation. Sci Adv. (2015) 1:e1500251. doi: 10.1126/sciadv.1500251
34. Wang X-M, Zhang Y-G, Li A-L, Long Z-H, Wang D, Li X-X, et al. Relationship between levels of inflammatory cytokines in the peripheral blood and the severity of depression and anxiety in patients with parkinson’s disease. Eur Rev Med Pharmacol Sci. (2016) 20:3853–6.
35. Poletti S, de Wit H, Mazza E, Wijkhuijs AJM, Locatelli C, Aggio V, et al. Th17 cells correlate positively to the structural and functional integrity of the brain in bipolar depression and healthy controls. Brain Behav Immun. (2017) 61:317–25. doi: 10.1016/j.bbi.2016.12.020
36. Aruldass AR, Kitzbichler MG, Morgan SE, Lim S, Lynall M-E, Turner L, et al. Wellcome Trust Consortium for Neuroimmunology of Mood Disorders and Alzheimer’s Disease (NIMA), Cavanagh J, Cowen P, et al. Dysconnectivity of a brain functional network was associated with blood inflammatory markers in depression. Brain Behav Immun. (2021) 98:299–309. doi: 10.1016/j.bbi.2021.08.226
37. Slavich GM, Way BM, Eisenberger NI, and Taylor SE. Neural sensitivity to social rejection is associated with inflammatory responses to social stress. Proc Natl Acad Sci U S A. (2010) 107:14817–22. doi: 10.1073/pnas.1009164107
38. Shang J, Fu Y, Ren Z, Zhang T, Du M, Gong Q, et al. The common traits of the ACC and PFC in anxiety disorders in the DSM-5: Meta-analysis of voxel-based morphometry studies. PLoS One. (2014) 9:e93432. doi: 10.1371/journal.pone.0093432
39. Harrison NA, Brydon L, Walker C, Gray MA, Steptoe A, and Critchley HD. Inflammation causes mood changes through alterations in subgenual cingulate activity and mesolimbic connectivity. Biol Psychiatry. (2009) 66:407–14. doi: 10.1016/j.biopsych.2009.03.015
40. Muscatell KA, Dedovic K, Slavich GM, Jarcho MR, Breen EC, Bower JE, et al. Greater amygdala activity and dorsomedial prefrontal-amygdala coupling are associated with enhanced inflammatory responses to stress. Brain Behav Immun. (2015) 43:46–53. doi: 10.1016/j.bbi.2014.06.201
41. Gyoneva S, Davalos D, Biswas D, Swanger SA, Garnier-Amblard E, Loth F, et al. Systemic inflammation regulates microglial responses to tissue damage in vivo. Glia. (2014) 62:1345–60. doi: 10.1002/glia.22686
Keywords: Parkinson’s disease, anxiety, systemic immune-inflammation index (SII), systemic inflammation response index (SIRI), inflammation, cross-sectional study
Citation: Zhou W, Zeng T, Liu D, Pang R and Gong L (2025) Association between inflammatory markers (SII and SIRI) and anxiety levels in Parkinson’s disease. Front. Psychiatry 16:1635817. doi: 10.3389/fpsyt.2025.1635817
Received: 27 May 2025; Accepted: 20 August 2025;
Published: 02 September 2025.
Edited by:
Xi Chen, Sichuan Academy of Medical Sciences & Sichuan Provincial People’s Hospital, ChinaReviewed by:
Sagar Vyavahare, Augusta University, United StatesGeorge Kannarkat, University of Pennsylvania, United States
Copyright © 2025 Zhou, Zeng, Liu, Pang and Gong. This is an open-access article distributed under the terms of the Creative Commons Attribution License (CC BY). The use, distribution or reproduction in other forums is permitted, provided the original author(s) and the copyright owner(s) are credited and that the original publication in this journal is cited, in accordance with accepted academic practice. No use, distribution or reproduction is permitted which does not comply with these terms.
*Correspondence: Liang Gong, Y2QyZ29uZ2xpYW5nQDEyNi5jb20=