Abstract
Objective:
Cognitive frailty (CF) and depressive symptoms are prevalent in patients with chronic kidney disease (CKD) and may synergistically exacerbate adverse health outcomes. This study examined their association to inform early intervention strategies.
Methods:
Demographic and clinical data were collected from CKD patients across three hospitals in Shanghai. Depressive symptoms and CF status were assessed via standardized questionnaires. A logistic regression model and restricted cubic spline (RCS) analysis were employed to evaluate the association between depressive symptoms and CF.
Results:
CF was diagnosed using the Frailty Phenotype (FP), Montreal Cognitive Assessment (MoCA), and Clinical Dementia Rating (CDR). Among 800 participants, 317 exhibited CF (prevalence: 39.6%). The adjusted logistic regression model revealed a significant positive association between Center for Epidemiologic Studies Depression (CES-D) scores and CF (OR=1.124, 95% CI: 1.094–1.156, p<0.001). RCS analysis demonstrated a nonlinear dose-response relationship: CF prevalence increased with rising CES-D scores until plateauing at a score of 9. The odds ratio (OR) exceeded the statistical significance threshold when CES-D scores reached 12. Subgroup analyses consistently supported this dose-response pattern.
Conclusion:
Depressive symptoms are significantly associated with CF in CKD patients. Routine CES-D screening and provision of psychological support for patients scoring ≥12 may mitigate CF risk.
Introduction
In recent years, the prevalence of CKD has increased year by year, and the prevalence rate of the general population in the world has reached 14.3% (1). Recent studies show that the incidence of CF in patients with CKD is as high as 58.8% (2), which may have an important impact on patients’ health and reduce their compliance with treatment plans and quality of life. The factors related to cognitive weakness include female, 75 years old and above, poor economic status, rural residence, irregular exercise and cerebrovascular disease, etc. Primary health care is an important way to identify cognitive impairment early (3).
Now research has confirmed that CF can accelerate the development of patients’ physical frailty and cognitive impairment, seriously affect patients’ daily life, activity ability and quality of life (4), and is also an important predictor of serious adverse health outcomes such as falls, dementia, disability and even death (5). The increase of body toxins in CKD patients will lead to physical frailty and cognitive function decline (6). The coexistence of the two will aggravate the decline of patients’ self-management ability and medication compliance, and even develop into dementia, thus aggravating the progress of the course of CKD patients (7).
With the continuous progress of the course of CKD, the probability of depressive symptoms is higher due to abnormal metabolism, hemodynamic changes and vascular diseases, toxin accumulation and energy consumption caused by long-term dialysis treatment (8). Ma et al. investigated non-demented elderly people and found that the prevalence of CF in depressed people reached 15.1% (9). Their research results showed that depression symptoms were an independent related factor of CF in healthy people. Many studies have confirmed that depressive symptoms are an important risk factor for CF (10). There is a similar pathological mechanism between depression symptoms and CF. Persistent depressive symptoms will reduce the desire of CKD patients to participate in social activities, thus reducing their social support and greatly increasing the risk of CF (11). Therefore, it is very important to study the relationship between depressive symptoms and CF in CKD patients.
Therefore, in our study, we studied the potential correlation between CES-D score and CF, with the aim of better controlling CF by controlling the occurrence of depressive symptoms in CKD patients. In the past, many studies focused on the relationship between depression symptoms and CF (12), but all of them were included in the model for analysis as classified variables, which would lose some information as continuous variables. At present, there are few studies on the relationship between CES-D score as a continuous variable and the risk of CF (13). RCS can intuitively describe the nonlinear relationship between continuous variables and outcomes, and has been applied by more and more researchers. This study investigates the association between CES-D scores and CF in CKD patients using restricted cubic spline (RCS) analysis to characterize nonlinear relationships.
Materials and methods
Study population and design
The study cohort was derived from three tertiary hospitals in Shanghai. Potential chronic kidney disease (CKD) participants were initially identified through systematic screening of electronic medical records. Following rigorous eligibility assessment, 280 participants were excluded based on predefined exclusion criteria (presence of severe cognitive/hearing impairment or critical illness status). The remaining 800 participants (73.6% of initially screened candidates) provided written informed consent, achieving a final participation rate of 85.2% among medically qualified candidates (Figure 1).
Figure 1
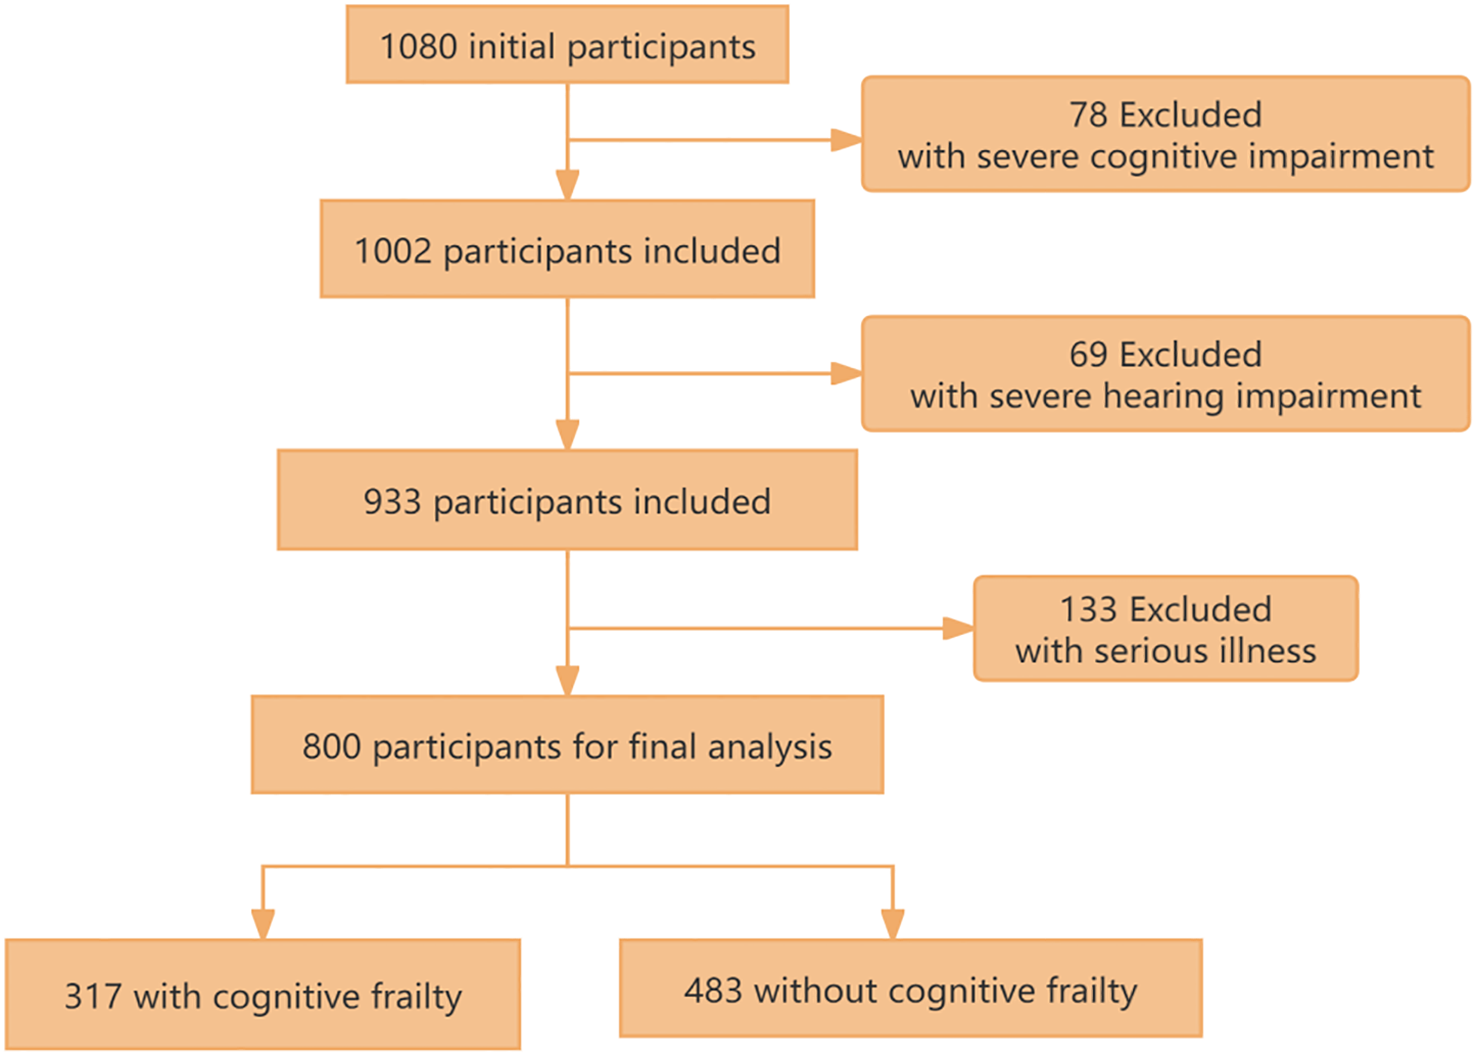
The flow chart of study population selection.
Measurement methods
Depression symptoms and CF were assessed using validated scales. Depression symptoms were assessed by the CES-D, which was compiled by Radloff and others of the National Institute of Mental Health (NIMH) (14). The CES-D scale exhibits validated reliability in chronic kidney disease populations (Cronbach’s α=0.85) (15).
The diagnostic criteria for CF were established in accordance with the 2013 assessment standards promulgated by the International Academy on Nutrition and Aging (IANA) and the International Association of Gerontology and Geriatrics (IAGG) (16). Participants were required to meet the following concurrent criteria: (1) FP scale scores ranging from 3 to 5; (2) MoCA scale score <26; (3) Absence of dementia diagnosis with CDR scale score of 0.5 (17).
Frailty Phenotype (FP), proposed by Freid et al. in 2001 (18), includes five phenotypes: unexplained weight loss, self-incriminating fatigue, slow walking speed, weak grip strength, and less physical activity. Scores range 0-5; ≥3 indicates frailty, 1–2 pre-frailty, 0 no frailty, with higher scores indicating greater severity.
Montreal Cognitive Assessment (MoCA), developed by Nasreddine et al. in 2004 (19), assesses seven domains: visuospatial ability, naming, attention, language, abstract reasoning, memory (immediate and delayed), and computation/spatial orientation. Scores range 0-30; ≥26 indicates normal cognition, <26 suggests impairment, with a 1-point addition for education below 12 years.
Clinical Dementia Rating (CDR): Developed by Hughes et al., the CDR (20)scale covers six domains: problem-solving, orientation, memory, social activities, family/work/hobbies, and self-care. Evaluated by trained clinical staff, scores are synthesized from sub-items, not summed. Scores indicate: 0 for normal cognition, 0.5 for questionable dementia, 1.0 for mild, 2.0 for moderate, and 3.0 for severe dementia.
In our study, we employed three primary assessment tools: the CES-D, FP, MoCA, and CDR, all administered by experienced clinical physicians. These scales are widely used in China (21).
Covariate assessment
Covariate evaluation includes social demography, disease-related situation and lifestyle characteristics. The selection of these covariates was based on their proven association with cognitive function in prior studies and their strong correlation with the demographic characteristics of our target population (22).
Socio-demographic characteristics: gender, age, BMI (kg/m², categorized as <18.5, 18.5-24, or ≥24), marital status (married, never married, widely/divided), education level (below high school, high school, college or above), living conditions (alone, with family, with caregivers) (23). Disease-related conditions: course of CKD, dialysis, hypertension, diabetes, heart disease. Lifestyle characteristics: smoking, drinking, exercise, society. Smoking/drinking criteria: Never: <6 months or never; Current: >6 months and current within 30 days (24); Former: >6 months but not current. Exercise: one session defined as >50 min moderate (e.g., walking, Tai Chi) or >25 min high intensity (e.g., running, swimming, climbing, ball games, square dancing (25)).
Statistical analysis
Study participants were stratified into two cohorts based on the presence or absence of CF. In the analysis of weighted features, continuous variables were expressed as mean ± standard error (SE), while categorical variables were reported as percentages.
Statistical comparisons of baseline characteristics were performed using t-test for continuous variables and chi-square test for categorical variables. The association between depressive symptoms and CF was quantified through multivariable logistic regression analysis, with results expressed as adjusted odds ratios (OR) and corresponding 95% confidence intervals (CI) (26). In addition, we also conducted subgroup analysis to investigate whether this association was changed by social demography, disease-related conditions or lifestyle characteristics in the fully adjusted model (27). A two-segment linear regression model was subsequently constructed to determine the inflection point. All statistical analyses were performed using R software (version 4.3.3), with P-values<0.05 considered statistically significant.
Results
The basic characteristics of 800 participants, of whom 317 (39.6%) have CF. The average CES-D score of our population is 14.91. Among all the participants, 482 (60.3%) were male, with an average age of 48.23 years, and 470 (58.8%) had a below high school education. Compared with participants without CF participants with CF have higher CES-D scores. There are differences in CF between CKD patients with HD and those without HD, and the difference between drinking and CF in lifestyle characteristics is statistically significant. (See Table 1 for details.)
Table 1
| Variable | All participants | Non-CF | CF | P-value |
|---|---|---|---|---|
| Sex | 0.461 | |||
| Male | 482 (60.3%) | 296 (37.0%) | 186 (37.0%) | |
| Female | 318 (39.8%) | 187 (23.4%) | 131 (16.4%) | |
| Age | 48.23 ± 8.030 | 47.86 ± 8.444 | 48.79 ± 7.331 | <0.001 |
| BMI(kg/m2) | 0.495 | |||
| <18.5 | 106 (13.3%) | 61 (7.6%) | 45 (5.6%) | |
| 18.5-24 | 374 (46.8%) | 221 (27.6%) | 153 (19.1%) | |
| >24 | 320 (40.0%) | 201 (25.1%) | 119 (14.9%) | |
| Marital status | ||||
| Married | 386 (48.3%) | 226 (28.3%) | 160 (20.0%) | 0.588 |
| Never married | 180 (22.5%) | 111 (13.9%) | 69 (8.6%) | |
| Widowed/divorced | 234 (29.3%) | 146 (18.3%) | 88 (11.0%) | |
| Education attainment | 0.556 | |||
| Below high school | 470 (58.8%) | 277 (34.6%) | 193(24.1%) | |
| High school | 194 (24.3%) | 123 (15.4%) | 71 (8.9%) | |
| College or above | 136 (17.0%) | 83 (10.4%) | 53 (6.6%) | |
| Living conditions | 0.557 | |||
| Living alone | 115 (14.4%) | 71 (8.9%) | 44 (5.5%) | |
| Live with family | 541 (67.6%) | 320 (40.0%) | 221(27.6%) | |
| Living with caregivers | 144 (18.0%) | 92 (11.5%) | 52 (6.5%) | |
| Course | 0.697 | |||
| CKD1 | 76 (9.5%) | 50 (6.3%) | 26 (3.3%) | |
| CKD2 | 194 (24.3%) | 115 (14.4%) | 79 (9.9%) | |
| CKD3 | 272 (34.0%) | 158 (19.8%) | 114 (14.3%) | |
| CKD4 | 132 (16.5%) | 84 (10.5%) | 48 (6.0%) | |
| CKD5 | 126 (15.8%) | 76 (9.5%) | 50 (6.3%) | |
| Dialysis | 0.635 | |||
| No | 470 (58.8%) | 287 (35.9%) | 183(22.9%) | |
| Yes | 330 (41.3%) | 196 (24.5%) | 134(16.8%) | |
| Hypertension | 0.053 | |||
| No | 308 (38.5%) | 199 (24.9%) | 109(13.6%) | |
| Yes | 492 (61.5%) | 284 (35.5%) | 208(26.0%) | |
| Diabetes | 0.058 | |||
| No | 333 (41.6%) | 214 (26.8%) | 119 (14.9%) | |
| Yes | 467 (58.4%) | 269 (33.6%) | 198(24.8%) | |
| HD | 0.003 | |||
| No | 687 (85.9%) | 429 (53.6%) | 258(32.3%) | |
| Yes | 113 (14.1%) | 54 (6.8%) | 59 (7.4%) | |
| Smoking | 0.333 | |||
| Never smoking | 463 (57.9%) | 278 (34.8%) | 185 (23.1%) | |
| Current smoking | 235 (29.4%) | 149 (18.6%) | 86 (10.8%) | |
| Former smoking | 102 (12.8%) | 56 (7.0%) | 46 (5.8%) | |
| Drinking | 0.019 | |||
| Never drinking | 459 (57.4%) | 277 (34.6%) | 182(22.8%) | |
| Current drinking | 239 (29.9%) | 156 (19.5%) | 83 (10.4%) | |
| Former drinking | 102 (12.8%) | 50 (6.3%) | 52 (6.5%) | |
| Exercise | 0.938 | |||
| Every day | 152 (19.0%) | 92 (11.5%) | 60 (7.5%) | |
| 5–6 times a week | 175 (21.9%) | 108 (13.5%) | 67 (8.4%) | |
| 3–4 times a week | 316 (39.5%) | 189 (23.6%) | 127(15.9%) | |
| 1–2 times a week | 104 (13.0%) | 60 (7.5%) | 44 (5.5%) | |
| Never | 53 (6.6%) | 34 (4.3%) | 19 (2.4%) | |
| Society | 0.773 | |||
| Every day | 120 (15.0%) | 73 (9.1%) | 47 (5.9%) | |
| 5–6 times a week | 157 (19.6%) | 100 (12.5%) | 57 (7.1%) | |
| 3–4 times a week | 312 (39.0%) | 187 (23.4%) | 125(15.6%) | |
| 1–2 times a week | 164 (20.5%) | 98 (12.3%) | 66 (8.3%) | |
| Never | 47 (5.9%) | 25 (3.1%) | 22 (2.8%) | |
| Depressive symptoms | 14.910 ± 6.086 | 13.360 ± 5.260 | 17.260 ± 6.497 | <0.001 |
Weighted characteristics of participants in this study by CF.
Mean ± SE for continuous variables and % for categorical variables. HD, heart disease.
Table 2 shows CES-D score significantly related to CF, with positive OR associations across all models (OR≈1.12, p<0.001). Due to this relationship, we performed piecewise regression (Table 3), identifying an inflection point at CES-D=9: CF prevalence increases until CES-D=9, then OR plateaus. We adopted a cubic spline model based on model 3. Figure 2 indicates OR increases with CES-D score, becoming significantly >1 at CES-D=12.
Table 2
| Model | OR | 95%CI | P-value |
|---|---|---|---|
| Model 1 | |||
| CES-D score | 1.118 | (1.089, 1.147) | <0.001 |
| Model 2 | |||
| CES-D score | 1.120 | (1.091, 1.150) | <0.001 |
| Model 3 | |||
| CES-D score | 1.124 | (1.094, 1.156) | <0.001 |
Logistic regression results of associations between depression and CF.
Model 1, no covariate was adjusted. Model 2, sex, age, BMI, marital status, education attainment, living conditions were adjusted. Model 3, sex, age, BMI, marital status, education attainment, living conditions, course, dialysis, hypertension, diabetes, HD, smoking, drinking, exercise, society were adjusted.
Table 3
| Outcome | OR (95% CI) | P-value |
|---|---|---|
| Two-piecewise linear regression model | ||
| CES-D<9 | 6.466 (2.441-26.547) | 0.002 |
| CES-D≥9 | 1.103 (1.072-1.135) | <0.001 |
| Log-likelihood ratio test | <0.001 | |
Threshold effect analysis between depression and CF.
Sex, age, BMI, marital status, education attainment, living conditions, course, dialysis, hypertension, diabetes, HD, smoking, drinking, exercise, society were adjusted in the threshold effect analysis.
Figure 2
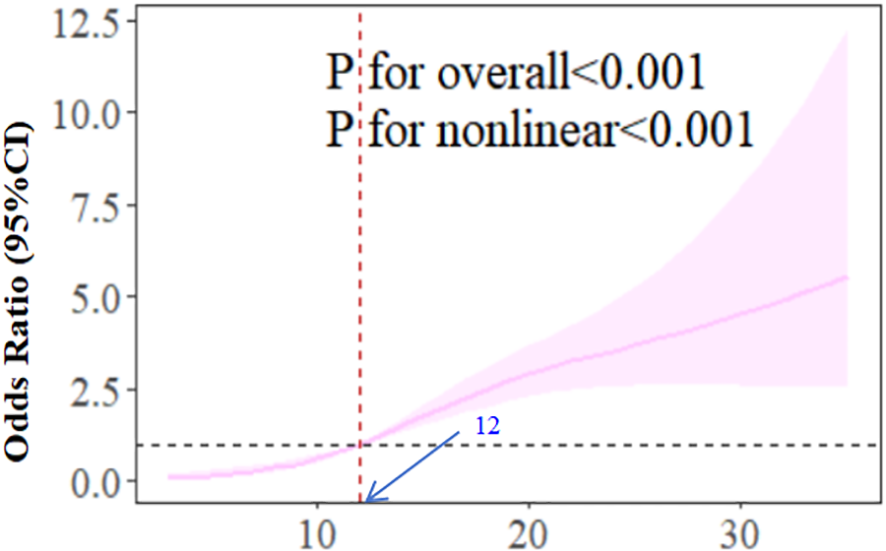
The dose-response relationship between CES-D score and CF.
Discussions
The status of depression symptoms and CF
There are 800 participants in this study, of which 317 (39.6%) have CF. The incidence of CF is higher than that of Chang (28) and others. The possible reason is that the object of this study is CKD patients treated in hospitals. The hospital environment will make patients more prone to CF. Therefore, we should strengthen the identification of CF in hospitalized CKD patients and explore effective CF intervention programs. The average CES-D score of our survey population is 14.91, and 140 people (17.5%) have a score of ≥20, which means that 17.5% of the 800 CKD patients surveyed in this study have depressive symptoms. Affected by the disease, the patient’s physical function is weakened, which leads to the occurrence of negative psychological emotions such as depression symptoms (29). Compared with participants without CF, participants with CF have higher average CES-D scores. As far as pathophysiological mechanism is concerned, CF and depression symptoms are interrelated, and there are some similar risk factors between them, such as cerebrovascular disease, chronic inflammation and oxidative stress (30).
Relationship between depression symptoms and CF
The RCS results of model 3 show that with the increase of CES-D score, the OR of correlation between CES-D and CF increases. When the CES-D score reaches 12, the OR is significantly higher than 1. This suggests that when the CES-D score is higher than 12, we should pay attention to the patients’ depression symptoms and give them psychological counseling, instead of waiting until the depression symptoms score is ≥20 to pay attention to the patients’ depression symptoms.
The dose-response curve derived from restricted cubic spline analysis further corroborates the non-linear association, demonstrating a steeper slope in CF risk elevation below the CES-D threshold of 9 compared to the gradual increase observed beyond this inflection point. This pattern persists even after comprehensive adjustment for sociodemographic factors (age, marital status, education), lifestyle variables (smoking, alcohol consumption, exercise frequency), and clinical characteristics (dialysis status, hypertension control, diabetes management). The consistency across analytical approaches—from crude models to fully adjusted threshold regression—strengthens the robustness of our findings.
Notably, the identified threshold (CES-D=9) precedes conventional clinical thresholds for depression symptoms diagnosis (typically ≥16), suggesting subclinical depressive symptoms may already exert measurable impacts on cognitive function in CKD populations. This observation aligns with emerging evidence highlighting the continuum of depressive symptomatology in chronic disease management (31, 32). Pathophysiologically, this association might be mediated through shared mechanisms including chronic inflammation (elevated CRP and IL-6 levels), hypothalamic-pituitary-adrenal axis dysregulation, and cerebral microvascular changes—all documented in both depression symptoms and cognitive impairment pathways (33, 34).
Our findings extend previous work by Chang et al. through quantitative characterization of the exposure-response relationship (33, 34). The 12% increased CF risk per unit CES-D increment (Model 3 OR=1.124, 95%CI 1.094-1.156) exceeds estimates from general population studies, potentially reflecting disease-specific vulnerability in CKD patients (35). The persistent association across progressively adjusted models argues against complete confounding by measured covariates, though residual confounding from unmeasured factors (e.g., apolipoprotein E genotype, sleep architecture disturbances) remains possible (33–35).
Strengths and limitations
CF is a reversible or potentially reversible heterogeneous clinical syndrome. Early recognition and effective intervention of CF in CKD patients can greatly help to reverse the occurrence of CF. The findings of this study may be valuable for CF. It provides health professionals with additional insights on the close relationship between depression symptoms and CF. Because of the cross-sectional study design, we can’t infer causal reasoning or exclude two-way relationship, and there is a certain selection bias in variable selection.
Future studies will conduct further exploration through prospective cohort studies. The assessment of depressive symptoms in this investigation relied on self-report questionnaires, representing a subjective rather than objective measurement approach. Consequently, the sample size derived from the research data is constrained, being limited to three healthcare institutions. Subsequent multi-center investigations would be beneficial to mitigate potential result deviations (36). Notwithstanding these limitations, the present analysis yields significant findings that provide a foundation for further research.
Conclusion
Our study found that there was a nonlinear correlation between CES-D score and CF in CKD patients after adjusting for potential confounding factors. depression symptoms were considered to be an important influencing factor of CF, and there is a threshold effect in the above association. Health professionals can regard this association as an integral part of health care evaluation and management of patients with CF. In addition, the evidence of this study also encourages the general population to carry out regular self-rating depression symptoms, so as to maintain good mental health and reduce the occurrence of CF.
Statements
Data availability statement
The original contributions presented in the study are included in the article/supplementary material. Further inquiries can be directed to the corresponding author.
Ethics statement
The study was conducted in accordance with the Declaration of Helsinki, and approved by the Ethics Review Committee of 2025 Hainan Medical University Medical Ethics Pretrial No. (814). Informed consent was obtained from all participants.
Author contributions
PZ: Visualization, Project administration, Data curation, Methodology, Validation, Supervision, Conceptualization, Writing – original draft, Software, Writing – review & editing, Resources, Formal Analysis, Funding acquisition, Investigation. AF: Software, Visualization, Conceptualization, Data curation, Investigation, Writing – review & editing, Supervision, Methodology. NX: Supervision, Writing – review & editing, Conceptualization, Software, Methodology, Data curation, Investigation. JJ: Investigation, Software, Conceptualization, Writing – review & editing, Project administration, Formal Analysis, Validation. SP: Validation, Funding acquisition, Supervision, Formal Analysis, Resources, Writing – review & editing, Project administration, Writing – original draft, Conceptualization, Data curation, Software, Methodology, Investigation, Visualization.
Funding
The author(s) declare financial support was received for the research and/or publication of this article. College Students’ Innovation and Entrepreneurship Training Program (No.X202511810092). Shanghai Pudong New Area Health Commission Advantageous General Practice Medicine Project (No. PWYq-2025-03). Special Project for Clinical Research in the Health Industry of Shanghai Municipal Health Commission (No. 20254Y0092).
Conflict of interest
The authors declare that the research was conducted in the absence of any commercial or financial relationships that could be construed as a potential conflict of interest.
Generative AI statement
The author(s) declare that no Generative AI was used in the creation of this manuscript.
Any alternative text (alt text) provided alongside figures in this article has been generated by Frontiers with the support of artificial intelligence and reasonable efforts have been made to ensure accuracy, including review by the authors wherever possible. If you identify any issues, please contact us.
Publisher’s note
All claims expressed in this article are solely those of the authors and do not necessarily represent those of their affiliated organizations, or those of the publisher, the editors and the reviewers. Any product that may be evaluated in this article, or claim that may be made by its manufacturer, is not guaranteed or endorsed by the publisher.
Abbreviations
CF, Cognitive Frailty; CKD, Chronic Kidney Disease; RCS, Restricted Cubic Spline; CES-D, Center for Epidemiological Studies Depression scale; NIMH, National Institute of Mental Health; I.A.N.A./I.A.G.G, International Academy on Nutrition and Aging/International Association of Gerontology and Geriatric; FP, Frailty Phenotype; MoCA, Montreal Cognitive Assessment; CDR, Clinical Qualitative Rating; BMI, Body Mass Index; SE, standard error; OR, Odds Ratio; CI, Confidence Intervals; HD, Heart Disease.
References
1
Sundström J Bodegard J Bollmann A Vervloet MG Mark PB Karasik A et al . Prevalence, outcomes, and cost of chronic kidney disease in a contemporary population of 2·4 million patients from 11 countries: The CaReMe CKD study. Lancet Reg Health Eur. (2022) 20:100438. doi: 10.1016/j.lanepe.2022.100438
2
Munch PV Heide-Jørgensen U Jensen SK Birn H Vestergaard SV Frøkiær J et al . Performance of the race-free CKD-EPI creatinine-based eGFR equation in a Danish cohort with measured GFR. Clin Kidney J. (2023) 16:2728–37. doi: 10.1093/ckj/sfad253
3
Wang ZQ Fei L Xu YM Deng F Zhong BL . Prevalence and correlates of suspected dementia in older adults receiving primary healthcare in Wuhan, China: A multicenter cross-sectional survey. Front Public Health. (2022) 10:1032118. doi: 10.3389/fpubh.2022.1032118
4
Aravindhan K Morgan K Mat S Hamid TA Ibrahim R Saedon NI et al . Cognitive frailty and its association with depression, anxiety and stress during the COVID-19 pandemic among older adults in the transforming cognitive frailty into later-life self-sufficiency (AGELESS) study. Psychogeriatrics. (2023) 23:1071–82. doi: 10.1111/psyg.13031
5
Luo B Luo Z Zhang X Xu M Shi C . Status of cognitive frailty in elderly patients with chronic kidney disease and construction of a risk prediction model: a cross-sectional study. BMJ Open. (2022) 12:e060633. doi: 10.1136/bmjopen-2021-060633
6
Yuan Y Chang J Sun Q . Research progress on cognitive frailty in older adults with chronic kidney disease. Kidney Blood Press Res. (2024) 49:302–9. doi: 10.1159/000538689
7
Li X Zhang Y Tian Y Cheng Q Gao Y Gao M . Exercise interventions for older people with cognitive frailty-a scoping review. BMC Geriatr. (2022) 22:721. doi: 10.1186/s12877-022-03370-3
8
Liu CK Taffel L Russell M Wong SPY Russell H Vig EK . Decision-making about dialysis: Beyond just dialysis or death. J Am Geriatr Soc. (2023) 71:1378–85. doi: 10.1111/jgs.18256
9
Ma L Li Z Tang Z Sun F Diao L Li J et al . Prevalence and socio-demographic characteristics of disability in older adults in China: Findings from China Comprehensive Geriatric Assessment Study. Arch Gerontol Geriatr. (2017) 73:199–203. doi: 10.1016/j.archger.2017.07.029
10
Peng J Ming L Wu J Li Y Yang S Liu Q . Prevalence and related factors of cognitive frailty in diabetic patients in China: a systematic review and meta-analysis. Front Public Health. (2023) 11:1249422. doi: 10.3389/fpubh.2023.1249422
11
Coelho VA Santos GG Avesani CM Bezerra CIL Silva LCA Lauar JC et al . Design and methodology of the Aging Nephropathy Study (AGNES): a prospective cohort study of elderly patients with chronic kidney disease. BMC Nephrol. (2020) 21:461. doi: 10.1186/s12882-020-02116-w
12
Brunetto MA Ruberti B Halfen DP Caragelasco DS Vendramini THA Pedrinelli V et al . Healthy and chronic kidney disease (CKD) dogs have differences in serum metabolomics and renal diet may have slowed disease progression. Metabolites. (2021) 11:782. doi: 10.3390/metabo11110782
13
Seo EJ Son YJ . The prevalence of cognitive frailty and its association with sleep duration and depression among older adults with heart failure. Clin Gerontol. (2024) 47:416–25. doi: 10.1080/07317115.2022.2125858
14
Jauregi-Zinkunegi A Langhough R Johnson SC Mueller KD Bruno D . Comparison of the 10-, 14- and 20-item CES-D scores as predictors of cognitive decline. Brain Sci. (2023) 13:1530. doi: 10.3390/brainsci13111530
15
Lau SCL Baum CM Connor LT Chang CH . Psychometric properties of the Center for Epidemiologic Studies Depression (CES-D) scale in stroke survivors. Top Stroke Rehabil. (2023) 30:253–62. doi: 10.1080/10749357.2022.2026280
16
Deng Y Li N Wang Y Xiong C Zou X . Risk factors and prediction nomogram of cognitive frailty with diabetes in the elderly. Diabetes Metab Syndr Obes. (2023) 16:3175–85. doi: 10.2147/DMSO.S426315
17
Suprawesta L Chen SJ Liang HY Hwang HF Yu WY Lin MR . Factors affecting cognitive frailty improvement and progression in Taiwanese older adults. BMC Geriatr. (2024) 24:105. doi: 10.1186/s12877-024-04700-3
18
Deiner SG Marcantonio ER Trivedi S Inouye SK Travison TG Schmitt EM et al . Comparison of the frailty index and frailty phenotype and their associations with postoperative delirium incidence and severity. J Am Geriatr Soc. (2024) 72:1781–92. doi: 10.1111/jgs.18677
19
Lima Pereira V Freitas S Simões MR Gerardo B . Montreal Cognitive Assessment (MoCA): A validation study among prisoners. Crim Behav Ment Health. (2023) 33:330–41. doi: 10.1002/cbm.2306
20
Lanctôt KL Boada M Tariot PN Dabbous F Hahn-Pedersen J Udayachalerm S et al . Association between clinical dementia rating and clinical outcomes in Alzheimer’s disease. Alzheimers Dement (Amst). (2024) 16:e12522. doi: 10.1002/dad2.12522
21
Luo W Zhong BL Chiu HF . Prevalence of depressive symptoms among Chinese university students amid the COVID-19 pandemic: a systematic review and meta-analysis. Epidemiol Psychiatr Sci. (2021) 30:e31. doi: 10.1017/S2045796021000202
22
Zhang HG Fan F Zhong BL Chiu HF . Relationship between left-behind status and cognitive function in older Chinese adults: a prospective 3-year cohort study. Gen Psychiatr. (2023) 36:e101054. doi: 10.1136/gpsych-2023-101054
23
Gajdosova L Jakus V Muchova J . Understanding cognitive frailty in aging adults: prevalence, risk factors, pathogenesis and non-pharmacological interventions. Bratisl Lek Listy. (2023) 124:647–52. doi: 10.4149/BLL_2023_100
24
Fältström A Skillgate E Weiss N Källberg H Lyberg V Waldén M et al . Lifestyle characteristics in adolescent female football players: data from the Karolinska football Injury Cohort. BMC Sports Sci Med Rehabil. (2022) 14:212. doi: 10.1186/s13102-022-00603-1
25
Wanasinghe D Shah S Bamanikar A Aboudi D Mikkilineni S Shyong O et al . Lifestyle characteristics of parental electronic cigarette and marijuana users: healthy or not? J Perinat Med. (2019) 48:59–66. doi: 10.1515/jpm-2019-0392
26
You Y Chen Y Zhang Q Yan N Ning Y Cao Q . Muscle quality index is associated with trouble sleeping: a cross-sectional population based study. BMC Public Health. (2023) 23:489. doi: 10.1186/s12889-023-15411-6
27
Mao J Hu H Zhao Y Zhou M Yang X . Association between composite dietary antioxidant index and cognitive function among aging americans from NHANES 2011-2014. J Alzheimers Dis. (2024) 98:1377–89. doi: 10.3233/JAD-231189
28
Chang J Hou W Li Y Li S Zhao K Wang Y et al . Prevalence and associated factors of cognitive frailty in older patients with chronic kidney disease: a cross-sectional study. BMC Geriatr. (2022) 22:681. doi: 10.1186/s12877-022-03366-z
29
Griffiths J Seesen M Sirikul W Siviroj P . Malnutrition, Depression, Poor Sleep Quality, and Difficulty Falling Asleep at Night Are Associated with a Higher Risk of Cognitive Frailty in Older Adults during the COVID-19 Restrictions. Nutrients. (2023) 15:2849. doi: 10.3390/nu15132849
30
Zou C Yu Q Wang C Ding M Chen L . Association of depression with cognitive frailty: A systematic review and meta-analysis. J Affect Disord. (2023) 320:133–9. doi: 10.1016/j.jad.2022.09.118
31
Mohd Safien A Ibrahim N Subramaniam P Singh DKA Mat Ludin AF Chin AV et al . Prevalence of depression and clinical depressive symptoms in community-dwelling older adults with cognitive frailty. Geriatr Gerontol Int. (2024) 24:225–33. doi: 10.1111/ggi.14801
32
Ramírez-Vélez R Olabarrieta-Landa L Rivera D Izquierdo M . Factor structure of the 10-item CES-D Scale among patients with persistent COVID-19. J Med Virol. (2023) 95:e28236: doi: 10.1002/jmv.28236
33
Huang J Zeng X Hu M Ning H Wu S Peng R et al . Prediction model for cognitive frailty in older adults: A systematic review and critical appraisal. Front Aging Neurosci. (2023) 15:1119194. doi: 10.3389/fnagi.2023.1119194
34
Lyu Q Guan CX Kong LN Zhu JL . Prevalence and risk factors of cognitive frailty in community-dwelling older adults with diabetes: A systematic review and meta-analysis. Diabetes Med. (2023) 40:e14935. doi: 10.1111/dme.14935
35
Chu W Chang SF Ho HY Lin HC . The relationship between depression and frailty in community-dwelling older people: A systematic review and meta-analysis of 84,351 older adults. J Nurs Scholarsh. (2019) 51:547–59. doi: 10.1111/jnu.12501
36
Yang T Zheng G Peng S . Association between sleep quality and MCI in older adult patients with multimorbidity. Front Public Health. (2025) 13:1547425. doi: 10.3389/fpubh.2025.1547425
Summary
Keywords
chronic kidney disease, depression symptoms, cognitive frailty, CES-D, RCS
Citation
Zhang P, Fan A, Xie N, Jiang J and Peng S (2025) Association between depression symptoms and cognitive frailty in chronic kidney disease patients: a cross-sectional study. Front. Psychiatry 16:1648424. doi: 10.3389/fpsyt.2025.1648424
Received
17 June 2025
Accepted
15 September 2025
Published
24 September 2025
Volume
16 - 2025
Edited by
Vassilis Martiadis, Department of Mental Health, Italy
Reviewed by
Xiu-Jun Liu, Wuhan Mental Health Center, China
Yan-Min Xu, Wuhan Hospital for Psychotherapy, China
Updates
Copyright
© 2025 Zhang, Fan, Xie, Jiang and Peng.
This is an open-access article distributed under the terms of the Creative Commons Attribution License (CC BY). The use, distribution or reproduction in other forums is permitted, provided the original author(s) and the copyright owner(s) are credited and that the original publication in this journal is cited, in accordance with accepted academic practice. No use, distribution or reproduction is permitted which does not comply with these terms.
*Correspondence: Shuzhi Peng, psz1994921@163.com
†These authors have contributed equally to this work
Disclaimer
All claims expressed in this article are solely those of the authors and do not necessarily represent those of their affiliated organizations, or those of the publisher, the editors and the reviewers. Any product that may be evaluated in this article or claim that may be made by its manufacturer is not guaranteed or endorsed by the publisher.