 Chengfu Yu
 Xiangxuan Kong
 Weijie Yu1
 Xingcan Ni
- 1Department of Psychology/Research Center of Adolescent Psychology and Behavior, School of Education, Guangzhou University, Guangzhou, Guangdong, China
- 2School of Psychology, South China Normal University, Guangzhou, Guangdong, China
Introduction: Depression is highly prevalent among college students, and accurately identifying risk factors is essential for timely intervention. Given the limitations of traditional linear models in managing high-dimensional data, this study employed machine learning techniques to predict depressive symptoms.
Method: Data were collected from 1,635 Chinese college students and included 38 sociodemographic, psychological, and social variables. Four machine- learning algorithms, Random Forest, XGBoost, LightGBM, and Support Vector Machine, were evaluated.
Results: Results showed that the Random Forest model achieved the highest discriminant performance with an AUC of 0.87 and an accuracy of 0.79, and identified key predictors such as sleep disturbance, perceived stress, experiential avoidance, and self-criticism. SHapley Additive exPlanations analysis further revealed that deteriorating sleep quality and heightened stress levels significantly increased the risk of depressive symptoms.
Discussion: These findings validate the effectiveness of Random Forest in capturing complex data interactions and offer actionable insights for targeted mental health interventions. Future studies should improve generalizability by incorporating more diverse samples and physiological biomarkers.
Introduction
Depression is a significant psychological and public health concern, imposing a substantial burden on global health systems and contributing to considerable socioeconomic losses (1). Persistent depressive symptoms adversely affect individuals’ emotional well-being, social functioning, and cognitive development (2–4). Of further note, they can elevate the risk of progressing to a major depressive disorder (5) and developing suicidal ideation (6). Among college students, depressive symptoms are particularly prevalent. A recent study in China found that 24.5% of college students reported experiencing such symptoms (7). Given the high prevalence and potential long-term consequences, identifying the predictors of depressive symptoms in this population is essential to support early detection, effective monitoring, and timely intervention.
According to ecological systems theory (8), individual development is shaped by the dynamic interaction between the person and multiple surrounding social systems. Research has shown that the onset of depressive symptoms among college students is influenced by a wide range of factors. In addition to demographic characteristics (9), individual psychological and behavioral factors, encompassing emotional and cognitive dimensions, are significantly linked to depressive symptoms (10–13). Furthermore, susceptibility traits such as neuroticism (14) and various psychopathological symptoms, including alexithymia, Internet addiction, and mobile phone addiction, have also been identified as significant correlates (14–16). Family-level variables are particularly salient when considering the broader social-contextual environment of college students. Well-established risk factors include childhood trauma and maladaptive parenting styles (17, 18). Additionally, experiences of family dysfunction, cyberbullying victimization, and exposure to stressful life events are consistently linked to increased vulnerability to depressive symptoms in this population (18, 19).
Accurately identifying individuals with depressive symptoms remains a significant challenge, as precise prediction requires integrating a variety of individual and social-contextual factors. However, to ensure stability and reproducibility, traditional linear models must limit the number of predictors relative to the sample size, and the included variables should not be highly correlated. These constraints reduce the ability of traditional multiple regression models to effectively identify potential predictors, leading to lower predictive power (20). Machine learning (ML), a data-driven branch of artificial intelligence, can flexibly handle high-dimensional datasets and capture the simultaneous effects of all relevant predictors more accurately, often outperforming traditional stepwise analysis methods (21). Consequently, researchers have begun to apply ML techniques to the early identification of depression and depressive symptoms. For instance, Luo et al. (22) employed a Random Forest classifier to analyze factors associated with depression risk, including socioeconomic conditions, demographic characteristics, family history of mental health, behavioral and lifestyle factors, and physical and mental health indicators. They found that psychological factors, such as suicidal ideation, anxiety, and sleep quality, showed the strongest associations. Gohari et al. (9) likewise used a Random Forest algorithm to predict depression among Canadian adolescents, identifying key predictors such as home life, school connectedness, mental health measures (anxiety symptoms, emotional dysregulation, and flourishing), gender, and sleep duration. However, these studies primarily focused on predicators from limited domains. Furthermore, although different ML algorithms offer distinct strengths, most research to date has relied on a single algorithm. Therefore, it is necessary to compare multiple ML models to develop the most effective approach for predicting depressive symptoms among college students.
In summary, this study considers a range of sociodemographic, individual (including personal traits, psychopathological symptoms, and emotional, cognitive, and behavioral factors), and social contextual variables, aiming to develop an optimal model for predicting depressive symptoms among college students by applying and comparing multiple advanced ML algorithms. Furthermore, this study aims to accurately identify key risk and protective factors that significantly influence depressive symptoms in this population. These findings may offer a more precise and accessible method for predicting depressive symptoms, enabling schools, parents, and healthcare professionals to support early detection and implement targeted interventions.
Method
Participants and procedure
A total of 2115 students from six Chinese universities in central and south China participated in the study. All data were collected offline using self-report questionnaires. The questionnaires were distributed in university classrooms by graduate students and psychology professors, accompanied by identical verbal and written instructions. After excluding questionnaires with non-standard responses (e.g., implausible age values and missing critical data such as demographics), 1,635 valid questionnaires were retained for analysis. The sample consisted of 558 males (34.12%) and 1,077 females (65.88%) aged 17–24 years (Mage = 18.93 years, SD = 1.23 years).
Measure
Depressive symptoms
The Patient Health Questionnaire-9 (PHQ-9) (23) was used to assess depressive symptoms. The PHQ-9 was originally measured from 0 (not at all) to 3 (nearly every day) with a possible total score of 0–27. Since most of our scales here start with 1, and to be as consistent as possible, the PHQ-9 in this article uses a four-point scoring system ranging from 1 (not at all) to 4 (nearly every day), with total scores ranging from 9 to 36. Scores of 14–18 indicate mild depression, 19–23 indicate moderate depression, 24–28 denote moderate-to-severe depression, and 29–36 suggest severe depression. An example item is “Feeling down, depressed, or hopeless.” In this study, scores above 14 were considered indicative of depressive symptoms. The Cronbach’s alpha for the scale in this sample was 0.88.
Socio-demographic variables
Participants reported sociodemographic information, including age, gender, only child status, place of origin, family economic situation, and family structure. These variables were included as potential predictors in the analysis.
Psychological, psychiatric, and social factors
This dataset included the following correlates of depressive symptoms: alexithymia (24), sleep disturbance (25), suicidal behaviors (26), self-injury (27), smartphone addiction (28), social media addiction (29), self-control (30, 31), emotion regulation (32, 33), growth mindset (34), self-compassion (35, 36), meaning in life (37), fear of negative evaluation (38, 39), self-criticism (40), basic psychological needs frustration (41), impulsivity (30, 42), experiential avoidance (43, 44), intolerance of uncertainty (45, 46), Big Five personality traits (47), childhood trauma (48), bullying victimization (49), parental emotion socialization (50), and perceived stress (51, 52). Additional details on the assessment of each variable are provided in the Supplementary Text.
Statistical analysis
Descriptive statistical analyses were first conducted using SPSS 26.0. ML modeling was then performed using the Scikit-learn library in Python (53). To enhance the generalization ability of the models, data preprocessing was conducted using the StandardScaler method, which normalized all features to have a mean of zero and a standard deviation of one. This approach reduced data bias arising from differences in measurement scales. The outcome variable was whether participants reported mild to severe depressive symptoms. We used an independent-samples t-test and a chi-square test for feature selection. Thirty-eight variables associated with depressive symptoms were selected. These thirty-eight variables were used as predictors, including sociodemographic characteristics, emotional disorder states, and coping styles.
Four ML algorithms were employed to construct separate risk prediction models: Random Forest, eXtreme Gradient Boosting (XGBoost), the Light Gradient Boosting Machine (LightGBM), and Support Vector Machine (SVM) (54). Each algorithm was selected for its ability to handle imbalanced data and enhance model generalizability. Random Forest improves model stability and predictive accuracy by aggregating multiple decision trees and randomly selecting feature subsets at each split, thereby reducing the risk of overfitting (55). XGBoost, based on gradient-boosted decision trees, optimizes its objective function with regularization terms, demonstrating high efficiency and accuracy in handling complex datasets (56). LightGBM, similar to XGBoost, adopts a leaf-wise splitting strategy to improve computational efficiency, although it may be more prone to overfitting in certain scenarios (57). SVM identifies the optimal hyperplane for classification and demonstrates strong generalization capabilities, particularly in high-dimensional and small-sample datasets (58). To evaluate model stability and reliability, this study employed 10-fold cross-validation to minimize sample bias (59, 60). For each fold following data partitioning into training and test subsets, SMOTE was employed on the training data. The SMOTE object, initialized with a random state, used the “fit_resample” method to synthesize minority class instances, creating a balanced training set. This augmented dataset was subsequently used to train the Random Forest classifier (61). By generating synthetic samples for underrepresented classes, SMOTE enhances classifier efficacy, especially in classification tasks (62). The models were then trained on each cross-validation training set and evaluated on the corresponding validation set. Multiple performance metrics were calculated (63), including precision, F1-score, accuracy, recall, area under the receiver operating characteristic (ROC) curve (AUC), and the average of each metric across all folds.
To identify the most critical features for depression prediction, this study analyzed feature importance within the ML models and visualized the results using horizontal bar charts. In addition, SHapley Additive exPlanations (SHAP) values were used as a feature importance metric to interpret model predictions (64). As model complexity increases, particularly in ensemble and deep learning models, prediction accuracy tends to improve while interpretability declines. SHAP values, derived from Shapley’s value theory in game theory, quantify feature importance by computing the average marginal contribution of each feature to a given prediction. These values satisfy key properties such as fairness, uniqueness, and efficiency and provide both baseline and individual feature contributions for each prediction. The sum of the feature contributions equals the difference between the model output and the baseline, allowing users to understand the model’s logic and the actual impact of each input variable (65). Accordingly, this study calculated and visualized SHAP values for all models.
Results
Descriptive statistics
The study analyzed 1,635 valid responses, with 827 participants (50.5%) meeting criteria for depressive symptoms. Table 1 presents descriptive statistics and general characteristics of the study variables. Statistical analyses revealed significant differences in nearly all measured variables between participants exhibiting depressive symptoms and those without, except for gender, only child status, and family structure (see Tables 1, 2).
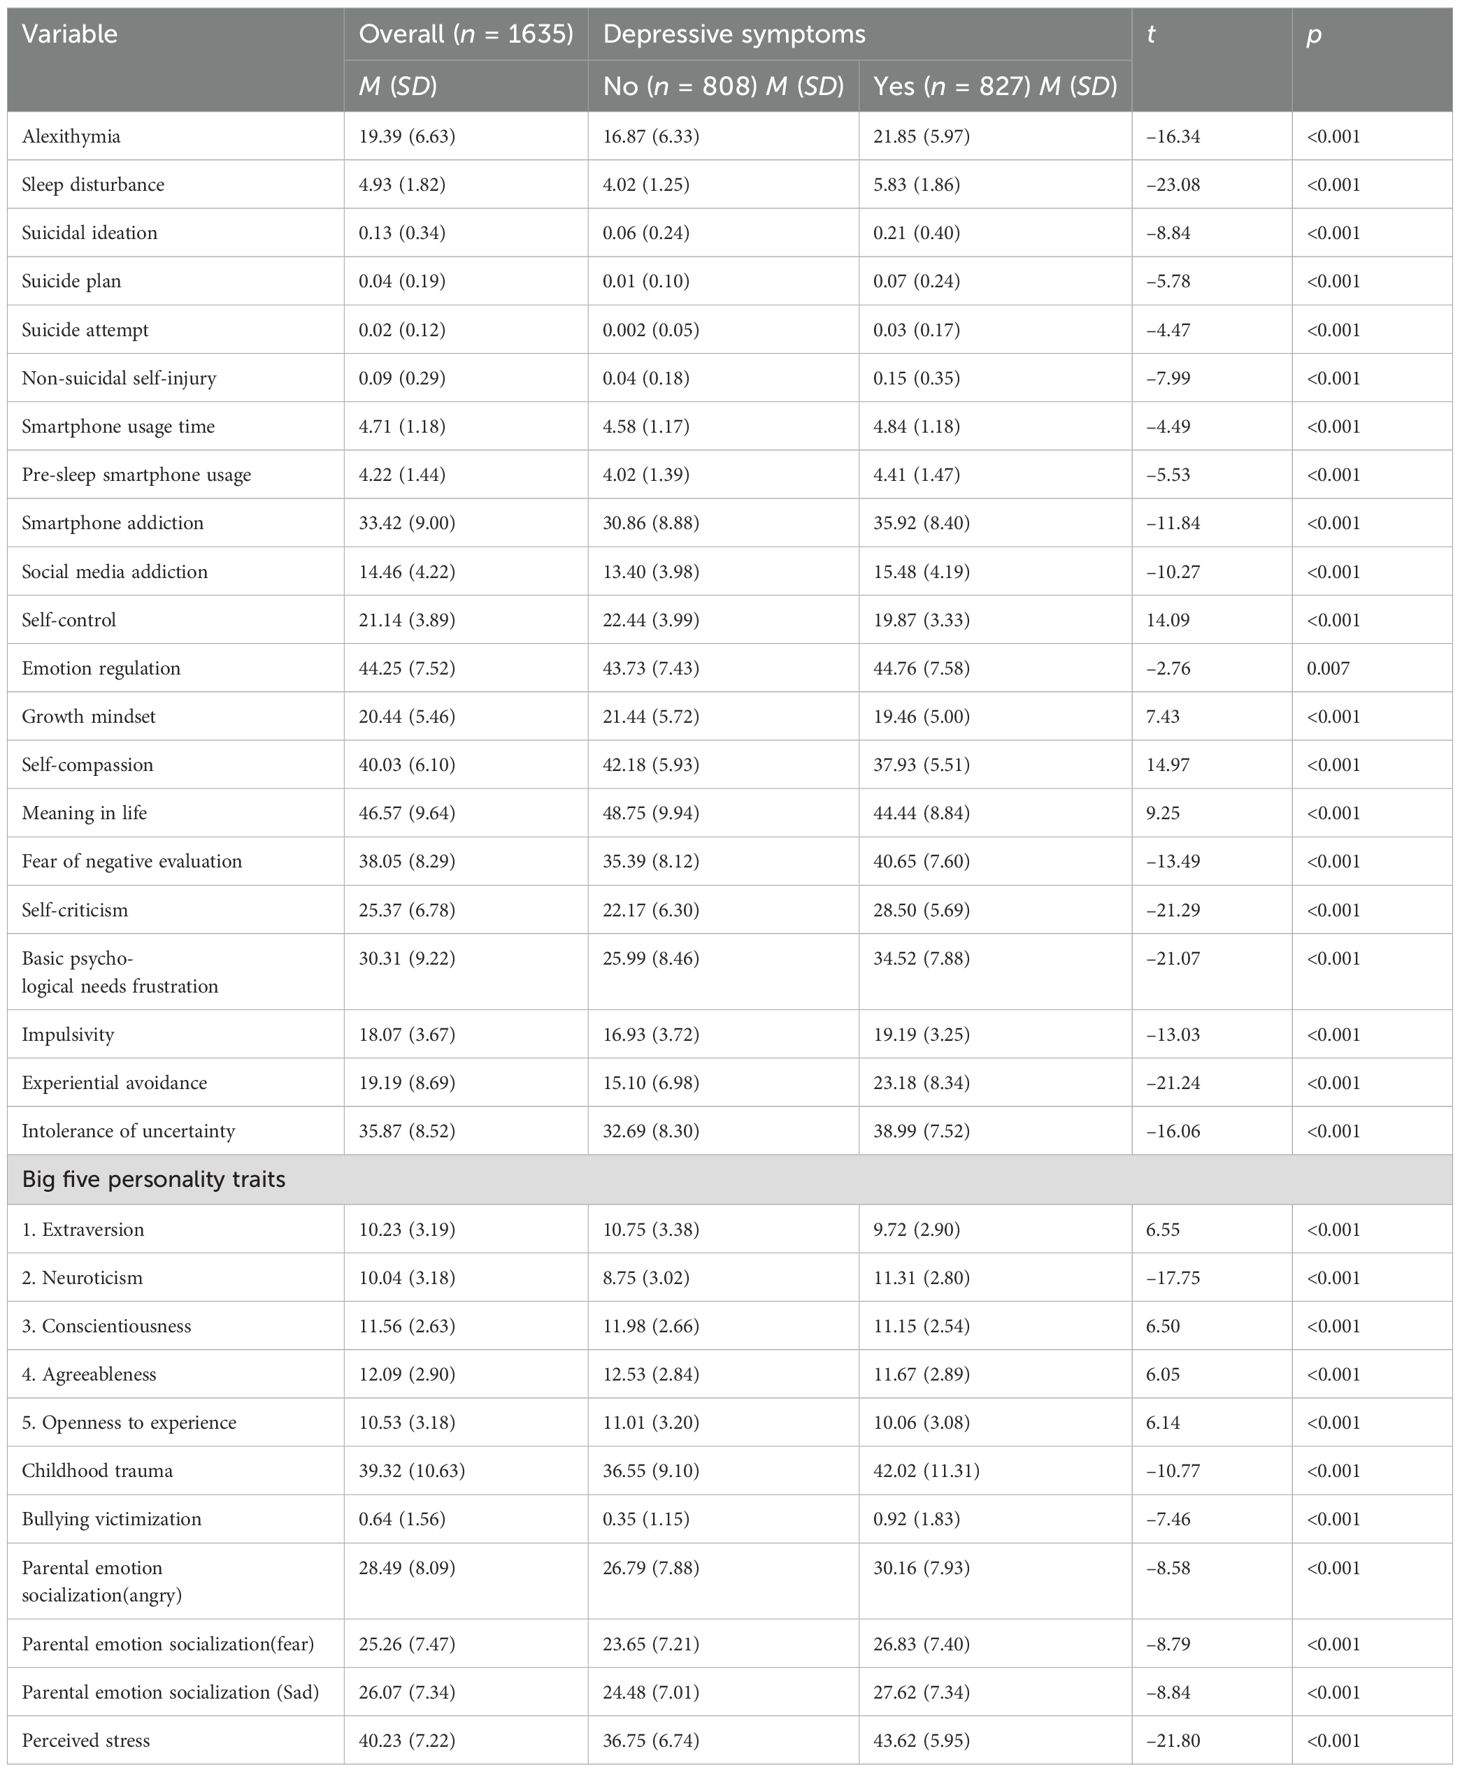
Table 1. Descriptive statistics and general characteristics of the study variables.
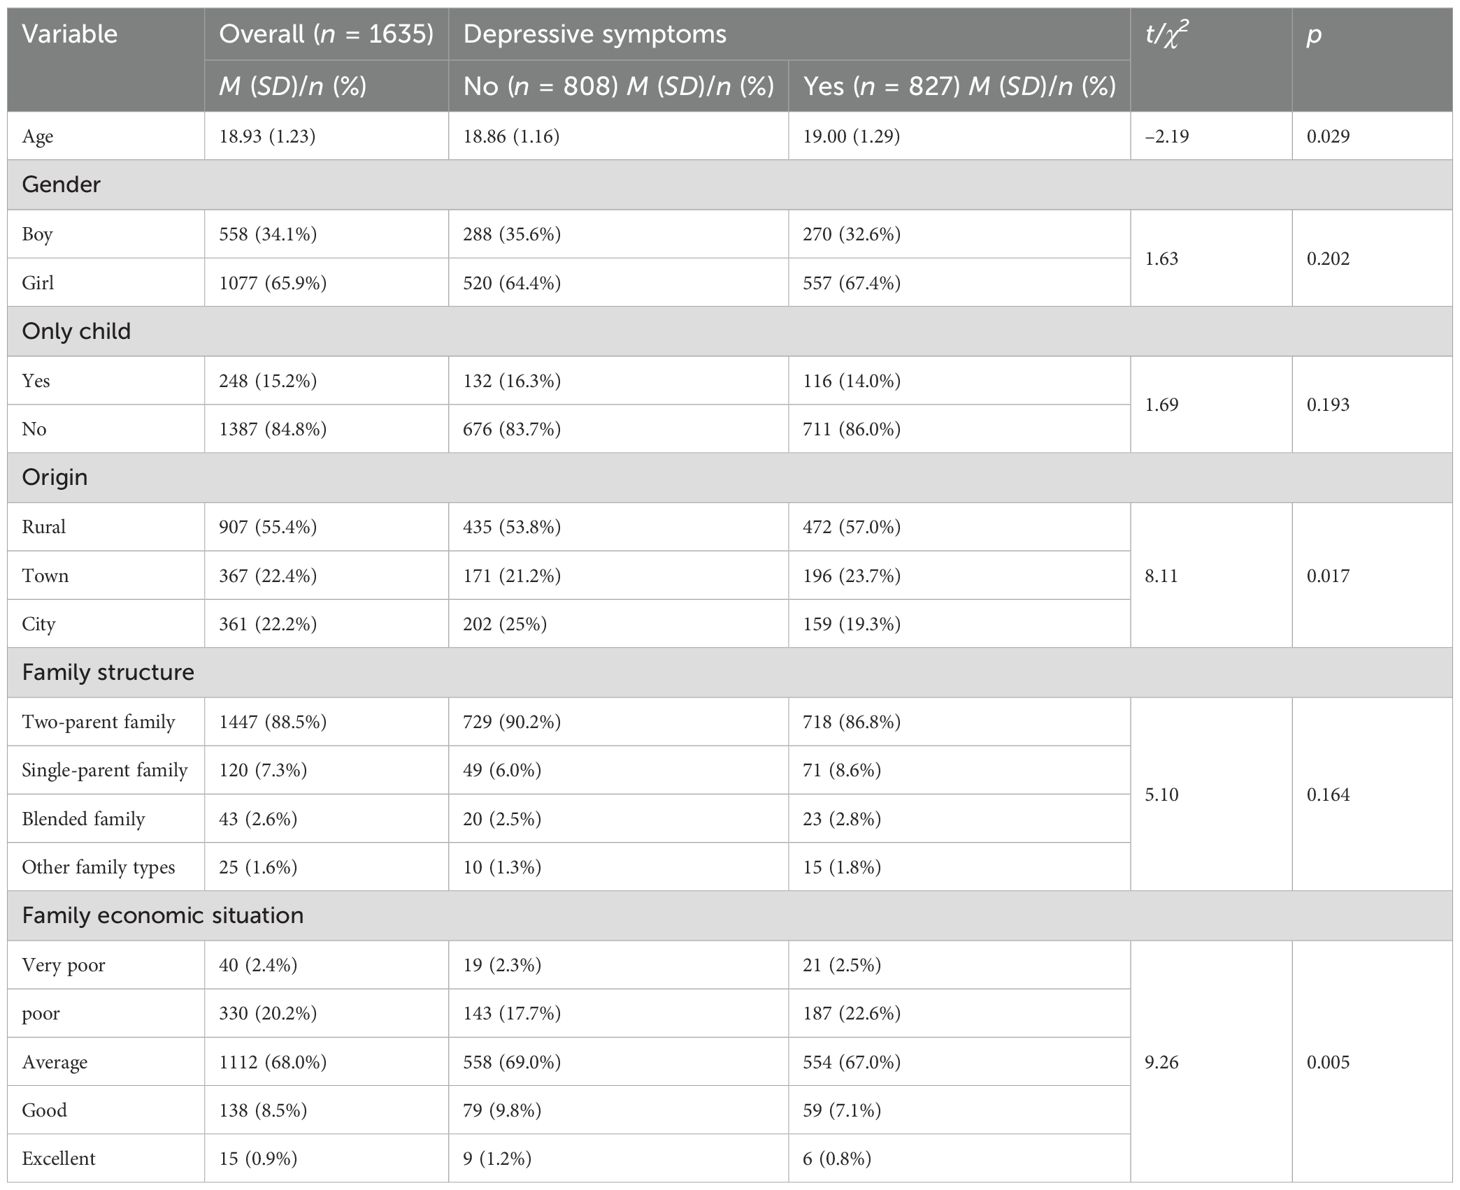
Table 2. Descriptive statistics and general characteristics for the socio-demographic variables.
Model performance
The ROC curve is a graphical tool used to evaluate the performance of binary classifiers. It illustrates classifier performance across all possible thresholds, allowing assessment of the model’s ability to distinguish between classes regardless of a specific cutoff point. A curve closer to the top-left of the chart indicates better classification performance. A higher AUC value reflects a stronger separation between positive and negative classes. Figure 1 presents the ROC curves for all four models, each achieving an AUC above 85%, demonstrating strong predictive performance. Figure 2 illustrates the performance comparison of the four models across each fold, providing a comprehensive view of their respective metrics.
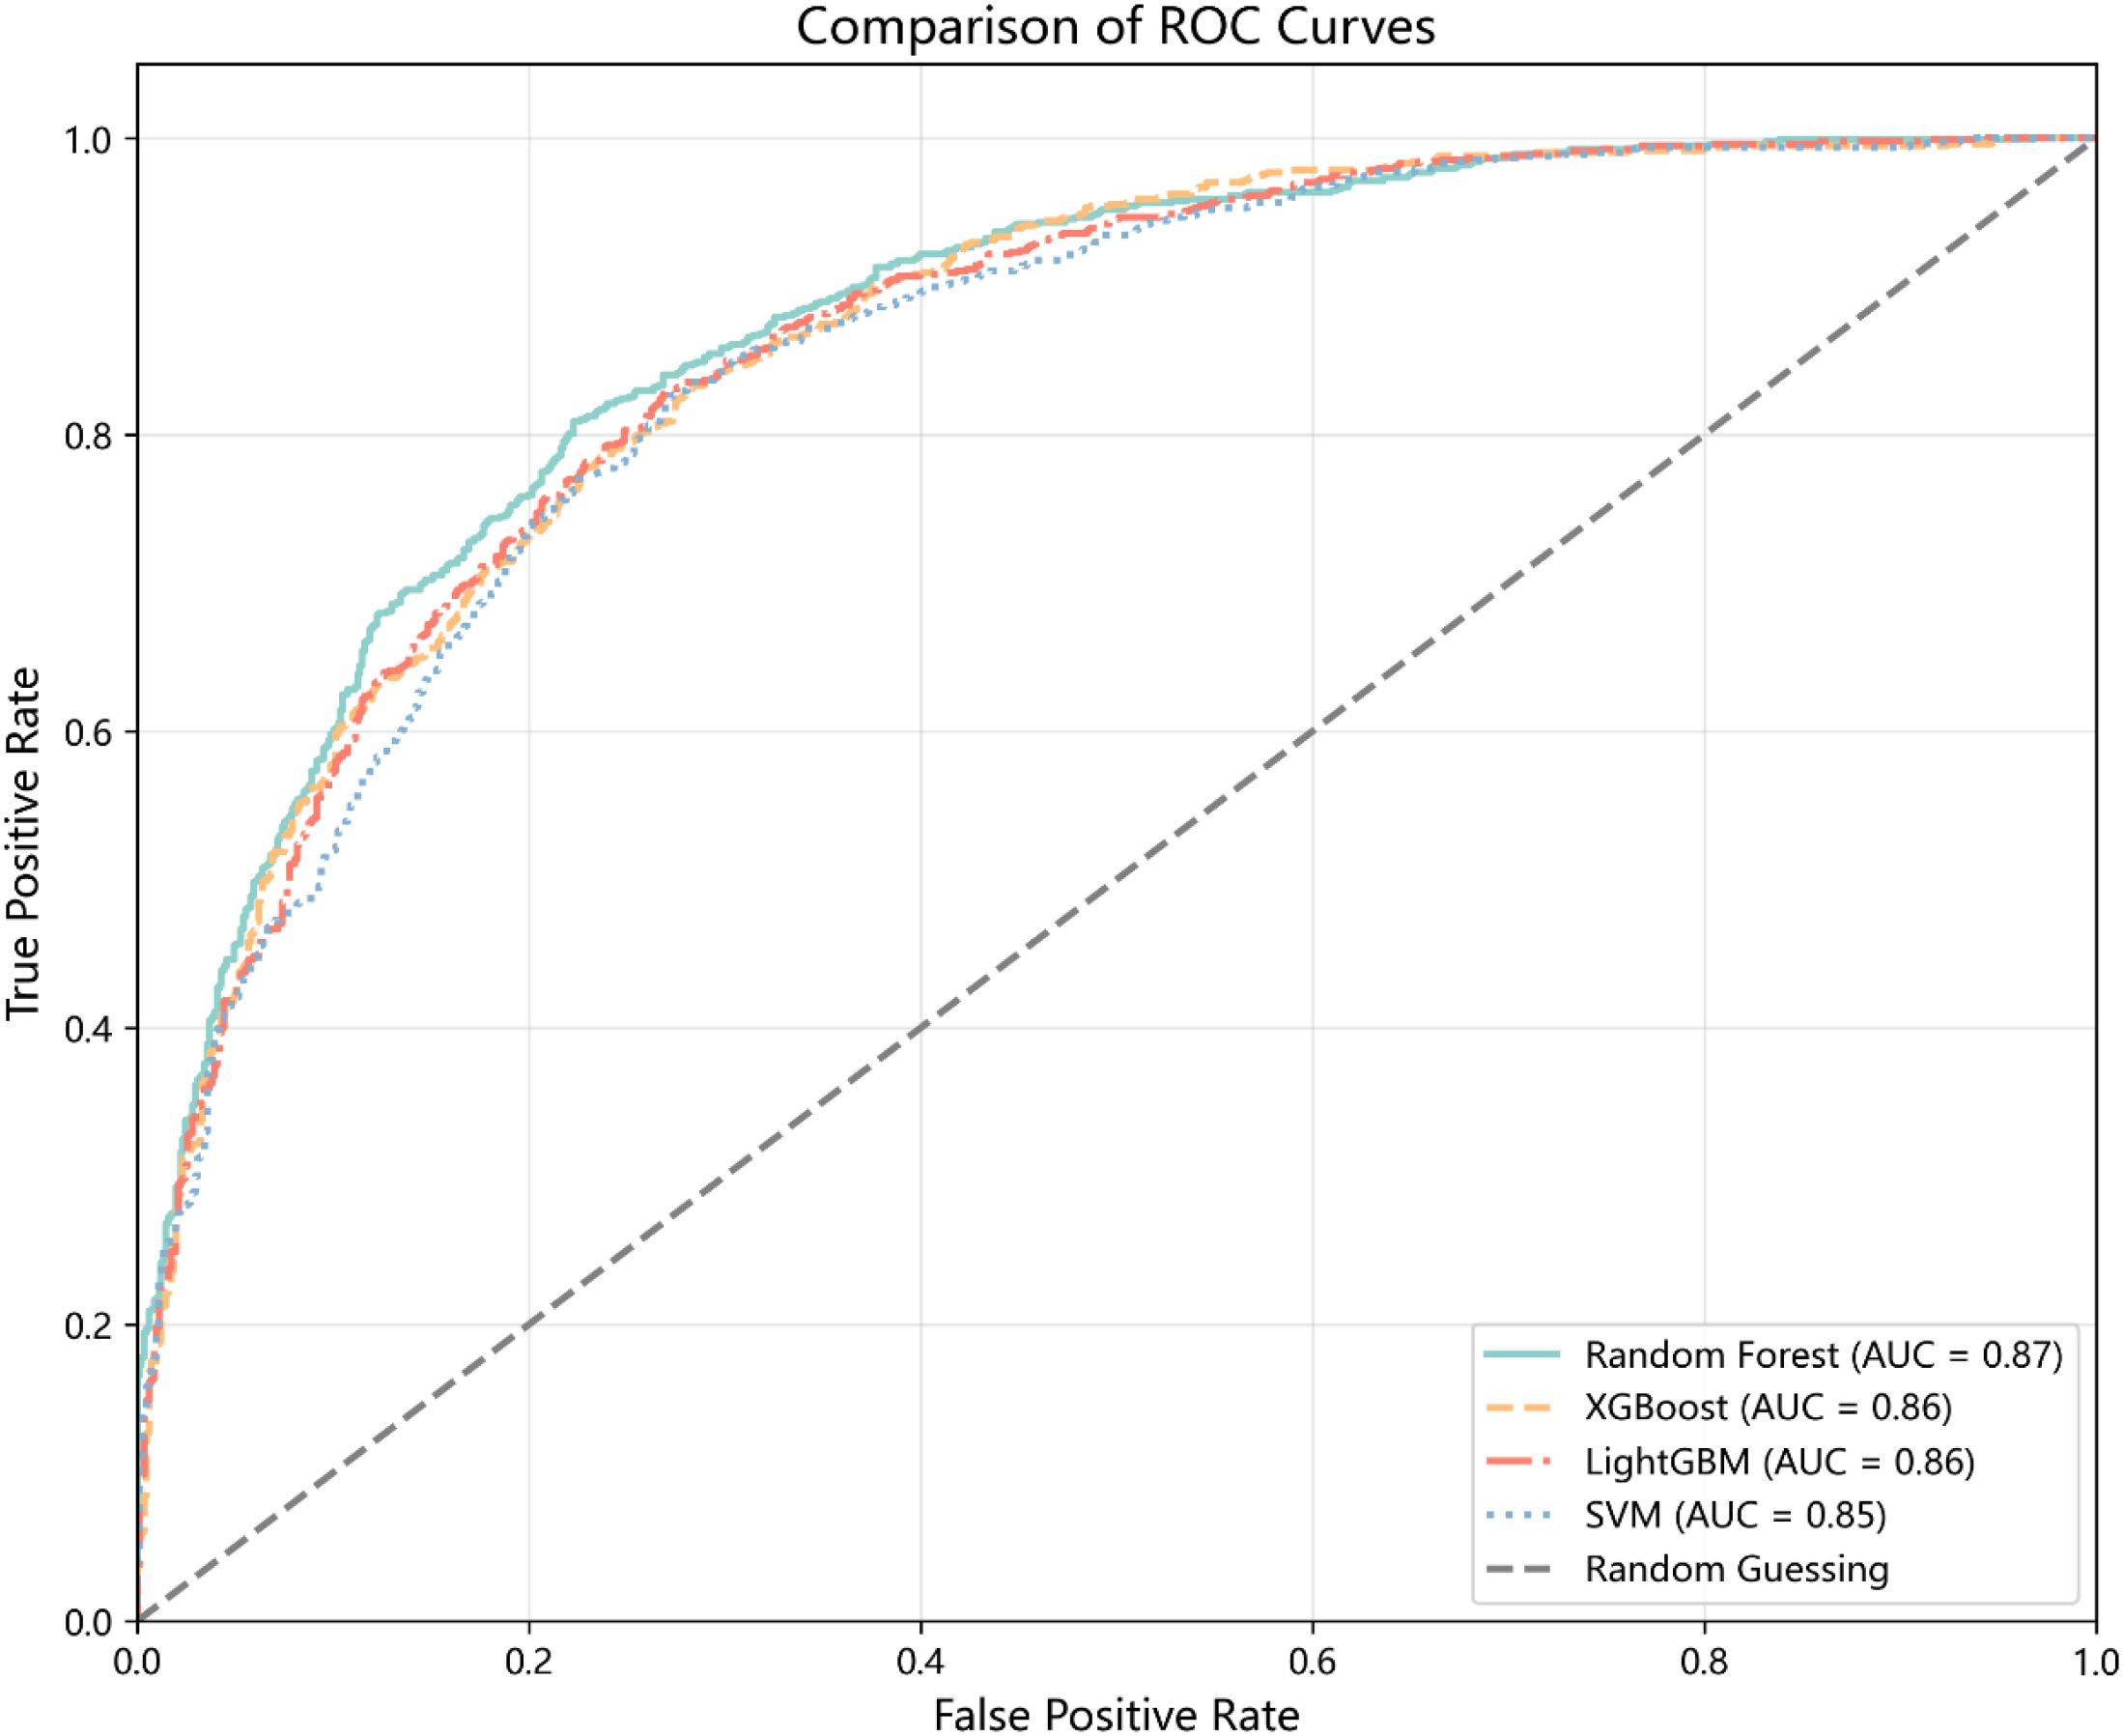
Figure 1. ROC curves for all models.
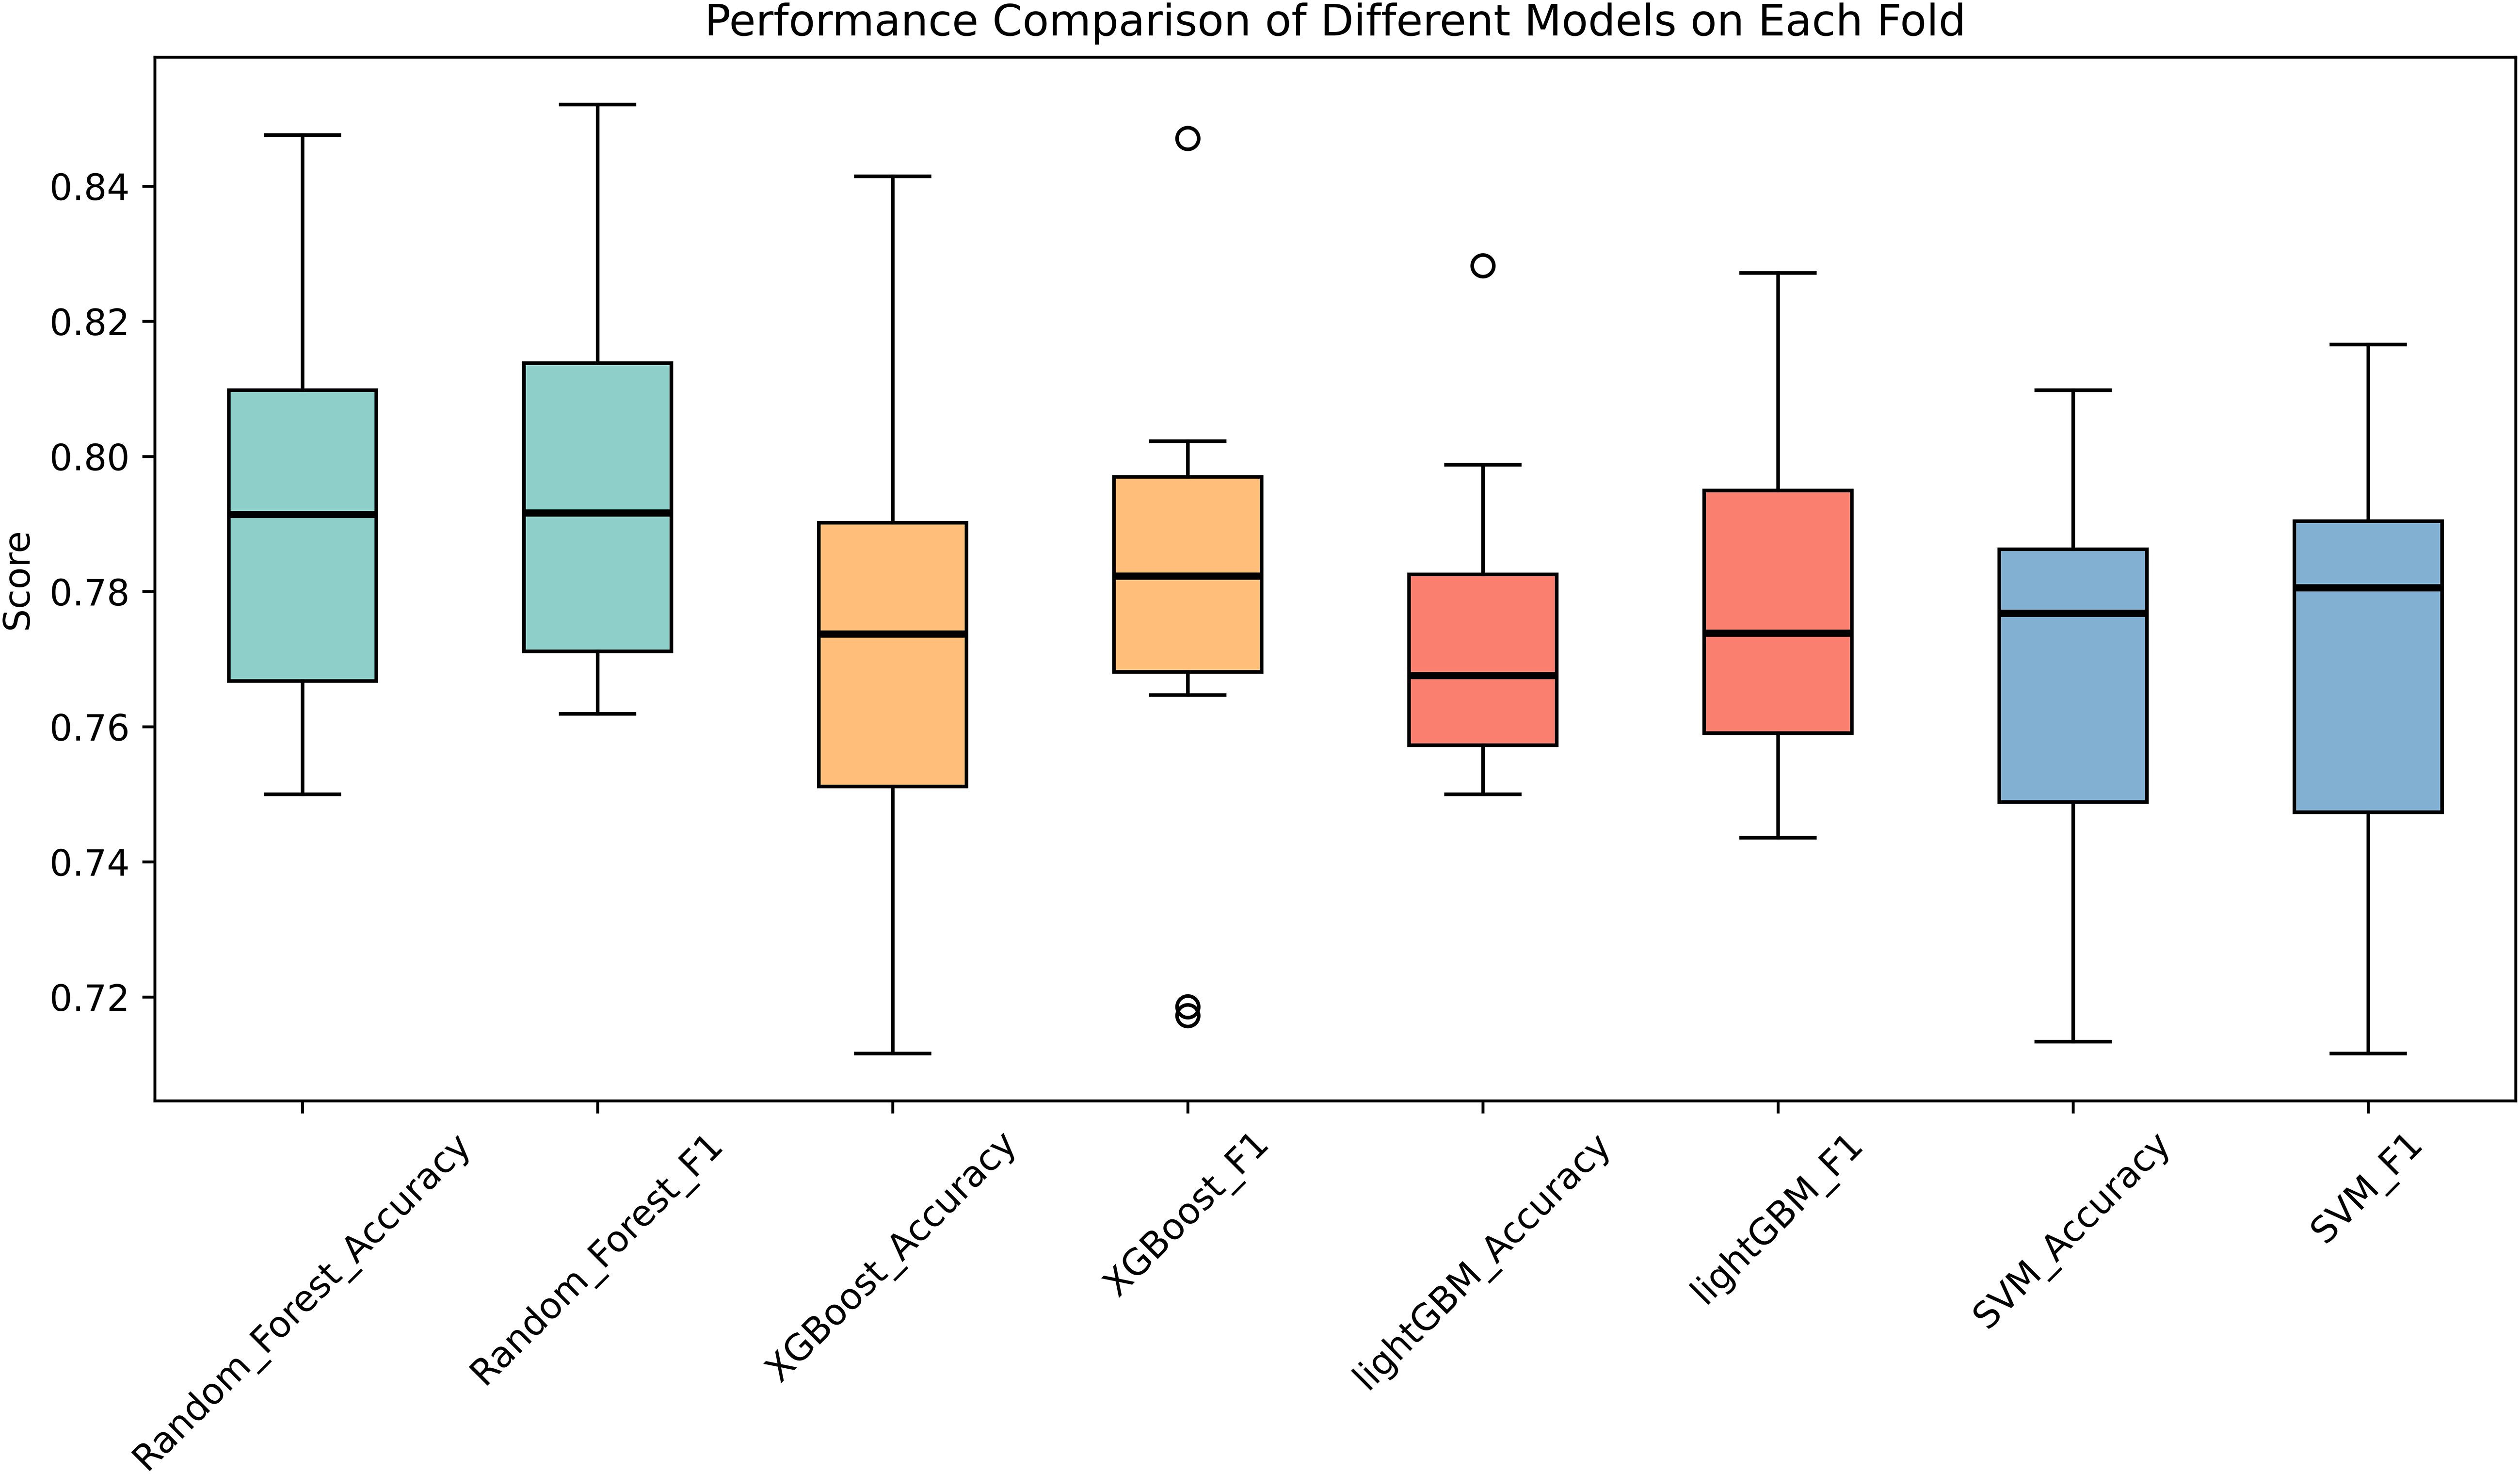
Figure 2. The performance comparison of the four models across each fold.
Table 3 presents the AUC score, accuracy, precision, and specificity of each ML model across all folds of cross-validation. The Random Forest model outperformed the others across all metrics.

Table 3. Machine learning models performances for depressive symptoms.
Variable importance
To visualize the impact of each variable on depressive symptoms more intuitively, we employed the built-in feature importance method to interpret the variable importance in the best-performing Random Forest model. The resulting feature importance plot (Figure 3) displays the top 20 most important variables. The most important predictor was sleep disturbance (importance score = 0.17), followed by perceived stress (importance score = 0.11) and experiential avoidance (importance score = 0.09).
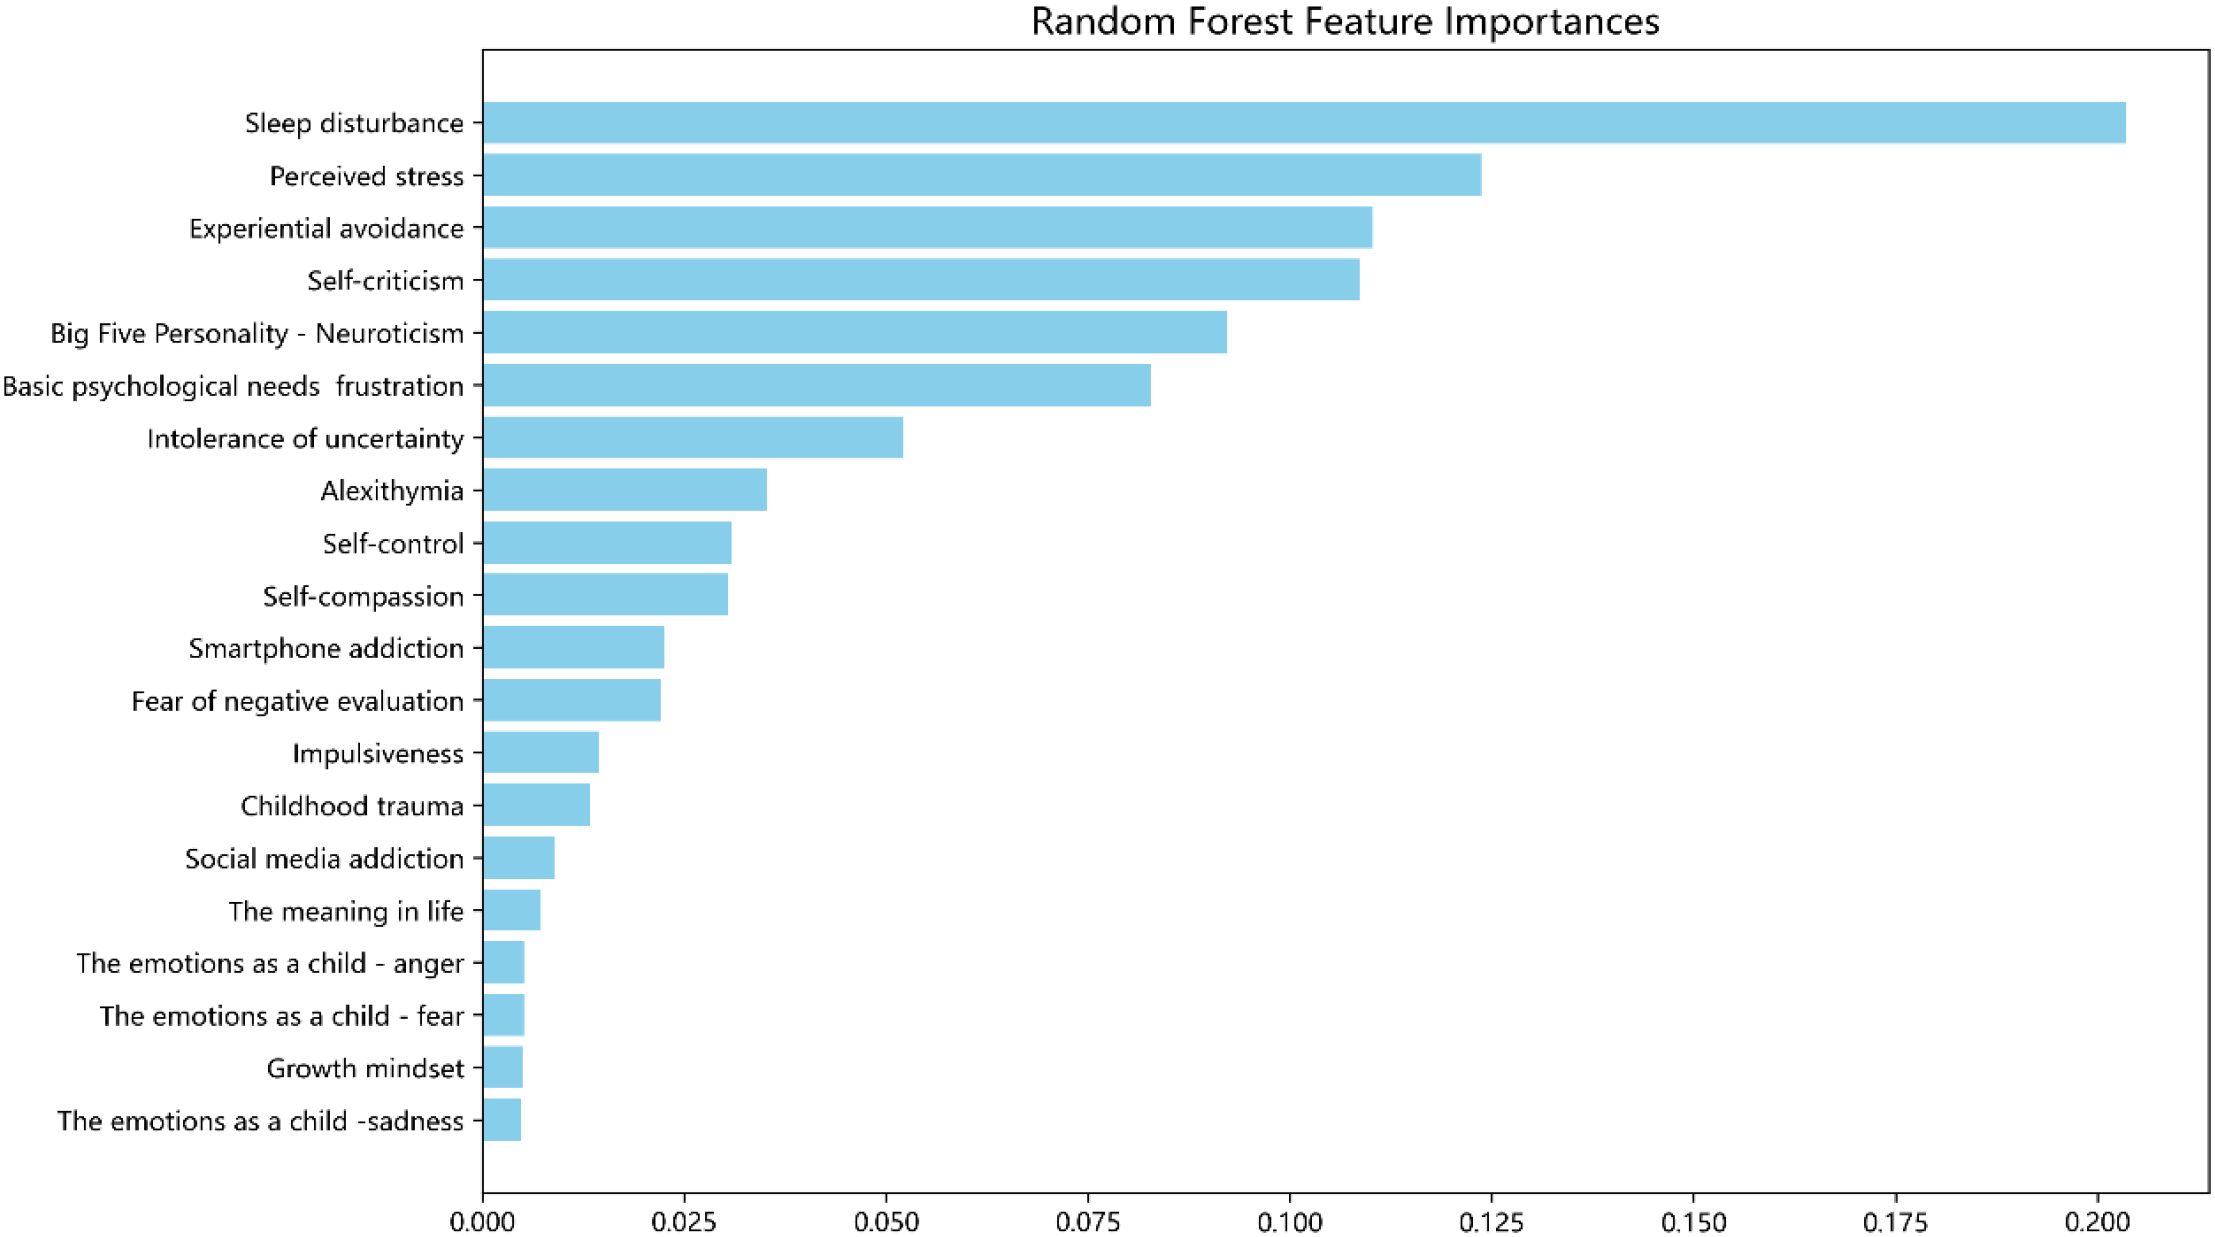
Figure 3. Feature importance plot of the Random Forest, which depicts the importance of each variate in the development of the model.
To further analyze the contribution of each feature to depressive symptom prediction, SHAP analysis was conducted on the best-performing Random Forest model, with the results shown in Figure 4. In this visualization, higher SHAP values indicate greater impact on the model’s predictions. Each point represents a subject’s feature value, with color indicating value level (red: higher, bule: lower). Points are stacked vertically to indicate data density. Features with high positive SHAP values substantially increase the predicted probability of depressive symptoms, while features with negative SHAP values may reduce it. This visualization facilitates the interpretation of both the individual contribution and interactive role of each predictor within the model. Sleep disturbance had the greatest influence, followed by perceived stress, experiential avoidance, self-criticism, and frustration of basic psychological needs, with predictive influence progressively declining thereafter.
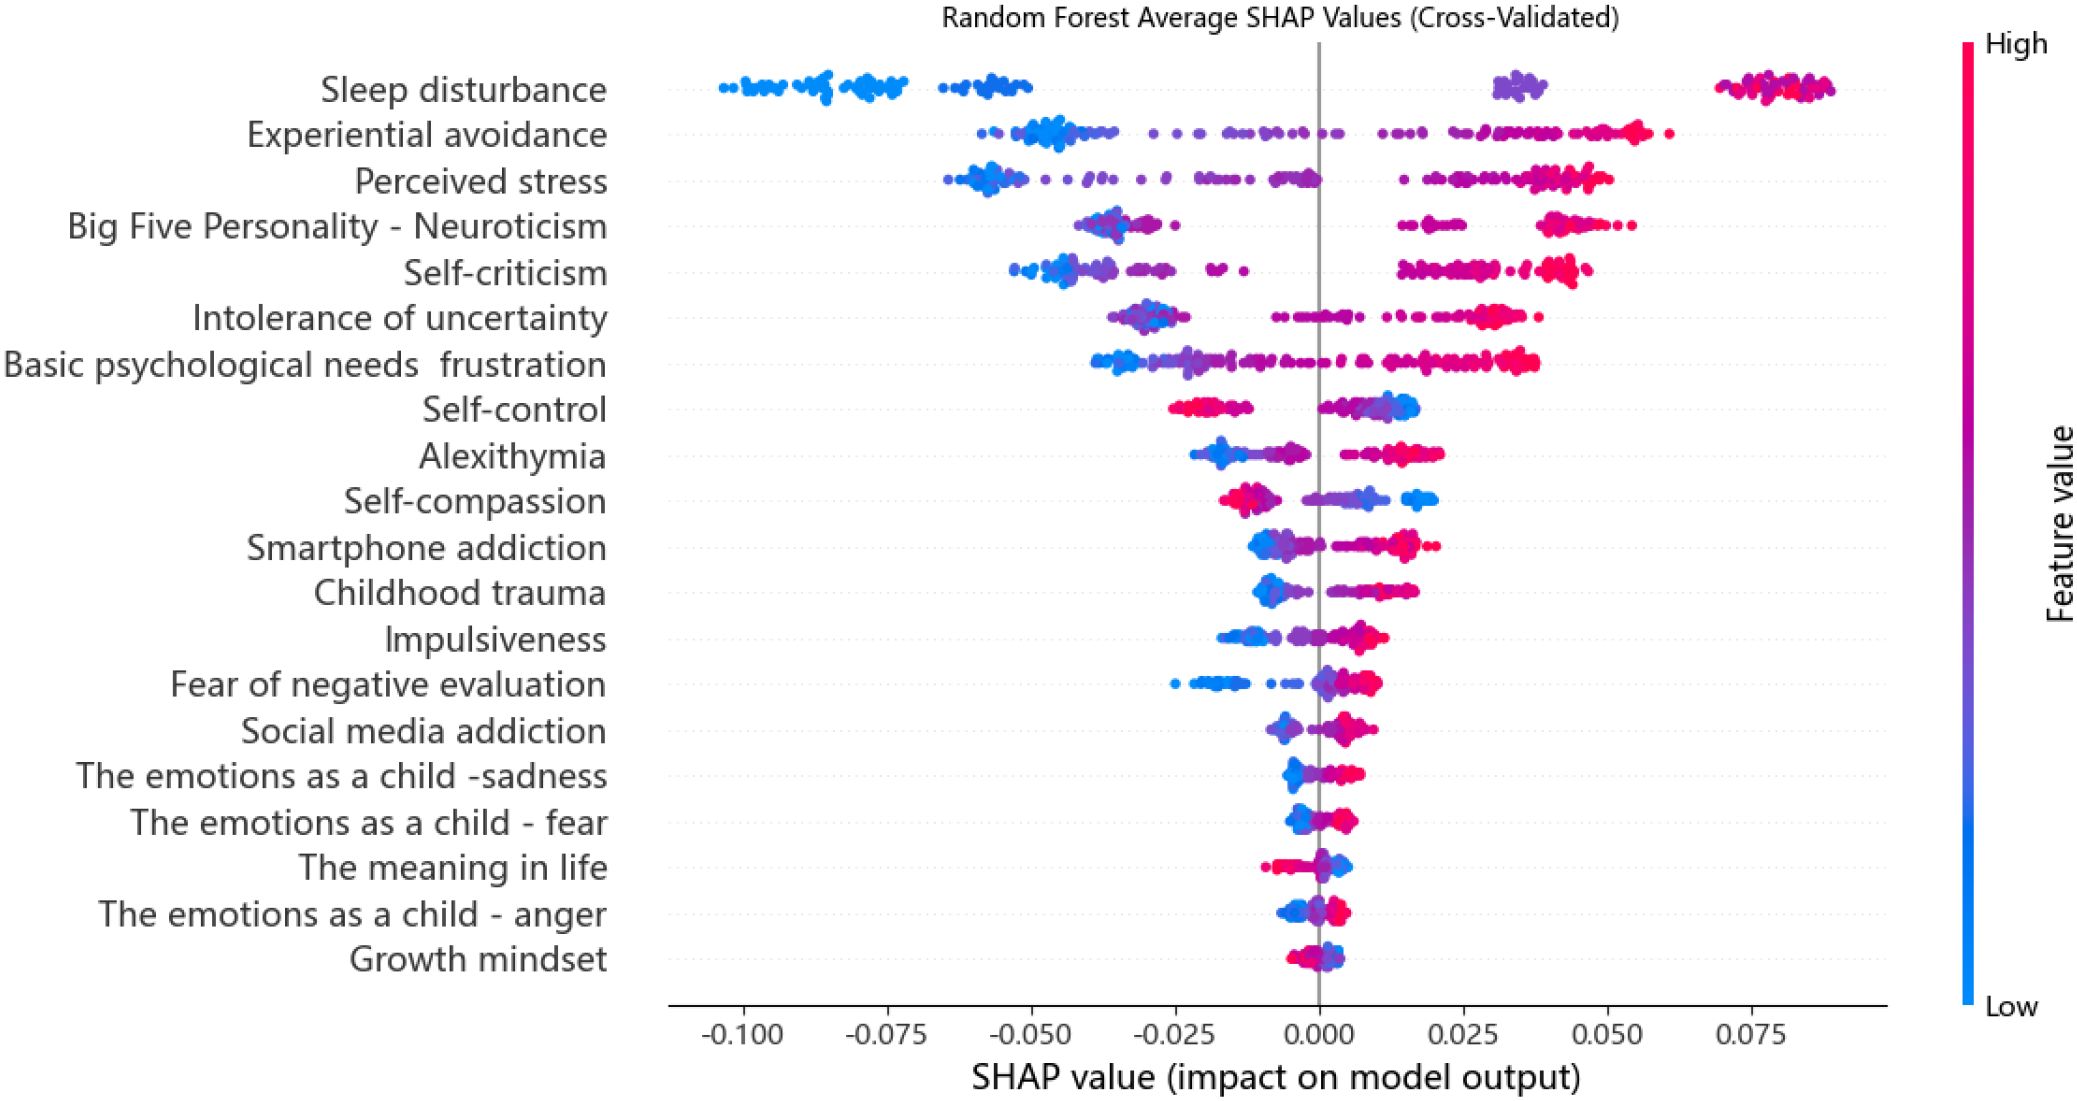
Figure 4. The summary plot of SHAP values for each feature of the Random Forest model.
Given the high predictive value of sleep disturbance shown in both the feature importance and SHAP value plots, we conducted a SHAP scatter plot analysis to further examine this relationship. Figure 5 illustrates the association between the actual values of the sleep disturbance feature and their corresponding SHAP values. The plot shows that as sleep disturbance scores increase, SHAP values rise steadily within the range of 0 to 6. This suggests that greater sleep disturbance contributes positively to the model’s prediction of depressive symptoms. Between values of 6 and 12, the upward trend continues but becomes more variable, indicating possible instability or the influence of additional interacting factors at higher levels of sleep disturbance. Overall, sleep disturbance exerts a consistently positive effect on model predictions across its range, reinforcing its role as a key predictor of depressive symptoms.
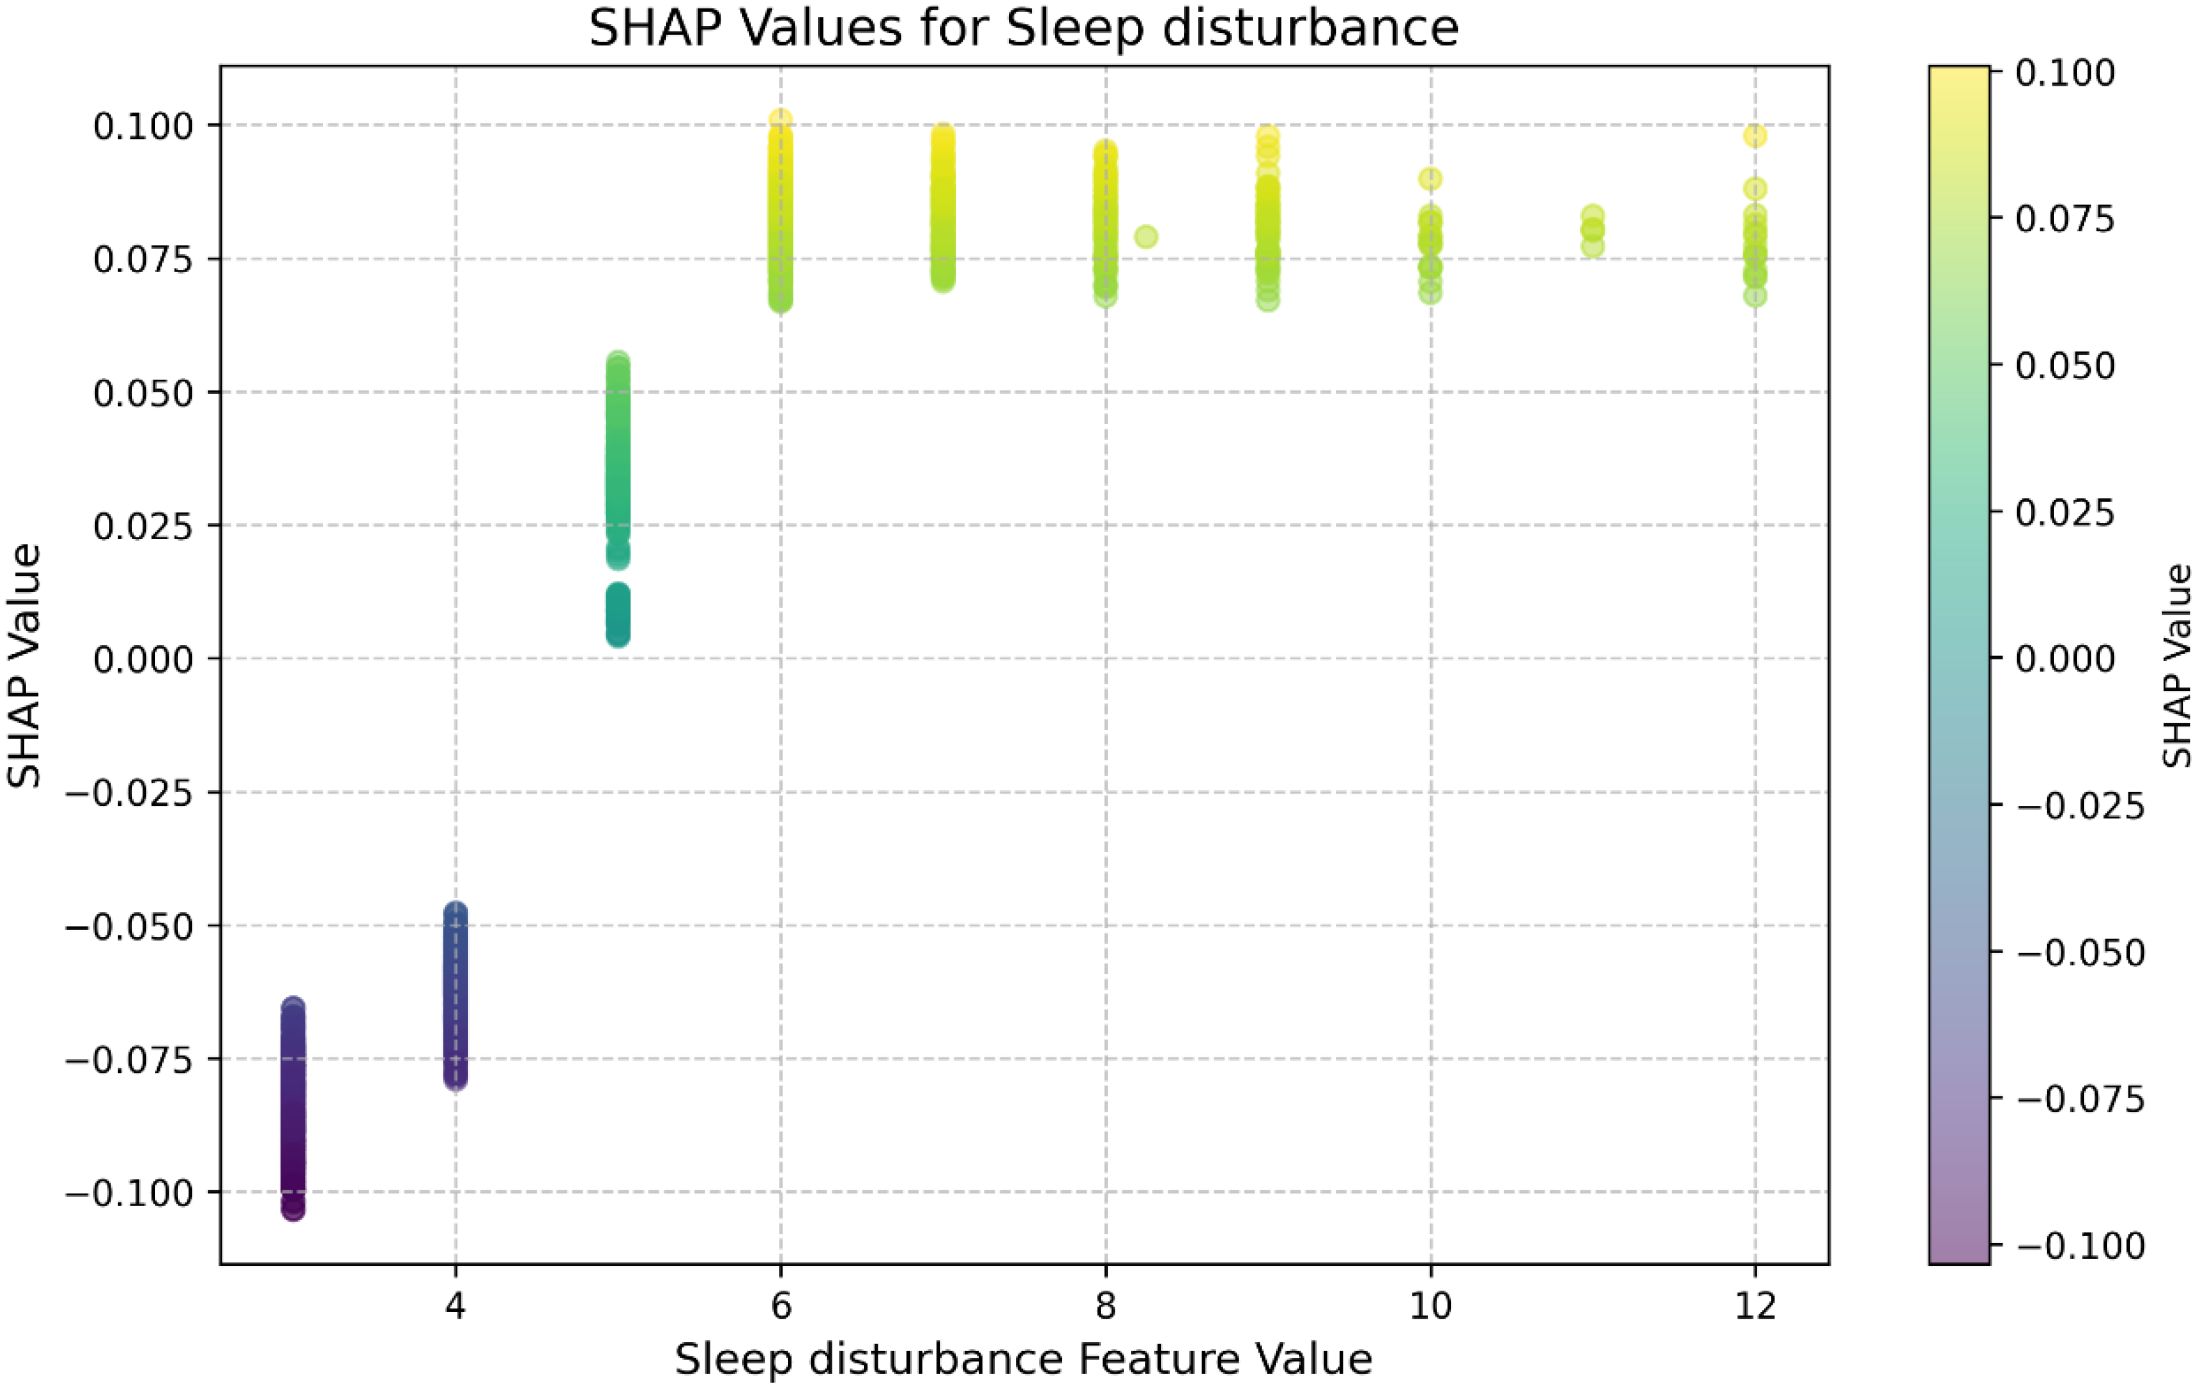
Figure 5. SHAP value plot of sleep disturbance varying with actual values.
Discussion
Prediction of depressive symptoms
In the current research, we developed and compared multiple ML models incorporating 38 psychosocial and demographic predictors to predict depressive symptoms among higher education students in China. Among the tested algorithms, the Random Forest model demonstrated superior performance, outperforming XGBoost, LightGBM, and SVM in terms of accuracy (0.7908), precision (0.7878), recall (0.8041), F1-score (0.7956), and AUC (0.8704). These results align with previous research (22), indicating that the model achieves high predictive accuracy and effectively identifies college students at elevated risk of depressive symptoms.
The superiority of the Random Forest model can be attributed to its unique learning mechanisms, which are well-suited to the complexity of the data used in this study. As an ensemble learning method, Random Forest enhances model stability and predictive accuracy by constructing multiple decision trees and aggregating their predictions through majority voting or averaging. This ensemble approach substantially reduces the risk of overfitting, a common limitation in traditional single-tree models. The dataset in this study included 38 predictive variables. Random Forest’s capacity to handle high-dimensional data and model complex feature interactions makes it particularly suitable for predicting depressive symptoms, which are influenced by numerous interrelated factors (66). Additionally, the algorithm introduces randomness during model construction by selecting a random subset of features at each split. This embedded feature selection not only improves computational efficiency but also helps reduce the impact of noisy variables (67).
In this study, although XGBoost and LightGBM are known for their effectiveness in handling imbalanced data and complex datasets, they underperformed compared to the Random Forest model. XGBoost, while efficient in large datasets, is sensitive to hyperparameter tuning and prone to overfitting in noisy data (56, 68). Similarly, LightGBM’s leaf-wise growth strategy improves computational efficiency but may lead to overfitting in smaller or imbalanced datasets (57). Although SVM is recognized for its generalization capability in high-dimensional, small-sample scenarios, it lagged behind Random Forest in terms of accuracy and AUC, likely due to its limited capacity to capture nonlinear relationships among predictors (58, 69).
Previous studies predicting depressive symptoms have rarely used cognitive and emotion-related variables (70, 71), but this study has used these variables, such as self-control, emotion regulation, meaning in life, growth mindset, Self-compassion, experience avoidance, and more. This gives us a glimpse into the mechanisms by which cognitive and emotional factors contribute to depressive symptoms. Moreover, while previous research has often focused on predicting depressive symptoms in children and adolescents (72, 73), this article focuses specifically on the university student population – a group highly susceptible to depressive symptoms – yielding valuable insights.
Variable importance
Model interpretation was performed using the SHAP approach. SHAP is a personalized feature attribution method that strictly satisfies the Consistency axiom. This property is a core strength of its mathematical foundation (Shapley values from game theory). When a feature’s contribution to model prediction increases, its SHAP value must increase (or remain unchanged), ensuring no contradictory attributions (74). Therefore, the interpretability of our machine learning models meets the requirements for consistency. SHAP analysis reveals that predictors spanning multiple domains significantly contribute to forecasting depressive symptoms in Chinese university students, aligning with ecological systems theory (8).
First, the results suggest sleep disturbance emerged as the most influential contributor. This finding corroborates earlier studies that have found a close connection between sleep disturbances and depressive symptoms in university populations (75, 76). Shorter sleep duration exhibits a relationship with a higher risk of developing depressive disorders (77), and inadequate sleep hygiene may contribute to the development of depressive symptoms (78). Underlying these associations is the potential for neural dysregulation. Specifically, inadequate sleep disrupts dopamine activity in the limbic system and striatum, compromising the brain’s reward circuitry and increasing susceptibility to mental illness (79, 80). Additionally, substantial evidence suggests that sleep problems during adolescence can elevate depressive symptoms by impairing both cognitive performance and emotion regulation (81–83).
In addition, this study found that perceived stress was among the top four predictors of depressive symptoms. The present findings resonate with established research. For example, Leung et al. (84) identified perceived stress as a robust predictor of adolescent depression. Parallel results emerged in a Chinese student sample, where greater perceived stress predicted more severe depressive symptoms (85). We can explain it theoretically. Firstly, according to the stress–reward–mentalizing model of depression, the disorder can be conceptualized as a developmental, stress-related condition. When combined with heightened stress sensitivity, elevated stress significantly increases vulnerability to depressive symptoms (86). Additionally, evidence suggests that recent life stress may exacerbate underlying vulnerabilities in HPA axis functioning, with these risk factors potentially interacting synergistically to increase the likelihood of adolescent depression (87).
Experiential avoidance also emerges as a risk factor for depressive symptoms among college students in this study, consistent with findings from Núñez et al. (88). Experiential avoidance manifests as inflexible cognitive-behavioral patterns aimed at suppressing distressing intrapsychic content (89). Research has shown that experiential avoidance is a core transdiagnostic process underlying a range of psychological disorders, including depression, anxiety, and post-traumatic stress disorder (90). College students who engage in experiential avoidance are often unwilling to experience unpleasant emotions or thoughts and may actively suppress or avoid them. Paradoxically, attempts to avoid depressive thoughts can heighten their salience, ultimately intensifying depressive emotional experiences (91).
Self-criticism emerged as a key predictor of depressive symptoms in the current research. Cumulative research findings establish that self-criticism contributes to increased levels of depression and functions as both a risk factor and a perpetuating factor for depressive disorders (92, 93). Blatt (94) theorized that individuals with pronounced self-critical tendencies exhibit “intense feelings of inferiority, guilt, and worthlessness and by a sense that one has failed to live up to expectations and standards”. Research further suggests that individuals who frequently engage in self-critical thought patterns show greater susceptibility to fall into cycles of rumination and self-doubt, perpetuating ongoing emotional distress (95). These cognitive-emotional patterns are strongly associated with heightened vulnerability to depressive symptoms (94). Among university students, self-criticism often arises from the internalized pressure to meet excessively high personal expectations, thereby increasing their susceptibility to depression and related mental health concerns (96).
Strengths, limitations, and future directions
This study has several limitations. First, the sample size was relatively small; expanding the sample in future research would improve the model’s generalizability. Second, participants were drawn from only six universities located in central and southern China, which may not fully capture regional differences, particularly those between urban and rural areas or between eastern and western regions of the country. For example, disparities in access to mental health resources among rural students may influence the prevalence or severity of depressive symptoms. Third, the current models included only sociodemographic and psychosocial variables, lacking objective physiological indicators such as cortisol concentration or EEG alpha wave power. As demonstrated by Wollenhaupt-Aguiar et al. (97), combining ML with peripheral biomarker measurements can produce more objective and robust predictive features. Future research should consider integrating physiological indicators to further enrich the comprehensiveness and accuracy of depressive symptom prediction among college students.
Although limited in some aspects, this study demonstrates meaningful strengths with important implications. First, it constructed a predictive model based on Bronfenbrenner’s ecosystem theory using ML techniques, incorporating 38 predictors across multiple levels simultaneously, which has stronger explanatory power than traditional regression models. Second, multiple models were used to systematically compare the predictive performance of Random Forest, XGBoost, LightGBM, and SVM for depression symptoms among Chinese university students, overcoming the limitations of single-algorithm research. Finally, through feature importance and SHAP analyses, the factors influencing depressive symptoms among college students were ranked, and several key influencing factors were identified. Analyzing the conditions of college students in these areas can help to promptly identify those at risk of developing depressive symptoms and support more targeted, data-informed interventions, potentially offering a more accurate and efficient approach than standard PHQ-9 screening.
Conclusion
This study developed and compared multiple ML models to predict depressive symptoms among Chinese college students, incorporating 38 psychosocial and demographic predictors spanning individual, familial, and social domains. Among the models tested, the Random Forest algorithm demonstrated superior performance, outperforming XGBoost, LightGBM, and SVM in integrating complex predictors. Sleep disturbance, perceived stress, experiential avoidance, and self-criticism emerged as the most robust predictors of depressive symptoms. These findings underscore the utility of ML in synthesizing multidimensional factors to support the early identification of high-risk individuals and inform targeted mental health interventions. Such approaches can assist schools and healthcare systems in implementing proactive, personalized mental health strategies, ultimately contributing to efforts to reduce the growing burden of depression among college students.
Data availability statement
The raw data supporting the conclusions of this article will be made available by the authors, without undue reservation.
Ethics statement
The studies involving humans were approved by Ethics Committee of Guangzhou University (Protocol Number: GZHU202351). The studies were conducted in accordance with the local legislation and institutional requirements. Written informed consent for participation in this study was provided by the participants’ legal guardians/next of kin.
Author contributions
CY: Funding acquisition, Writing – review & editing, Resources, Conceptualization. XK: Writing – original draft, Writing – review & editing, Investigation. WY: Formal Analysis, Writing – original draft, Investigation, Writing – review & editing. XN: Methodology, Writing – review & editing. JC: Investigation, Writing – review & editing. XL: Writing – review & editing.
Funding
The author(s) declare that financial support was received for the research and/or publication of this article. This study was supported by the National Education Science Planning of China (BBA230064).
Acknowledgments
We would like to express our sincere gratitude to all the students who participated in this survey, as well as to the schools that provided support for this investigation. We also like to thank our student assistants for their invaluable support in data collection.
Conflict of interest
The authors declare that the research was conducted in the absence of any commercial or financial relationships that could be construed as a potential conflict of interest.
Generative AI statement
The author(s) declare that no Generative AI was used in the creation of this manuscript.
Publisher’s note
All claims expressed in this article are solely those of the authors and do not necessarily represent those of their affiliated organizations, or those of the publisher, the editors and the reviewers. Any product that may be evaluated in this article, or claim that may be made by its manufacturer, is not guaranteed or endorsed by the publisher.
Supplementary material
The Supplementary Material for this article can be found online at: https://www.frontiersin.org/articles/10.3389/fpsyt.2025.1648585/full#supplementary-material
References
1. Arias D, Saxena S, and Verguet S. Quantifying the global burden of mental disorders and their economic value. eClinicalMedicine. (2022) 54:101675. doi: 10.1016/j.eclinm.2022.101675
2. Clayborne ZM, Varin M, and Colman I. Systematic review and meta-analysis: Adolescent depression and long-term psychosocial outcomes. J Am Acad Child Adolesc Psychiatry. (2019) 58:72–9. doi: 10.1016/j.jaac.2018.07.896
3. Gregory D, Turnbull D, Bednarz J, and Gregory T. The role of social support in differentiating trajectories of adolescent depressed mood. J Adolescence. (2020) 85:1–11. doi: 10.1016/j.adolescence.2020.09.004
4. Wang Z, Zhang K, He L, Sun J, Liu J, and Hu L. Associations between frequent nightmares, nightmare distress and depressive symptoms in adolescent psychiatric patients. Sleep Med. (2023) 106:17–24. doi: 10.1016/j.sleep.2023.03.026
5. Thapar A, Collishaw S, Pine DS, and Thapar AK. Depression in adolescence. Lancet. (2012) 379:1056–67. doi: 10.1016/s0140-6736(11)60871-4
6. Pérez Rodríguez S, Layrón Folgado JE, Guillén Botella V, and Marco Salvador JH. Meaning in life mediates the association between depressive symptoms and future frequency of suicidal ideation in Spanish university students: A longitudinal study. Suicide Life-Threatening Behav. (2024) 54:286–95. doi: 10.1111/sltb.13040
7. Zhang J and Wang E. Heterogeneous patterns of problematic smartphone use and depressive symptoms among college students: Understanding the role of self-compassion. Curr Psychol. (2024) 43:25481–93. doi: 10.1007/s12144-024-06249-1
8. Bronfenbrenner U. Toward an experimental ecology of human development. Am Psychol. (1977) 32:513–31. doi: 10.1037/0003-066X.32.7.513
9. Gohari MR, Doggett A, Patte KA, Ferro MA, Dubin JA, Hilario C, et al. Using random forest to identify correlates of depression symptoms among adolescents. Soc Psychiatry Psychiatr Epidemiol. (2024) 59:2063–71. doi: 10.1007/s00127-024-02695-1
10. Kökönyei G, Kovács LN, Szabó J, and Urbán R. Emotion regulation predicts depressive symptoms in adolescents: A prospective study. J Youth Adolescence. (2024) 53:142–58. doi: 10.1007/s10964-023-01894-4
11. Liu T, Zou H, Tao Z, Qiu B, He X, Chen Y, et al. The relationship between stressful life events, sleep, emotional regulation, and depression in freshmen college students. Psychol Schools. (2023) 60:4653–66. doi: 10.1002/pits.23002
12. Miniati M, Busia S, Conversano C, Orrù G, Ciacchini R, Cosentino V, et al. Cognitive fusion, ruminative response style and depressive spectrum symptoms in a sample of university students. Life. (2023) 13:803. doi: 10.3390/life13030803
13. Xiang J, Peng F, Jiao J, Tan T, Liu L, Chen M, et al. Health risk behaviors, depressive symptoms and suicidal ideation among college students: A latent class analysis in middle China. J Affect Disord. (2025) 375:205–13. doi: 10.1016/j.jad.2025.01.107
14. Ding X, Jin X, Tang Y, and Yang Z. Associations between mobile phone addiction and depressive symptoms in college students: A conditional process model. Annales Médico-Psychologiques Rev Psychiatrique. (2024) 182:258–65. doi: 10.1016/j.amp.2023.09.012
15. Lu X, Li Z, Zhu X, Li D, and Wei J. The role of alexithymia and moral disengagement in childhood physical abuse and depressive symptoms: A comparative study among rural and urban Chinese college students. Psychol Res Behav Manage. (2024) 17:3197–210. doi: 10.2147/PRBM.S466379
16. Ye X, Zhang W, and Zhao F. Depression and internet addiction among adolescents: A meta-analysis. Psychiatry Res. (2023) 326:115311. doi: 10.1016/j.psychres.2023.115311
17. Fan L, Chen Y, Zhu M, Mao Z, and Li N. Correlation between childhood trauma experience and depressive symptoms among young adults: The potential mediating role of loneliness. Child Abuse Negl. (2023) 144:106358. doi: 10.1016/j.chiabu.2023.106358
18. Jin Y, Wang Y, Liu S, Niu S, Sun H, Liu Y, et al. The relationship between stressful life events and depressive symptoms in college students: Mediation by parenting style and Gender’s moderating effect. Psychol Res Behav Manage. (2024) 17:1975–89. doi: 10.2147/prbm.s461164
19. Lee EB, Lee JM, Park Y, Lee J, Stalnaker M, and Kim J. Cyberbullying victimization and a sense of purpose in life among college students: A mediation model of self-esteem and depressive symptoms. Deviant Behav. (2024) 46:599–611. doi: 10.1080/01639625.2024.2358976
20. Pearson R, Pisner D, Meyer B, Shumake J, and Beevers CG. A machine learning ensemble to predict treatment outcomes following an Internet intervention for depression. psychol Med. (2019) 49:2330–41. doi: 10.1017/S003329171800315X
21. Li Q, Song K, Feng T, Zhang J, and Fang X. Machine learning identifies different related factors associated with depression and suicidal ideation in Chinese children and adolescents. J Affect Disord. (2024) 361:24–35. doi: 10.1016/j.jad.2024.06.006
22. Luo L, Yuan J, Wu C, Wang Y, Zhu R, Xu H, et al. Predictors of depression among Chinese college students: A machine learning approach. BMC Public Health. (2025) , 25:470. doi: 10.1186/s12889-025-21632-8
23. Kroenke K and Spitzer RL. The PHQ-9: a new depression diagnostic and severity measure. Psychiatr Ann. (2002) 32:509–15. doi: 10.3928/0048-5713-20020901-06
24. Preece DA, Mehta A, Petrova K, Sikka P, Bjureberg J, Chen W, et al. The Perth Alexithymia Questionnaire-Short Form (PAQ-S): A 6-item measure of alexithymia. J Affect Disord. (2023) 325:493–501. doi: 10.1016/j.jad.2023.01.036
25. Schmitz N, Hartkamp N, Kiuse J, Franke GH, Reister G, and Tress W. The symptom check-list-90-R (SCL-90-R): A German validation study. Qual Life Res. (2000) 9:185–93. doi: 10.1023/a:1008931926181
26. Centers for Disease Control and Prevention. Adolescent and school health: YRBSS questionnaire 2013. United States: CDC (2013).
27. Gong T, Ren Y, Wu J, Jiang Y, Hu W, and You J. The associations among self-criticism, hopelessness, rumination, and NSSI in adolescents: A moderated mediation model. J Adolescence. (2019) 72:1–9. doi: 10.1016/j.adolescence.2019.01.007
28. Kwon M, Kim D-J, Cho H, and Yang S. The Smartphone Addiction Scale: Development and validation of a short version for adolescents. PloS One. (2013) 8:e83558. doi: 10.1371/journal.pone.0083558
29. Leung H, Pakpour AH, Strong C, Lin Y, Tsai M, Griffiths MD, et al. Measurement invariance across young adults from Hong Kong and Taiwan among three internet-related addiction scales: Bergen Social Media Addiction Scale (BSMAS), Smartphone Application-Based Addiction Scale (SABAS), and Internet Gaming Disorder Scale-Short Form (IGDS-SF9) (Study Part A). Addictive Behav. (2019) 101:105969. doi: 10.1016/j.addbeh.2019.04.027
30. Morean ME, DeMartini KS, Leeman RF, Pearlson GD, Anticevic A, Krishnan-Sarin S, et al. Psychometrically improved, abbreviated versions of three classic measures of impulsivity and self-control. psychol Assess. (2014) 26:1003–20. doi: 10.1037/pas0000003
31. Luo T, Chen L, Qin L, and Xiao S. Reliability and validity of chinese version of brief self-control scale. Chin J Clin Psychol. (2021) 29:83–6. doi: 10.16128/j.cnki.1005-3611.2021.01.017
32. Gross JJ and John OP. Individual differences in two emotion regulation processes: Implications for affect, relationships, and well-being. J Pers Soc Psychol. (2003) 85:348–62. doi: 10.1037/0022-3514.85.2.348
33. Wang L, Liu H, Li Z, and Du W. Reliability and validity of emotion regulation questionnaire-chinese revised version (ERQ-CRV). China. J Health Psychol. (2007) 6:503–5. doi: 10.13342/j.cnki.cjhp.2007.06.012
34. Dweck CS. Mindset: The new psychology of success. New York: Random House Publishing Group (2006).
35. Neff K. Self-compassion: An alternative conceptualization of a healthy attitude toward oneself. Self Identity. (2003) 2:85–101. doi: 10.1080/15298860309032
36. Gong H, Jia H, Guo T, and Zou L. Revision and psychometric validation of the self-compassion scale for adolescents. Psychol Research. (2014) 7:36–40, 79. doi: CNKI:SUN:OXLY.0.2014-01-006
37. Wang X. Psychometric evaluation of the meaning in life questionnaire in Chinese middle school students. Chin J Clin Psychol. (2013) 21:764–767 + 763. doi: 10.16128/j.cnki.1005-3611.2013.05.008
38. Chen Z. Fear of negative evaluation and test anxiety in middle school students. Chin Ment Health J. (2002) 12:855–7. doi: 10.3321/j.issn:1000-6729.2002.12.020
39. Watson D and Friend R. Measurement of social-evaluative anxiety. J Consulting Clin Psychol. (1969) 33:448–57. doi: 10.1037/h0027806
40. Bagby RM, Parker JD, Joffe RT, and Buis T. Reconstruction and validation of the depressive experiences questionnaire. Assessment. (1994) 1:59–68. doi: 10.1177/1073191194001001009
41. Chen B, Vansteenkiste M, Beyers W, Boone L, Deci EL, van der Kaap-Deeder J, et al. Basic psychological need satisfaction, need frustration, and need strength across four cultures. Motivation Emotion. (2015) 39:216–36. doi: 10.1007/s11031-014-9450-1
42. Luo T, Chen M, Ouyang F, and Xiao S. Reliability and validity of chinese version of brief barratt impulsiveness scale. Chin J Clin Psychol. (2020) 28:1199–1201, 1280. doi: 10.16128/j.cnki.1005-3611.2020.06.025
43. Bond FW, Hayes SC, Baer RA, Carpenter KM, Guenole N, Orcutt HK, et al. Preliminary psychometric properties of the acceptance and action questionnaire–II: A revised measure of psychological inflexibility and experiential avoidance. Behav Ther. (2011) 42:676–88. doi: 10.1016/j.beth.2011.03.007
44. Cao J, Ji Y, and Zhu Z. Reliability and validity of the Chinese version of the Acceptance and Action Questionnaire-Second Edition (AAQ-II) in college students. Chin Ment Health J. (2013) 27:873–7. doi: 10.3969/j.issn.1000-6729.2013.11.014
45. Carleton RN, Norton MAPJ, and Asmundson GJG. Fearing the unknown: A short version of the Intolerance of Uncertainty Scale. J Anxiety Disord. (2007) 21:105–17. doi: 10.1016/j.janxdis.2006.03.014
46. Wu L, Wang J, and Qi X. Validity and reliability of the Intolerance of Uncertainty Scale-12 in middle school students. Chin Ment Health J. (2016) 30:700–5. doi: 10.3969/j.issn.1000-6729.2016.09.012
47. Zhang X, Wang M, He L, Jie L, and Deng J. The development and psychometric evaluation of the Chinese Big Five Personality Inventory-15. PloS One. (2019) 14:e0221621. doi: 10.1371/journal.pone.0221621
48. Bernstein DP, Stein JA, Newcomb MD, Walker E, Pogge D, Ahluvalia T, et al. Development and validation of a brief screening version of the Childhood Trauma Questionnaire. Child Abuse Negl. (2003) 27:169–90. doi: 10.1016/S0145-2134(02)00541-0
49. Chao M, Lei J, He R, Jiang Y, and Yang H. TikTok use and psychosocial factors among adolescents: Comparisons of non-users, moderate users, and addictive users. Psychiatry Res. (2023) 325:115247. doi: 10.1016/j.psychres.2023.115247
50. Luo J, Wang M-C, Gao Y, Deng J, and Qi S-S. Factor structure and construct validity of the Emotions as a Child Scale (EAC) in Chinese children. psychol Assess. (2020) 32:85–97. doi: 10.1037/pas0000762
51. Cohen S, Kamarck T, and Mermelstein R. A global measure of perceived stress. J Health Soc Behav. (1983) 24:385. doi: 10.2307/2136404
52. Yang T and Huang H. An epidemiological study on stress among urban residents in social transition period. Chin J Epidemiol. (2003) 9:11–5. doi: 10.3760/cma.j.issn.1674-6554.2007.04.017
53. Pedregosa F, Varoquaux G, Gramfort A, Michel V, Thirion B, Grisel O, et al. Scikit-learn: machine learning in python. J Mach Learn Res. (2011) 12:2825–30. doi: 10.1524/auto.2011.0951
54. Shmilovici A. Support vector machines. In: Rokach L, Maimon O, and Shmueli E, editors. Machine learning for data science handbook. Springer-Nature New York: Springer International Publishing (2023). p. 93–110. doi: 10.1007/978-3-031-24628-9_6
55. Schonlau M and Zou RY. The random forest algorithm for statistical learning. Stata J. (2020) 20:3–29. doi: 10.1177/1536867X20909688
56. Chen T and Guestrin C. “XGBoost: A scalable tree boosting system”. In: Proceedings of the 22nd ACM SIGKDD international conference on knowledge discovery and data mining (KDD '16) New York, NY, USA: Association for Computing Machinery (2016). p. 785–94. doi: 10.1145/2939672.2939785
57. Ke G, Meng Q, Finley T, Wang T, Chen W, Ma W, et al. LightGBM: A highly efficient gradient boosting decision tree. In: 31st conference on neural information processing systems (NIPS 2017). Neural Information Processing Systems Foundation, Long Beach, CA, USA (2017). p. 1–9.
58. Chauhan VK, Dahiya K, and Sharma A. Problem formulations and solvers in linear SVM: A review. Artif Intell Rev. (2019) 52:803–55. doi: 10.1007/s10462-018-9614-6
59. Wong T-T and Yeh P-Y. Reliable accuracy estimates from k-Fold cross validation. IEEE Trans Knowledge Data Eng. (2020) 32:1586–94. doi: 10.1109/TKDE.2019.2912815
60. Rodriguez JD, Perez A, and Lozano JA. Sensitivity analysis of k-fold cross validation in prediction error estimation. IEEE Trans Pattern Anal Mach Intell. (2010) 32:569–75. doi: 10.1109/TPAMI.2009.187
61. Fernandez A, Garcia S, Herrera F, and Chawla NV. SMOTE for learning from imbalanced data: progress and challenges, marking the 15-year anniversary. J Artif Intell Res. (2018) 61:863–905. doi: 10.1613/jair.1.11192
62. Chen W, Yang K, Yu Z, Shi Y, and Chen CLP. A survey on imbalanced learning: Latest research, applications and future directions. Artif Intell Rev. (2024) 57:137. doi: 10.1007/s10462-024-10759-6
63. Rainio O, Teuho J, and Klén R. Evaluation metrics and statistical tests for machine learning. Sci Rep. (2024) 14:6086. doi: 10.1038/s41598-024-56706-x
64. Lundberg SM and Lee SI. A unified approach to interpreting model predictions. In: 31st conference on neural information processing systems (NIPS 2017). Neural Information Processing Systems Foundation, Long Beach, CA, USA (2017). p. 31–9.
65. Wang H, Liang Q, Hancock JT, and Khoshgoftaar TM. Feature selection strategies: A comparative analysis of SHAP-value and importance-based methods. J Big Data. (2024) 11:44. doi: 10.1186/s40537-024-00905-w
66. Biau G and Scornet E. A random forest guided tour. TEST. (2016) 25:197–227. doi: 10.1007/s11749-016-0481-7
67. Boulesteix A-L, Janitza S, Kruppa J, and König IR. Overview of random forest methodology and practical guidance with emphasis on computational biology and bioinformatics. WIREs Data Min Knowledge Discov. (2012) 2:493–507. doi: 10.1002/widm.1072
68. Bentéjac C, Csörgő A, and Martínez-Muñoz G. A comparative analysis of gradient boosting algorithms. Artif Intell Rev. (2021) 54:1937–67. doi: 10.1007/s10462-020-09896-5
69. Statnikov A, Wang L, and Aliferis CF. A comprehensive comparison of random forests and support vector machines for microarray-based cancer classification. BMC Bioinf. (2008) 9:319. doi: 10.1186/1471-2105-9-319
70. Price GD, Heinz MV, Song SH, Nemesure MD, and Jacobson NC. Using digital phenotyping to capture depression symptom variability: Detecting naturalistic variability in depression symptoms across one year using passively collected wearable movement and sleep data. Trans Psychiatry. (2023) 13:381. doi: 10.1038/s41398-023-02669-y
71. Su D, Zhang X, He K, and Chen Y. Use of machine learning approach to predict depression in the elderly in China: A longitudinal study. J Affect Disord. (2021) 282:289–98. doi: 10.1016/j.jad.2020.12.160
72. Huang Y, Hou Y, Li C, and Ren P. The risk factors for the comorbidity of depression and self-injury in adolescents: A machine learning study. Eur Child Adolesc Psychiatry. (2025). doi: 10.1007/s00787-025-02672-2
73. Lei T, Qiu H, Liu X, Li X, He Y, Huang Y, et al. Machine learning identifies prominent risk factors for depressive symptoms among Chinese children and adolescents. J Affect Disord. (2025) 389:119678. doi: 10.1016/j.jad.2025.119678
74. Sundararajan M and Najmi A. The many Shapley values for model explanation. Proc 37th Int Conf Mach Learn (ICML’20). (2020) 119:9269–78.
75. Li W, Yin J, Cai X, Cheng X, and Wang Y. Association between sleep duration and quality and depressive symptoms among university students: A cross-sectional study. PloS One. (2020) 15:e0238811. doi: 10.1371/journal.pone.0238811
76. Tao S, Wu X, Li S, Ma L, Yu Y, Sun G, et al. Circadian rhythm abnormalities during the COVID-19 outbreak related to mental health in China: A nationwide university-based survey. Sleep Med. (2021) 84:165–72. doi: 10.1016/j.sleep.2021.05.028
77. Dong L, Xie Y, and Zou X. Association between sleep duration and depression in US adults: A cross-sectional study. . J Affect Disord. (2022) 296:183–8. doi: 10.1016/j.jad.2021.09.075
78. Wang W, Du X, Guo Y, Li W, Teopiz KM, Shi J, et al. The associations between sleep situations and mental health among Chinese adolescents: A longitudinal study. Sleep Med. (2021) 82:71–7. doi: 10.1016/j.sleep.2021.03.009
79. Auerbach RP, Admon R, and Pizzagalli DA. Adolescent depression: stress and reward dysfunction. Harvard Rev Psychiatry. (2014) 22:139–48. doi: 10.1097/HRP.0000000000000034
80. Zhang R, Demiral SB, Tomasi D, Yan W, Manza P, Wang G-J, et al. Sleep deprivation effects on brain state dynamics are associated with dopamine D2 receptor availability via network control theory. Biol Psychiatry. (2025) 97:89–96. doi: 10.1016/j.biopsych.2024.08.001
81. Berger A, Wahlstrom K, and Widome R. Relationships between sleep duration and adolescent depression: A conceptual replication. Sleep Health. (2019) 5:175–9. doi: 10.1016/j.sleh.2018.12.003
82. Cui G, Yin Y, Li S, Chen L, Liu X, Tang K, et al. Longitudinal relationships among problematic mobile phone use, bedtime procrastination, sleep quality and depressive symptoms in Chinese college students: A cross-lagged panel analysis. BMC Psychiatry. (2021) 21:449. doi: 10.1186/s12888-021-03451-4
83. Raudsepp L. Brief report: Problematic social media use and sleep disturbances are longitudinally associated with depressive symptoms in adolescents. J Adolescence. (2019) 76:197–201. doi: 10.1016/j.adolescence.2019.09.005
84. Leung CY, Kyung M, and Weiss SJ. Greater perceived stress and lower cortisol concentration increase the odds of depressive symptoms among adolescents. J Affect Disord. (2024) 365:41–8. doi: 10.1016/j.jad.2024.08.053
85. Liu Y, Yu H, Shi Y, and Ma C. The effect of perceived stress on depression in college students: The role of emotion regulation and positive psychological capital. Front Psychol. (2023) 14:1110798. doi: 10.3389/fpsyg.2023.1110798
86. Luyten P and Fonagy P. The stress–reward–mentalizing model of depression: An integrative developmental cascade approach to child and adolescent depressive disorder based on the Research Domain Criteria (RDoC) approach. Clin Psychol Rev. (2018) 64:87–98. doi: 10.1016/j.cpr.2017.09.008
87. Shapero BG, Curley EE, Black CL, and Alloy LB. The interactive association of proximal life stress and cumulative HPA axis functioning with depressive symptoms. Depression Anxiety. (2019) 36:1089–101. doi: 10.1002/da.22957
88. Núñez D, Ordóñez-Carrasco JL, Fuentes R, and Langer Á.I. Experiential avoidance mediates the association between paranoid ideation and depressive symptoms in a sample from the general population. J Psychiatr Res. (2021) 139:120–4. doi: 10.1016/j.jpsychires.2021.05.028
89. Hayes SC, Wilson KG, Gifford EV, Follette VM, and Strosahl K. Experiential avoidance and behavioral disorders: A functional dimensional approach to diagnosis and treatment. J Consulting Clin Psychol. (1996) 64:1152–68. doi: 10.1037/0022-006X.64.6.1152
90. Akbari M, Seydavi M, Hosseini ZS, Krafft J, and Levin ME. Experiential avoidance in depression, anxiety, obsessive-compulsive related, and posttraumatic stress disorders: A comprehensive systematic review and meta-analysis. J Contextual Behav Sci. (2022) 24:65–78. doi: 10.1016/j.jcbs.2022.03.007
91. Xu X, Cui Y, Cao J, and Zhu Z. Relationship between experiential avoidance, cognitive fusion and mental health of college students: the mediating effect of mindfulness. China J Health Psychol. (2018) 34:741–4. doi: 10.11847/zgggws1113866
92. Jomha A, Sohn MN, Watson M, Kopala-Sibley DC, and McGirr A. Self-criticism predicts antidepressant effects of intermittent theta-burst stimulation in Major Depressive Disorder. J Affect Disord. (2025) 372:210–5. doi: 10.1016/j.jad.2024.12.006
93. Shahar G, Bauminger R, Zwerenz R, Brähler E, and Beutel M. Centrality of self-criticism in depression and anxiety experienced by breast cancer patients undergoing short-term psychodynamic psychotherapy. Psychiatry. (2022) 85:215–27. doi: 10.1080/00332747.2021.2004786
94. Blatt SJ. Levels of object representation in anaclitic and introjective depression. Psychoanalytic Study Child. (1974) 29:107–57. doi: 10.1080/00797308.1974.11822616
95. Dunn NA and Luchner AF. The emotional impact of self-criticism on self-reflection and rumination. Psychol Psychotherapy: Theory Res Pract. (2022) 95:1126–39. doi: 10.1111/papt.12422
96. Khizer N, Iqbal M, and Muazzam A. Beyond academics: The relationship of adjustment issues, self-criticism, and mental health issues among university students. Int J Soc Sci Bull. (2024) 2:1502–9.
Keywords: machine learning, depressive symptoms, risk and protective factors, college students, random forest
Citation: Yu C, Kong X, Yu W, Ni X, Chen J and Liao X (2025) Machine learning models for predicting the risk of depressive symptoms in Chinese college students. Front. Psychiatry 16:1648585. doi: 10.3389/fpsyt.2025.1648585
Received: 17 June 2025; Accepted: 07 July 2025;
Published: 05 August 2025.
Edited by:
Atika Khalaf, Kristianstad University, SwedenReviewed by:
Cheng Liu, Jiangsu Vocational Institute of Commerce, ChinaDoljinsuren Enkhbayar, Yonsei University, Republic of Korea
Copyright © 2025 Yu, Kong, Yu, Ni, Chen and Liao. This is an open-access article distributed under the terms of the Creative Commons Attribution License (CC BY). The use, distribution or reproduction in other forums is permitted, provided the original author(s) and the copyright owner(s) are credited and that the original publication in this journal is cited, in accordance with accepted academic practice. No use, distribution or reproduction is permitted which does not comply with these terms.
*Correspondence: Chengfu Yu, eXVjaGVuZ2Z1QGd6aHUuZWR1LmNu