 Tobias Schott
 Marie Blume†
 Christian Sander
 Georg Schomerus
A Correction on
Stigmatisation of survivors of political persecution in the GDR: attitudes of healthcare professionals
By Schott T, Blume M, Weiß A, Sander C and Schomerus G (2025) Front. Psychiatry 16:1556411. doi: 10.3389/fpsyt.2025.1556411
There was a mistake in Table 1 as published. An incorrect distribution of values was entered in the section Work Setting. The corrected Table 1 appears below.
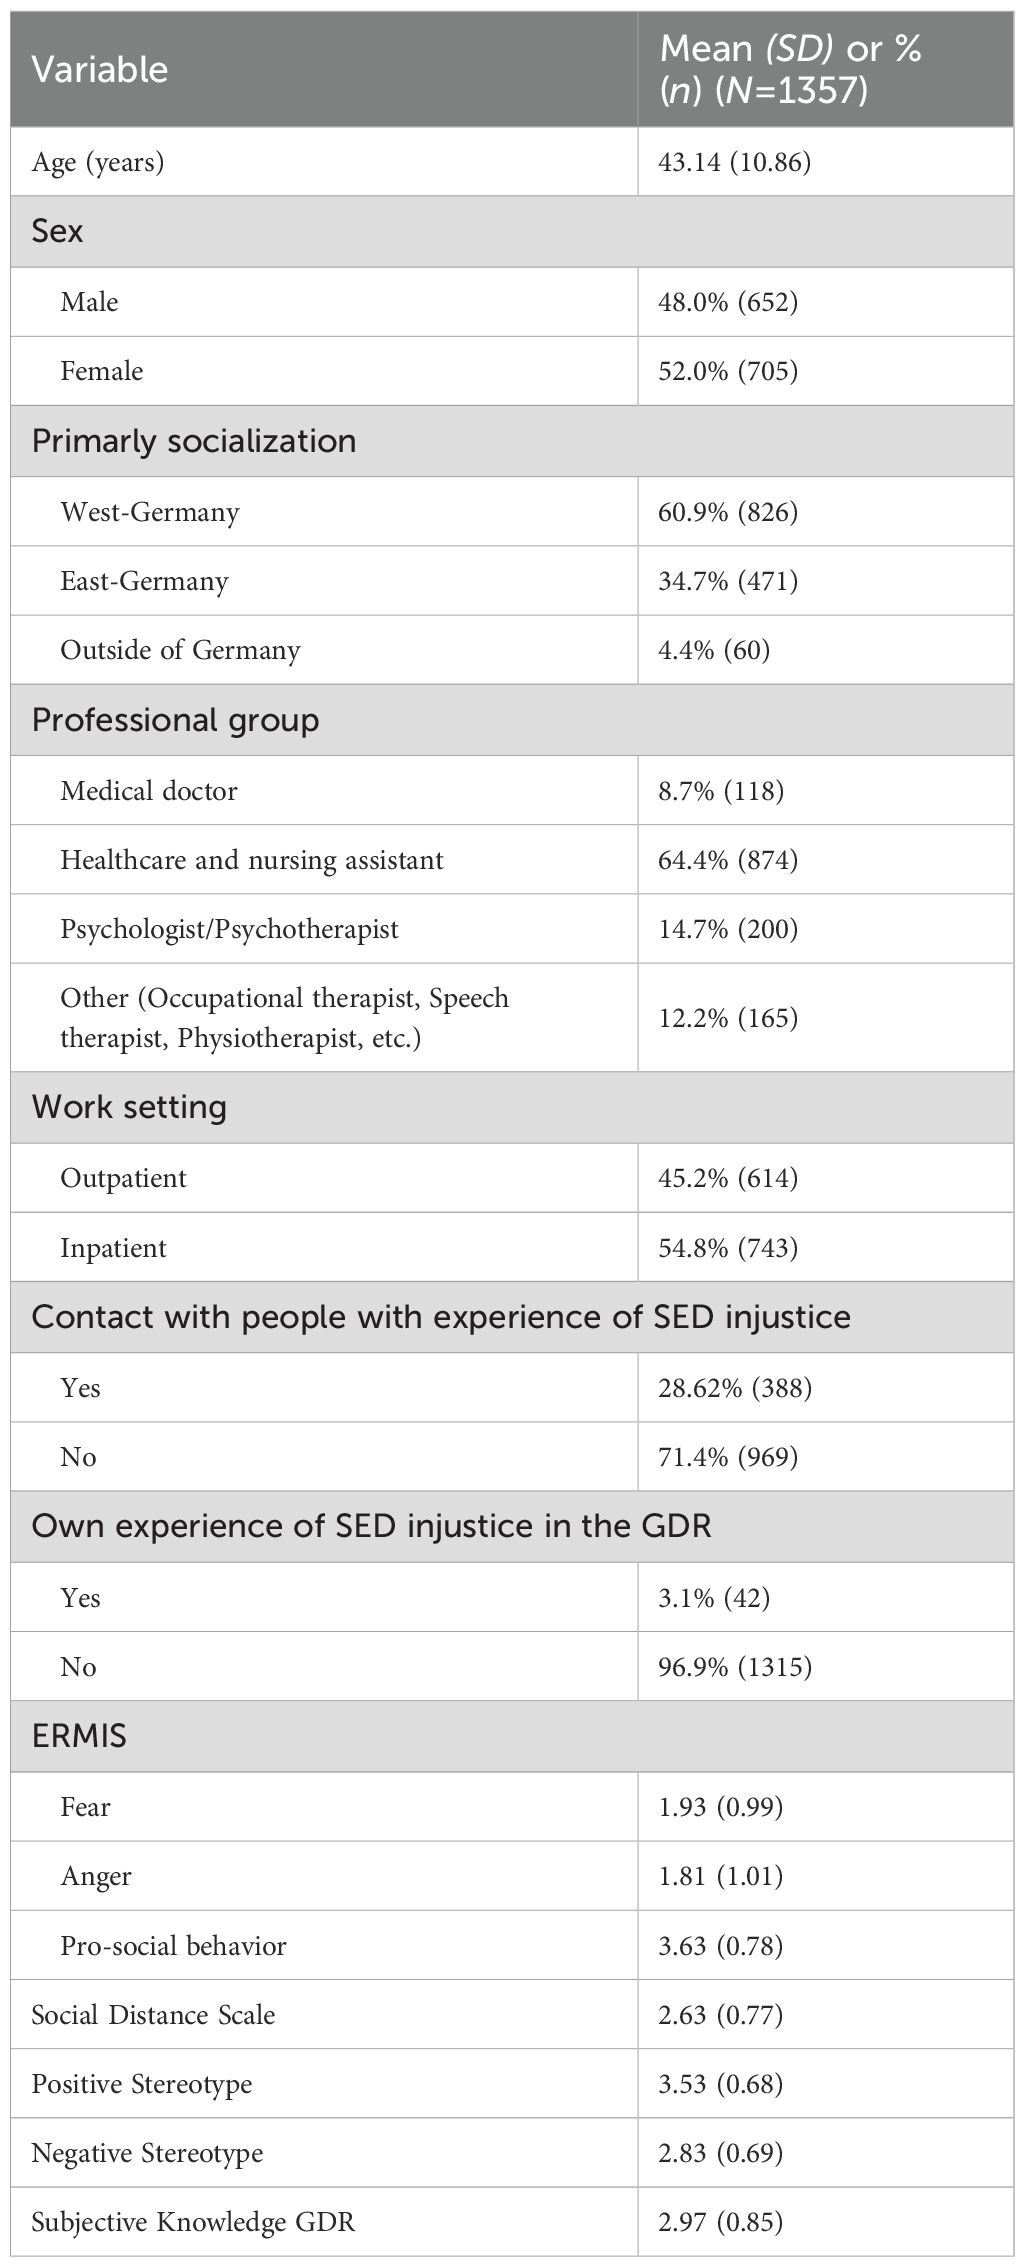
Table 1. Sociodemographic variables.
There was a mistake in Table 3 as published. The values in the published table have changed due to other calculations with a larger data set. The corrected Table 3 appears below.
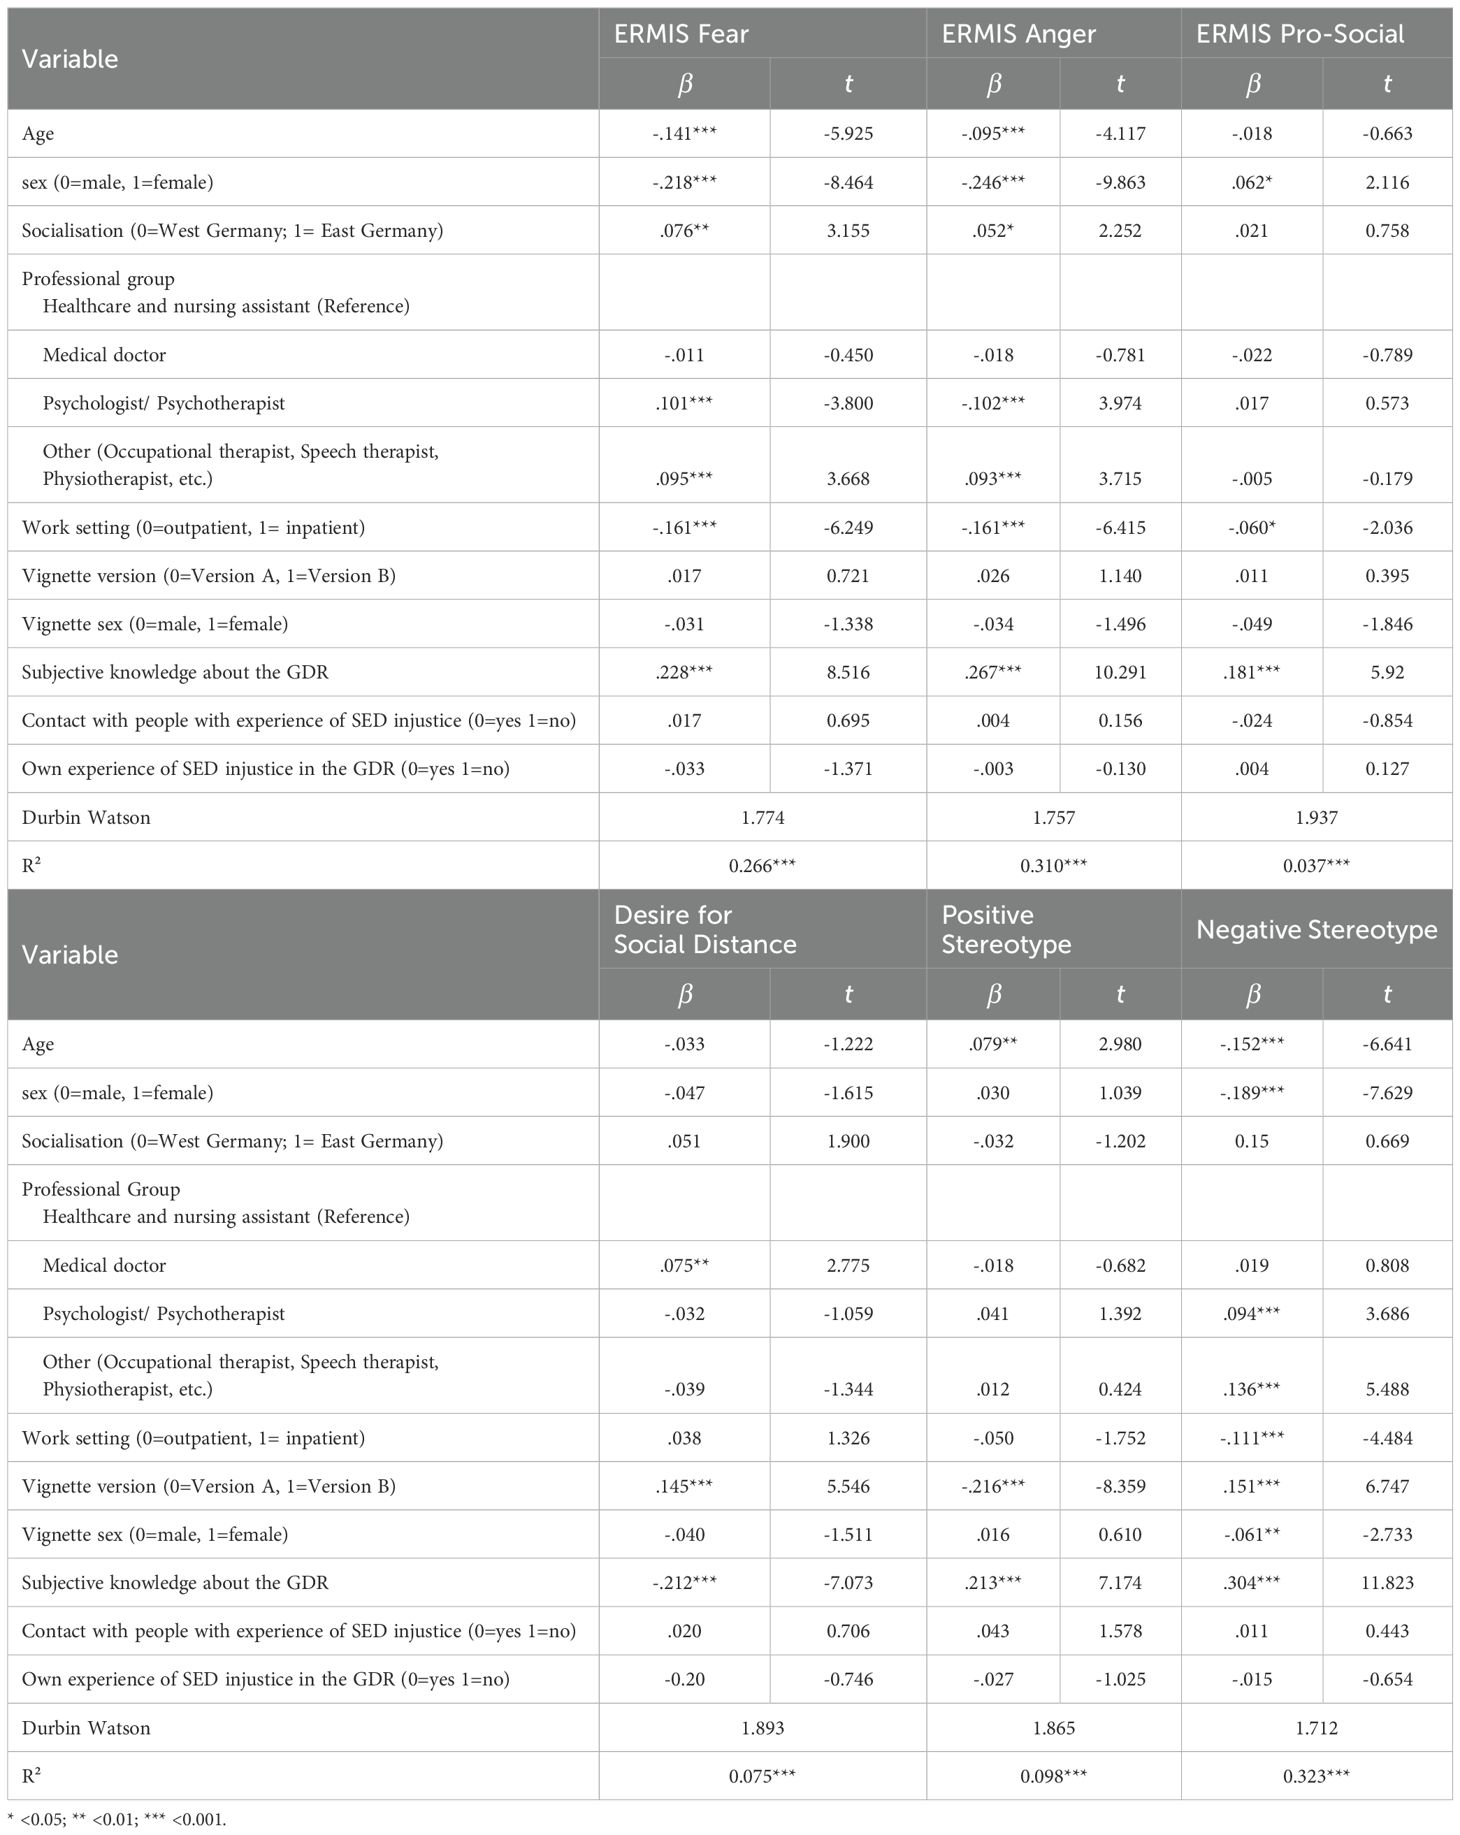
Table 3. Multiple regression (ERMIS Fear, Anger, Pro-Social).
In the Abstract, in the Results section, two values were incorrect. This section originally read, “The explanatory power of the regression models is predominantly in the medium range (from 9.7 till 35.3%).” This has been corrected to read:
“The explanatory power of the regression models is predominantly in the medium range (from 3.7 till 32.3%).”
In the Results section, the values have been adjusted according to the changes in Table 3.
The subsection Emotional reaction fear originally read, “The hierarchical regression model shown in Table 3 explains a total of 28.0% of the variance for the emotional reaction fear. Younger (ß = -.100; p <.01) and male participants showed a higher emotional response of fear (ß = -.204; p <.001), as did participants from the professional group of psychologists and psychotherapists (ß = .130; p <.001), professional group of occupational-, speech- and physiotherapist (ß = .168; p <.001), and working in an inpatient setting (ß = -.155; p <.001). Furthermore, a higher level of subjective knowledge about the GDR (ß = .182; p <.001) and an own experience of SED injustice (ß = -.065; p <.05) had a significant influence on the regression model.” This has been corrected to read:
“The multiple regression model shown in Table 3 explains a total of 26.6% of the variance for the emotional reaction fear. Younger (ß = -.141; p < .001) and male participants showed a higher emotional response of fear (ß = -.218; p < .001), as did participants from the professional group of psychologists and psychotherapists (ß = .101; p < .001), professional group of occupational-, speech- and physiotherapist (ß = .095; p < .001), and working in an inpatient setting (ß = -.161; p < .001). Furthermore, a higher level of subjective knowledge about the GDR (ß = .228; p < .001) and who have an East German socialization (ß = .076; p < .01) had a significant influence on the regression model.”
The subsection Emotional reaction anger originally read, “The multiple hierarchical regression model (see Table 3) was able to account for a total of 35.0% of the variance regarding the emotional reaction anger. Male participants (ß = -.225; p < .001), the professional group of psychologists and psychotherapists (ß =.138; p<.001) as well as professional group of occupational-, speech- and physiotherapist (ß = .186; p < .001) working in an inpatient setting (ß = -.157; p < .001) and having personally experienced SED injustice (ß = -.071; p = .024) showed a stronger emotional reaction anger. In addition, the sex form of the case vignette (ß = .083; p = .006) and a higher subjective knowledge about the GDR (ß = .208; p < .001) also predicted significantly stronger emotional reactions.” This has been updated to read:
“The multiple regression model (see Table 3) was able to account for a total of 31.0% of the variance regarding the emotional reaction anger. Male participants (ß = -.246; p < .001), the professional group of occupational-, speech- and physiotherapist (ß = .093; p < .001) and working in an inpatient setting (ß = -.161; p < .001) showed a stronger emotional reaction anger. The professional group of psychologists and psychotherapists showed fewer emotional anger reactions (ß =-.102; p<.001). In addition, male participants (ß = -.246; p = <.001) and a higher subjective knowledge about the GDR (ß = .267; p < .001) also predicted significantly stronger emotional reactions."
The subsection Emotional reaction pro-social reaction originally read, “The multiple hierarchical regression model regarding the pro-social reactions of the ERMIS (see Table 3) explains 9.7% of the variance. The professional group of psychologists and psychotherapists (ß =.082; p<.05) as well as the professional group of occupational-, speech- and physiotherapist (ß = .099; p < .01) and those with a higher subjective knowledge about the GDR (ß = .225; p < .001) showed significantly greater pro-social reaction.” This has been updated to read:
“The multiple regression model regarding the pro-social reactions of the ERMIS (see Table 2) explains 3.7% of the variance. Female participants (ß =.062; p<.05), participants who work in an outpatient setting (ß = -.060; p < .05) and those with a higher subjective knowledge about the GDR (ß = .181; p < .001) showed significantly greater pro-social reaction.”
The subsection Desire for social distance originally read, “Overall, the presented hierarchical regression model was able to explain 10.3% of the variance of the SDS. The strongest predictor of the desire for social distancing was the version of the case vignette (ß = -.140; p < .001). Medical doctors (ß = .131; p < .001) and the group of occupational-, speech- and physiotherapist (ß = -.123; p < .01) were the professional group that had an influence for desire for social distancing. The desire for social distancing was less pronounced if one had already had contact in a professional context with people who had experienced injustice in the GDR (ß = .104; p < .01) and if one had a high level of subjective knowledge about this topic (ß = -.150; p < .001).” This has been updated to read:
“Overall, the presented regression model was able to explain 7.5% of the variance of the SDS. A strong predictor of the desire for social distancing was the version of the case vignette (case vignette B: ß = .145; p < .001). Medical doctors (ß = .075; p < .01) were the professional group that had an influence for desire for social distancing. The desire for social distancing was less pronounced if one had a high level of subjective knowledge about this topic (ß = -.212; p < .001).”
The subsection Positive and negative stereotypes originally read, “Overall, the presented regression model was able to explain 12.6% of the variance of the positive and 35% of the variance of the negative stereotype. Older participants (ß = .118; p < .001), participants with higher subjective knowledge (ß = .172; p < .001) and those who were presented the case vignette with GDR socialization without experience of injustice (ß = .225; p < .001) showed more positive stereotype attributions. In contrast, younger people (ß = .115; p < .001), with high subjective knowledge (ß = .115; p < .001) men (ß = .115; p < .001), working in an outpatient setting (ß = .087; p < .05), and those who were presented the case vignette with experience of injustice (ß = .115; p < .001) showed more negative stereotypes attributions.” This has been updated to read:
“Overall, the presented regression model was able to explain 9.8% of the variance of the positive and 32.3% of the variance of the negative stereotype. Older participants (ß = .079; p < .01), participants with higher subjective knowledge (ß = .213; p < .001) and those who were presented the case vignette with GDR socialization without experience of injustice (ß = -.216; p < .001) showed more positive stereotype attributions. In contrast, younger people (ß = -.152; p < .001), with high subjective knowledge (ß = .304; p < .001) men (ß = -.189; p < .001), working in an outpatient setting (ß = -.111; p < .05), male case vignette (ß = -.061; p < .01), and those who were presented the case vignette with experience of injustice (ß = .151; p < .001) showed more negative stereotypes attributions.”
The original version of this article has been updated.
Publisher’s note
All claims expressed in this article are solely those of the authors and do not necessarily represent those of their affiliated organizations, or those of the publisher, the editors and the reviewers. Any product that may be evaluated in this article, or claim that may be made by its manufacturer, is not guaranteed or endorsed by the publisher.
Keywords: GDR, SED, reunification, mental disorders, attitude, stigma, marginalization, health-care system
Citation: Schott T, Blume M, Weiß A, Sander C and Schomerus G (2025) Correction: Stigmatisation of survivors of political persecution in the GDR: attitudes of healthcare professionals. Front. Psychiatry 16:1657776. doi: 10.3389/fpsyt.2025.1657776
Received: 01 July 2025; Accepted: 08 August 2025;
Published: 03 September 2025.
Edited and reviewed by:
Sawsan Abuhammad, Jordan University of Science and Technology, JordanCopyright © 2025 Schott, Blume, Weiß, Sander and Schomerus. This is an open-access article distributed under the terms of the Creative Commons Attribution License (CC BY). The use, distribution or reproduction in other forums is permitted, provided the original author(s) and the copyright owner(s) are credited and that the original publication in this journal is cited, in accordance with accepted academic practice. No use, distribution or reproduction is permitted which does not comply with these terms.
*Correspondence: Tobias Schott, VG9iaWFzLlNjaG90dEBtZWRpemluLnVuaS1sZWlwemlnLmRl
†Present address: Marie Blume, Department of Neurology, University of Leipzig Medical Centre, Leipzig, Germany