 Pengyu Zhu1
 Yuxi Wang1Jialin Xiang1Junchen Gu2
 Xiong Chen2Fang Chen2Lulu Zou2
 Chunqi Ai2Kun Qin1
 Wen Chen1*
- 1Department of Radiology, Taihe Hospital, Hubei University of Medicine, Shiyan, China
- 2Mental Health Center, Taihe Hospital, Hubei University of Medicine, Shiyan, China
Background: Adolescent bipolar disorder (BD) is a severe psychiatric condition characterized by mood instability, with significant impacts on social and cognitive functioning. Clarifying the neural mechanisms underlying BD during adolescence may aid early diagnosis and treatment.
Methods: We conducted a multimodal neuroimaging study integrating functional and structural MRI data to investigate alterations in spontaneous neural activity (amplitude of low-frequency fluctuation (ALFF) and regional homogeneity (ReHo)), seed-based resting-state functional connectivity (rsFC), and gray matter volume (GMV) in 69 adolescents with BD and 42 matched healthy controls (HCs). ALFF and ReHo were used to identify local functional abnormalities. Overlapping brain regions were selected as seeds for rsFC analysis. Voxel-based morphometry (VBM) was performed to detect GMV differences. Correlations between imaging measures and clinical symptom scores (HAMD, HAMA, YMRS) were assessed.
Results: Compared to HCs, BD patients exhibited significant abnormalities in the ALFF within the default mode network (DMN) and the salience network (SN). ReHo was also altered in the SN. Seed-based rs-FC analysis revealed reduced connectivity between the right supramarginal gyrus and the left middle frontal gyrus, which are key nodes of the frontoparietal network (FPN). VBM analysis demonstrated decreased GMV in the left cerebellum. No significant correlations were found between imaging measures and clinical scale ratings.
Conclusions: Our findings suggest that adolescent BD is characterized by functional abnormalities within DMN and FPN, as well as cerebellar gray matter atrophy. Disrupted structure–function coupling in these regions may reflect possible neurobiological mechanisms underlying BD during adolescence.
1 Introduction
Bipolar disorder (BD) is a chronic and debilitating mood disorder characterized by recurrent episodes of mania and depression, with a substantial risk of suicide and functional impairment (1). The disorder imposes considerable individual and societal burdens due to long-term cognitive and emotional dysfunction (2). It is estimated that the incidence rate of BD accounts for approximately 1-2% of the global population. Moreover, in recent years, the age of onset of BD has been continuously advancing (3), and the misdiagnosis rate of diagnosis has also been increasing, early misdiagnosis may miss the best treatment time. Therefore, it is of clinical importance to elucidate the early neurobiological mechanisms underlying adolescent BD and to inform timely and targeted interventions.
Recent advances in the field of neuroimaging have enhanced our understanding of the neurophysiology of this disease (4). In particular, the application of resting-state functional magnetic resonance imaging (rs-fMRI), abnormal local spontaneous brain activity, and resting-state functional connectivity (rsFC) have been repeatedly observed in patients with BD (5, 6). Previous studies have shown that abnormal pathways in large-scale functional networks may be the basis of the pathophysiology of BD (7, 8). In these studies, functional magnetic resonance imaging (fMRI) studies showed that compared with healthy controls (HC), patients with BD had abnormal resting-state functional connectivity (rsFC) in the default mode network (DMN), frontal-parietal network (FPN), salience network (SN), and limbic network (7, 8).
Alterations in gray matter volume (GMV) are also of critical interest in the context of BD, given their relevance to cognition, affect regulation, and disease progression (9). Gray matter structures, including the cerebral cortex and subcortical nuclei, are essential for perceptual, motor, and higher-order cognitive processes (10). Voxel-based morphometry (VBM) provides an automated, objective whole-brain technique to detect subtle morphometric changes associated with psychiatric and neurological disorders (11). Meta-analytic evidence indicates reduced GMV in the left orbitofrontal cortex, right putamen, and right dorsolateral prefrontal cortex in youth with BD relative to healthy controls (12).
Multimodal techniques combining structural and functional methods may provide more useful information for clinical diagnosis. For instance, combining the cortical thickness and functional connectivity (FC) analysis of MDD patients, Spati et al. found that there were indications suggesting that thinning of prefrontal cortex (PFC) might impair the participation of anterior cingulate cortex (ACC) during depressive episodes (13). van et al. found that the cortical thickness of dorsomedial prefrontal cortex (dmPFC) could be used to predict the rsFC between dmPFC and the default mode network (14). The combination of VBM and FC has also been used to study schizophrenia (15), temporal lobe epilepsy (16), and Parkinson’s disease (17).
In BD, emerging evidence suggests considerable neurobiological heterogeneity across clinical subgroups. Data-driven cognitive subtyping has revealed distinct patterns of structural and functional brain alterations, including prefrontal cortical thinning, white matter abnormalities, and altered activation/connectivity in frontoparietal circuits (2, 18–20). Furthermore, two studies demonstrated different BD subgroups based on neural activation during emotion regulation, characterized by differential activation of the prefrontal cortex and amygdala (11, 21, 22). Together, these findings suggest that there is a connection between the changes in brain structure and function in BD and clinical and cognitive phenotypes, which can serve as potential therapeutic targets.
Taken together, these findings highlight the interplay between structural and functional brain alterations and clinical phenotypes in BD, underscoring their potential utility as biomarkers for diagnosis and treatment stratification. However, reliance on unimodal imaging approaches may constrain integrative, transdiagnostic research, as emphasized in the Research Domain Criteria (RDoC) framework promoted by the U.S. National Institute of Mental Health. Combining neuroanatomical and functional connectivity analyses offers a promising avenue for delineating structure–function relationships and refining pathophysiological models of BD (23).
Therefore, the present study aims to investigate alterations in both brain structure and function among adolescents with BD and examine the associations between neuroimaging findings and clinical symptoms. This approach seeks to clarify the underlying neural mechanisms of adolescent BD, inform early identification strategies, and ultimately contribute to reducing diagnostic delays and errors in this vulnerable population.
2 Methods
2.1 Participants
A total of 111 adolescents were recruited for this study, including 69 patients with BD from Taihe Hospital, Hubei University of Medicine, and 42 HCs from the local community. Due to excessive head movement, seven subjects (five BD patients and two HCs) were excluded from the final analysis. All patients met the diagnostic criteria of DSM-IV structured clinical interview (SCID), but in this study, we did not distinguish between BD-I and BD-II. The exclusion criteria are: (1) age below 10 or above 20 years; (2) history of alcohol or substance abuse; (3) any current or past neurological or medical condition affecting cognitive function; (4) history of head trauma with loss of consciousness; (5) contraindications for MRI; and (6) any current DSM-5 Axis I psychiatric disorder other than BD. In this experiment, the manic symptoms of all patients were evaluated using the Young Mania Rating Scale (YMRS). The Hamilton Depression Scale (HAMD) is used to assess the depressive symptoms of patients, and the Hamilton Anxiety Rating Scale (HAMA) assesses the anxiety symptoms of patients. This research adheres to the Declaration of Helsinki. The current research has been approved by the Institutional Review Committee of Shiyan Taihe Hospital Affiliated to Hubei University of Medicine and Pharmacy. Written informed consent forms of all subjects were obtained before participating in this study.
2.2 fMRI data acquisition
All imaging data were collected using the GE 3T scanner at the Medical Imaging Center of Taihe Hospital in Shiyan City. Initially, the resting-state functional images were collected, followed by the T1 images. During the scanning process, the subjects were asked to try not to swallow or move their bodies, especially their heads. In the resting state, the subjects were also instructed to close their eyes, relax and stay awake. The resting-state functional images were collected using the echo planar imaging (EPI) sequence as follows: Axial scanning, repetition time (TR) = 2000ms, echo time (TE) = 30ms, flip angle = 52°, field of view (FOV) = 240 × 240 mm2, matrix size = 80×80, number of layers = 62, layer thickness = 3.5 mm Voxel size = 2 × 2 × 2 mm³. T1 images were collected using the brain volume (BRAVO) sequence prepared by T1-weighted sagittal 3D magnetization, as shown below: TR = 7.4ms, TE = 30ms, flip angle = 12°, FOV = 256 × 256 mm2, matrix size = 256 × 256, number of layers = 166, layer thickness = 1 mm, voxel size = 1 × 1 × 1 mm3.
2.3 fMRI data preprocessing
Resting-state fMRI data were preprocessed in the toolbox of (resting-state) brain imaging data processing and Analysis (DPABI v3.1) (24). The preprocessing steps include deleting the first five time points, slice timing, realignment, de-trend, removing the head movement effect (using the Friston 24-parameter model) (25), regression of nuisance covariates (white matter signal, cerebrospinal fluid signal, and global mean signal), normalizing the MNI space (using T1 images), and resampling (voxel size) = 2 × 2 × 2 mm3, spatial smoothing (6 mm full-width at half-maximum, applied to ALFF and rsFC analyses) and bandpass filtering (0.01-0.1 Hz, only applicable to ReHo and rsFC analysis). Furthermore, we use volume-based framewise displacement (FD) to quantify head movement (26). FD reflects the head movement from one volume to the next, and a volume with FD < 0.2 indicates a good point in time. The mean FD is calculated as the average of the sum of the absolute values of the differential realignment estimates at each time point (through backward differences) (27). If the number of good time points for the subjects is less than 160, the subjects will be excluded.
2.4 ALFF and ReHo calculation
Using the preprocessed resting-state fMRI data, we calculated the ALFF and ReHo values of each subject in DPABI v3.1. All values are calculated at the voxel level. Calculate the ALFF value using the signal strength in the low-frequency range (i.e., 0.01-0.1 Hz). The ReHo value, also called the Kendall’s coefficient of concordance (KCC), of the time series of a given voxel with its nearest neighbors (27 voxels were considered) was calculated to generate individual ReHo maps. Finally, the ALFF and ReHo maps of each subject were respectively converted into Z-score maps.
2.5 Functional connectivity analysis
This analysis was carried out in DPABI v3.1. The overlapping clusters exhibiting concurrent abnormalities in both ALFF and ReHo among patients with BD were selected as seeds for subsequent functional connectivity analysis. Specifically, clusters showing significant ALFF and ReHo alterations were first extracted to create masks, and their spatial overlap was identified as the seed regions. The average time series of the seed regions were extracted for each subject. Next, Pearson correlation coefficients were computed between the seed time series and the time series of every other voxel in the brain, resulting in a rsFC map for each individual. Finally, each subject’s rsFC map was converted into a z-score map using Fisher’s z-transformation to improve normality for further statistical analyses.
2.6 VBM analysis
We used the VBM8(http://dbm.neuro.uni-jena.de/vbm8) toolbox in SPM12(http://www.fil.ion.ucl.ac.uk/spm) software to analyze the T1-weighted images. First, check for artifacts in the image and adjust the source of the image to the front merge. Subsequently, the images were segmented into gray matter, white matter and cerebrospinal fluid maps, and then normalized to the standard Montreal Neuroscience Institute (MNI) space, with a voxel size of 1.5 × 1.5 × 1.5 mm³. After checking the data quality of the partitioned map, the gray matter map was further smoothed using an 8 mm full-width, semi-Gaussian kernel.
2.7 Statistical analyses
For the categorical variables of demographic and clinical data, we used chi-square tests for group comparisons. For continuous variables, we first performed a Shapiro–Wilk test to assess normality. If the variables follow a normal distribution, we use the two-sample t-test for group comparison. If the normal distribution is not followed, the Mann-Whitney U test is used to compare the differences between BD patients and HC patients. All statistical analyses were conducted using SPSS version 20.0.
For each functional measure (namely ALFF, ReHo and rsFC), the differences between the two groups were analyzed in SPM12. In these analyses, the two-sample t-test was used to control for age, gender and mean FD. Significance was determined using a voxel-level threshold of p < 0.001 (uncorrected) combined with cluster-level family-wise error (FWE) correction at p < 0.05. To further examine associations between imaging markers and clinical symptoms, we performed Pearson correlation analyses between ALFF and ReHo values from significant clusters and clinical scores (HAMD, HAMA, and YMRS). A Bonferroni-corrected significance threshold of p < 0.017 (0.05/3) was applied.
For GMV, group differences in gray matter volume were examined using two-sample t-tests in SPM12, controlling for age, sex, and total intracranial volume. The significance level was set as a combination of uncorrected P < 0.001 at the voxel level and FWE correction P < 0.05 at the cluster level.
3 Results
3.1 Demographic and clinical characteristics
Table 1 summarizes the demographic and clinical data of all the subjects. We found that age did not follow a normal distribution (P < 0.05). Therefore, the median and the upper and lower quartiles are used for representation. There was a significant difference in gender distribution between the BD group and the HC group (χ² = 8.651, p = 0.003), among which the proportion of females was higher in the BD group. There was no significant difference in age between the two groups. (Table 1) Given the differences in gender distribution between the two groups (40.8% male in the BD group and 57.1% male in the HC group), gender was included as an independent covariate in the model in all secondary analyses to control its potential confounding effects. Meanwhile, age was also included in the analysis as a covariate (Table 1).
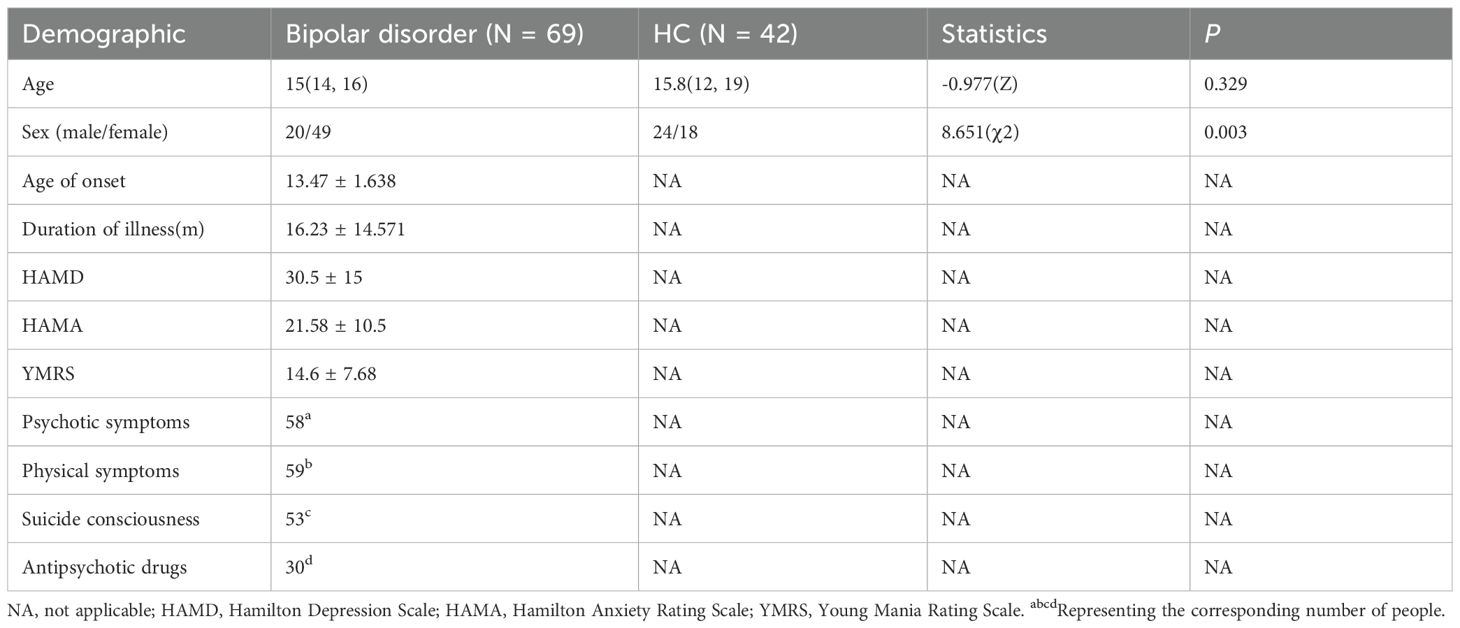
Table 1. Demographic and clinical feature of participants.
3.2 ALFF and ReHo analysis
Whole brain analysis revealed that in the BD group, the ALFF values in the right supramarginal gyrus, right lingual gyrus, right middle frontal gyrus, left posterior cingulate gyrus, and right parahippocampal gyrus were significantly increased (Table 2, Figure 1).
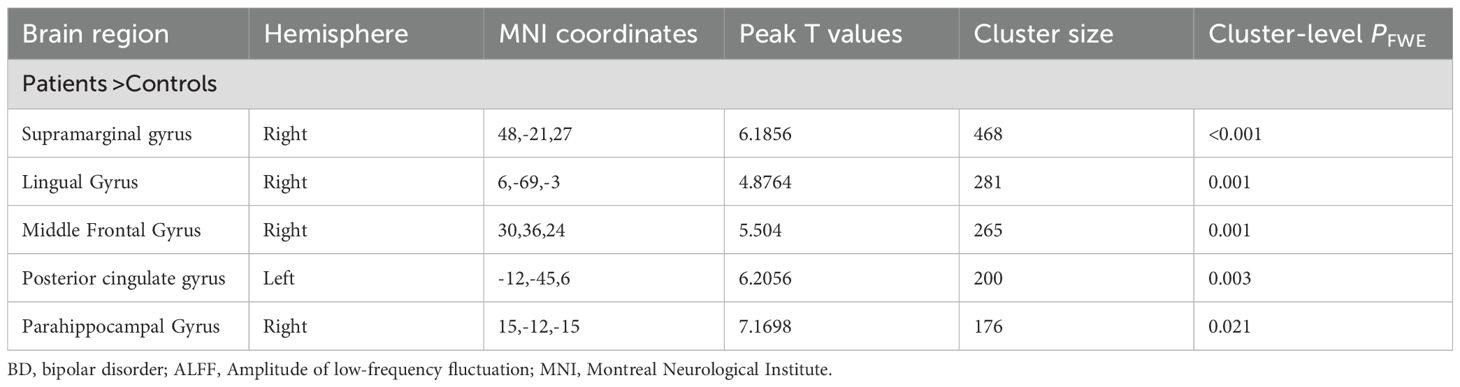
Table 2. Between-group differences in the ALFF analyses between the patients with BD and the healthy controls.
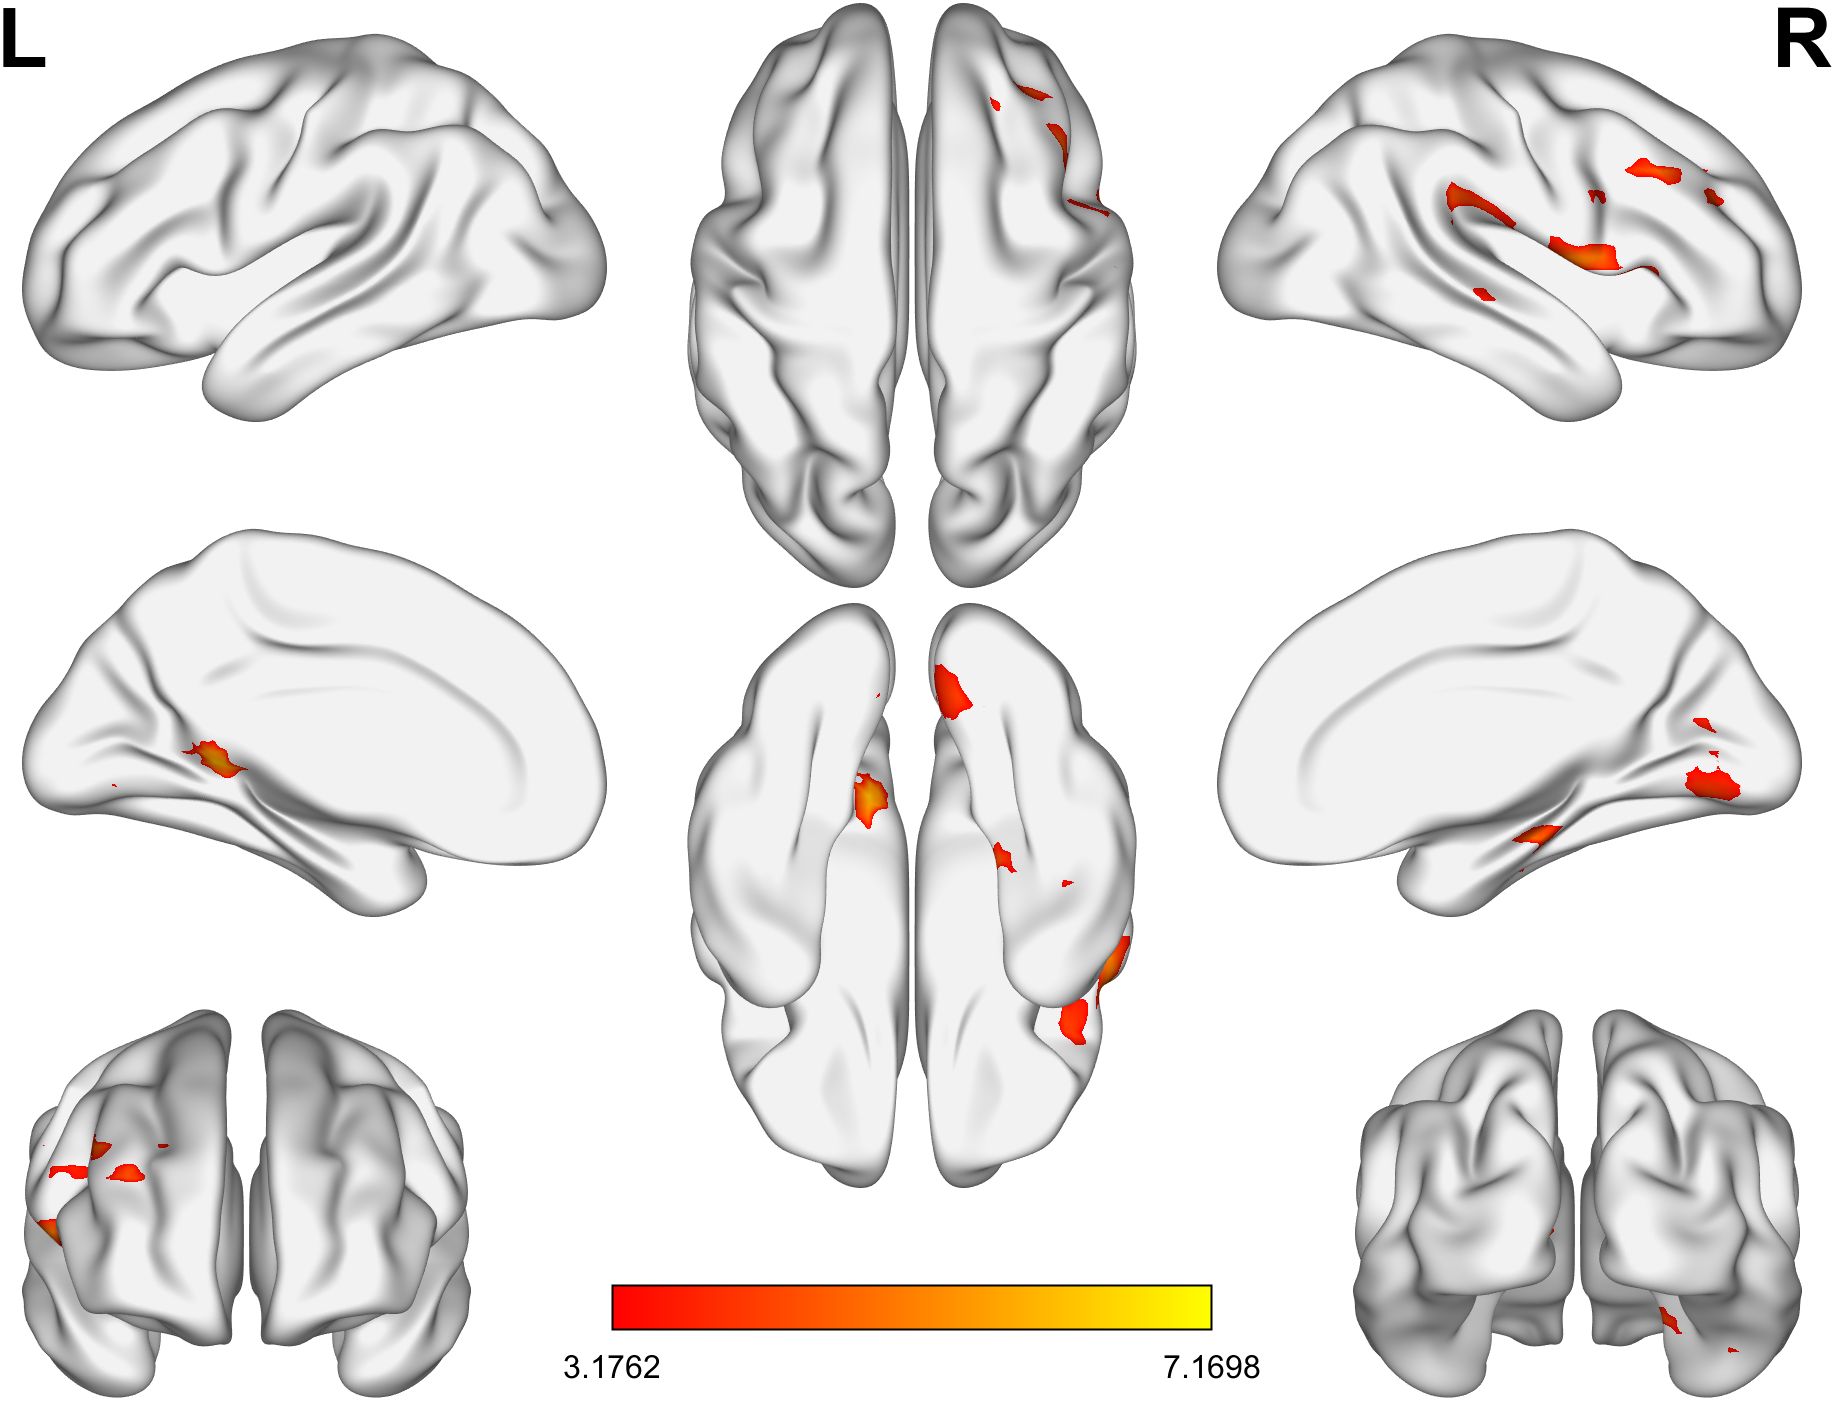
Figure 1. The brain regions in the BD group with significantly lower ALFF values than the HC group. BD, bipolar disorder; ALFF, amplitude of low-frequency fluctuation; HC, healthy control.
As for ReHo, in the BD group, the ReHo values of the right supramarginal gyrus and the left superior occipital gyrus were significantly increased, while those of the left superior frontal gyrus, the left parietal gyrus, the right parietal gyrus, the right middle frontal gyrus and the right middle temporal gyrus were significantly decreased (Table 3, Figure 2).
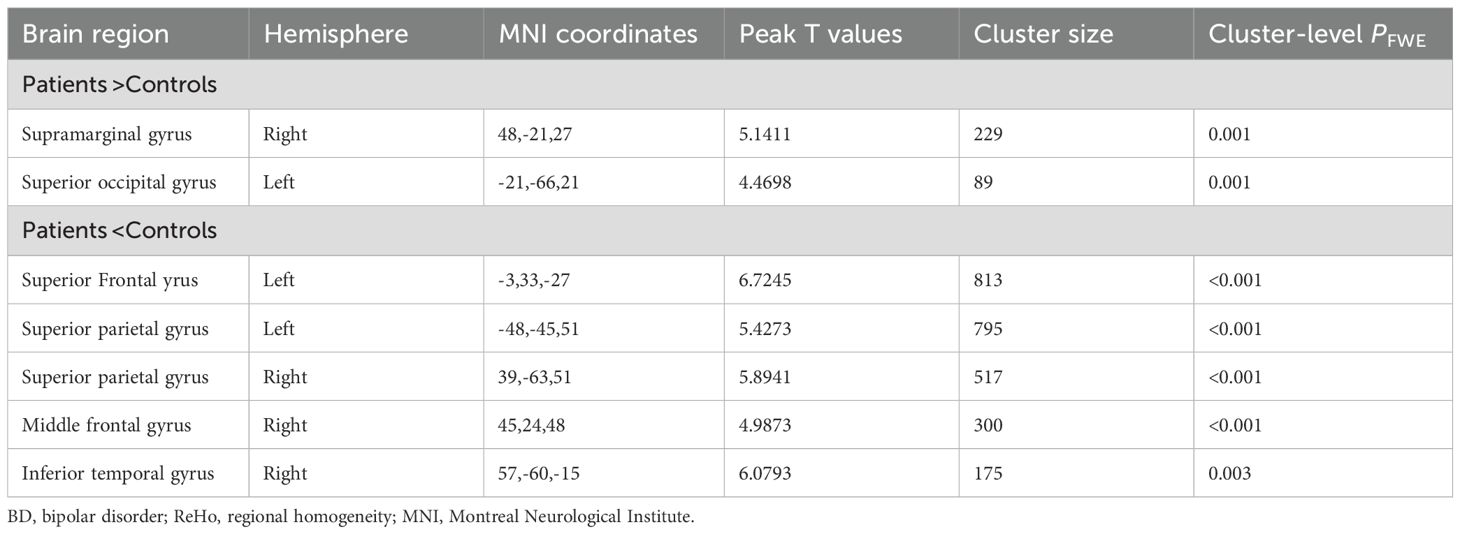
Table 3. Between-group differences in the ReHo analyses between the patients with BD and the healthy controls.
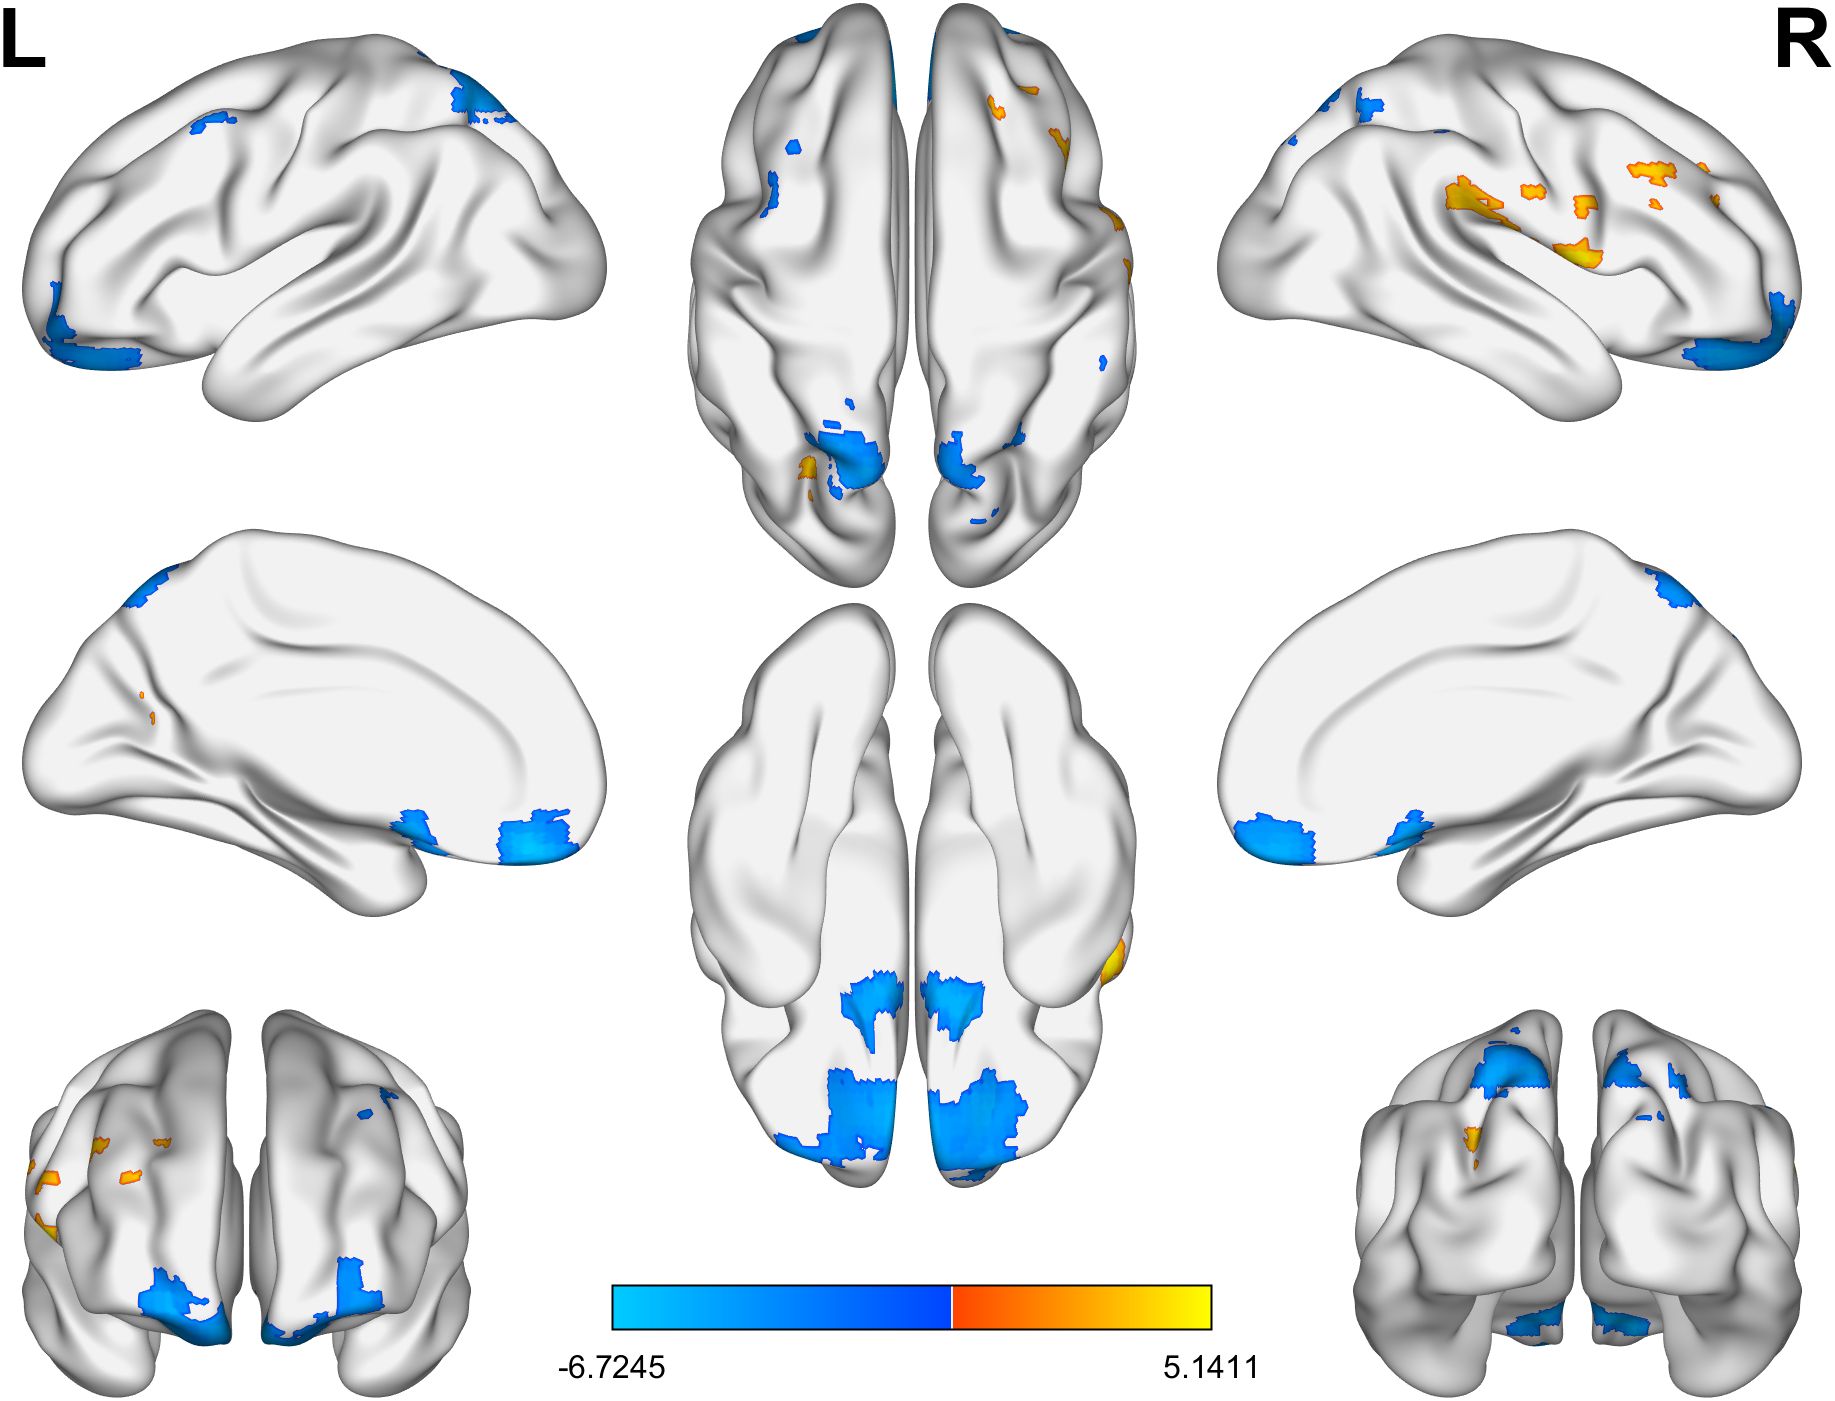
Figure 2. The brain regions with significant differences in ReHo values between the BD group and the HC group. Yellow indicates a significant increase and blue indicates a significant decrease. BD, bipolar disorder; ReHo, regional homogeneity; HC, healthy control.
3.3 Seed-based rsFC analysis
The only overlapping region exhibiting concurrent ALFF and ReHo abnormalities in BD patients was located in the right supramarginal gyrus (185 voxels). Using this cluster as the seed (Supplementary Figure S1), we found decreased rsFC between the right supramarginal gyrus and the left middle frontal gyrus (Table 4, Figure 3).
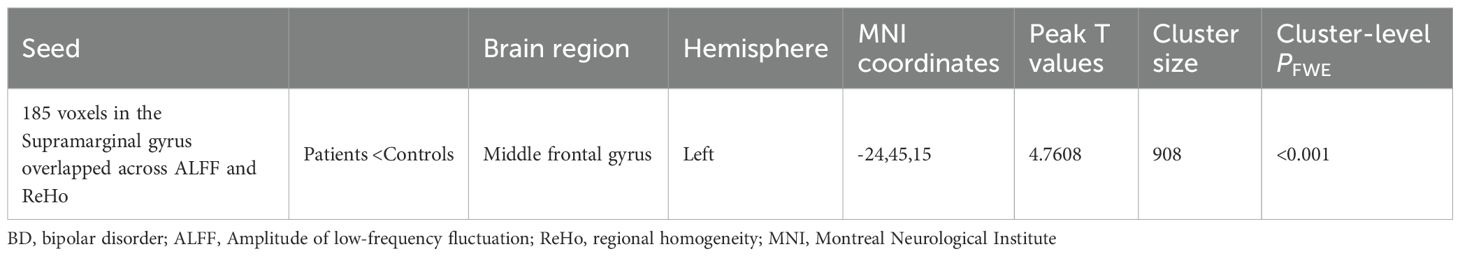
Table 4. Between-group differences in the rsFC analyses between the patients with BD and the healthy controls.
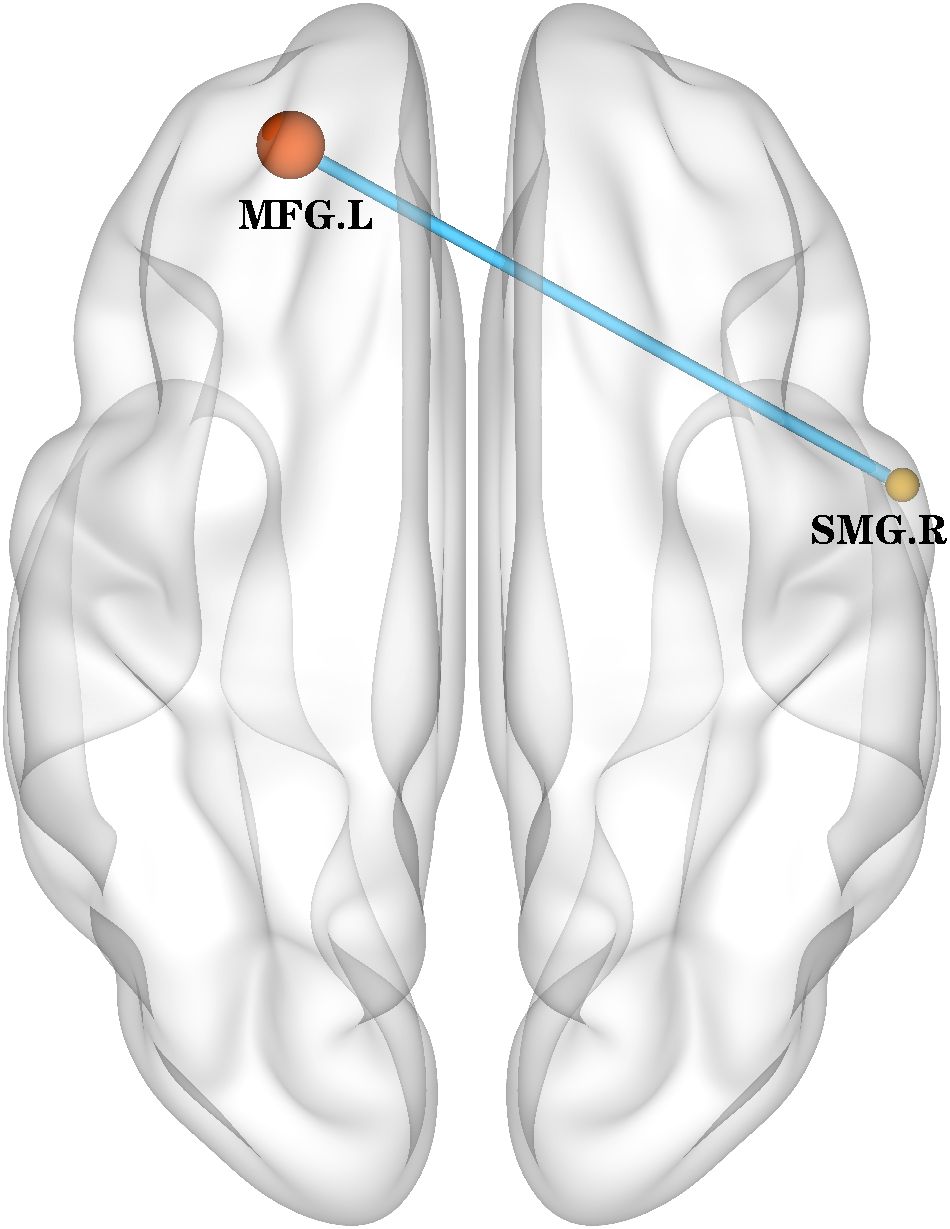
Figure 3. rsFC (using the overlapped 185 voxels as a seed) map between-group differences in the rsFC map. The rsFC between the right supramarginal gyrus and the left middle frontal gyrus was decreased. rsFC, resting-state functional connectivity; SMG.R, right Supramarginal gyrus; MFG.L, left middle frontal gyrus.
3.4 VBM analysis
Whole-brain analysis revealed that in the BD group, the gray matter volume in the left cerebellum was significantly reduced (Supplementary Table S2, Supplementary Figure S2). No regions showed increased gray matter volume.
3.5 Correlation analysis
We did not find a significant statistical correlation between the abnormal brain regions of ALFF and ReHo in the BD group and the total scores of HAMD, HAMA, and YMRS (all P > 0.017).
4 Discussion
In this article, we used two main functional indicators (ALFF and ReHo) to measure the spontaneous activities of local activity connections to the network and functional connections. Our results show that in patients diagnosed with BD, significant increases in ALFF were observed in the left posterior cingulate gyrus and the right parahippocampal gyrus (key nodes in the DMN). In the BD group, increased ALFF was observed in both the right middle frontal gyrus and the right supramarginal gyrus, suggesting a possible compensatory mechanism in these regions. However, ReHo was significantly decreased in several FPN-related regions, including the left superior frontal gyrus, right middle frontal gyrus, right inferior temporal gyrus, and bilateral parietal gyrus, suggesting a decline in their internal functional integration ability. Furthermore, using the overlapping region of the right supramarginal gyrus (the key node in the FPN) as the seed point of rsFC, we found that the rsFC within the FPN decreased, specifically manifested as the reduction of rsFC between the right supramarginal gyrus and the left middle frontal gyrus. Furthermore, we found that the gray matter volume in the posterior cerebellar lobe of BD patients was atrophied.
We used two functional indicators and found that compared with the healthy control group, the ALFF and ReHo values of BD patients in the DMN were increased. The increase of ALFF indicates an increase in local BOLD signal fluctuations (28, 29). The increase of ReHo indicates an increase in the synchronization ability of the related voxels (30). Most previous studies have suggested that patients with BD mainly present with functional abnormalities in the inferior frontal gyrus, middle frontal gyrus, anterior central gyrus and insula, mainly belonging to FPN and DMN (31–34). These results are consistent with those of our study. All in all, past and present studies have repeatedly emphasized the importance of DMN and FPN during the stable period of BD, which may indicate that they are involved in this pathological process. Previous studies have found that the low connectivity between the anterior and posterior DMN in manic BD patients and HC patients may be related to the attention pattern of over-focusing on external stimuli at the expense of internal reflexes (35). However, using independent component analysis have found that there is no difference in rsFC of DMN between BD patients and HC patients during the clinical remission period (36), and even there is no low connectivity in BD patients in remission (37, 38). This inconsistency might be caused by the heterogeneity of the samples, such as different types of BD or histories of mental illness. Abnormalities within the DMN are common, but they are reversed between the acute state and the remission state, which means that DMN injury is a characteristic of this disease and has different effects on BD individuals under different emotional states.
Subsequent rsFC analysis revealed that the connectivity of the left superior frontal gyrus and the left middle frontal gyrus (key nodes within the FPN network) in BD patients was low. Research reports indicate that compared with the control group, FC in the FPN of BD patients is reduced (39), which is consistent with our research results. However, Cipriani and Lu et al. found that, when it comes to the relationship between FPN and other networks, different studies gave completely opposite results. During the mitigation period, there was no significant difference between FPN and other networks (40, 41). However, a meta-analysis by Gong et al. observed low connectivity between FPN and DMN (42). On the contrary, Favre et al. reported an increase in the connection strength between FPN and DMN in BD with normal mood (43). The connection between FPN and DMN has not only been strengthened but also weakened. Our research has also found functional abnormalities of DMN, but no connection abnormalities between FPN and DMN have been found. This indicates that the inconsistent results may stem from the differences in the samples (such as BD subtypes, emotional states). In the future, a large amount of data will be needed for classification to further verify the results under different subtypes and different emotional states.
Whole-brain analysis revealed that BD presented a reduction in gray matter volume in the cerebellum. Previous studies have found that the volume of gray matter in the right cerebellum of BD patients is reduced (44), which is consistent with our research results. A topographic meta-analysis method used in functional neuroimaging studies indicates that this posterior cerebellar hemisphere region may be involved in higher-level tasks, including language and executive functions. With the activation of the posterior worm, the Crus I region, as part of the limbic circuit of the cerebellum, is also associated with emotion processing (45). A functional neuroimaging study on the cerebellum has shown that the reduction of FC in the cerebellum in BD patients involves the prefrontal lobe, cingulate gyrus, parietal lobe, temporal lobe, occipital bone and thalamic regions (46). Our study found that the ReHo of the left superior frontal gyrus, left parietal gyrus, right parietal gyrus, right middle frontal gyrus and right middle temporal gyrus was significantly reduced. This might be a functional disorder caused by cerebellar atrophy, especially in the context of rapid neural development during adolescence.
Previous studies have indicated that the cerebellum can be functionally subdivided into distinct regions based on its connectivity with the cerebrum. The posterior lobe of the cerebellum is associated with cognition and is connected to associative areas such as the prefrontal cortex, whereas the anterior cerebellum may modulate sensorimotor cortical activity. Given the uniform cytoarchitecture of the cerebellar cortex across lobules (47), it has been proposed that the cerebellum regulates both sensorimotor and associative cortical regions in a comparable manner. Similar to lesions in sensorimotor areas of the cerebellum, which lead to motor impairments (48), abnormalities in cerebellar regions involved in executive function and emotional regulation may contribute to cognitive dysfunctions. This concept has been proposed to explain symptoms of psychiatric disorders such as schizophrenia and mood symptoms (48, 49).
A previous meta-analysis of numerous neuroimaging studies revealed aberrant functional connectivity between the DMN and the FPN, accompanied by gray matter alterations within these networks. Reduced gray matter volume suggests potential neuronal loss, providing a biological basis for the observed abnormalities in functional connectivity (7). It is well-established that structural impairment inevitably leads to functional deficits within neural circuits. Building on earlier research in BD demonstrating abnormal functional connectivity between the cerebellum and the frontal and temporal lobes as well as the thalamus, we hypothesize that cerebellar gray matter atrophy may share underlying neural mechanisms with the functional alterations observed between the DMN and FPN. This structure-function coupling might be an important biomarker for the occurrence of BD. In the future, it is necessary to combine the development of neuroscience to explore whether these abnormalities are related to the asynchronous development of the brain during adolescence.
In the analysis of clinical scales, we did not observe any significant correlations. Previous studies have indicated differences in gender and subtypes among patients with BD) (50, 51). We speculate that this may be related to disease subtypes and patient gender. However, as we did not specifically investigate gender and disease subtypes, this represents a limitation of the present study.
Our study has several limitations that should be acknowledged. Firstly, there is heterogeneity in the emotional state of patients. In the future, more patients with the same emotional state need to be recruited to determine whether there are specific changes in the classification of disease subtypes. Secondly, and the use of drugs has not been strictly controlled, which may have a certain impact on the results. In future research, the types and dosages of drugs should be strictly controlled. Thirdly, We observed some misalignment in the image registration for part of the data, and future studies need to apply stricter registration standards to further validate the results.
5 Conclusions
This study provides novel insights into the neural underpinnings of adolescent bipolar disorder by combining ALFF, ReHo, rsFC, and GMV analyses. We demonstrated functional hyperactivity in DMN and limbic-related regions and reduced functional integration within the FPN. Furthermore, cerebellar gray matter atrophy may underlie broader functional disturbances observed in BD. Together, these multimodal findings support the notion that both functional and structural abnormalities are critical to the pathophysiology of adolescent BD. These alterations may serve as potential imaging biomarkers for early identification and intervention.
Data availability statement
The raw data supporting the conclusions of this article will be made available by the authors, without undue reservation.
Ethics statement
The current research has been approved by the Institutional Review Committee of Shiyan Taihe Hospital Affiliated to Hubei University of Medicine and Pharmacy. The studies were conducted in accordance with the local legislation and institutional requirements. Written informed consent for participation in this study was provided by the participants’ legal guardians/next of kin.
Author contributions
PZ: Conceptualization, Data curation, Formal Analysis, Methodology, Visualization, Writing – original draft, Writing – review & editing. YW: Data curation, Methodology, Software, Validation, Writing – original draft. JX: Data curation, Methodology, Software, Validation, Writing – original draft. JG: Data curation, Methodology, Software, Validation, Writing – original draft. XC: Data curation, Investigation, Supervision, Writing – original draft. FC: Data curation, Investigation, Supervision, Writing – original draft. LZ: Data curation, Investigation, Supervision, Writing – original draft. CA: Data curation, Investigation, Resources, Supervision, Writing – original draft. KQ: Conceptualization, Formal Analysis, Funding acquisition, Methodology, Visualization, Writing – review & editing. WC: Formal Analysis, Funding acquisition, Methodology, Project administration, Resources, Supervision, Visualization, Writing – review & editing.
Funding
The author(s) declare financial support was received for the research and/or publication of this article. This study was funded by Hubei Provincial Natural Science Foundation of China (Grant Nos. 2024AFB366 (KQ); 2023AFC033(WC)).
Conflict of interest
The authors declare that the research was conducted in the absence of any commercial or financial relationships that could be construed as a potential conflict of interest.
Generative AI statement
The author(s) declare that no Generative AI was used in the creation of this manuscript.
Any alternative text (alt text) provided alongside figures in this article has been generated by Frontiers with the support of artificial intelligence and reasonable efforts have been made to ensure accuracy, including review by the authors wherever possible. If you identify any issues, please contact us.
Publisher’s note
All claims expressed in this article are solely those of the authors and do not necessarily represent those of their affiliated organizations, or those of the publisher, the editors and the reviewers. Any product that may be evaluated in this article, or claim that may be made by its manufacturer, is not guaranteed or endorsed by the publisher.
Supplementary material
The Supplementary Material for this article can be found online at: https://www.frontiersin.org/articles/10.3389/fpsyt.2025.1664729/full#supplementary-material
References
1. Grande I, Berk M, Birmaher B, and Vieta E. Bipolar disorder. Lancet. (2016) 387:1561–72. doi: 10.1016/S0140-6736(15)00241-X
2. Alonso-Lana S, Goikolea JM, Bonnin CM, Sarró S, Segura B, Amann BL, et al. Structural and functional brain correlates of cognitive impairment in euthymic patients with bipolar disorder. PloS One. (2016) 11:e0158867. doi: 10.1371/journal.pone.0158867
3. Bolton S, Warner J, Harriss E, Geddes J, and Saunders KEA. Bipolar disorder: Trimodal age-at-onset distribution. Bipolar Disord. (2021) 23:341–56. doi: 10.1111/bdi.13016
4. Phillips ML and Swartz HA. A critical appraisal of neuroimaging studies of bipolar disorder: toward a new conceptualization of underlying neural circuitry and a road map for future research. Am J Psychiatry. (2014) 171:829–43. doi: 10.1176/appi.ajp.2014.13081008
5. Townsend J and Altshuler LL. Emotion processing and regulation in bipolar disorder: a review. Bipolar Disord. (2012) 14:326–39. doi: 10.1111/j.1399-5618.2012.01021.x
6. Vargas C, López-Jaramillo C, and Vieta E. A systematic literature review of resting state network–functional MRI in bipolar disorder. J Affect Disord. (2013) 150:727–35. doi: 10.1016/j.jad.2013.05.083
7. Sha Z, Wager TD, Mechelli A, and He Y. Common dysfunction of large-scale neurocognitive networks across psychiatric disorders. Biol Psychiatry. (2019) 85:379–88. doi: 10.1016/j.biopsych.2018.11.011
8. Perry A, Roberts G, Mitchell PB, and Breakspear M. Connectomics of bipolar disorder: a critical review, and evidence for dynamic instabilities within interoceptive networks. Mol Psychiatry. (2019) 24:1296–318. doi: 10.1038/s41380-018-0267-2
9. Narvacan K, Treit S, Camicioli R, Martin W, and Beaulieu C. Evolution of deep gray matter volume across the human lifespan. Hum Brain Mapp. (2017) 38:3771–90. doi: 10.1002/hbm.23604
10. Geary DC. Evolutionary perspective on sex differences in the expression of neurological diseases. Prog Neurobiol. (2019) 176:33–53. doi: 10.1016/j.pneurobio.2018.06.001
11. Whitwell JL. Voxel-based morphometry: an automated technique for assessing structural changes in the brain. J Neurosci. (2009) 29:9661–4. doi: 10.1523/jneurosci.2160-09.2009
12. Lu X, Zhong Y, Ma Z, Wu Y, Fox PT, Zhang N, et al. Structural imaging biomarkers for bipolar disorder: Meta-analyses of whole-brain voxel-based morphometry studies. Depress Anxiety. (2019) 36:353–64. doi: 10.1002/da.22866
13. Späti J, Hänggi J, Doerig N, Ernst J, Sambataro F, Brakowski J, et al. Prefrontal thinning affects functional connectivity and regional homogeneity of the anterior cingulate cortex in depression. Neuropsychopharmacology. (2015) 40:1640–8. doi: 10.1038/npp.2015.8
14. Van Tol MJ, Li M, Metzger CD, Hailla N, Horn DI, Li W, et al. Local cortical thinning links to resting-state disconnectivity in major depressive disorder. Psychol Med. (2014) 44:2053–65. doi: 10.1017/s0033291713002742
15. Zhang Y, Zheng J, Fan X, Guo X, Guo W, Yang G, et al. Dysfunctional resting-state connectivities of brain regions with structural deficits in drug-naive first-episode schizophrenia adolescents. Schizophr Res. (2015) 168:353–9. doi: 10.1016/j.schres.2015.07.031
16. Doucet GE, He X, Sperling M, Sharan A, and Tracy JI. Gray matter abnormalities in temporal lobe epilepsy: relationships with resting-state functional connectivity and episodic memory performance. PloS One. (2016) 11:e0154660. doi: 10.1371/journal.pone.0154660
17. Canu E, Agosta F, Sarasso E, Volontè MA, Basaia S, Stojkovic T, et al. Brain structural and functional connectivity in Parkinson's disease with freezing of gait. Hum Brain Mapp. (2015) 36:5064–78. doi: 10.1002/hbm.22994
18. Zarp Petersen J, Varo C, Skovsen CF, Ott CV, Kjaerstad HL, Vieta E, et al. Neuronal underpinnings of cognitive impairment in bipolar disorder: A large data-driven functional magnetic resonance imaging study. Bipolar Disord. (2022) 24:69–81. doi: 10.1111/bdi.13100
19. Kollmann B, Yuen K, Scholz V, and Wessa M. Cognitive variability in bipolar I disorder: A cluster-analytic approach informed by resting-state data. Neuropharmacology. (2019) 156:107585. doi: 10.1016/j.neuropharm.2019.03.028
20. Chakrabarty T, Torres IJ, Su WW, Sawatzky R, Keramatian K, Yatham LN, et al. Cognitive subgroups in first episode bipolar I disorder: Relation to clinical and brain volumetric variables. Acta Psychiatr Scand. (2021) 143:151–61. doi: 10.1111/acps.13245
21. Njau S, Townsend J, Wade B, Hellemann G, Bookheimer S, Narr K, et al. Neural subtypes of euthymic bipolar I disorder characterized by emotion regulation circuitry. Biol Psychiatry Cognit Neurosci Neuroimaging. (2020) 5:591–600. doi: 10.1016/j.bpsc.2020.02.011
22. Kjærstad HL, Damgaard V, Knudsen GM, Vinberg M, Kessing LV, Macoveanu J, et al. Neural underpinnings of emotion regulation subgroups in remitted patients with recently diagnosed bipolar disorder. Eur Neuropsychopharmacol. (2022) 60:7–18. doi: 10.1016/j.euroneuro.2022.04.010
23. Li WH, Tang LR, Wang M, Wang JN, Guo T, He Q, et al. Altered gray matter volume and functional connectivity in medial orbitofrontal cortex of bulimia nervosa patients: A combined VBM and FC study. Front Psychiatry. (2022) 13:963092. doi: 10.3389/fpsyt.2022.963092
24. Yan CG, Wang XD, Zuo XN, and Zang YF. DPABI: data processing & Analysis for (Resting-state) brain imaging. Neuroinformatics. (2016) 14:339–51. doi: 10.1007/s12021-016-9299-4
25. Friston KJ, Williams S, Howard R, Frackowiak RS, and Turner R. Movement-related effects in fMRI time-series. Magn Reson Med. (1996) 35:346–55. doi: 10.1002/mrm.1910350312
26. Power JD, Barnes KA, Snyder AZ, Schlaggar BL, and Petersen SE. Spurious but systematic correlations in functional connectivity MRI networks arise from subject motion. Neuroimage. (2012) 59:2142–54. doi: 10.1016/j.neuroimage.2011.10.018
27. Power JD, Mitra A, Laumann TO, Snyder AZ, Schlaggar BL, Petersen SE, et al. Methods to detect, characterize, and remove motion artifact in resting state fMRI. Neuroimage. (2014) 84:320–41. doi: 10.1016/j.neuroimage.2013.08.048
28. Zou QH, Zhu CZ, Yang Y, Zuo XN, Long XY, Cao QJ, et al. An improved approach to detection of amplitude of low-frequency fluctuation (ALFF) for resting-state fMRI: fractional ALFF. J Neurosci Methods. (2008) 172:137–41. doi: 10.1016/j.jneumeth.2008.04.012
29. Wang JJ, Chen X, Sah SK, Zeng C, Li YM, Li N, et al. Amplitude of low-frequency fluctuation (ALFF) and fractional ALFF in migraine patients: a resting-state functional MRI study. Clin Radiol. (2016) 71:558–64. doi: 10.1016/j.crad.2016.03.004
30. Zang Y, Jiang T, Lu Y, He Y, and Tian L. Regional homogeneity approach to fMRI data analysis. Neuroimage. (2004) 22:394–400. doi: 10.1016/j.neuroimage.2003.12.030
31. Sun F, Liu Z, Yang J, Fan Z, Xi C, Cheng P, et al. Shared and distinct patterns of dynamical degree centrality in bipolar disorder across different mood states. Front Psychiatry. (2022) 13:941073. doi: 10.3389/fpsyt.2022.941073
32. Li M, Das T, Deng W, Wang Q, Li Y, Zhao L, et al. Clinical utility of a short resting-state MRI scan in differentiating bipolar from unipolar depression. Acta Psychiatr Scand. (2017) 136:288–99. doi: 10.1111/acps.12752
33. Russo D, Martino M, Magioncalda P, Inglese M, Amore M, Northoff G, et al. Opposing changes in the functional architecture of large-scale networks in bipolar mania and depression. Schizophr Bull. (2020) 46:971–80. doi: 10.1093/schbul/sbaa004
34. Skåtun KC, Kaufmann T, Tønnesen S, Biele G, Melle I, Agartz I, et al. Global brain connectivity alterations in patients with schizophrenia and bipolar spectrum disorders. J Psychiatry Neurosci. (2016) 41:331–41. doi: 10.1503/jpn.150159
35. Friston KJ, Frith CD, Liddle PF, Dolan RJ, Lammertsma AA, Frackowiak RS, et al. The relationship between global and local changes in PET scans. J Cereb Blood Flow Metab. (1990) 10:458–66. doi: 10.1038/jcbfm.1990.88
36. Eklund A, Nichols TE, and Knutsson H. Cluster failure: Why fMRI inferences for spatial extent have inflated false-positive rates. Proc Natl Acad Sci U S A. (2016) 113:7900–5. doi: 10.1073/pnas.1602413113
37. Fernández-Corcuera P, Salvador R, Monté GC, Salvador Sarró S, Goikolea JM, Amann B, et al. Bipolar depressed patients show both failure to activate and failure to de-activate during performance of a working memory task. J Affect Disord. (2013) 148:170–8. doi: 10.1016/j.jad.2012.04.009
38. Smith SM and Nichols TE. Threshold-free cluster enhancement: addressing problems of smoothing, threshold dependence and localisation in cluster inference. Neuroimage. (2009) 44:83–98. doi: 10.1016/j.neuroimage.2008.03.061
39. Liang YS, Zhou SZ, Zhang YJ, Cai XL, Wang Y, Cheung EFC, et al. Altered empathy-related resting-state functional connectivity in patients with bipolar disorder. Eur Arch Psychiatry Clin Neurosci. (2022) 272:839–48. doi: 10.1007/s00406-021-01305-4
40. Syan SK, Minuzzi L, Smith M, Allega OR, Hall GB, Frey BN, et al. Resting state functional connectivity in women with bipolar disorder during clinical remission. Bipolar Disord. (2017) 19:97–106. doi: 10.1111/bdi.12469
41. Yip SW, Mackay CE, and Goodwin GM. Increased temporo-insular engagement in unmedicated bipolar II disorder: an exploratory resting state study using independent component analysis. Bipolar Disord. (2014) 16:748–55. doi: 10.1111/bdi.12206
42. Gong J, Wang J, Chen P, Qi Z, Luo Z, Wang J, et al. Large-scale network abnormality in bipolar disorder: A multimodal meta-analysis of resting-state functional and structural magnetic resonance imaging studies. J Affect Disord. (2021) 292:9–20. doi: 10.1016/j.jad.2021.05.052
43. Favre P, Baciu M, Pichat C, Bougerol T, and Polosan M. fMRI evidence for abnormal resting-state functional connectivity in euthymic bipolar patients. J Affect Disord. (2014) 165:182–9. doi: 10.1016/j.jad.2014.04.054
44. Kim D, Cho HB, Dager SR, Yurgelun-Todd DA, Yoon S, Lee JH, et al. Posterior cerebellar vermal deficits in bipolar disorder. J Affect Disord. (2013) 150:499–506. doi: 10.1016/j.jad.2013.04.050
45. Stoodley CJ and Schmahmann JD. Evidence for topographic organization in the cerebellum of motor control versus cognitive and affective processing. Cortex. (2010) 46:831–44. doi: 10.1016/j.cortex.2009.11.008
46. Cattarinussi G, Di Giorgio A, and Sambataro F. Cerebellar dysconnectivity in schizophrenia and bipolar disorder is associated with cognitive and clinical variables. Schizophr Res. (2024) 267:497–506. doi: 10.1016/j.schres.2024.03.039
47. Zhou Y, Shi L, Cui X, Wang S, and Luo X. Functional connectivity of the caudal anterior cingulate cortex is decreased in autism. PloS One. (2016) 11:e0151879. doi: 10.1371/journal.pone.0151879
48. Schmahmann JD. Disorders of the cerebellum: ataxia, dysmetria of thought, and the cerebellar cognitive affective syndrome. J Neuropsychiatry Clin Neurosci. (2004) 16:367–78. doi: 10.1176/jnp.16.3.367
49. Andreasen NC and Pierson R. The role of the cerebellum in schizophrenia. Biol Psychiatry. (2008) 64:81–8. doi: 10.1016/j.biopsych.2008.01.003
50. Sun H, Yan R, Chen Z, Wang X, Xia Y, Hua L, et al. Common and disease-specific patterns of functional connectivity and topology alterations across unipolar and bipolar disorder during depressive episodes: a transdiagnostic study. Transl Psychiatry. (2025) 15:58. doi: 10.1038/s41398-025-03282-x
Keywords: bipolar disorder, resting-state functional magnetic resonance imaging, voxel- based morphometry, frontoparietal network, default mode network
Citation: Zhu P, Wang Y, Xiang J, Gu J, Chen X, Chen F, Zou L, Ai C, Qin K and Chen W (2025) Multimodal MRI study of gray matter and functional connectivity abnormalities in adolescents with bipolar disorder. Front. Psychiatry 16:1664729. doi: 10.3389/fpsyt.2025.1664729
Received: 12 July 2025; Accepted: 26 September 2025;
Published: 16 October 2025.
Edited by:
Roberto Esposito, Clinical Imaging and Diagnostic Center, San MarinoReviewed by:
Tianjia Zhu, University of Pennsylvania, United StatesZiyu Zhu, Sichuan University, China
Copyright © 2025 Zhu, Wang, Xiang, Gu, Chen, Chen, Zou, Ai, Qin and Chen. This is an open-access article distributed under the terms of the Creative Commons Attribution License (CC BY). The use, distribution or reproduction in other forums is permitted, provided the original author(s) and the copyright owner(s) are credited and that the original publication in this journal is cited, in accordance with accepted academic practice. No use, distribution or reproduction is permitted which does not comply with these terms.
*Correspondence: Wen Chen, dGFpaGVyZW4wMDdAMTYzLmNvbQ==