 Gui-Ling Chen
 Gui-Xin Chen2*
 Wei-Tao Wan
- 1Department of Psychiatry, Tianyou Hospital Affiliated to Wuhan University of Science & Technology, Wuhan, China
- 2Department of Neurology, Wuhan Third Hospital-Tongren Hospital of Wuhan University, Wuhan, China
Background: Lipid metabolism disorders have been implicated in the pathogenesis of depression. The atherogenic index of plasma (AIP), calculated as log(triglyerides/high-density lipoprotein cholesterol), is a convenient marker reflecting lipid profiles and cardiovascular risk. However, the relationship between the AIP and depression remains unclear.
Methods: Relevant observational studies were identified through comprehensive searches of the PubMed, EMBASE, and Web of Science databases. Studies were included if they reported AIP values and diagnosed depression using standardized assessment tools. A total of 10 observational studies, encompassing 38,785 participants, were included. Subgroup analyses were conducted to assess the impact of age and diagnostic criteria on the association. Heterogeneity was assessed using the I² statistic, and publication bias was evaluated using funnel plots and Egger’s test.
Results: Individuals with depression had significantly higher AIP values compared with healthy controls (mean difference = 0.07; 95% confidence interval: 0.03–0.11; P = 0.0006). High heterogeneity was observed (I² = 94%, P < 0.00001). The funnel plot showed slight asymmetry; however, Egger’s test indicated no significant publication bias (P = 0.354). Sensitivity analyses confirmed the robustness of the findings.
Conclusion: Higher AIP values are associated with an increased risk of depression, particularly in individuals aged ≥50 years. Given its accessibility, the AIP may serve as a useful biomarker for the early identification of individuals at risk for depression. The quantification of the overall association between AIP and depression risk represents a novelty of this study and highlights AIP as an integrative lipid biomarker with potential predictive value beyond single lipid indices. Prospective studies are needed to confirm causality and explore the underlying biological mechanisms.
Systematic review registration: https://www.crd.york.ac.uk/prospero/, identifier CRD420251035701.
Introduction
Depression is a major global public health issue, significantly contributing to disability, reduced quality of life, increased risk of comorbidities, and higher mortality rates (1, 2). Current estimates indicate that more than 280 million individuals worldwide are affected by this condition, highlighting its critical importance in both clinical practice and public health policy (3, 4). Although substantial progress has been made in elucidating its underlying mechanisms, the pathophysiology of depression remains complex and multifactorial, involving pathways such as neuroinflammation, oxidative stress, neuroendocrine dysfunction, and metabolic disturbances (5–7). Among these factors, lipid metabolism disorders have garnered increasing attention, as dyslipidemia has been implicated as a potential contributor to depression risk (8, 9). Nevertheless, existing findings remain inconsistent, with studies reporting conflicting results regarding the strength and direction of this association (10–12).
The atherogenic index of plasma (AIP), calculated as the logarithmic transformation of the triglyceride (TG) to high-density lipoprotein cholesterol (HDL-C) ratio [log(TG/HDL-C)], has emerged as a robust marker reflecting both lipid metabolic dysfunction and cardiovascular risk profiles (13, 14). Compared with conventional lipid indices, the AIP offers a more comprehensive evaluation by capturing the balance between pro-atherogenic and anti-atherogenic lipoprotein levels. Notably, elevated AIP values have been associated with systemic inflammation, endothelial dysfunction, and insulin resistance—biological processes that may also contribute to the development of depression (15).
Recently, epidemiological investigations have begun to explore the potential relationship between the AIP and depression, particularly among subpopulations such as individuals with metabolic syndrome, cardiovascular disorders, or obesity (16). Mechanistically, dysregulated lipid metabolism may influence neural structure and function through inflammatory and oxidative pathways, thereby playing a role in affective mood disorder (17, 18). However, the current body of evidence remains fragmented, and the strength and consistency of this association are uncertain due to methodological heterogeneity across studies, including variations in study design, sample characteristics, and analytical approaches (19, 20).
Given these limitations, a meta-analysis is necessary to systematically synthesize the existing literature and provide a quantitative assessment of the association between the AIP and depression risk. This analysis may help clarify the potential role of lipid metabolic dysregulation in depressive disorders and inform strategies for early identification, risk stratification, and targeted intervention in at-risk populations.
Methods
This meta-analysis was conducted in accordance with the guidelines outlined in the Cochrane Handbook for Systematic Reviews of Interventions and the Preferred Reporting Items for Systematic Reviews and Meta-Analysis (PRISMA) guidelines (21, 22). The study protocol was registered with PROSPERO under the registration code CRD420251035701.
Literature search
To comprehensively identify studies relevant to the aim of this meta-analysis, a systematic search was conducted across three major databases: PubMed, Embase, and Web of Science. The search strategy included two sets of key terms: (1) “atherogenic index of plasma” OR “AIP” OR “atherogenic index” OR “lipid indices”; and (2) “depression” OR “depressive” OR “mood” OR “affective disorder” OR “depressive symptoms” OR “depressive disorder”. The search was limited to human studies and included only full-length articles published in peer-reviewed English-language journals. Additionally, the reference lists of relevant original and review articles were manually screened to identify any additional eligible studies. The search covered literature from the inception of each database through April 5, 2025.
Inclusion criteria
Studies were included in this meta-analysis if they met the following criteria: (1) involved adult populations (aged 18 years or older), without specifically excluding individuals with pre-existing cardiovascular diseases or other chronic conditions; (2) measured AIP using the formula log(TG/HDL-C) or reported TG and HDL-C levels; (3) compared individuals with varying levels of AIP (e.g., high vs. low) or assessed AIP as a continuous variable; (4) reported the incidence or prevalence of depression in relation to AIP; (5) employed an observational study design, including cross-sectional, case-control, or cohort study designs; and (6) were published as full-length articles in peer-reviewed English-language journals.
Exclusion criteria
Studies were excluded if they met any of the following criteria: (1) involved children or adolescents less than 18 years of age; (2) focused on patients with specific diseases rather than a general population; (3) did not measure AIP, used alternative lipid markers without calculating AIP, or reported insufficient data for calculation of AIP; (4) lacked a comparison group or did not assess the association between AIP and depression; (5) did not report on depression or used non-validated measures to assess depressive symptoms; or (6) were reviews, editorials, preclinical studies, or studies published only as abstracts.
Study selection and data extraction
Two independent reviewers performed the study selection and data extraction using a pre-defined standardized form. For studies with unclear methodological details, the reviewers contacted the original authors to obtain additional information. Any disagreements between the reviewers were resolved through discussion or, if necessary, by consulting with a third senior investigator to reach a consensus. Extracted data included the first author’s name, publication year, country or region, participant age, sex distribution, study design, total sample size, methods used to assess depression, number of participants diagnosed with depression, and covariates for which adjustment was made in the analysis of the association between the AIP and depression.
Quality assessment
The quality of the included studies was assessed using the Newcastle–Ottawa Scale (NOS) (23, 24), which evaluates methodological quality across three domains: selection, comparability, and outcome (or exposure). Studies scoring more than 6 out of a maximum of 9 points were considered high quality. Two reviewers independently conducted the quality, and any discrepancies were resolved by a third reviewer.
Statistical analysis
Statistical analysis was performed according to the Cochrane Collaboration guidelines (25). Association between AIP and depression was expressed as odds ratio (OR) with 95% confidence interval (CI). ORs and standard errors (SEs) were derived from reported CIs or p-values and log-transformed to stabilize variance and normalize distributions. For continuous outcomes, mean differences (MDs) with corresponding 95% CIs were calculated to compare AIP values between patients and controls. Heterogeneity was assessed using the Cochrane Q test and I² statistic, with an I² value greater than 50% indicating significant heterogeneity (26). A fixed-effects model was employed if no statistical heterogeneity (P > 0.1, I² < 50%) was observed; otherwise, a random-effects model was utilized. Subgroup analyses explored the impact of study characteristics on outcomes. Publication bias was evaluated using the funnel plot and Egger’s test (27). All statistical analyses were performed using RevMan software (version 5.4, Cochrane Collaboration, Oxford, UK) and Stata software (version 14.0, Stata Corporation, College Station, TX), with P-values < 0.05 considered statistically significant.
Results
Basic characteristics and quality assessment
The PRISMA flowchart is presented in Figure 1. Our initial literature search identified 735 studies from the PubMed, EMBASE, and Web of Science databases. Of these, 129 were duplicates, and 56 were reviews, meta-analyses, or letters. After screening of titles and abstracts, 491 studies were deemed irrelevant, and 23 were excluded for not being clinical studies. Consequently, the full texts of the remaining 36 records were assessed independently by two authors, leading to the exclusion of 26 studies for various reasons. Finally, 10 observational studies, including 5 cross-sectional studies (28–32) and 5 case-control studies (33–37), were included for subsequent quantitative analyses. These studies were published between 2009 and 2025, originating from China (3 studies), Brazil (3 studies), and one each from Poland, Turkey, Iran, and Croatia.
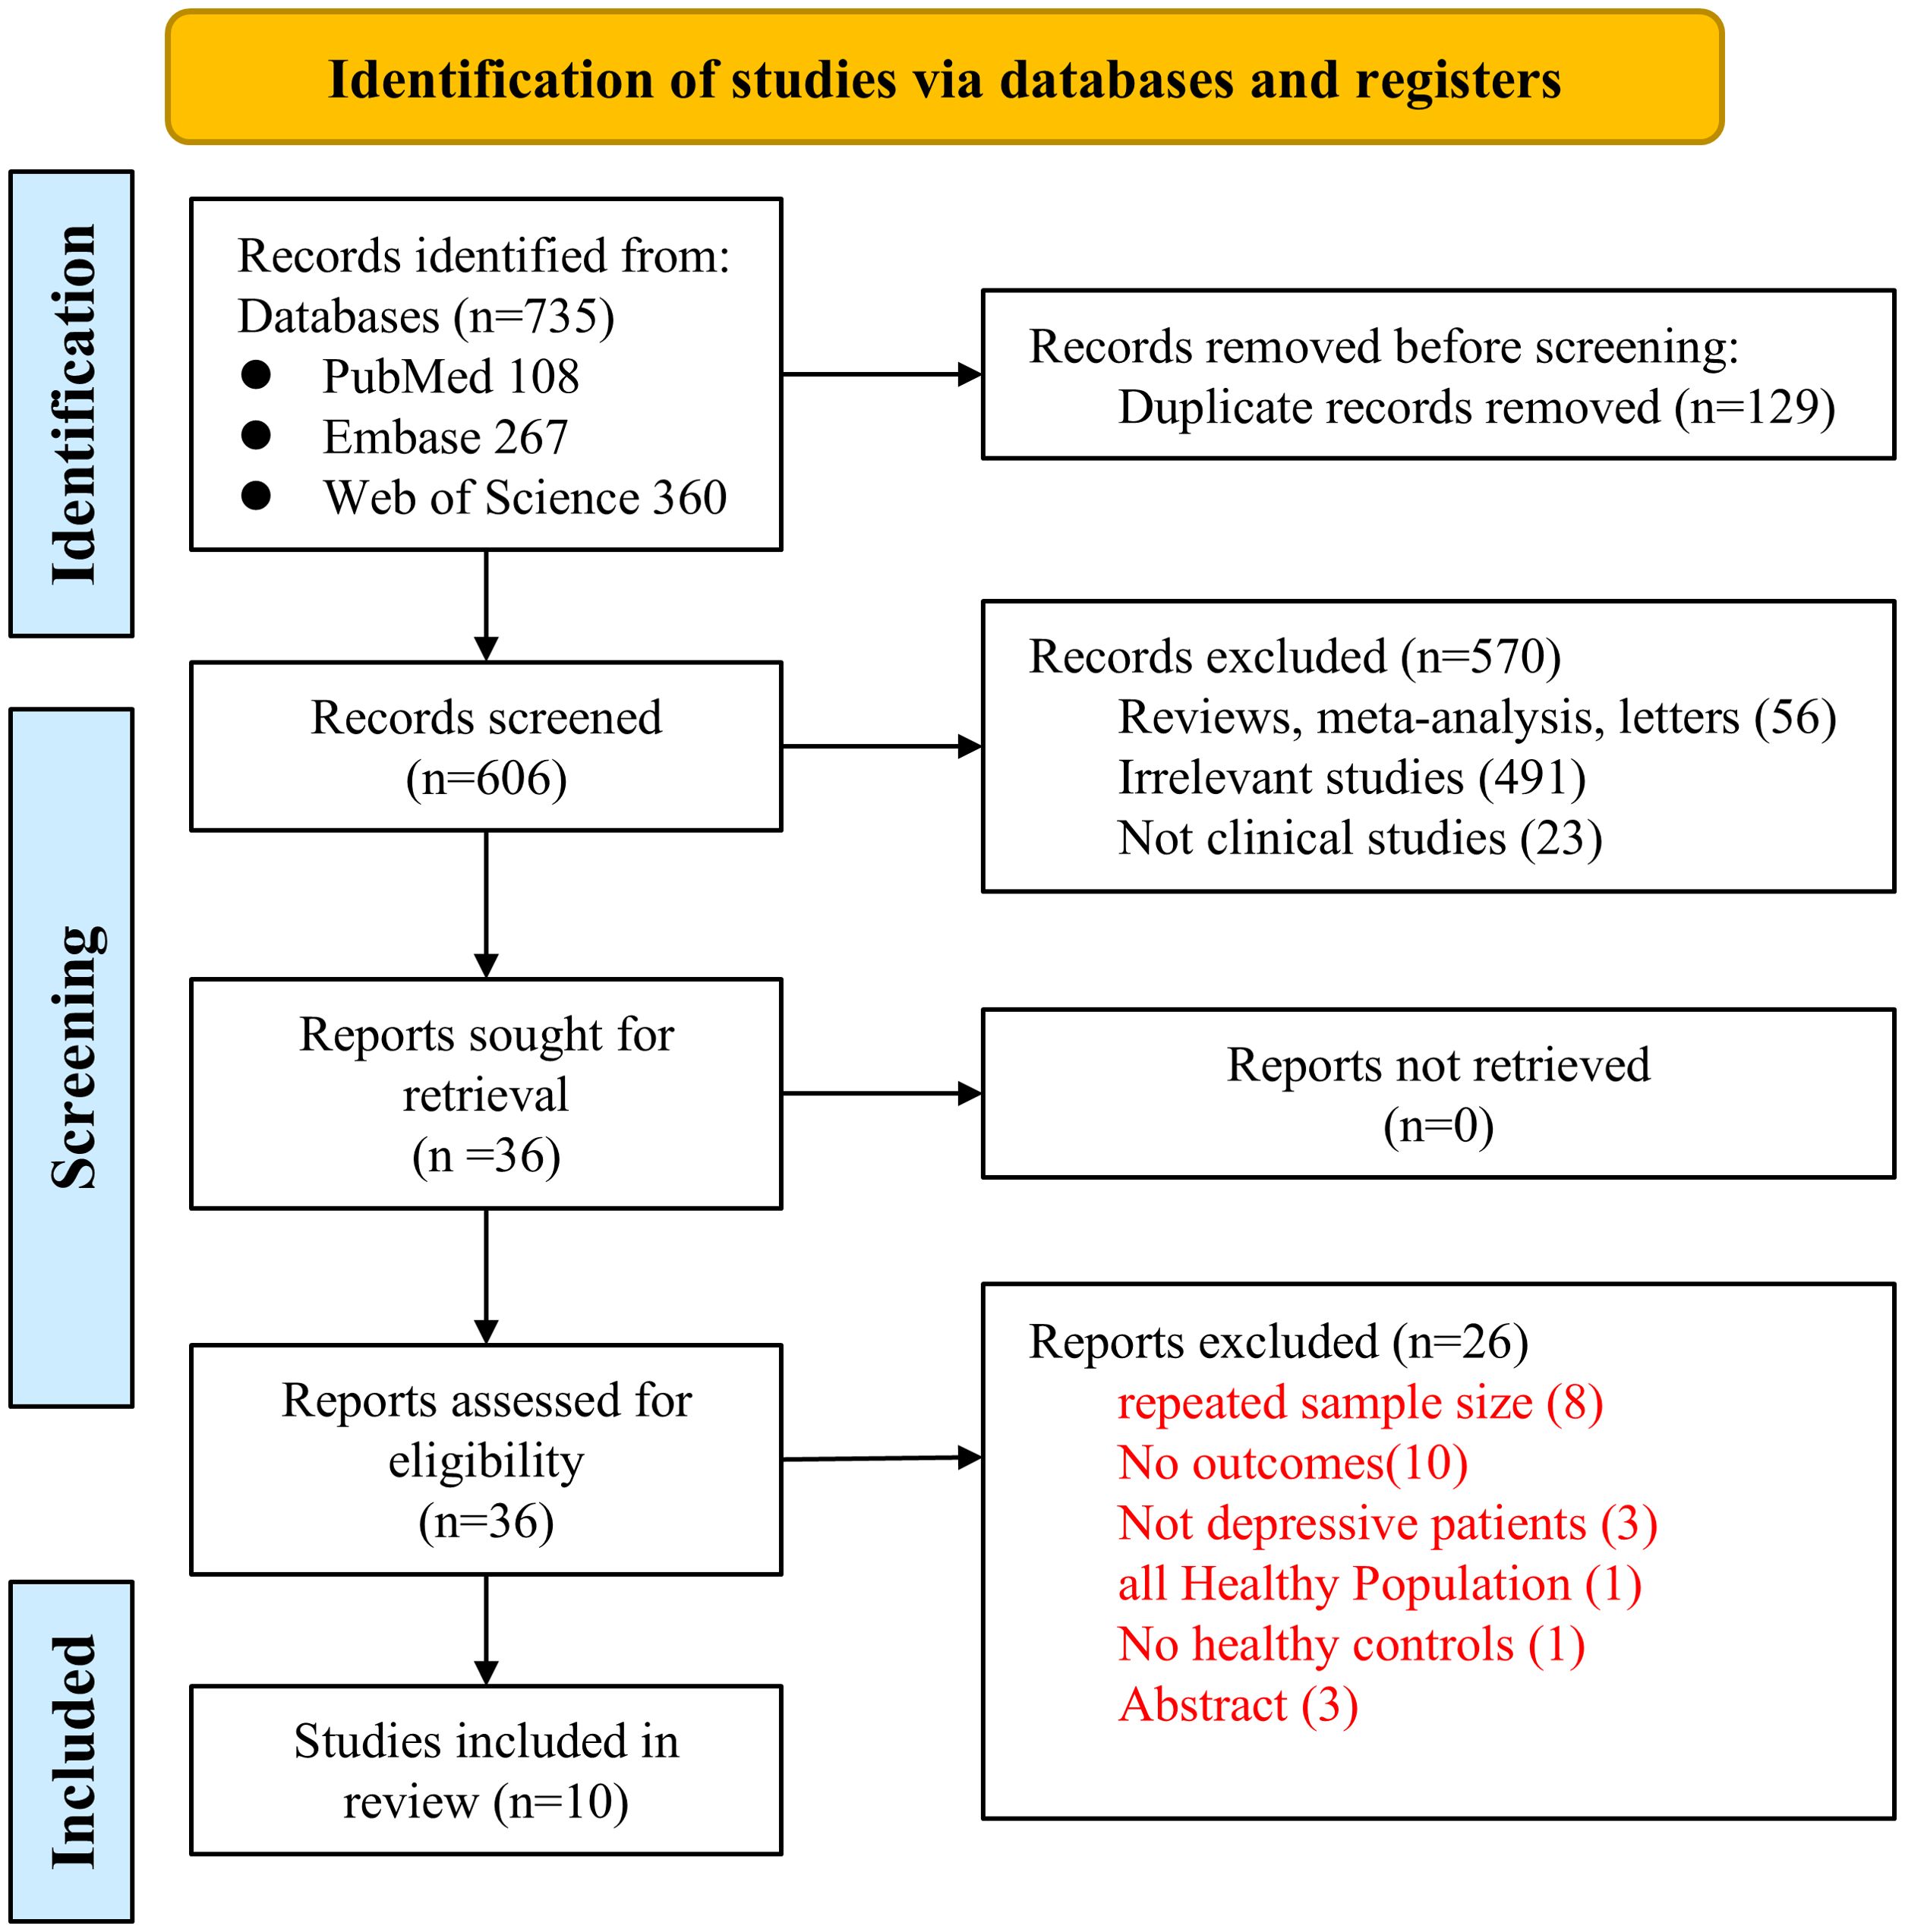
Figure 1. Flowchart of the study selection process.
The summarized characteristics of the included studies are presented in Table 1. Depression was diagnosed using various standardized assessment tools, including the Hamilton Depression Rating Scale (HAM-D), the Diagnostic and Statistical Manual of Mental Disorders, Fourth Edition (DSM-IV), the Hamilton Depression Rating Scale (HDRS), the Beck Depression Inventory (BDI) score, the Hospital Anxiety and Depression Scale (HADS), and the Patient Health Questionnaire-9 (PHQ-9). In all studies, depression diagnoses were made by trained healthcare professionals. A total of 38,785 participants were included, of whom 3,973 were diagnosed with depression. Eight studies employed multivariate analyses to assess the association between the AIP and depression, adjusting for potential confounding factors such as age, body mass index (BMI), smoking, gender, socioeconomic status, and comorbidities of varying severity. The characteristics and quality assessment of the included studies are summarized in Table 2. The NOS scores for all studies ranged from 7 to 8, indicating high methodological quality.
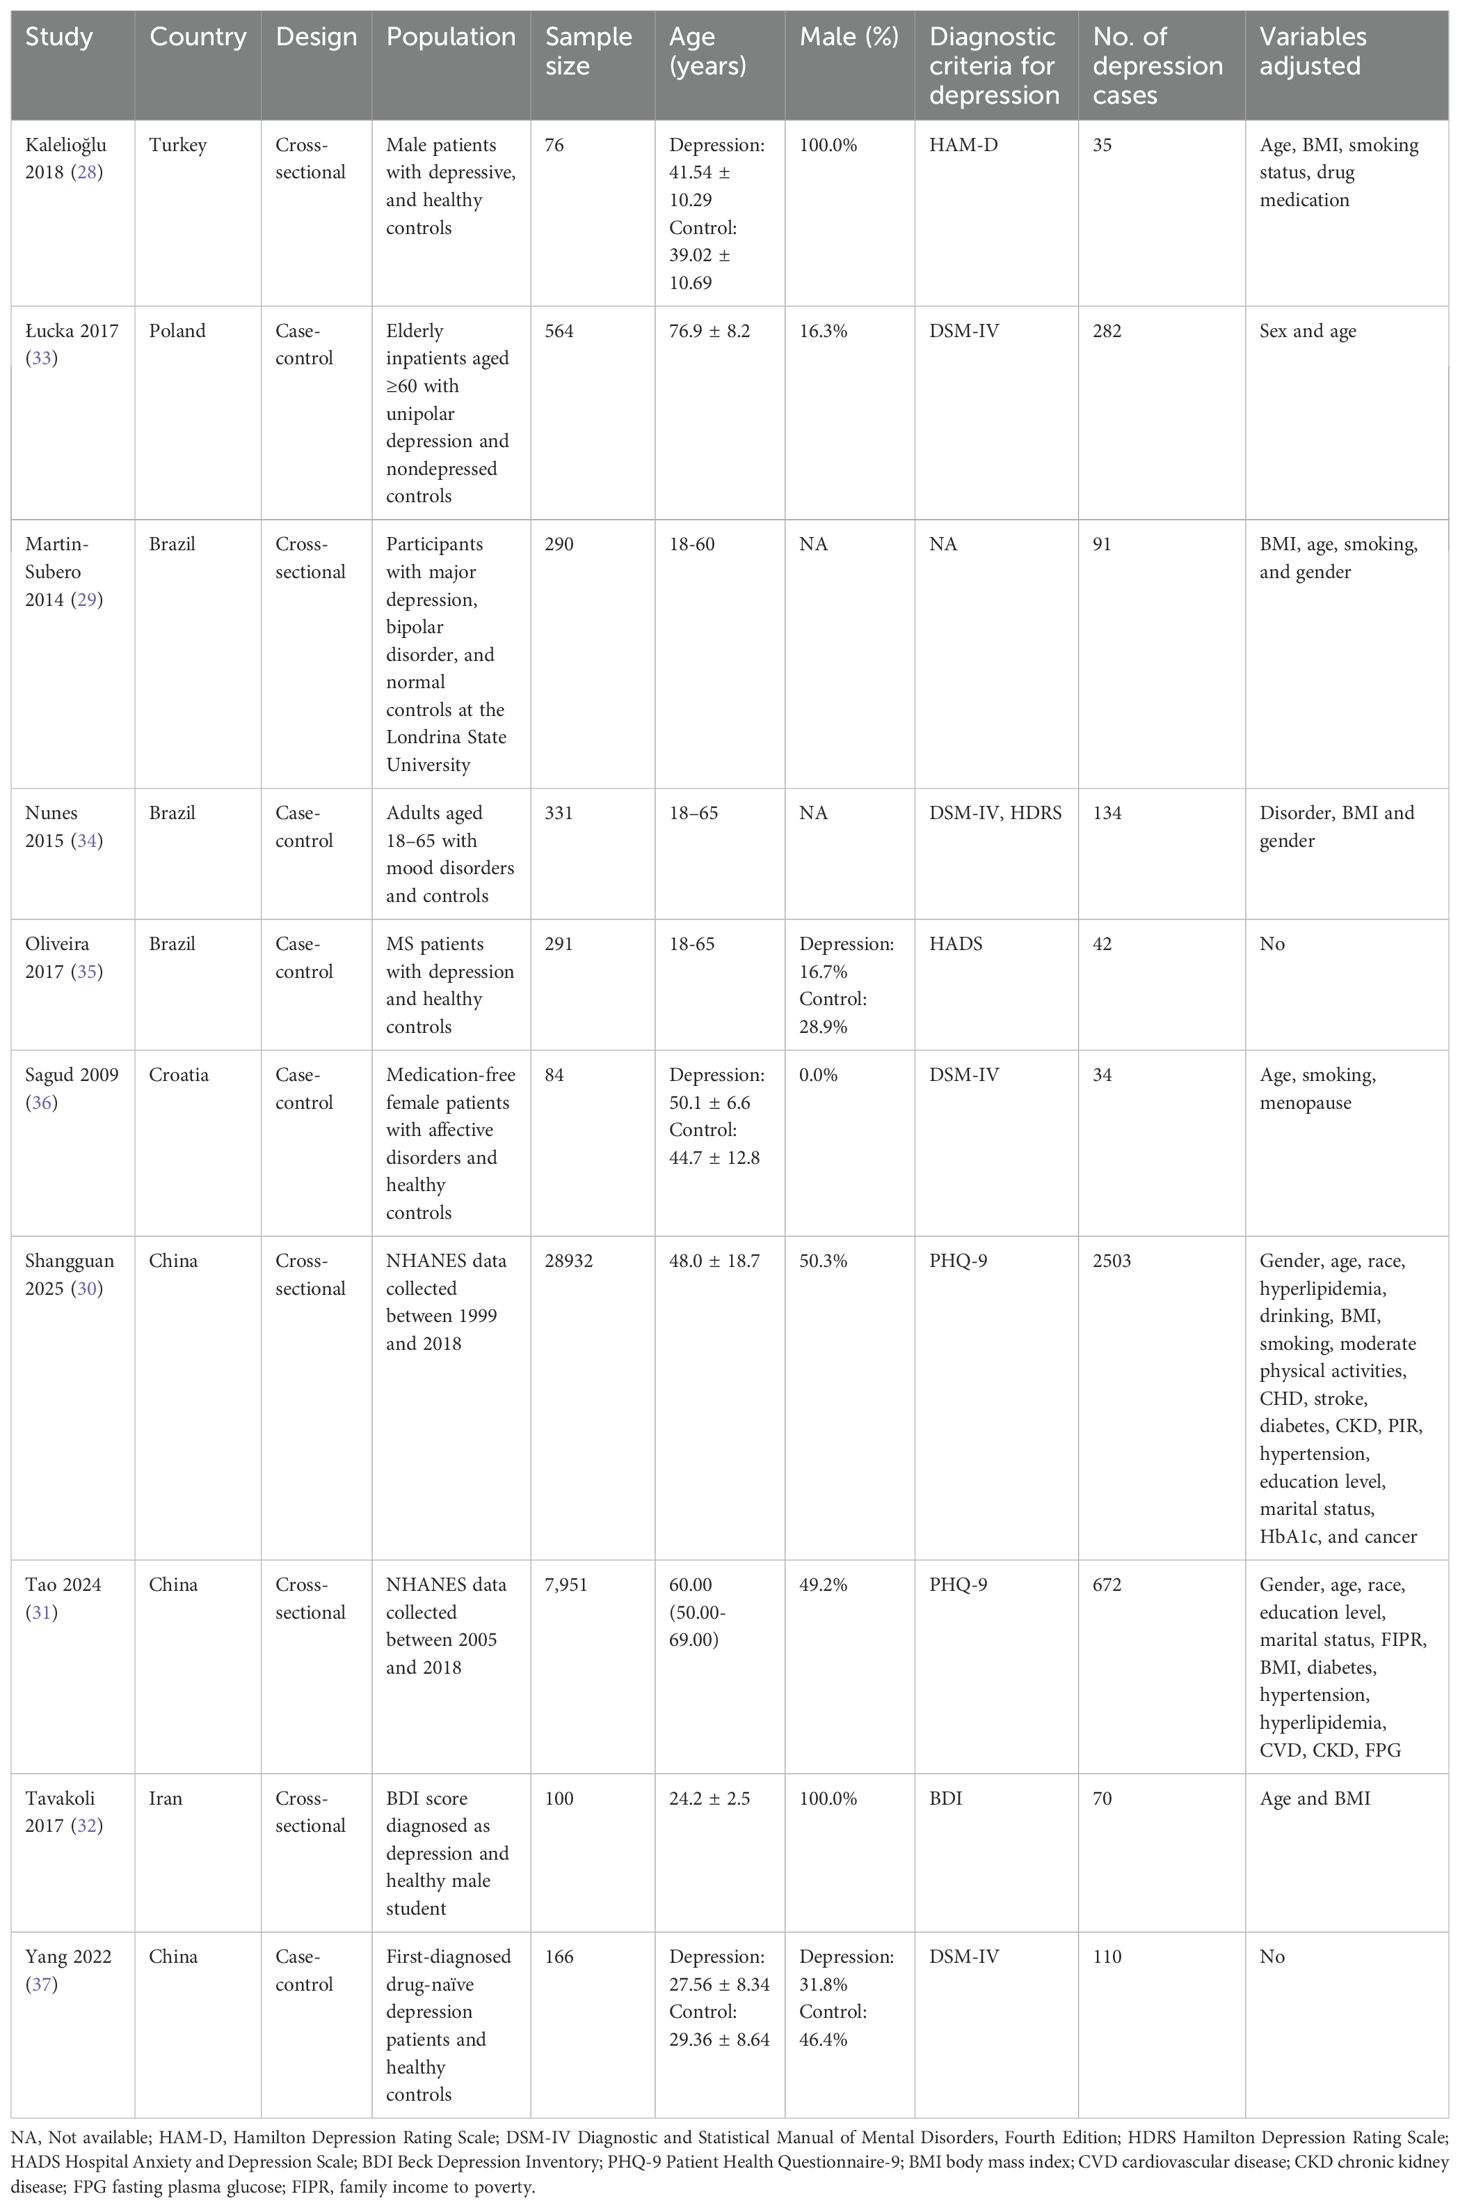
Table 1. Characteristics of included studies.
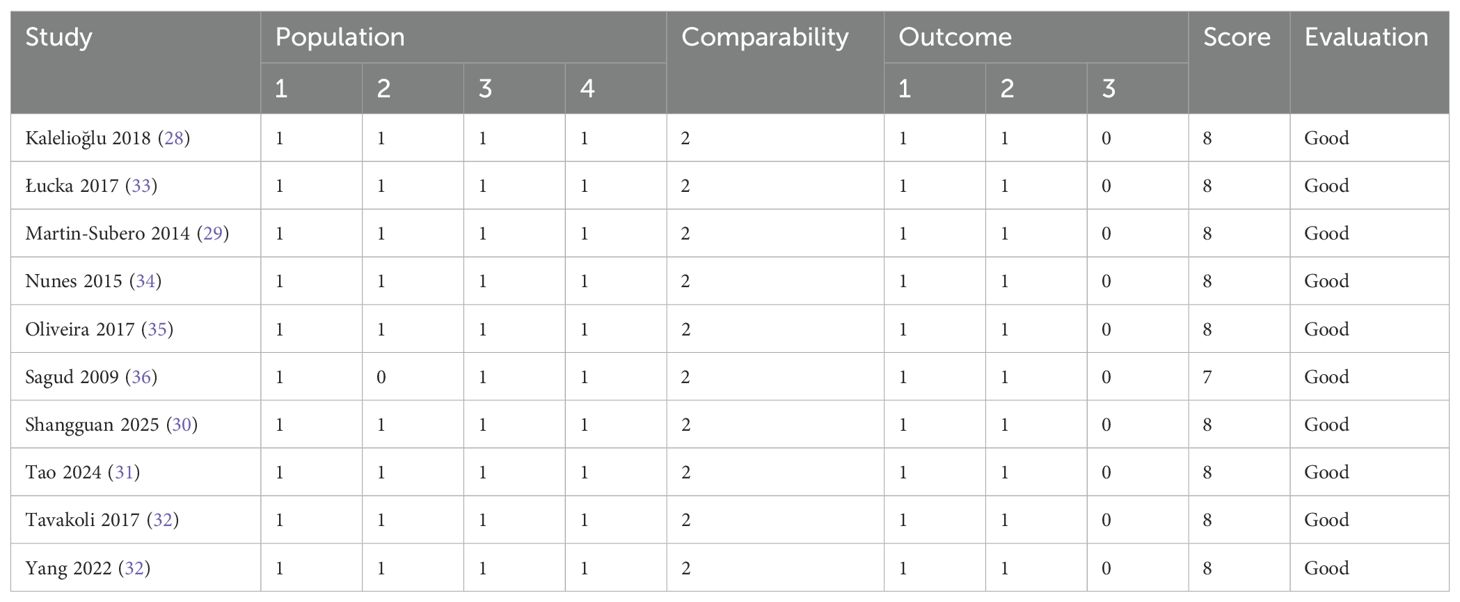
Table 2. Newcastle–Ottawa score for risk-of-bias assessment of included studies.
Sensitivity analysis
A total of eight studies were included in the meta-analysis examining the association between the AIP and the risk of depression (28, 30, 32–37). Among these, five studies (28, 30, 32–34) reported AIP values directly, while for the remaining three (35–37), we calculated AIP values based on the levels of TG and HDL-C. The pooled analysis demonstrated a statistically significant association between elevated AIP levels and an increased risk of depression (MD = 0.07, 95% CI: 0.03–0.11, P = 0.0006). However, substantial heterogeneity was observed across studies (I² = 94%, P < 0.00001; Figure 2A). Sensitivity analysis was performed by systematically excluding each study individually and showed that the results remained statistically significant in all scenarios (P < 0.05), indicating the robustness of the overall findings. Nevertheless, heterogeneity persisted at high levels (I² > 75%) across all sensitivity analyses, suggesting that the variability among studies could not be attributed to any single study.
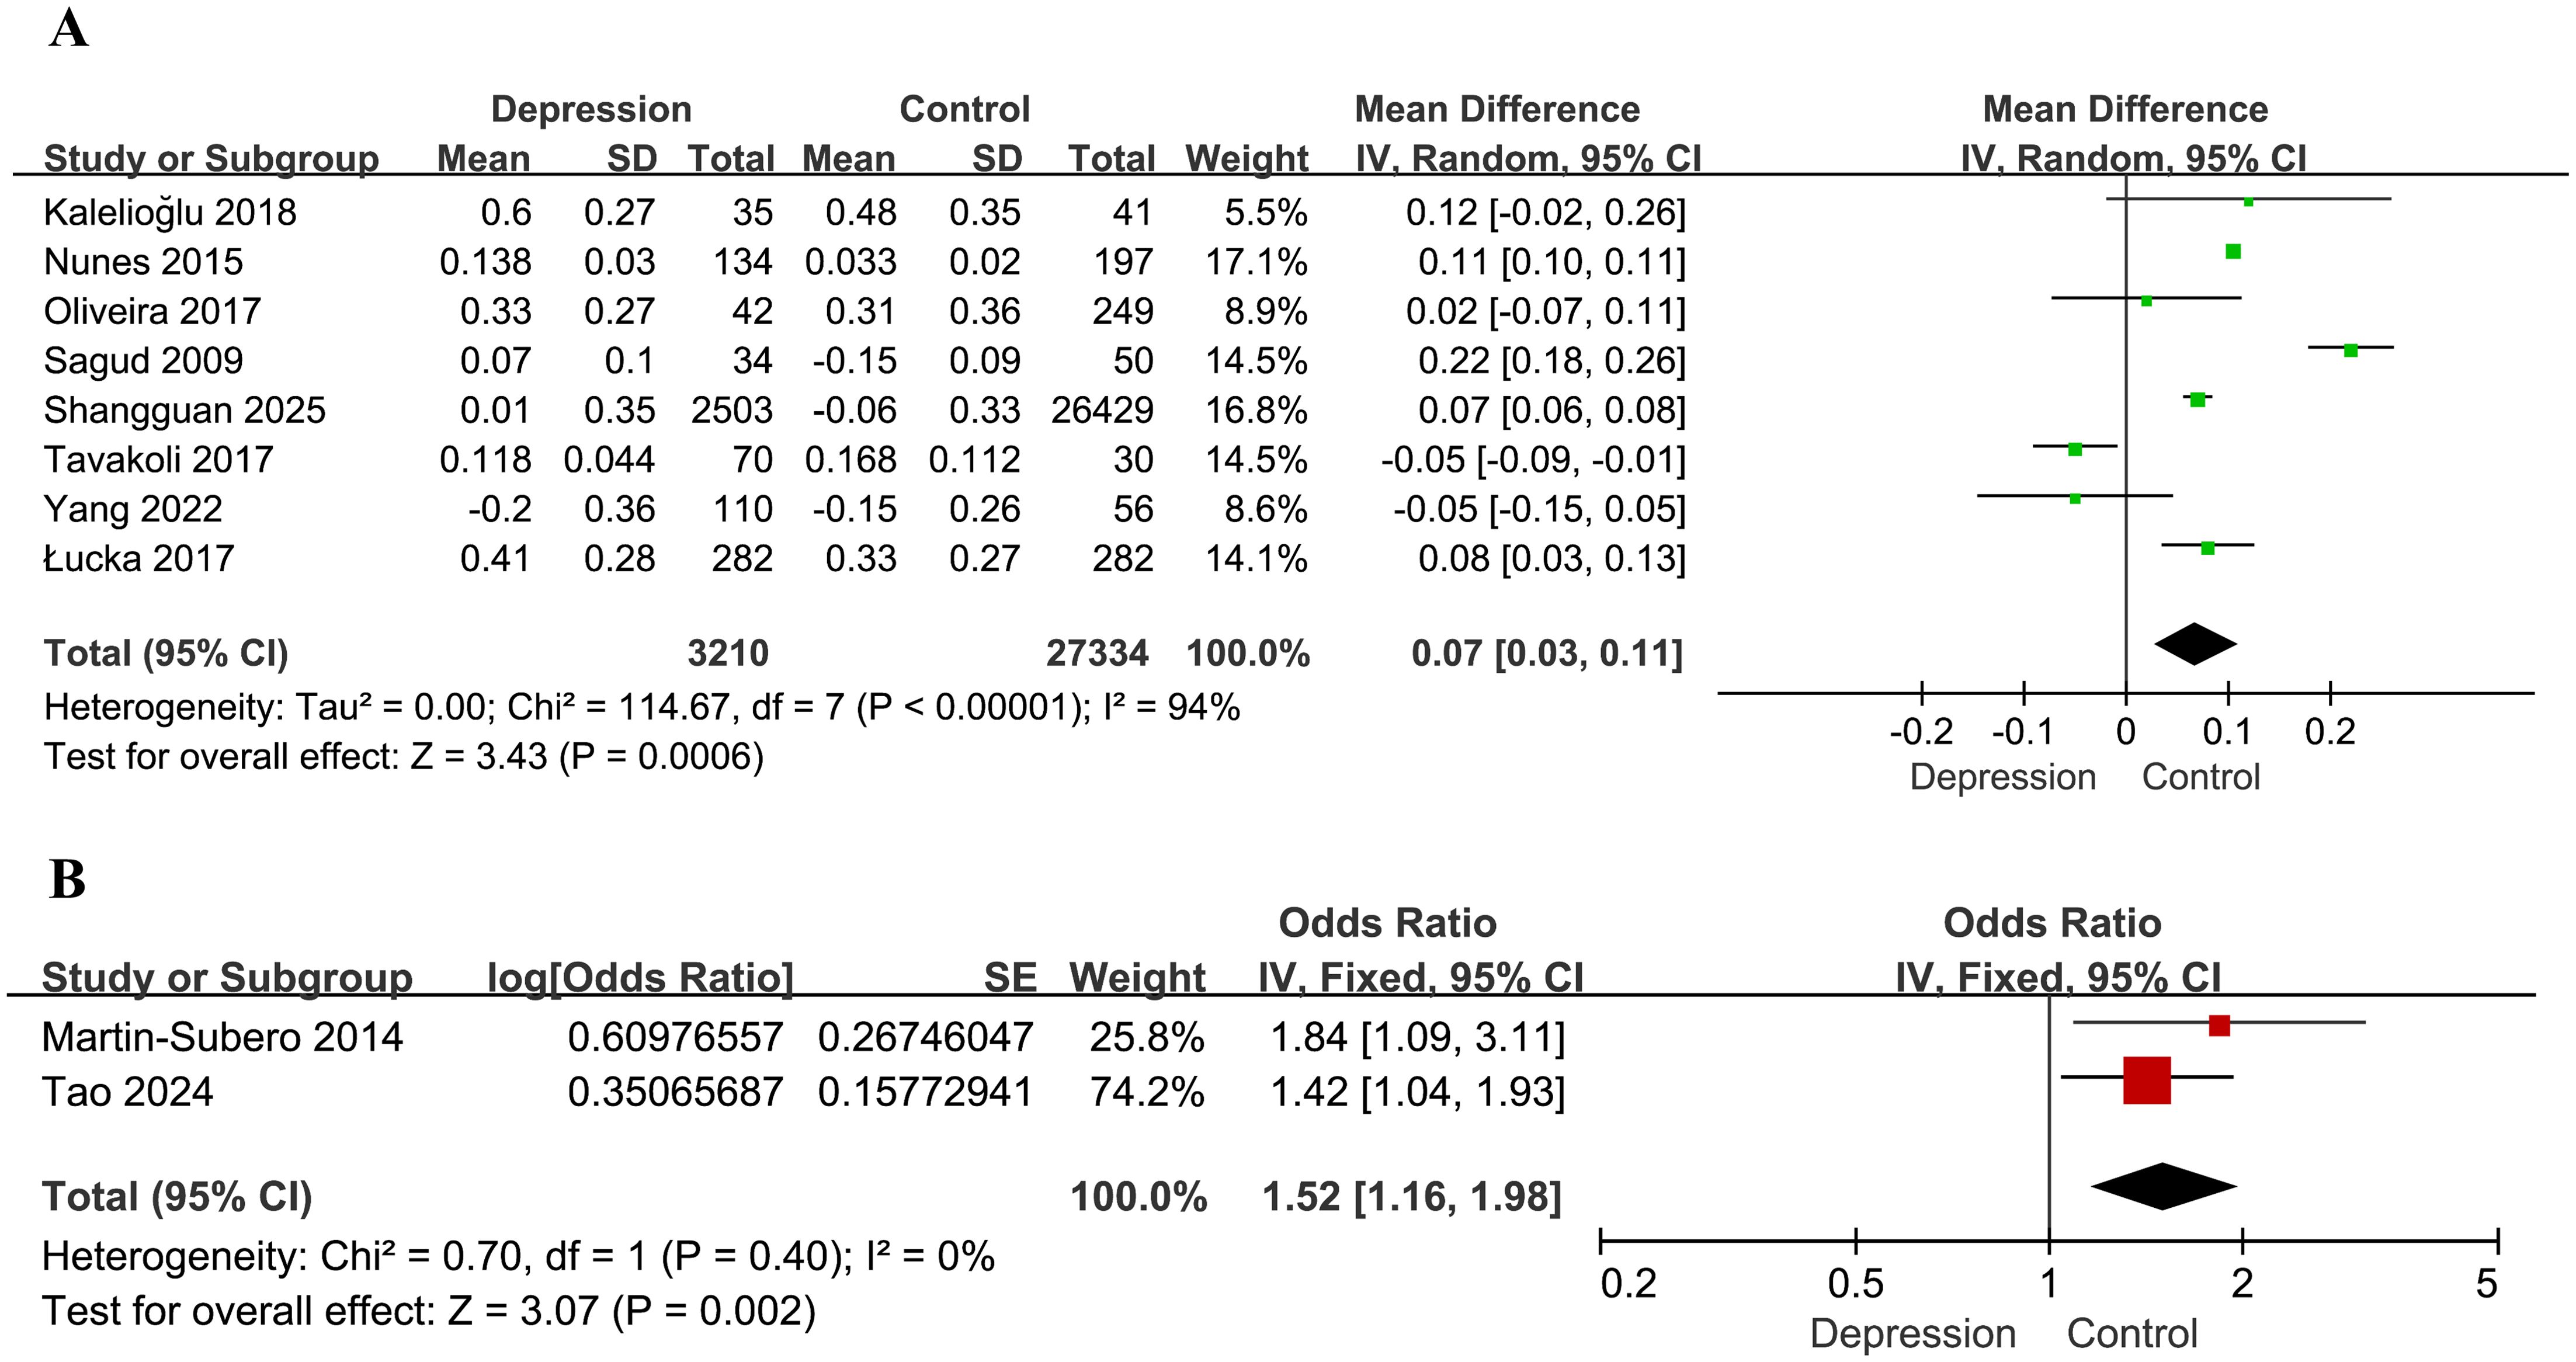
Figure 2. Forest plots for the meta-analysis of the association between the AIP and depression. (A) Forest plot of mean differences; (B) forest plot of odds ratios.
Two additional studies assessed the association between the AIP and depression risk based on ORs (29, 31). Analysis using a fixed-effects model demonstrated that higher AIP values were significantly associated with depression (OR = 1.52, 95% CI: 1.16–1.98, P = 0.002), with no evidence of heterogeneity (I² = 0%, P = 0.40; Figure 2B).
Subgroup analyses
Subgroup analysis based on age (<50 vs. ≥50 years) suggested a potential modifying effect. In participants aged <50 years (28, 30, 32, 35, 37), the difference in the AIP between individuals with depression and controls was not statistically significant (MD = 0.02, 95% CI: -0.06–0.09, P = 0.65, I² = 89%). In contrast, among those aged ≥50 years (33, 36), the association was significant (MD = 0.15, 95% CI: 0.01–0.29, P = 0.03, I² = 95%). The interaction between subgroups was marginally significant (interaction P = 0.09, I² = 64.7%; Figure 3A). One study reporting only median age was excluded from this analysis.
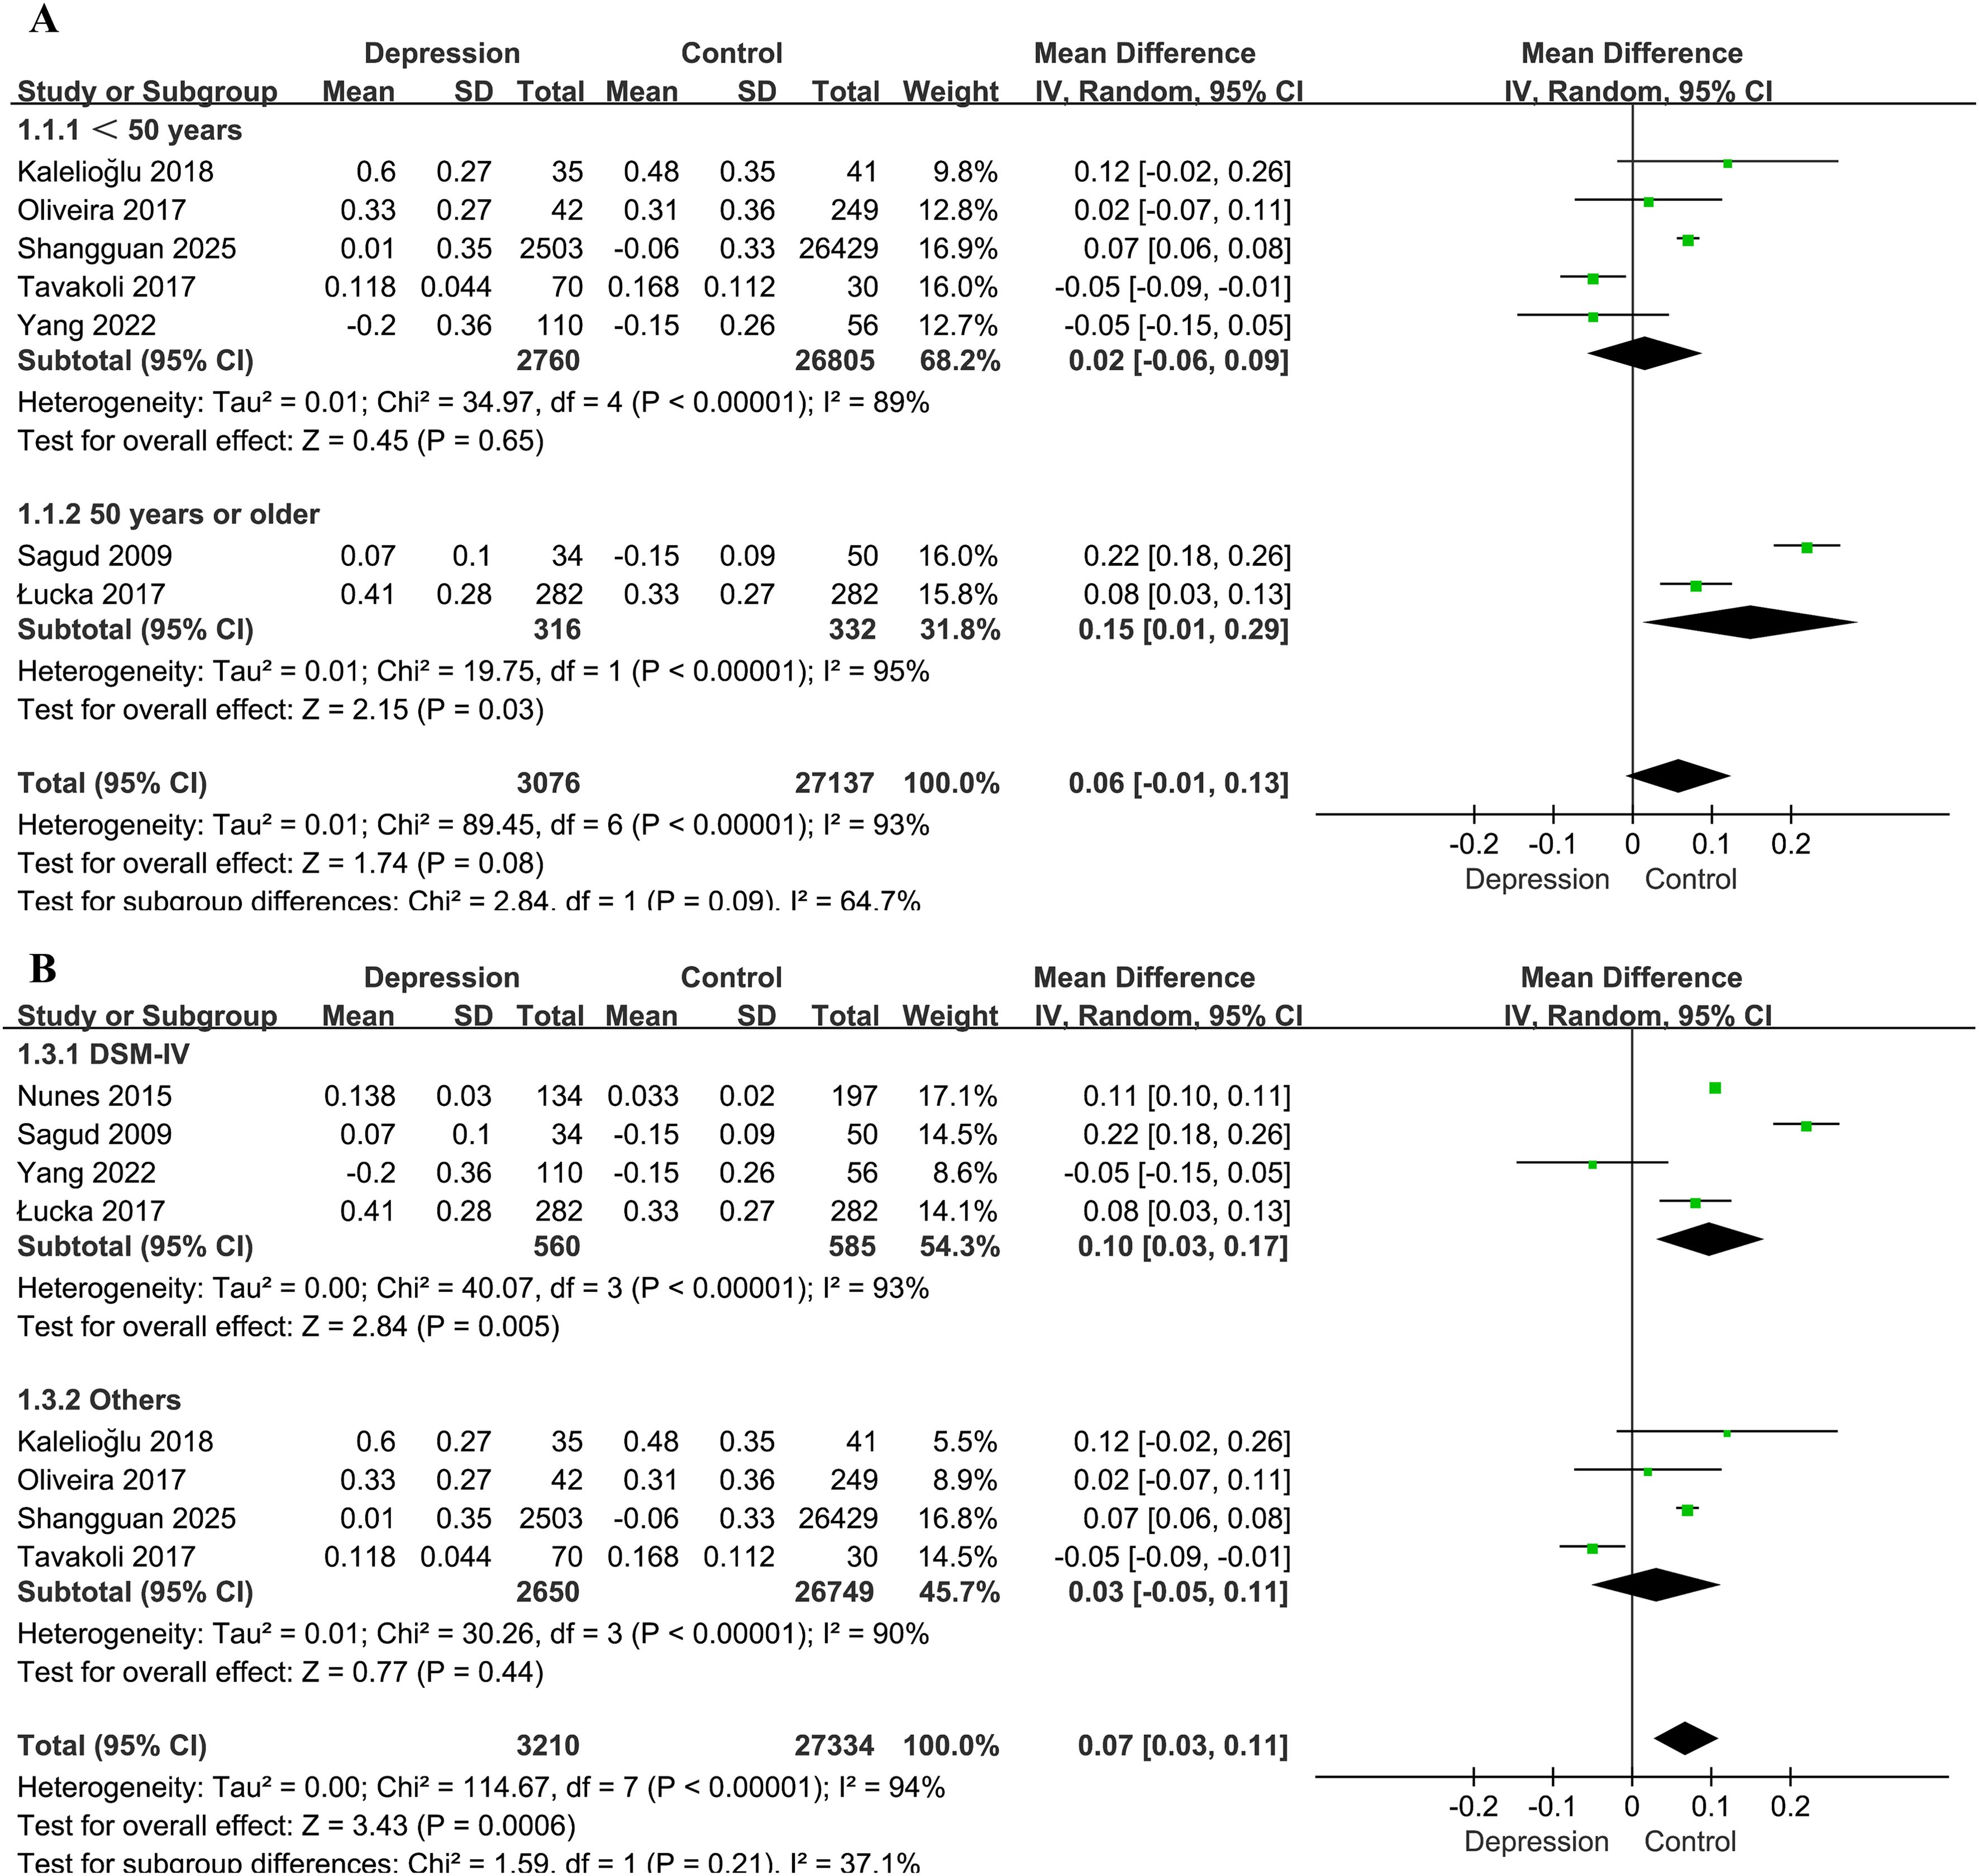
Figure 3. Forest plots for the subgroup analyses of the association between the AIP and depression. (A) Subgroup analysis according to age; (B) subgroup analysis according to diagnostic method for depression.
Studies employing the DSM-IV diagnostic criteria (33, 34, 36, 37) showed a stronger association (MD = 0.10, 95% CI: 0.03–0.17, P = 0.005) than those using other diagnostic standards (28, 30, 32, 35) (MD = 0.03, 95% CI: −0.05–0.11, P = 0.44). However, the difference between subgroups was not statistically significant (χ² = 1.59, P = 0.21, I² = 37.1%; Figure 3B).
Publication bias
Publication bias was assessed using a funnel plot and Egger’s test. The funnel plot evaluating the association between the AIP and depression risk is presented in Figure 4. Four studies were located outside the funnel boundaries, suggesting potential publication bias or heterogeneity. However, Egger’s test indicated no statistically significant publication bias (P = 0.354; Figure 5).
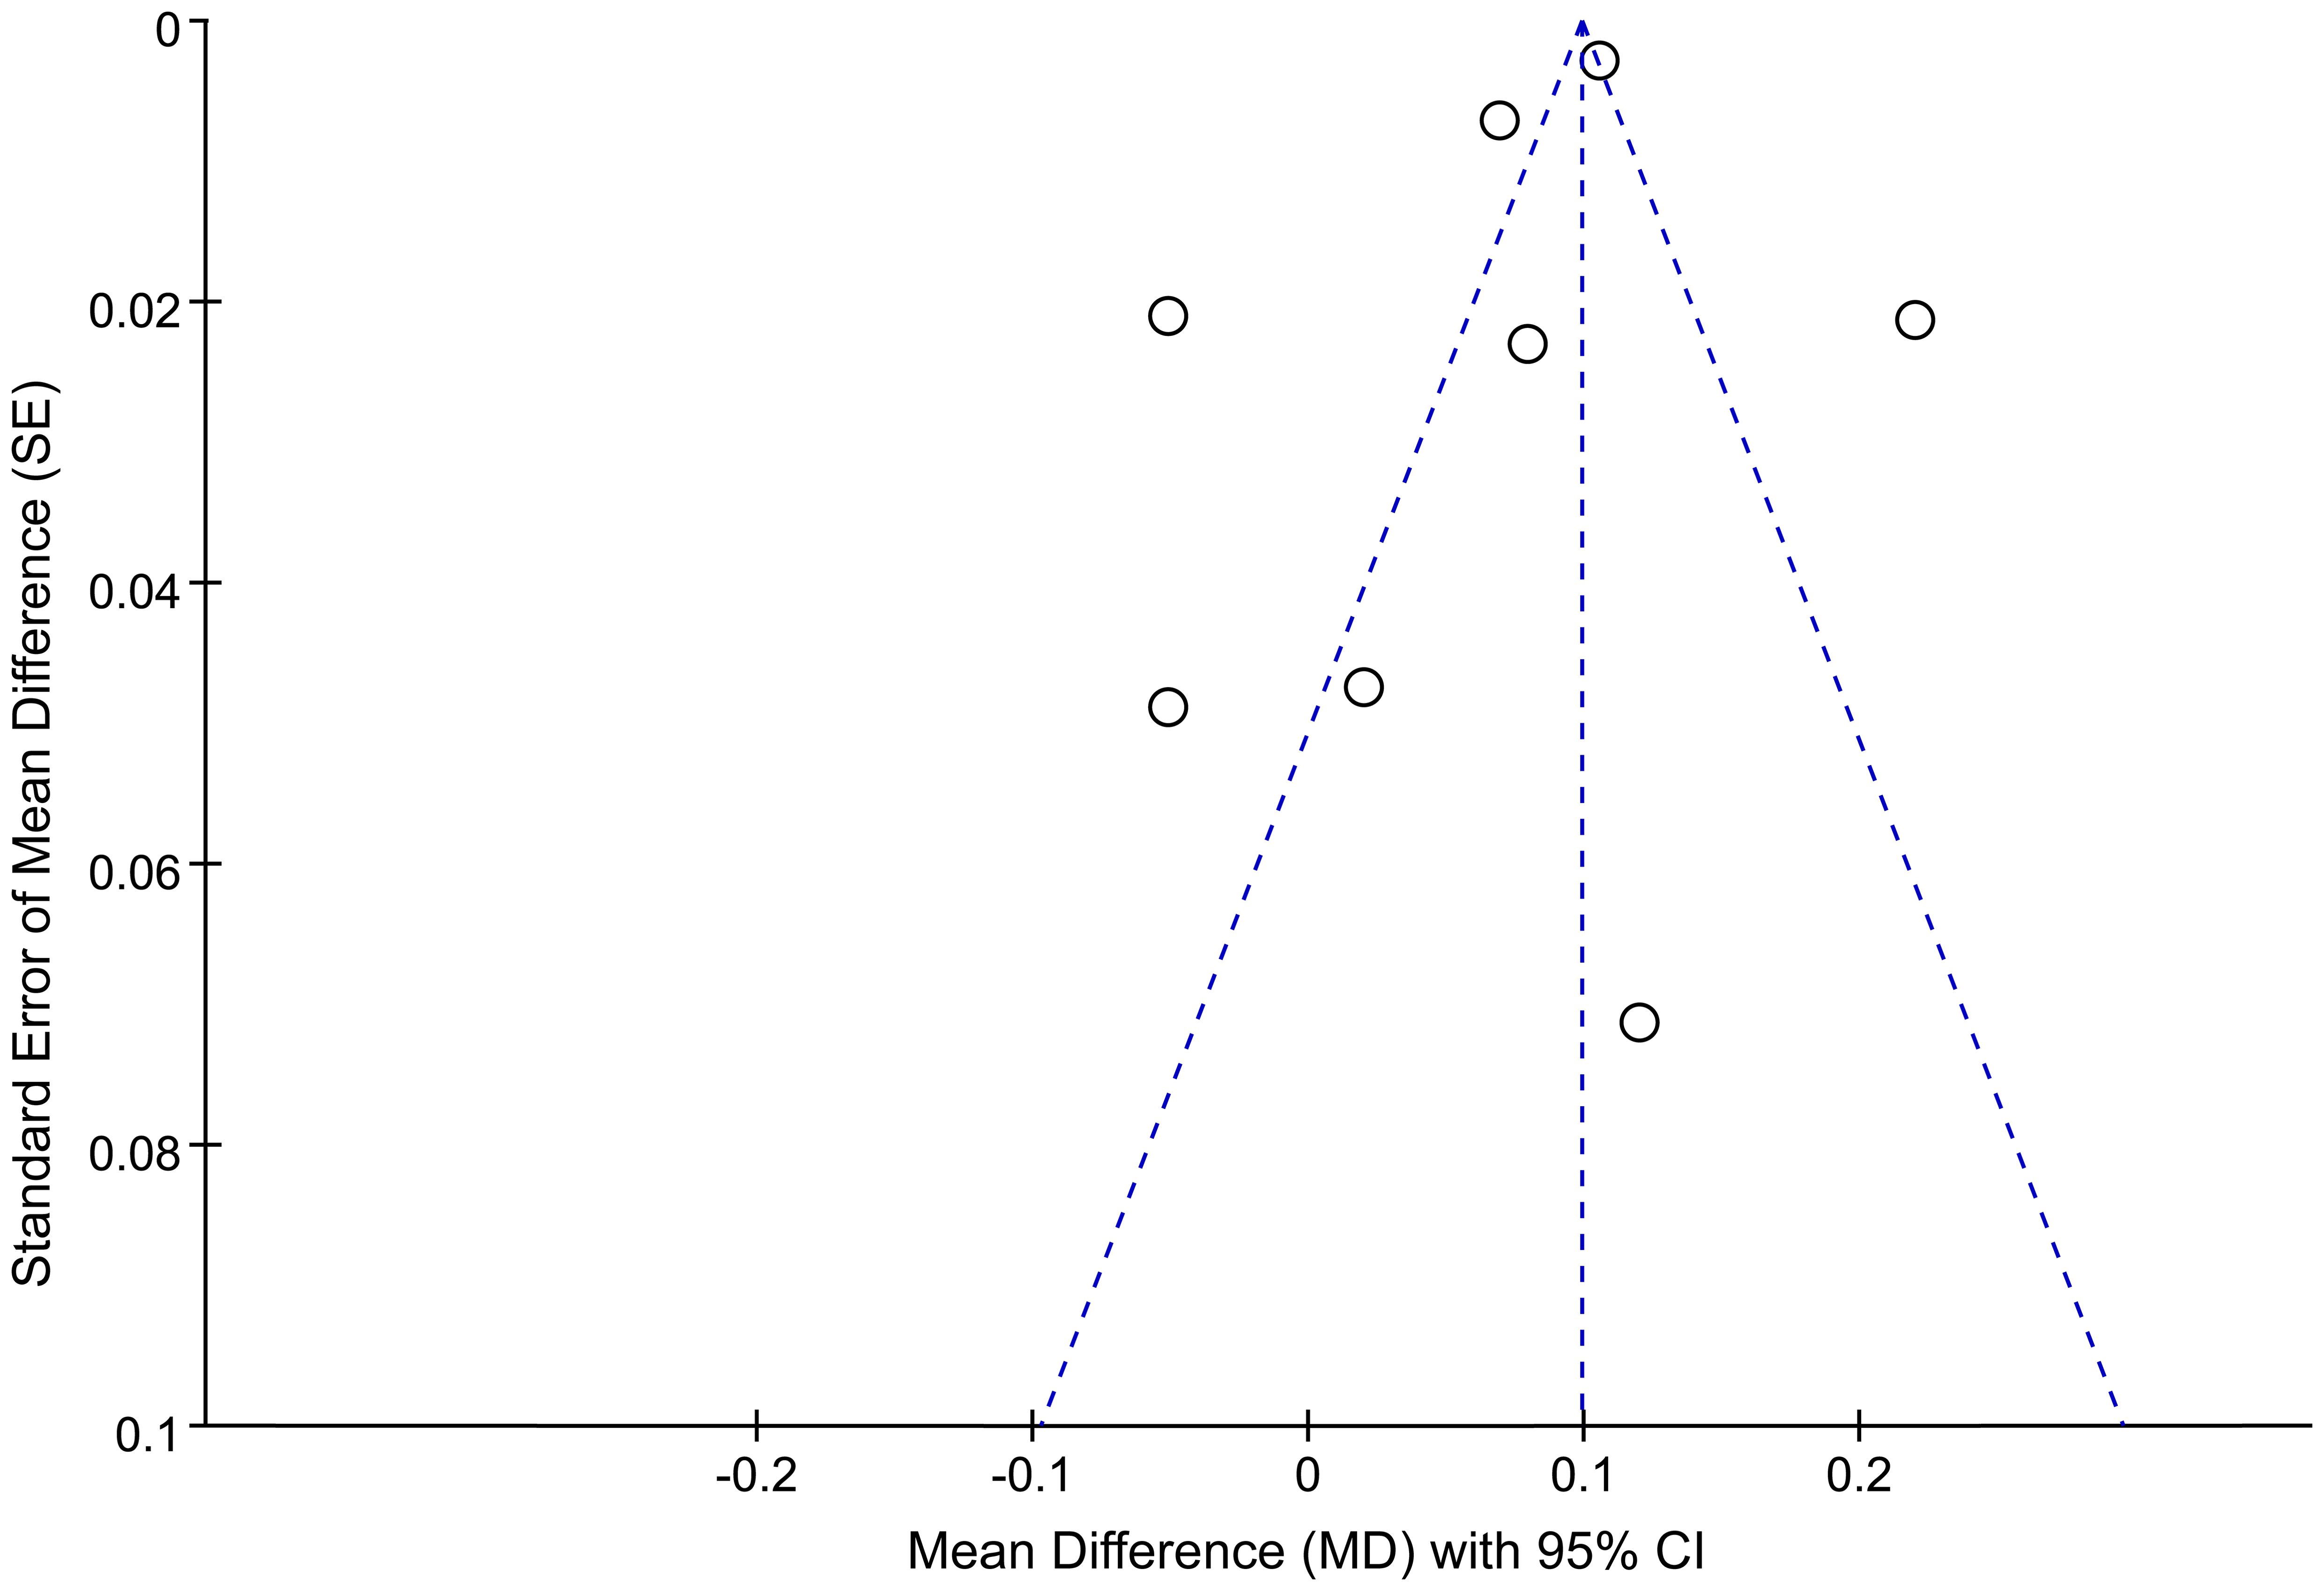
Figure 4. Funnel plots for publication bias among studies of the association between the AIP and depression.
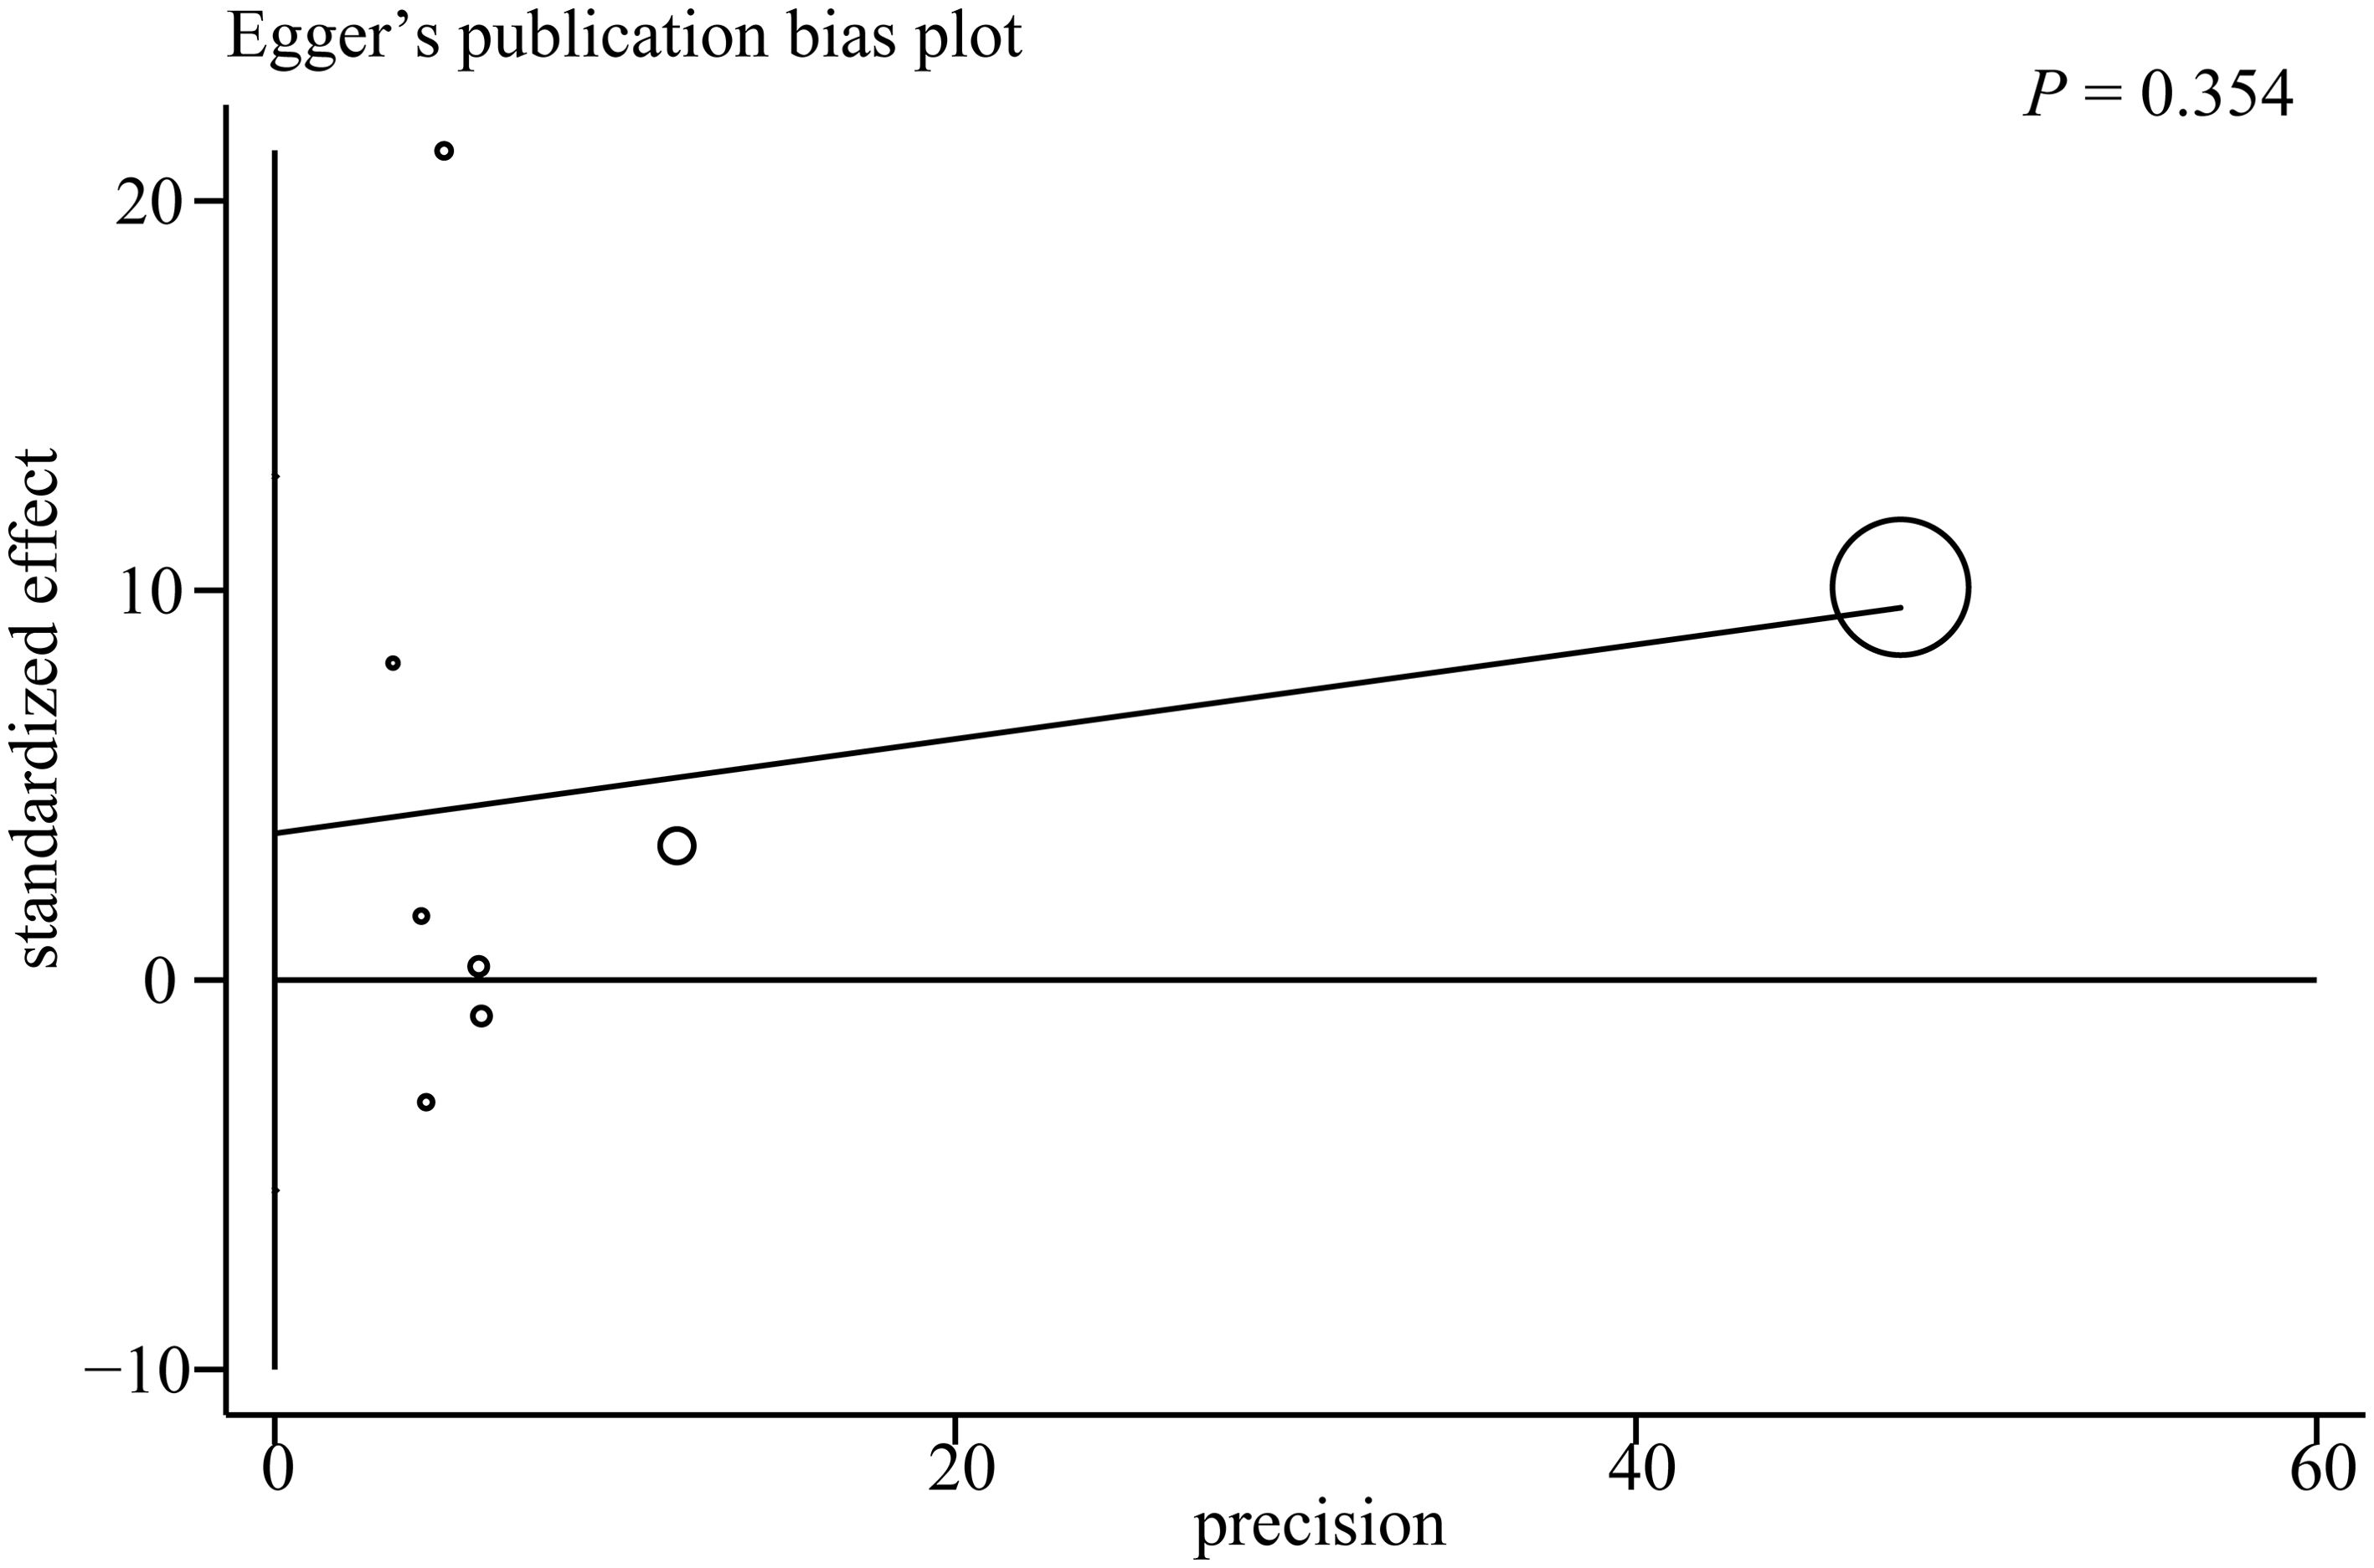
Figure 5. Egger’s test results for the association between the AIP and depression.
Discussion
This meta-analysis, which included 10 observational studies, encompassing 38,785 participants with 3,973 cases of depression, demonstrated a significant positive association between higher AIP values and an increased risk of depression (MD = 0.07, 95% CI: 0.03–0.11, P = 0.0006). Given that the AIP is a simple, readily accessible measure based on TG and HDL-C levels, these findings suggest that the AIP could serve as a potential risk indicator for depression, especially in individuals aged 50 years and older. This association is especially relevant in clinical settings, where the AIP could provide added value in identifying individuals at elevated risk for mood disorders.
The biological credibility of this association is underlined by multiple interconnected pathophysiological processes. An elevated AIP reflects an imbalance in lipid metabolism, commonly associated with insulin resistance, chronic inflammation, and oxidative stress, all of which have been implicated in the pathogenesis of depression (38, 39). In particular, insulin resistance has been shown to influence central nervous system function by modulating inflammatory cytokine levels, neurotransmitter metabolism, and neuroplasticity (40, 41). These mechanisms may lead to impaired synaptic function and reduced hippocampal neurogenesis, both of which are key features observed in major depressive disorder (42, 43). In addition, individuals with elevated AIP values often exhibit systemic inflammation, which may compromise the blood–brain barrier. This compromise facilitates the passage of proinflammatory cytokines into the brain, where they may interfere with neurochemical circuits that regulate affective processes (44, 45). Inflammatory markers such as interleukin-6 (IL-6) and tumor necrosis factor-alpha (TNF-α) are consistently elevated in patients with depression (46). These cytokines are also known to influence the tryptophan–kynurenine metabolic pathway, shifting tryptophan utilization away from serotonin biosynthesis toward the formation of neurotoxic intermediates, potentially exacerbating depressive symptoms (47).
The AIP has been identified as a surrogate marker for metabolic syndrome (MS), which comprises a constellation of metabolic abnormalities such as central obesity, elevated blood pressure, impaired glucose metabolism, and dyslipidemia (48). Several meta-analyses have demonstrated a significant link between MS and depressive disorders, indicating that disturbances in metabolic and emotional regulation may arise via shared pathophysiological mechanisms (49, 50). In this context, the AIP functions not only as an indicator of lipid dysregulation but also as a potential comprehensive marker for systemic metabolic dysfunction. Furthermore, increased AIP values have been correlated with an elevated risk of cardiovascular events (51). The reciprocal relationship between cardiovascular disease (CVD) and depression is well substantiated (52). Depression is both a risk factor for and a consequence of CVD, and this interaction may further magnify the clinical implications of an elevated AIP (53).
Our subgroup analysis showed that the association between the AIP and depression was more evident in individuals aged 50 years and older. This observation is consistent with prior studies involving metabolic indicators such as the TG–glucose (TyG) index, which have reported stronger links to depression among middle-aged and elderly groups (54, 55). Factors such as diminished metabolic adaptability, heightened systemic inflammation, and age-related vascular changes may intensify the influence of lipid disturbances on mental health in older adults (56, 57). These age-related patterns further suggest that the AIP could serve as a valuable marker for evaluating metabolic and psychiatric risk specifically within geriatric populations (58).
Several limitations of the present study should be considered. First, all included studies had either cross-sectional or case-control designs, limiting the ability to establish causality. Prospective cohort studies are needed to confirm the directionality of the association. Second, substantial heterogeneity was observed among the studies (I² = 94%, P < 0.00001), likely attributable to differences in study populations, diagnostic tools for depression, and variations in AIP calculation methods. Third, although most studies adjusted for key confounders such as age, sex, and BMI, residual confounding by factors like diet, physical activity, medication use, management of comorbidities, and socioeconomic status cannot be excluded. Fourth, variation in depression assessment methods (e.g., different diagnostic criteria or scales) precluded subgroup analysis by depression severity. Future studies should consider using standardized criteria and exploring whether associations differ by severity, as suggested by Medhi et al. (59).
Despite extensive literature on cardiovascular risk, metabolic disorders, and depression, the present study provides novel and complementary insights by demonstrating the value of the AIP as an integrative lipid biomarker that reflects the balance between atherogenic and protective lipoproteins and thus offers more predictive potential than single lipid measures. To our knowledge, this is the first meta-analysis to quantify the overall association between AIP and depression risk, and thereby reveal its potential as a clinically relevant biomarker.
Future research should prioritize large-scale, prospective studies to assess whether elevated AIP values independently predict depression, alongside mechanistic investigations into the biological pathways linking dyslipidemia to mood disorders—focusing on inflammation, oxidative stress, MS, and cardiovascular health. Interventional studies evaluating the impact of lifestyle or pharmacological strategies to reduce the AIP on depression risk would also offer valuable clinical insights. From a clinical standpoint, routine AIP monitoring, especially in older adults, could aid in the early identification of high-risk individuals, and integrating metabolic and mental health assessments may enhance prevention, risk stratification, and personalized intervention strategies.
Conclusion
In summary, this meta-analysis reveals a significant association between higher AIP values and an increased risk of depression, particularly among individuals aged 50 years and older. The use of AIP, as an integrated lipid marker, provides a novel perspective beyond conventional lipid parameters, and this study is the first to quantify this pooled association. Despite substantial heterogeneity across the included studies, the association remained stable in sensitivity analyses, and Egger’s test indicated no evidence of significant publication bias. Future research should focus on clarifying the causal relationship between the AIP and depression and exploring AIP-targeted interventions as potential preventive strategies against depressive disorders.
Data availability statement
The original contributions presented in the study are included in the article/supplementary material. Further inquiries can be directed to the corresponding authors.
Author contributions
G-LC: Data curation, Formal Analysis, Investigation, Methodology, Software, Writing – original draft, Writing – review & editing. G-XC: Conceptualization, Data curation, Formal Analysis, Investigation, Methodology, Software, Supervision, Validation, Writing – original draft, Writing – review & editing. W-TW: Conceptualization, Formal Analysis, Investigation, Methodology, Project administration, Resources, Software, Validation, Writing – original draft, Writing – review & editing.
Funding
The author(s) declare that no financial support was received for the research, authorship, and/or publication of this article.
Conflict of interest
The authors declare that the research was conducted in the absence of any commercial or financial relationships that could be construed as a potential conflict of interest.
Generative AI statement
The author(s) declare that no Generative AI was used in the creation of this manuscript.
Any alternative text (alt text) provided alongside figures in this article has been generated by Frontiers with the support of artificial intelligence and reasonable efforts have been made to ensure accuracy, including review by the authors wherever possible. If you identify any issues, please contact us.
Publisher’s note
All claims expressed in this article are solely those of the authors and do not necessarily represent those of their affiliated organizations, or those of the publisher, the editors and the reviewers. Any product that may be evaluated in this article, or claim that may be made by its manufacturer, is not guaranteed or endorsed by the publisher.
Abbreviations
AIP, atherogenic index of plasma; OR, odds ratio; CI, confidence interval; SE, standard error; MD, mean difference; HAM-D, Hamilton Depression Rating Scale; DSM-IV, Diagnostic and Statistical Manual of Mental Disorders, Fourth Edition; HDRS, Hamilton Depression Rating Scale; HADS, Hospital Anxiety and Depression Scale; BDI, Beck Depression Inventory; PHQ-9, Patient Health Questionnaire-9; NOS, Newcastle–Ottawa Scale; BMI, body mass index; MS, metabolic syndrome; CVD, cardiovascular disease.
References
1. Rong J, Wang X, Cheng P, Li D, and Zhao D. Global, regional and national burden of depressive disorders and attributable risk factors, from 1990 to 2021: results from the 2021 Global Burden of Disease study. Br J Psychiatry. (2025) 227:688–697. doi: 10.1192/bjp.2024.266
2. Hong C, Liu Z, Gao L, Jin Y, Shi J, Liang R, et al. Global trends and regional differences in the burden of anxiety disorders and major depressive disorder attributed to bullying victimisation in 204 countries and territories, 1999-2019: an analysis of the Global Burden of Disease Study. Epidemiol Psychiatr Sci. (2022) 31:e85. doi: 10.1017/s2045796022000683
3. Harsanyi S, Kupcova I, Csobonyeiova M, and Klein M. Salivary hormones in depression: the future in diagnosis and treatment. Ann Gen Psychiatry. (2025) 24:9. doi: 10.1186/s12991-025-00548-y
4. Reategui-Rivera CM, Villarreal-Zegarra D, de la Cruz-Torralva K, Díaz-Sánchez P, and Finkelstein J. Immersive technologies for depression care: scoping review. JMIR Ment Health. (2024) 11:e56056. doi: 10.2196/56056
5. Hassamal S. Chronic stress, neuroinflammation, and depression: an overview of pathophysiological mechanisms and emerging anti-inflammatories. Front Psychiatry. (2023) 14:1130989. doi: 10.3389/fpsyt.2023.1130989
6. Liang G, Kow ASF, Yusof R, Tham CL, Ho YC, and Lee MT. Menopause-associated depression: impact of oxidative stress and neuroinflammation on the central nervous system-A review. Biomedicines. (2024) 12:184. doi: 10.3390/biomedicines12010184
7. Gu S, Li Y, Jiang Y, Huang JH, and Wang F. Glymphatic dysfunction induced oxidative stress and neuro-inflammation in major depression disorders. Antioxid (Basel). (2022) 11:2296. doi: 10.3390/antiox11112296
8. Khalfan AF, Campisi SC, Lo RF, McCrindle BW, and Korczak DJ. The association between adolescent depression and dyslipidemia. J Affect Disord. (2023) 338:239–45. doi: 10.1016/j.jad.2023.06.017
9. Dhingra R, He F, Al-Shaar L, Saunders EFH, Chinchilli VM, Yanosky JD, et al. Cardiovascular disease burden is associated with worsened depression symptoms in the U.S. general population. J Affect Disord. (2023) 323:866–74. doi: 10.1016/j.jad.2022.12.038
10. Jike M, Itani O, Watanabe N, Buysse DJ, and Kaneita Y. Long sleep duration and health outcomes: A systematic review, meta-analysis and meta-regression. Sleep Med Rev. (2018) 39:25–36. doi: 10.1016/j.smrv.2017.06.011
11. Cepeda MS, Kern DM, Blacketer C, and Drevets WC. Low levels of cholesterol and the cholesterol type are not associated with depression: Results of a cross-sectional NHANES study. J Clin Lipidol. (2020) 14:515–21. doi: 10.1016/j.jacl.2020.06.001
12. Valkanova V and Ebmeier KP. Vascular risk factors and depression in later life: a systematic review and meta-analysis. Biol Psychiatry. (2013) 73:406–13. doi: 10.1016/j.biopsych.2012.10.028
13. Rabiee Rad M, Ghasempour Dabaghi G, Darouei B, and Amani-Beni R. The association of atherogenic index of plasma with cardiovascular outcomes in patients with coronary artery disease: A systematic review and meta-analysis. Cardiovasc Diabetol. (2024) 23:119. doi: 10.1186/s12933-024-02198-y
14. Kim SH, Cho YK, Kim YJ, Jung CH, Lee WJ, Park JY, et al. Association of the atherogenic index of plasma with cardiovascular risk beyond the traditional risk factors: a nationwide population-based cohort study. Cardiovasc Diabetol. (2022) 21:81. doi: 10.1186/s12933-022-01522-8
15. Altun Y, Balcı HD, and Aybal N. Associations of the atherogenic index of plasma with insulin resistance and inflammation. Rev Assoc Med Bras (1992). (2024) 70:e20240991. doi: 10.1590/1806-9282.20240991
16. Kong D and Zou W. Association between atherogenic index of plasma and post-stroke depression: a cross-sectional study. Eur J Psychotraumatol. (2024) 15:2429266. doi: 10.1080/20008066.2024.2429266
17. Joshi MB, Pai S, Balakrishnan A, Bhat M, Kotambail A, Sharma P, et al. Evidence for perturbed metabolic patterns in bipolar disorder subjects associated with lithium responsiveness. Psychiatry Res. (2019) 273:252–9. doi: 10.1016/j.psychres.2019.01.031
18. Song YR, Wu B, Yang YT, Chen J, Zhang LJ, Zhang ZW, et al. Specific alterations in plasma proteins during depressed, manic, and euthymic states of bipolar disorder. Braz J Med Biol Res. (2015) 48:973–82. doi: 10.1590/1414-431x20154550
19. Zhang H, Zhang G, and Fu J. Exploring the L-shaped relationship between Atherogenic Index of Plasma and depression: Results from NHANES 2005-2018. J Affect Disord. (2024) 359:133–9. doi: 10.1016/j.jad.2024.05.073
20. Enko D, Brandmayr W, Halwachs-Baumann G, Schnedl WJ, Meinitzer A, and Kriegshäuser G. Prospective plasma lipid profiling in individuals with and without depression. Lipids Health Dis. (2018) 17:149. doi: 10.1186/s12944-018-0796-3
21. Page MJ, McKenzie JE, Bossuyt PM, Boutron I, Hoffmann TC, Mulrow CD, et al. The PRISMA 2020 statement: an updated guideline for reporting systematic reviews. Bmj. (2021) 372:n71. doi: 10.1136/bmj.n71
22. Page MJ, Moher D, Bossuyt PM, Boutron I, Hoffmann TC, Mulrow CD, et al. PRISMA 2020 explanation and elaboration: updated guidance and exemplars for reporting systematic reviews. Bmj. (2021) 372:n160. doi: 10.1136/bmj.n160
23. Stang A. Critical evaluation of the Newcastle-Ottawa scale for the assessment of the quality of nonrandomized studies in meta-analyses. Eur J Epidemiol. (2010) 25:603–5. doi: 10.1007/s10654-010-9491-z
24. Moskalewicz A and Oremus M. No clear choice between Newcastle-Ottawa Scale and Appraisal Tool for Cross-Sectional Studies to assess methodological quality in cross-sectional studies of health-related quality of life and breast cancer. J Clin Epidemiol. (2020) 120:94–103. doi: 10.1016/j.jclinepi.2019.12.013
25. Scholten RJ, Clarke M, and Hetherington J. The cochrane collaboration. Eur J Clin Nutr. (2005) 59 Suppl 1:S147–9; discussion S95-6. doi: 10.1038/sj.ejcn.1602188
26. Higgins JP and Thompson SG. Quantifying heterogeneity in a meta-analysis. Stat Med. (2002) 21:1539–58. doi: 10.1002/sim.1186
27. Egger M, Davey Smith G, Schneider M, and Minder C. Bias in meta-analysis detected by a simple, graphical test. Bmj. (1997) 315:629–34. doi: 10.1136/bmj.315.7109.629
28. Kalelioglu T, Unalan P, Kok B, Sozen S, Yuksel O, Akkus M, et al. Atherogenic index of plasma as a cardiovascular risk marker in manic, depressive, and euthymic stages of bipolar disorder. Turk Kardiyol Dern Ars. (2018) 46:32–8. doi: 10.5543/tkda.2017.23350
29. Martin-Subero M, Odebrecht H, Odebrecht S, Sabbatini D, Rossi P, Dodd S, et al. P.1.f.012 Major depression and bipolar disorder contribute significantly towards an increased atherogenic index of plasma. Eur Neuropsychopharmacol. (2014) 24:S201–S2. doi: 10.1016/s0924-977x(14)70311-6
30. Shangguan T, Xu J, Weng X, and Lin H. Red blood cell distribution width to albumin ratio is associated with increased depression: the mediating role of atherogenic index of plasma. Front Psychiatry. (2025) 16:1504123. doi: 10.3389/fpsyt.2025.1504123
31. Tao S, Yu L, Li J, Huang X, Xue T, Yang D, et al. Higher atherogenic index of plasma is associated with increased major depressive disorder: insights from a nationally representative study. Front Psychiatry. (2024) 15:1441119. doi: 10.3389/fpsyt.2024.1441119
32. Tavakoli R, Yaghooti H, Daghagheleh R, Yousofi R, and Rahimifar P. Serum lipids and brain-derived neurotrophic factor in a cross-section of male students with symptoms of depression at a university in Iran: an observational study. Asian Biomed. (2018) 11:413–7. doi: 10.1515/abm-2018-0016
33. Łucka A, Arabska J, Fife E, Kroc Ł, Sołtysik BK, Kłoszewska I, et al. Atherogenic indices are increased in elderly patients with unipolar depression-case-control analysis. Metab Syndr Relat Disord. (2017) 15:291–5. doi: 10.1089/met.2017.0008
34. Nunes SO, Piccoli de Melo LG, Pizzo de Castro MR, Barbosa DS, Vargas HO, Berk M, et al. Atherogenic index of plasma and atherogenic coefficient are increased in major depression and bipolar disorder, especially when comorbid with tobacco use disorder. J Affect Disord. (2015) 172:55–62. doi: 10.1016/j.jad.2014.09.038
35. Oliveira SR, Kallaur AP, Lopes J, Colado Simao AN, Reiche EM, de Almeida ERD, et al. Insulin resistance, atherogenicity, and iron metabolism in multiple sclerosis with and without depression: Associations with inflammatory and oxidative stress biomarkers and uric acid. Psychiatry Res. (2017) 250:113–20. doi: 10.1016/j.psychres.2016.12.039
36. Sagud M, Mihaljevic-Peles A, Pivac N, Jakovljevic M, and Muck-Seler D. Lipid levels in female patients with affective disorders. Psychiatry Res. (2009) 168:218–21. doi: 10.1016/j.psychres.2008.06.048
37. Yang R, Wang L, Cao S, Chen M, Wu CJ, Silva F, et al. Sex difference in lipid levels in first-diagnosed drug-naive depression patients: A case-control and 12-weeks follow-up study. World J Biol Psychiatry. (2022) 23:228–35. doi: 10.1080/15622975.2021.1961500
38. Eyre HA, Stuart MJ, and Baune BT. A phase-specific neuroimmune model of clinical depression. Prog Neuropsychopharmacol Biol Psychiatry. (2014) 54:265–74. doi: 10.1016/j.pnpbp.2014.06.011
39. Kennis M, Gerritsen L, van Dalen M, Williams A, Cuijpers P, and Bockting C. Prospective biomarkers of major depressive disorder: a systematic review and meta-analysis. Mol Psychiatry. (2020) 25:321–38. doi: 10.1038/s41380-019-0585-z
40. Lyra ESNM, Lam MP, Soares CN, Munoz DP, Milev R, and De Felice FG. Insulin resistance as a shared pathogenic mechanism between depression and type 2 diabetes. Front Psychiatry. (2019) 10:57. doi: 10.3389/fpsyt.2019.00057
41. Leonard BE and Wegener G. Inflammation, insulin resistance and neuroprogression in depression. Acta Neuropsychiatr. (2020) 32:1–9. doi: 10.1017/neu.2019.17
42. Miller AH and Raison CL. The role of inflammation in depression: from evolutionary imperative to modern treatment target. Nat Rev Immunol. (2016) 16:22–34. doi: 10.1038/nri.2015.5
43. Zou XH, Sun LH, Yang W, Li BJ, and Cui RJ. Potential role of insulin on the pathogenesis of depression. Cell Prolif. (2020) 53:e12806. doi: 10.1111/cpr.12806
44. Enache D, Pariante CM, and Mondelli V. Markers of central inflammation in major depressive disorder: A systematic review and meta-analysis of studies examining cerebrospinal fluid, positron emission tomography and post-mortem brain tissue. Brain Behav Immun. (2019) 81:24–40. doi: 10.1016/j.bbi.2019.06.015
45. Medina-Rodriguez EM and Beurel E. Blood brain barrier and inflammation in depression. Neurobiol Dis. (2022) 175:105926. doi: 10.1016/j.nbd.2022.105926
46. Ng A, Tam WW, Zhang MW, Ho CS, Husain SF, McIntyre RS, et al. IL-1β, IL-6, TNF- α and CRP in elderly patients with depression or alzheimer’s disease: systematic review and meta-analysis. Sci Rep. (2018) 8:12050. doi: 10.1038/s41598-018-30487-6
47. Kruse JL, Cho JH, Olmstead R, Hwang L, Faull K, Eisenberger NI, et al. Kynurenine metabolism and inflammation-induced depressed mood: A human experimental study. Psychoneuroendocrinology. (2019) 109:104371. doi: 10.1016/j.psyneuen.2019.104371
48. Shahdadian F, Saneei P, Lotfi K, Feizi A, Askari G, and Safavi SM. Association of plant-based diets with adropin, atherogenic index of plasma, and metabolic syndrome and its components: A cross-sectional study on adults. Front Nutr. (2023) 10:1077709. doi: 10.3389/fnut.2023.1077709
49. Pan A, Keum N, Okereke OI, Sun Q, Kivimaki M, Rubin RR, et al. Bidirectional association between depression and metabolic syndrome: a systematic review and meta-analysis of epidemiological studies. Diabetes Care. (2012) 35:1171–80. doi: 10.2337/dc11-2055
50. Moradi Y, Albatineh AN, Mahmoodi H, and Gheshlagh RG. The relationship between depression and risk of metabolic syndrome: a meta-analysis of observational studies. Clin Diabetes Endocrinol. (2021) 7:4. doi: 10.1186/s40842-021-00117-8
51. Assempoor R, Daneshvar MS, Taghvaei A, Abroy AS, Azimi A, Nelson JR, et al. Atherogenic index of plasma and coronary artery disease: a systematic review and meta-analysis of observational studies. Cardiovasc Diabetol. (2025) 24:35. doi: 10.1186/s12933-025-02582-2
52. Ogunmoroti O, Osibogun O, Spatz ES, Okunrintemi V, Mathews L, Ndumele CE, et al. A systematic review of the bidirectional relationship between depressive symptoms and cardiovascular health. Prev Med. (2022) 154:106891. doi: 10.1016/j.ypmed.2021.106891
53. Ziwei Z, Hua Y, and Liu A. Bidirectional association between depressive symptoms and cardiovascular disease in the middle-aged and elderly Chinese: a 5-year longitudinal study. BMJ Open. (2023) 13:e071175. doi: 10.1136/bmjopen-2022-071175
54. Zhang S, Hou Z, Fei D, Zhang X, Gao C, Liu J, et al. Associations between triglyceride glucose index and depression in middle-aged and elderly adults: A cross-sectional study. Med (Baltimore). (2023) 102:e35530. doi: 10.1097/md.0000000000035530
55. Zheng L, Cui C, Yue S, Yan H, Zhang T, Ding M, et al. Longitudinal association between triglyceride glucose index and depression progression in middle-aged and elder adults: A national retrospective cohort study. Nutr Metab Cardiovasc Dis. (2023) 33:507–15. doi: 10.1016/j.numecd.2022.11.015
56. Curl CC, Leija RG, Arevalo JA, Osmond AD, Duong JJ, Huie MJ, et al. Altered glucose kinetics occurs with aging: a new outlook on metabolic flexibility. Am J Physiol Endocrinol Metab. (2024) 327:E217–e28. doi: 10.1152/ajpendo.00091.2024
57. Kokkeler KJE, Marijnissen RM, Wardenaar KJ, Rhebergen D, van den Brink RHS, van der Mast RC, et al. Subtyping late-life depression according to inflammatory and metabolic dysregulation: a prospective study. Psychol Med. (2022) 52:515–25. doi: 10.1017/s0033291720002159
58. Cheong CY, Yap P, Yap KB, and Ng TP. Associations of inflammatory, metabolic, malnutrition, and frailty indexes with multimorbidity incidence and progression, and mortality impact: Singapore longitudinal aging study. Gerontology. (2023) 69:416–27. doi: 10.1159/000527428
59. Mehdi SMA, Costa AP, Svob C, Pan L, Dartora WJ, Talati A, et al. Depression and cognition are associated with lipid dysregulation in both a multigenerational study of depression and the National Health and Nutrition Examination Survey. Transl Psychiatry. (2024) 14:142. doi: 10.1038/s41398-024-02847-6
Keywords: atherogenic index of plasma, depression, meta-analysis, lipid metabolism disorders, biomarker
Citation: Chen G-L, Chen G-X and Wan W-T (2025) Association between atherogenic index of plasma and depression risk: a meta-analysis. Front. Psychiatry 16:1665118. doi: 10.3389/fpsyt.2025.1665118
Received: 13 July 2025; Accepted: 21 October 2025;
Published: 19 November 2025.
Edited by:
Marco Paolini, San Raffaele Hospital (IRCCS), ItalyReviewed by:
Laura Beth McIntire, NewYork-Presbyterian, United StatesShinsuke Hidese, Teikyo University, Japan
Copyright © 2025 Chen, Chen and Wan. This is an open-access article distributed under the terms of the Creative Commons Attribution License (CC BY). The use, distribution or reproduction in other forums is permitted, provided the original author(s) and the copyright owner(s) are credited and that the original publication in this journal is cited, in accordance with accepted academic practice. No use, distribution or reproduction is permitted which does not comply with these terms.
*Correspondence: Gui-Xin Chen, MTQxNjA1MzA0M0BxcS5jb20=