Abstract
Background:
Stress exacerbates major depressive disorder (MDD) and panic disorder (PD), highlighting the need for continuous stress quantification. Because stress modulates autonomic function, heart rate variability (HRV) is commonly studied for stress detection. However, conventional HRV pipelines require 5-min recordings and handcrafted features, limiting real-time use. We evaluated whether a one-dimensional (1D) residual network can identify acute cognitive stress directly from ultra-short RR interval (RRI) signals in MDD, PD, and healthy controls (HCs).
Methods:
One hundred forty-seven adults (MDD = 41, PD = 47, HC = 59) completed up to five lab visits over 12 weeks. At each visit, RRIs were recorded during a 5-min resting baseline and a 5-min mental-arithmetic stressor. A 1D ResNet34 classified baseline versus stress from raw RRIs using both 5-min segments and 1-min epochs. Group-specific models were compared with a combined model trained on pooled data. Generalized estimating equations tested group and phase effects on RRIs.
Results:
Stress shortened RRIs in every group, but less in patients with MDD and PD than in HC. Combined training outperformed group-specific training: for 5-min data, accuracies reached 0.866 (MDD), 0.865 (PD), and 0.897 (HC); 1-min accuracies were 0.788, 0.815, and 0.797, respectively.
Conclusion:
Deep learning on raw RRIs detects acute cognitive stress across psychiatric and healthy cohorts without feature engineering. Five-minute windows still yield the best performance, yet 1-min epochs still achieve accuracies of approximately 0.80, demonstrating feasibility for integration into real-time monitoring tools for relapse prevention and personalized care in psychiatry.
1 Introduction
Major depressive disorder (MDD) and anxiety disorders, including panic disorder (PD), affect more than 250 million and 300 million people worldwide, respectively, and are leading contributors to disability and diminished quality of life (1, 2). MDD is characterized by persistent low mood, anhedonia, and somatic symptoms (3, 4), whereas PD involves recurrent panic attacks and anticipatory anxiety that disrupt daily functioning (4, 5). Left untreated, both conditions can impair cognition and increase suicide risk (6–8).
Stress is an important psychosocial factor of these illnesses. Previous studies show that both chronic exposure to stressors and acute stressful events increase the likelihood of onset, relapse, and a more refractory disease course in MDD and PD (9–15). Consequently, technologies capable of continuously quantifying the severity and duration of stress at the individual level are needed to enhance treatment and long−term management. In response, research increasingly utilizes wearable sensors to detect stress through physiological signals, demonstrating the feasibility of unobtrusive stress monitoring in daily life (16).
Heart rate variability (HRV)—the variability in successive RR intervals (RRIs)—is a widely used proxy for autonomic nervous system (ANS) responses to stress (17–19). Conventional pipelines typically compute time, frequency, and non-linear features from 5-min ECG segments (20) and, in healthy samples, machine-learning models using these features often exceed 0.80 accuracy (21, 22). Shorter windows (1 min) can retain acceptable signals for classification, although longer windows may still be preferred when greater robustness is required (23, 24). Nonetheless, feature-based HRV pipelines depend on parameter choices and their reliance on 5-min segments limits high−resolution, real−time use.
Despite extensive work in healthy cohorts, automated stress detection in psychiatric populations remains limited. These disorders show autonomic dysregulation—reduced baseline vagal tone and altered sympathetic reactivity (25–30)—which can complicate classification. In our previous study, classical classifiers using 20 HRV features from 5-min windows during a stress-relaxation protocol achieved overall accuracies of 0.94–0.96, with lower performance in patients with MDD and PD than in healthy controls (HCs) (31). Yet this approach required uninterrupted 5-min windows and handcrafted features, motivating a raw-signal strategy with shorter inputs.
Deep neural networks for one-dimensional (1D) time series can learn discriminative representations directly from RRIs, removing the need for feature engineering. Prior work in healthy participants reported successful performance using 10–30 s RRI windows (32) or convolutional representations (33), but clinically diagnosed MDD or PD populations have been underrepresented.
We address this gap by evaluating end-to-end stress detection from raw RRIs in a clinically characterized cohort comprising MDD, PD, and HCs. We adapted ResNet34 to a 1D architecture and examined two window lengths: a conventional 5-min segment and an ultra-short 1-min epoch. The 1-min window balances feedback latency with performance and aligns with evidence that ultra-short HRV becomes more reliable at ≥ 60 s (34). We hypothesized that deep learning models trained on 1-min RRI segments would achieve accurate stress detection in both patient cohorts and HCs.
In summary, we proposed a deep-learning framework that (i) eliminates reliance on handcrafted HRV features, (ii) operates on ultra-short RRIs suitable for continuous wearable monitoring, and (iii) is validated across MDD, PD, and HC groups, thereby clarifying the utility of raw-RRI, end-to-end models in psychiatric populations.
2 Methods
2.1 Participants and study design
This study was part of a larger investigation examining changes in clinical symptoms and inflammatory biomarkers over 12 weeks to capture treatment effects (35). As these methods have been described in detail in our previous publication, we only briefly introduce them here (35). A total of 147 participants were included in the study: 41 patients with MDD, 47 patients with PD, and 59 HCs. All patients were recruited at the Samsung Medical Center in Seoul, Korea, between December 2015 and January 2017. The diagnosis of MDD and PD followed the Diagnostic and Statistical Manual of Mental Disorders, Fifth Edition (DSM-5) criteria (4), and was conducted by a senior psychiatrist. Exclusion criteria were pregnancy, history of substance or alcohol abuse, head injury, high suicide risk, personality disorders, severe physical illnesses, and use of long-acting medications. Throughout the 12-week experiment, all patients received standard pharmacotherapy. Participants’ acute-episode or stable-treatment status was not prospectively labeled at enrollment. HCs with no history of psychiatric issues or family history of mood disorders were recruited via general advertisements. The study protocol was approved by the Ethics Committee of the Samsung Medical Center (No. 2015-07-151), and all participants provided written informed consent. Each participant received $50 as compensation.
Each participant underwent a 12-week study with five scheduled lab visits at baseline and 2, 4, 8, and 12 weeks. At the initial and final visits, demographic information (e.g., age and sex) was collected and clinical evaluations, including Hamilton Depression (HAMD), Hamilton Anxiety (HAMA), and Panic Disorder Severity (PDSS) scales, were performed (36–38). Body mass index (BMI) was also measured given its known influence on ANS response (39).
2.2 Experimental protocol
The original protocol comprised five phases. In this study we analyzed only the 5-min resting baseline and the 5-min mental-arithmetic stress (MAT) phases to detect stress-induced changes in continuously measured RRIs (Figure 1A). During baseline, participants rested quietly; during MAT, they performed serial-7 subtraction from 500 with error correction, a validated cognitive stressor known to modulate autonomic indices (40–44). The remaining recovery, relaxation, and final rest phases are described in the Supplementary Methods. Sessions were conducted by trained investigators in the clinical laboratory.
Figure 1
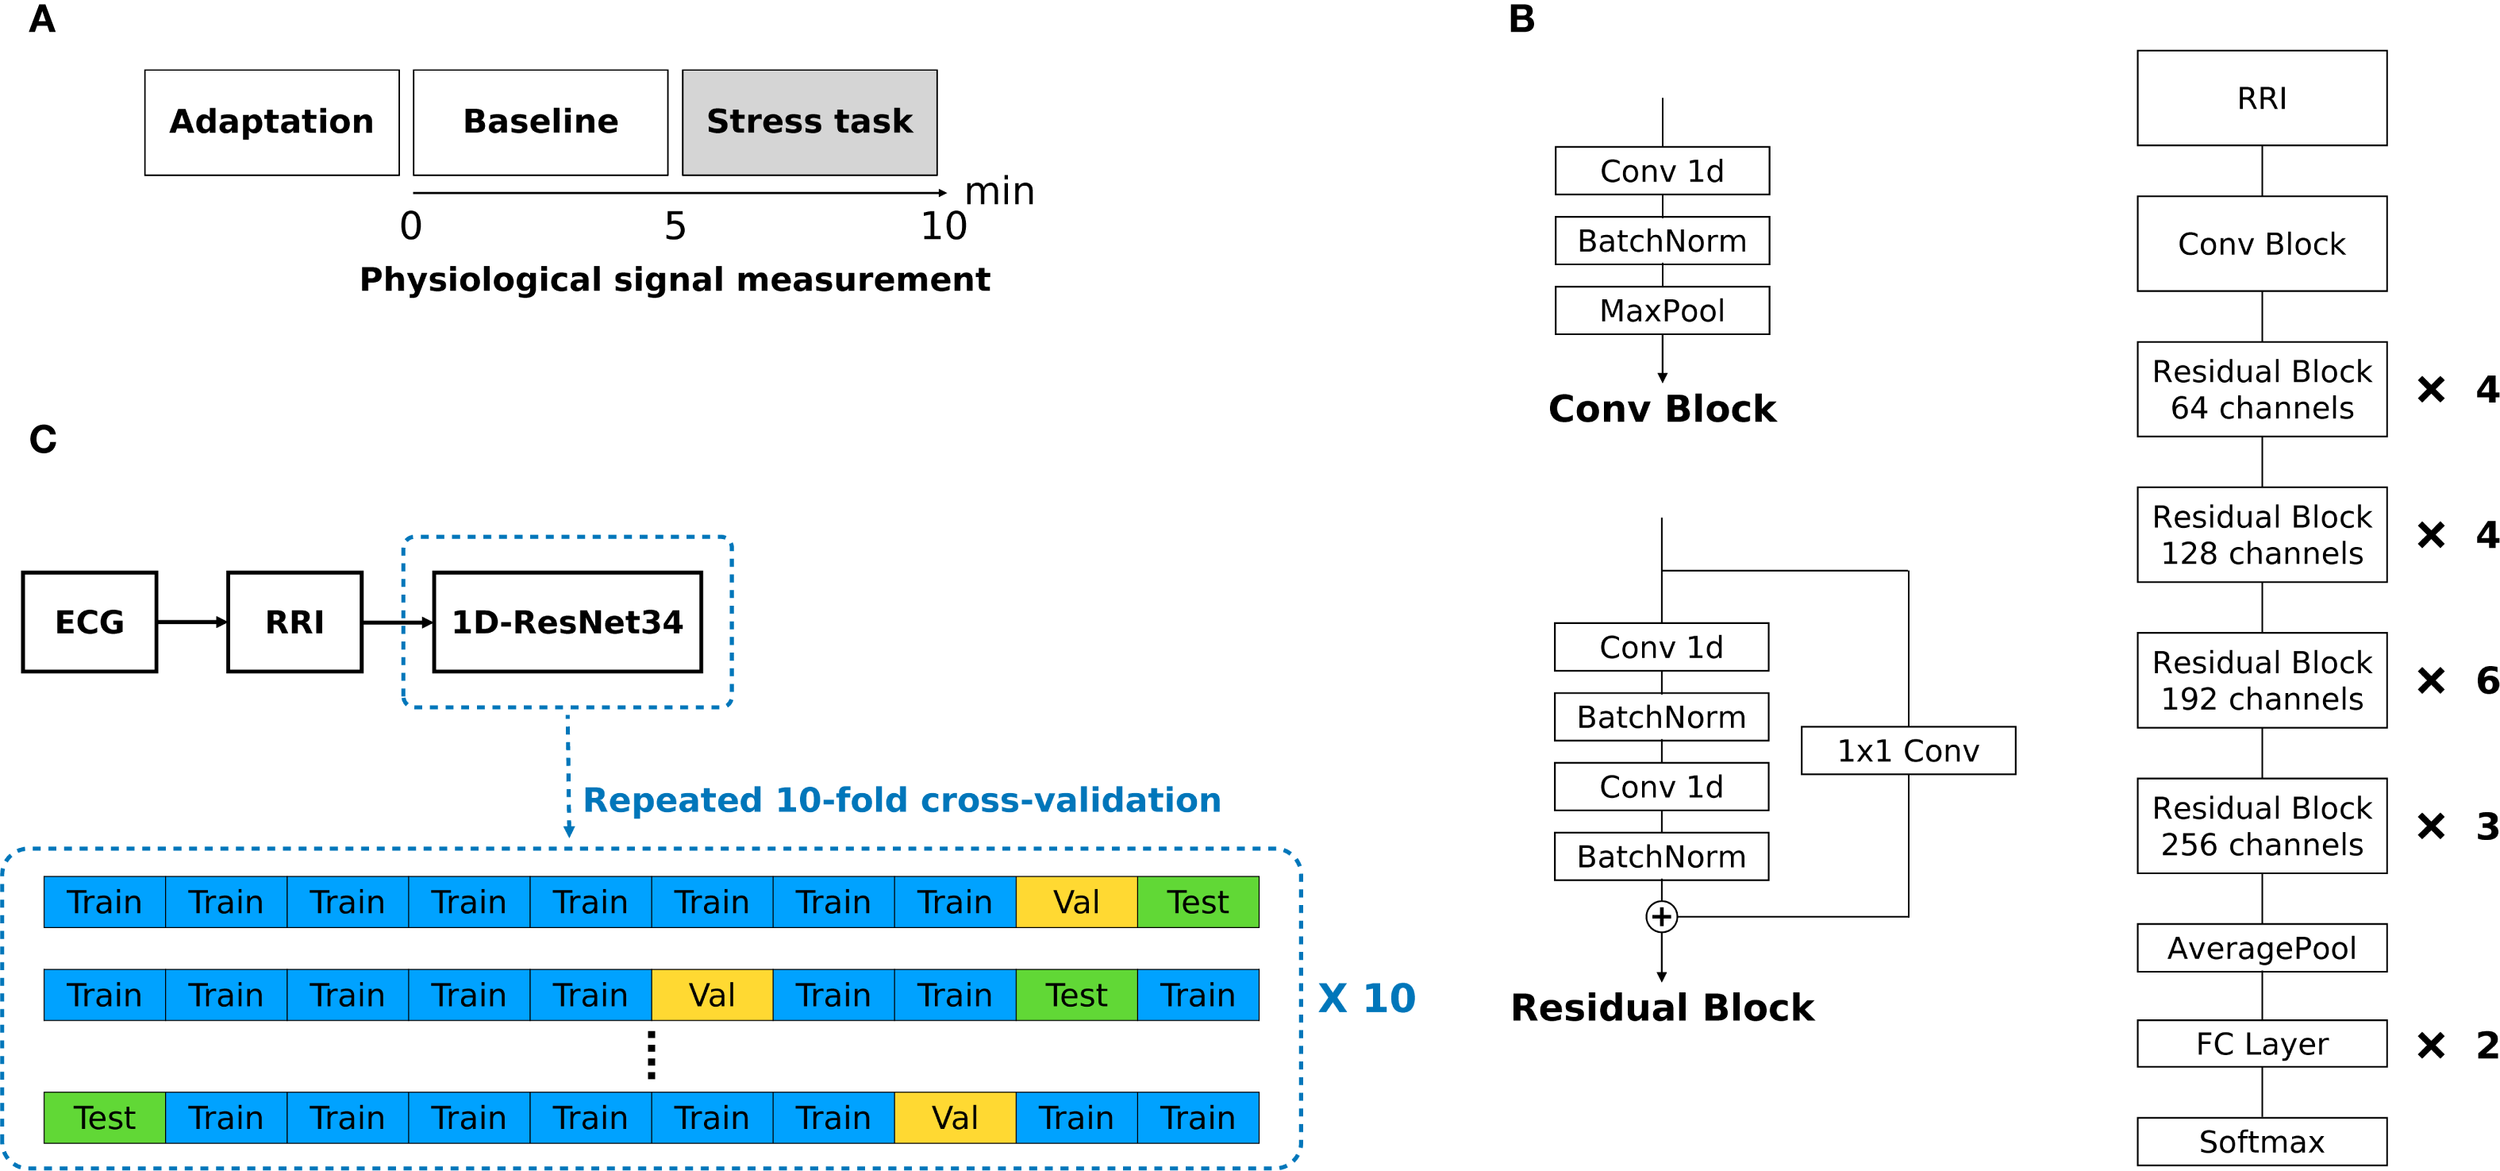
(A) Experimental protocol. (B) Overall architecture of modified 1D ResNet34. (C) Overview of data processing.
2.3 RRI measurement
All measurements were conducted during working hours to reduce variability associated with time of day, mood, and rest (45–47). Electrocardiogram (ECG) signals were captured using the ProComp Infiniti system (SA7500, Thought Technology, Montreal, Canada) at a sampling rate of 256 Hz (20). RRIs were then extracted and processed in Kubios HRV Premium (48, 49) using an in-house developed QRS detection algorithm based on the Pan-Tompkins method. Each RRI series was resampled to an equidistant 4 Hz data using cubic-spline interpolation. Supplementary Figure S1 presents an example of the RRI values measured during the baseline and stress phases. Full measurement details are provided in the Supplementary Methods.
2.4 Statistical analyses
All analyses were performed using SPSS version 25 (SPSS Inc., Chicago, IL, USA) and Python version 3.11.4 (Python Software Foundation). One-way analysis of variance (ANOVA) was used for demographic and clinical variables across the MDD, PD, and HC groups, except for sex (chi-square test). For 5-min RRIs, we used generalized estimating equations (GEE) to estimate population-average phase and group effects after preliminary mixed-effects models indicated substantial within-subject autocorrelation. GEE is appropriate for correlated repeated measures and yields robust standard errors (50, 51). Fixed effects were phase (baseline, stress; baseline = reference), group (MDD, PD, HC; HC = reference), phase × group, and visit (1–5, categorical). Participants were treated as clusters, observations were ordered by visit and then phase, and an exchangeable working correlation was adopted because an AR (1) structure failed to converge when some clusters contained only two observations. To test whether the change from baseline to stress differed within each group, we computed phase-specific contrasts by summing the main phase effect with its interaction term for each group, and evaluated these contrasts using Wald z-statistics. Similarly, we then fitted a GEE to the 1-min RRI epochs—the last two minutes of the baseline (B4 and B5) and the first two minutes of the stress task (S1 and S2). The fixed-effects design was as follows: epoch (B4, B5, S1, and S2; S1 = reference) × group (MDD, PD, and HC; HC = reference) + visit (1–5), with participants as clusters. For each group, we obtained epoch-specific contrasts to determine whether the 1-min RRI during B4, B5, or S2 differed significantly from that during S1. A P value of < 0.05 was considered statistically significant.
2.5 Deep-learning architecture
We converted ResNet34 into a 1D architecture for raw RRI signals, as shown in Figure 1B (52, 53). ResNet was selected because of its strong time-series performance and prior success with RRI arrhythmia classification (54, 55). The model began with a convolutional block comprising a single 1D convolution, batch normalization, and max pooling. Each residual block contained three 1D convolutional layers and two batch-normalization layers, with an additional 1D convolution (kernel size = 1) as the shortcut connection. Gaussian error linear units (GELU) replaced ReLU activations throughout, and batch normalization preceded each activation to capture subtler non-linear patterns. The network processed fixed-length inputs of 1200 points for a 5-min RRI segment and 240 points for a 1-min RRI epoch, padding shorter sequences with zeros. Supplementary Table S1 lists details of the model architecture. Supplementary Figure S2 shows representative training and validation loss curves produced by the modified 1D ResNet34 classifier.
2.6 Performance evaluation and training strategy
Model performance was evaluated using 10× repeated 10-fold cross-validation (CV) (Figure 1C). To prevent cross-participant contamination (data leakage), splits were made at the participant level to ensure that no subject appeared in both the training and test sets. In each split, eight folds were used for training, one for validation, and one for testing. This process was repeated 10 times with different random seeds. We report accuracy, the area under the receiver operating characteristic curve (AUROC), sensitivity, and specificity as the mean ± standard deviation across repetitions. For 5-min RRIs, the classifier distinguished between baseline and stress (with stress being positive). For 1-min RRIs, we evaluated three binary tasks: B4 vs. B5 (B4 = positive), B5 vs. S1 (S1 = positive), and S1 vs. S2 (S2 = positive).
The two training strategies were compared. Separate models were trained and evaluated within each diagnostic cohort (MDD, PD, and HC) using only that group’s data. The combined models were trained on a pooled dataset comprising all the groups, after which the performance metrics were computed separately for each cohort in the test datasets. A full schedule (147 participants × 5 visits) would have produced 735 recordings, but missed visits left 650 baseline and 650 stress samples (181 MDD, 191 PD, and 278 HC) for a total of 1300 used in the analysis. Of the 147 participants, 110 completed five visits, 16 completed four, 4 completed three, 7 completed two, and 10 completed one. All attended visits included both phases; therefore, no RRI datasets were missing, and no imputation was required. Analyses used all available visit-level observations. Classifications were executed using Python.
3 Results
3.1 Demographic and clinical characteristics
Supplementary Table S2 presents the demographic and clinical profiles of participants from the same cohort examined in our previous study (31). No significant differences in age, sex, or BMI were observed among the groups. As expected, participants with MDD and PD scored higher on the HAMD and HAMA than the controls, indicating more severe depressive and anxiety symptoms. The PDSS was the highest in the PD group, followed by the MDD group, and lowest in the HC group, consistent with diagnostic expectations.
3.2 RRI measurement results: stress-induced changes and between-group differences
Figure 2A and Supplementary Table S3 show the RRI values measured for each group (MDD, PD, and HC) during the baseline and stress phases. Additionally, we presented within-subject changes in RRI (ΔRRI) from baseline to the stress task for each participant as presented in Figure 2B and Supplementary Table S4. The stress task elicited a significant decrease in mean RRI in every group (all P < 0.001), reflecting sympathetic activation with vagal (parasympathetic) withdrawal, which was observed as shorter RRI under stress (Supplementary Table S5). However, the magnitude of this reduction differed by group; it was significantly smaller in both the MDD group (P = 0.031) and the PD group (P < 0.001) than in HC, indicating that healthy participants exhibited the largest change from baseline (Supplementary Table S5).
Figure 2
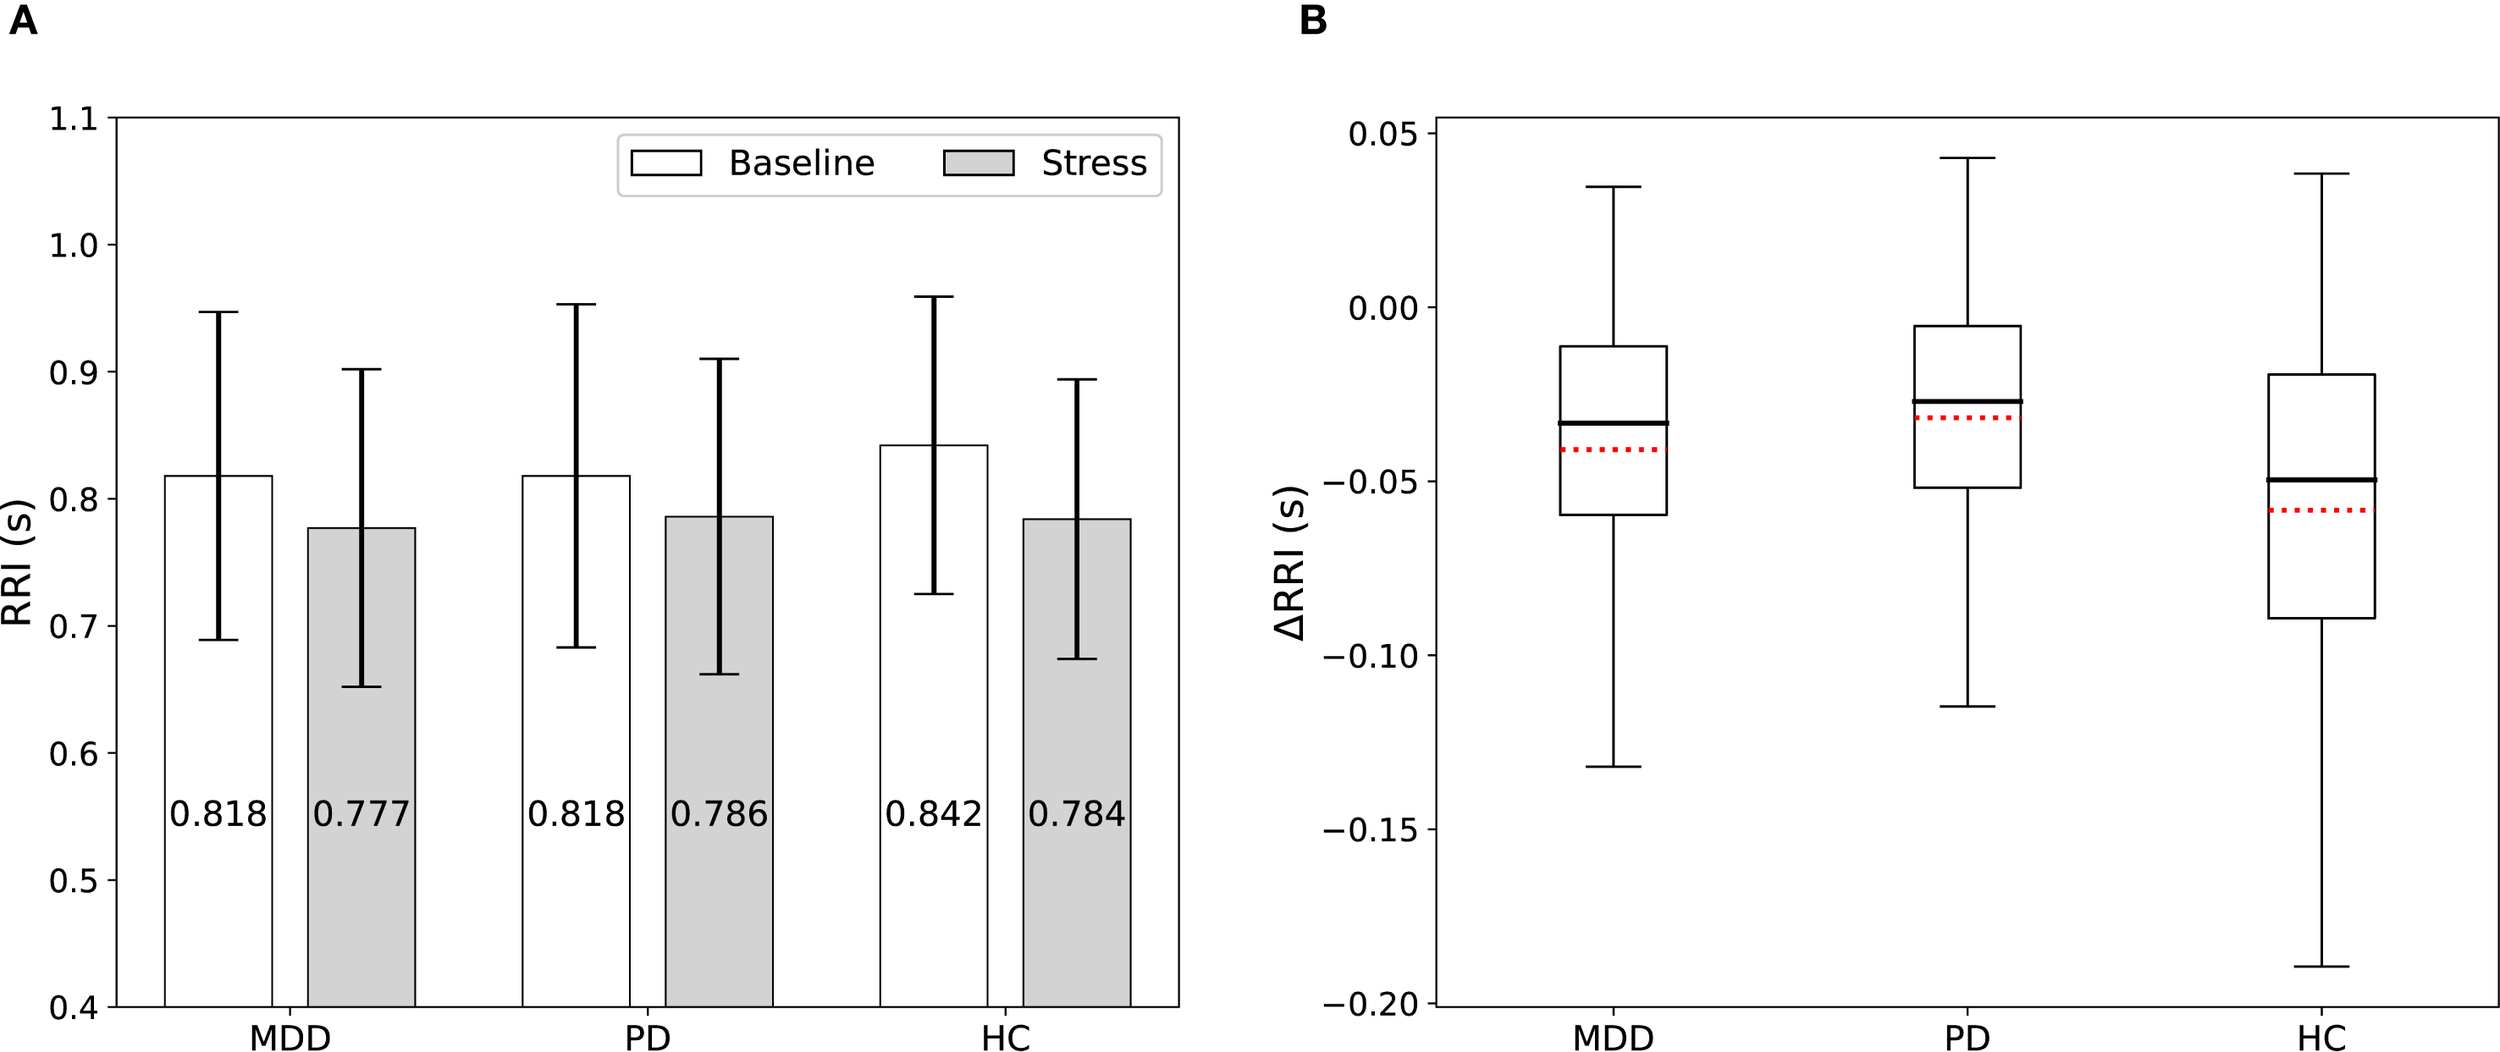
(A) RRI among the MDD, PD, and HC groups measured during the baseline and stress phases. Stress shortened RRI in all groups, but the magnitude of the reduction was smaller in patients. (B) Box plots display the ΔRRI. Red dotted lines indicate mean values.
3.3 Stress detection using 5-min RRIs
Classification performance for distinguishing baseline from stress is summarized in Figure 3 and Supplementary Table S6. When separate models were trained and tested exclusively on each diagnostic group, the highest accuracy was achieved by the HC group (0.866), followed by the PD (0.795) and MDD (0.784) groups. Notably, training a single “combined” model on data from all three groups improved performance for each group: HC accuracy rose to 0.897, while MDD and PD reached 0.866 and 0.865, respectively. Even within the combined model, HC consistently outperformed the clinical groups.
Figure 3
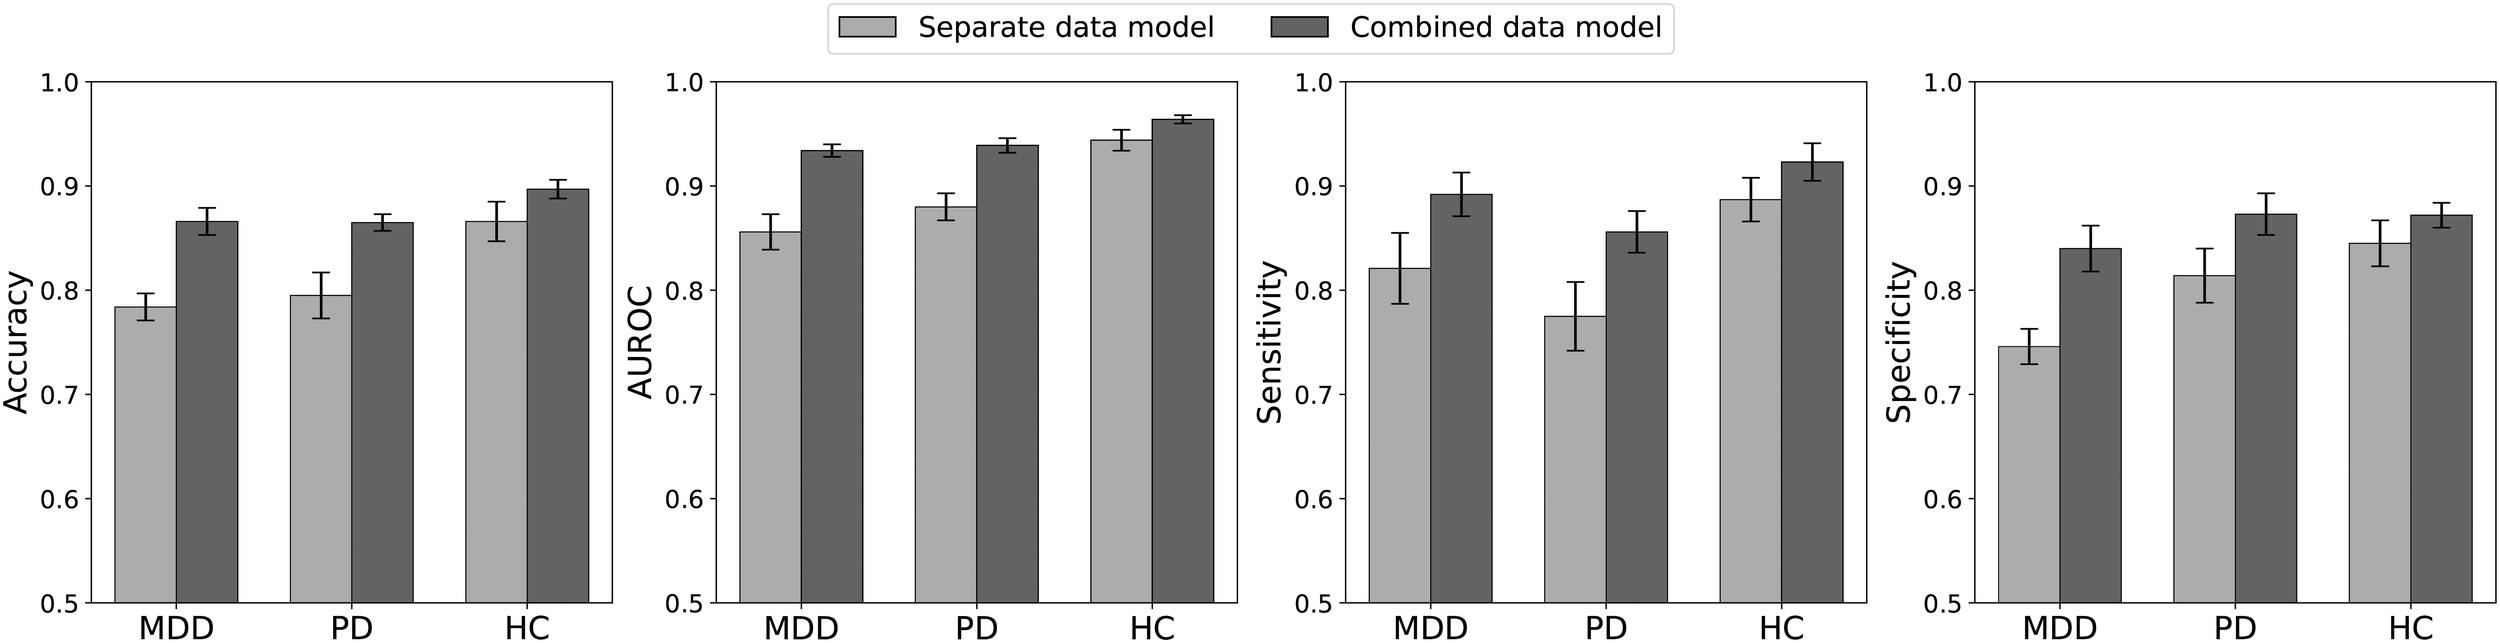
Performance measures for classifying the baseline and stress phases based on 5-min RRIs. Separate data models were trained and tested, each exclusively using the data from one specific patient group. For the combined data model, data from all groups were pooled for training, and the metrics were calculated separately for each patient group in the test dataset. The combined model outperformed the separate models across all groups, with HC generally achieving the highest accuracy.
Analysis of the performance metrics indicates that the combined model generally outperformed the separate models for each group. Notably, across all these metrics, the HC group tended to outperform the other two clinical groups. The only exception was that, under the combined model, the specificity of the PD group was slightly higher than that of the HC group. In summary, despite being exposed to the same stress stimulus, the HC group achieved more accurate stress detection than the two clinical groups. Moreover, a model trained on pooled data from all groups produced better overall performance, underscoring the benefits of using a more diverse training set to enhance classification accuracy across diagnostic categories.
3.4 Stress detection using 1-min RRIs
We conducted an additional analysis in which the continuous RRI series was segmented into four non-overlapping 1-min epochs—the last two minutes of baseline (B4 and B5) and the first two minutes of the stress task (S1 and S2). Figure 4A and Supplementary Table S7 show the RRI changes across the four 1-min epochs for each group. RRI during S1 was significantly lower than during either baseline epoch (B4 or B5) across all groups (all P < 0.001) (Supplementary Table S8). The B5-to-S1 decrease differed across groups; both patient groups—MDD (P = 0.004) and PD (P < 0.001)—showed a smaller decrease than HCs, consistent with the 5-min phase analysis. RRI rebounded from S1 to S2 in HC (P < 0.001) and PD (P = 0.001), but not in MDD, and this S1-to-S2 change did not differ between HC and PD patients (Supplementary Table S8).
Figure 4
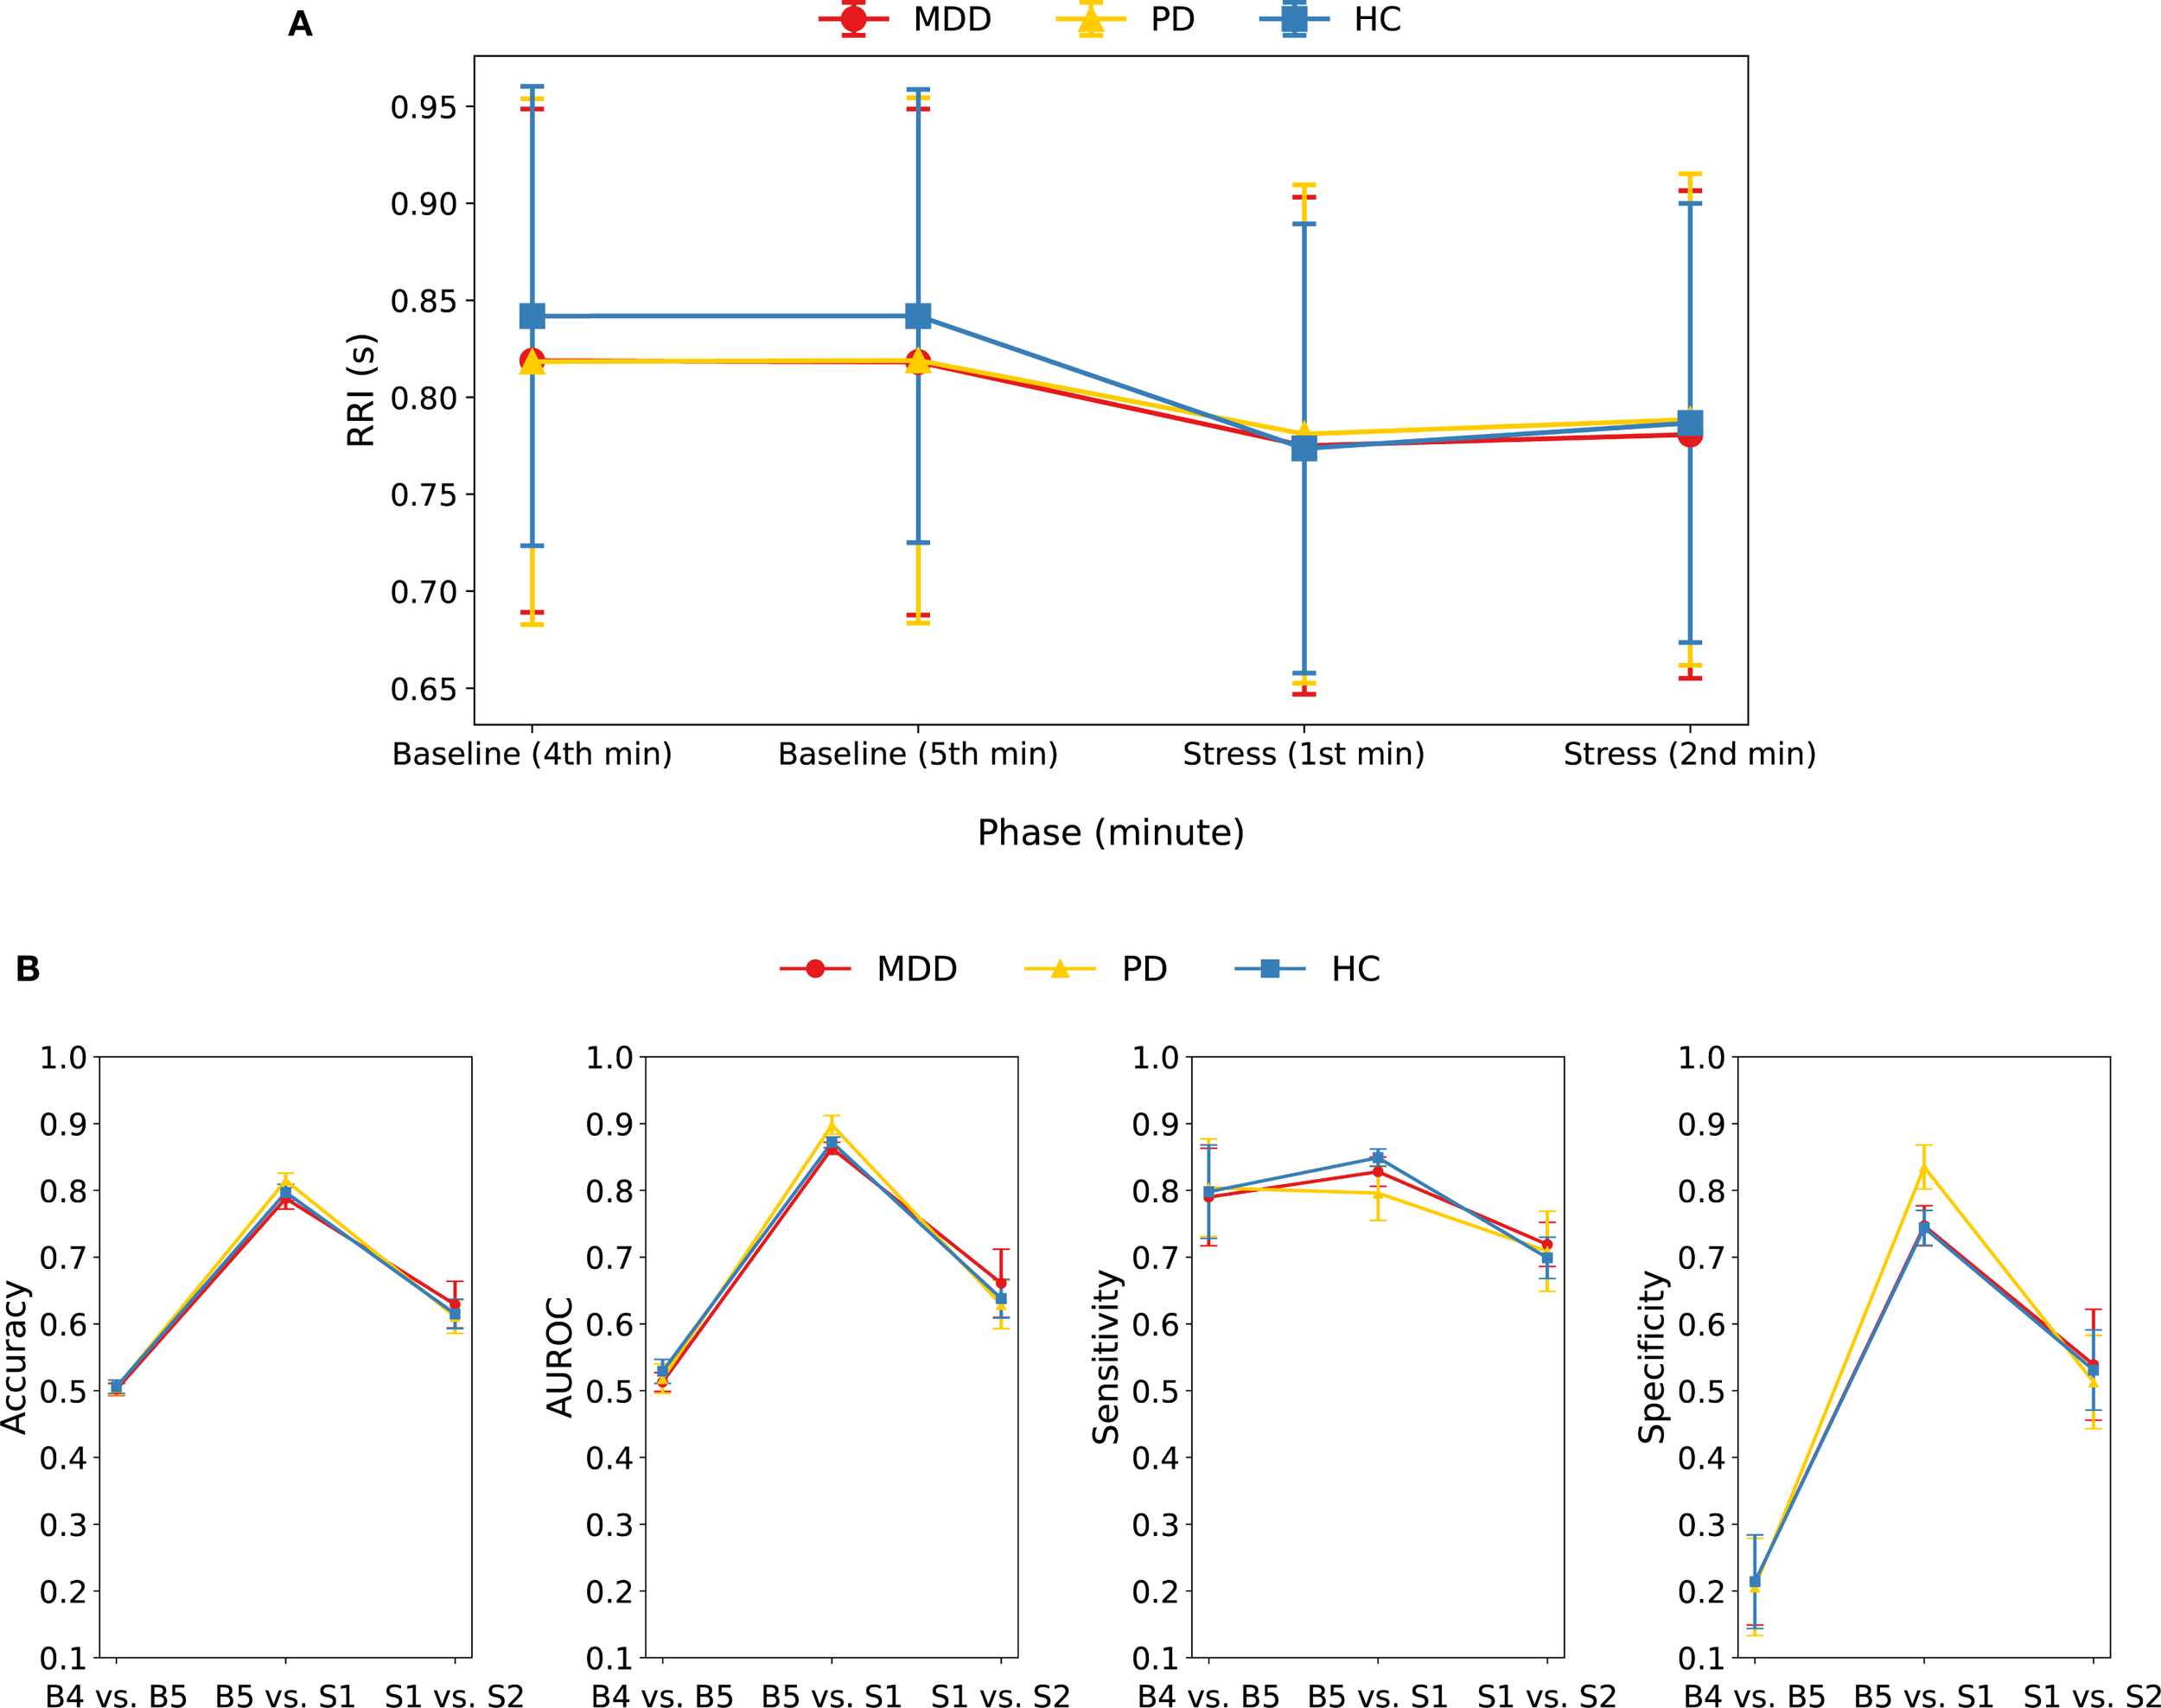
(A) Mean and standard deviation of RRI for each group during four consecutive 1-min epochs: the last two minutes of baseline (B4, B5) and the first two minutes of the stress task (S1, S2). RRI during S1 was lower than B4 and B5 in all groups; the decrease from B5 to S1 was smaller in MDD and PD than in HC, and RRI rebounded from S1 to S2 in HC and PD, but not in MDD. (B) Performance metrics of the combined model when classifying 1-min RRI epochs in three pairwise comparisons (B4 vs. B5, B5 vs. S1, S1 vs. S2) within each group.
We evaluated three binary classification tasks: B4 vs. B5, B5 vs. S1, and S1 vs. S2, within each group by applying the combined model to 1-min RRI segments (Figure 4B, Supplementary Table S9). Baseline minutes (B4 vs. B5) were indistinguishable (accuracy = ~0.50), whereas the baseline-to-stress change (B5 vs. S1) was detected with high accuracy (0.79–0.82). Discriminating the two stress minutes (S1 vs. S2) produced intermediate performance (accuracy = 0.61–0.63), indicating additional but less pronounced autonomic change beyond the initial stress response. Collectively, these findings confirm that the transition from baseline to stress is readily detectable within the first minute, whereas intra-baseline differences are negligible, and also that stress-epoch differentiation is modest.
A closer inspection of the B5 vs. S1 classification revealed that shortening the analysis window from 5-min segments to 1-min RRI epochs lowered overall performance: accuracy dropped by 0.10 in the HC, 0.08 in the MDD, and 0.05 in the PD groups, respectively. In this 1-min analysis, accuracy was highest in the PD group, followed by the HC and then MDD groups, whereas the 5-min model had HC at the top. Notably, although HC showed the largest mean 1-min RRI drop from baseline to stress, its accuracy still trailed PD’s. The PD group also achieved the highest specificity, indicating that baseline epochs were misclassified as stress less often than in the other groups. The shift in accuracy between 5- and 1-min inputs likely reflects group-specific temporal dynamics, whereby window length interacts with each group’s reactivity time course, explaining the change in ranking. For an overall comparison of the 1-min and 5-min models, group-specific ROC curves (MDD, PD, HC) from the combined model are shown in Supplementary Figure S3.
4 Discussion
This study investigated whether a 1D residual neural network could directly identify acute cognitive stress from raw RRI sequences in patients with MDD, PD, and HC. When the 5-min RRIs were analyzed with a model trained on the pooled dataset, accuracies reached 0.866 in MDD, 0.865 in PD, and 0.897 in HCs. Using 1-min windows lowered performance, yet accuracy remained at 0.788, 0.815, and 0.797 in the same groups. Taken together, these results demonstrate that raw signal models can approach 80% accuracy for stress classification—even in psychiatric cohorts—using recording periods as short as 1 min and without reliance on handcrafted HRV features.
All three diagnostic groups demonstrated a significant reduction in the RRI during the MAT, indicating that the protocol effectively triggered sympathetic and vagal withdrawal responses. Notably, the extent of RRI reduction during the stress phase was less pronounced in individuals with MDD or PD than in HCs. This finding aligns with existing literature suggesting altered autonomic reactivity in psychiatric disorders (28–30, 56). Importantly, this pattern of results was consistent across both the 5-min and 1-min windows, highlighting that significant clinical group differences can be detected even in ultra-short recordings.
The model performance reflected these physiological trends. For 5-min segments, the HC group—showing the largest RRI change—achieved the highest accuracy; MDD and PD, which displayed smaller ΔRRI, were classified less accurately. Pooling data for training across the groups improved the accuracy in every group, implying that a common representation of stress exists in raw RRIs that can be exploited through multi-cohort learning, even when absolute reactivity differs. In contrast, shortening the analysis window reduced accuracy more steeply in HCs than in patients: the HC reduction was roughly 0.10, compared with 0.05–0.08 in MDD and PD. This inversion suggests that the current ResNet model captures short-lived, patient-specific patterns in the RRI signal that remain detectable at 1-min scales, whereas a more pronounced but slower HC response is partially lost when only 1-min data are available.
We adopted a 1-min RRI window—the shortest duration considered reliable in ultra-short HRV research (34)—because no RRI-specific benchmark clearly defines how segment length affects stress-classification performance (32). In our study, shortening the input from 5-min to 1-min lowered accuracy by up to 0.10, indicating a length-performance trade-off. Windows shorter than 1-min will probably decrease accuracy further, but this needs confirmation. Future work should test sub-minute windows while also verifying that the stress protocol remains sufficiently potent at such short time scales.
Within the 5-min stress phase, RRI increased modestly between the first and second minutes (S1 vs. S2) in HCs and patients with PD, but not in patients with MDD. The lack of an RRI rebound from S1 to S2 in MDD is compatible with the impaired autonomic adaptability reported in depression and may reflect slower recovery. Although accuracy for classifying S1 and S2 was only 0.61–0.63, these results suggest that the network was able to detect physiologically meaningful variation within the continuous stress period. Participants may have experienced the greatest sympathetic activation during the initial minute of the MAT, followed by partial autonomic adaptation as subtraction continued. The resulting attenuation of arousal would manifest as a rebound in RRI, which the deep-learning model captured, despite the small change in RRI. As the current protocol imposed a uniform 5-min stress block, the temporal evolution of stress-related RRIs could not be examined in finer detail. Future studies should employ stress paradigms that vary in duration or stimulus type—potentially replacing the MAT—to characterize minute-by-minute autonomic dynamics and evaluate whether sub-segments of the stress phase can be distinguished with higher precision.
Compared to studies focused solely on healthy individuals, our results provide a direct benchmark. Reviews in healthy volunteers typically report an accuracy of 0.80–0.95 with HRV features (21, 22) and approximately 0.85–0.90 with 10–30 s RRIs using deep learning (32, 33). Here, an end-to-end model trained directly on raw RRIs achieved 0.87–0.90 with 5-min inputs and 0.79–0.82 with 1-min inputs, while extending validation to clinically diagnosed MDD and PD. This highlights the novelty of raw signal stress detection in psychiatric cohorts and the benefit of pooled training.
The ability to detect stress from 1-min data intervals enhances the feasibility of real-world applications. Contemporary wearable devices are capable of acquiring such ultra-short cardiac segments with adequate signal fidelity (57), enabling the implementation of a sliding window approach to compute stress probabilities in near-real time. This is particularly beneficial for psychiatric patients, who often experience exacerbations of stress-related symptoms. For example, these tools could be integrated into practice to provide continuous monitoring for patients at high risk of relapse, enabling timely intervention. Furthermore, objective stress data could assist clinicians in personalizing pharmacological therapy and tracking treatment efficacy. However, continuous stress monitoring in psychiatric care carries ethical and practical considerations. Issues such as patient acceptability, the risk of over-medicalization from misinterpreting data, and data privacy should be carefully addressed before these tools can be responsibly integrated into clinical care.
4.1 Limitations
All patients received pharmacotherapy, which may modulate autonomic tone and partially alter stress responses, thereby influencing classification. While antidepressants can affect HRV, the evidence is mixed (58, 59). We also lacked prospective stratification by acute vs. stable clinical status and by treatment response, both of which could influence autonomic reactivity and HRV-based stress responses. Future studies should incorporate status- and response-based analyses. Sample size also limits generalization, particularly for MDD. We did not stratify model performance by sex or age; future larger cohorts should assess the effects of subgroups.
The MAT is an artificial laboratory task; performance in naturalistic settings, where stressors are diverse and confounded by physical activity, remains to be tested. Only RRI signals were analyzed. Fusion with electrodermal activity (EDA) or accelerometry may improve robustness, particularly when motion artifacts are present. Finally, although ResNet34 performed well, alternative sequence models were not evaluated and could yield further gains.
Future research should assess the model’s generalizability in ambulatory settings that involve free-living stressors and physical activity. Adaptive windowing strategies may further improve real-time performance, whereas multimodal fusion—combining RRI with EDA or other physiological signals—could enhance classification accuracy (60–62). Clinically, longitudinal studies that relate daily stress estimates to symptom trajectories and treatment responses are needed to determine whether RRI-based monitoring translates into better patient outcomes.
5 Conclusion
Deep learning applied to raw RRIs detects acute cognitive stress in healthy individuals and patients with MDD or PD. The method effectively obviates engineered HRV features and functions on 1-min windows, a duration compatible with contemporary wearable devices. Although 5-min segments still yield the highest accuracy, the modest loss in performance observed with 1-min windows is outweighed by the gains in temporal resolution and real-world applicability. These findings support the integration of raw-signal, end-to-end models into mobile psychiatry with the goal of delivering objective stress assessments.
Statements
Data availability statement
The datasets presented in this article are not readily available because of privacy restrictions. Requests to access the datasets should be directed to Sangwon Byun, swbyun@inu.ac.kr.
Ethics statement
The studies involving humans were approved by Ethics Committee of Samsung Medical Center in Seoul, Korea (No. 2015-07-151). The studies were conducted in accordance with the local legislation and institutional requirements. The participants provided their written informed consent to participate in this study.
Author contributions
KL: Formal Analysis, Methodology, Visualization, Writing – original draft, Writing – review & editing, Data curation, Investigation, Software, Validation. CC: Conceptualization, Funding acquisition, Writing – original draft, Writing – review & editing, Supervision. AK: Conceptualization, Data curation, Funding acquisition, Writing – original draft, Writing – review & editing. HJ: Funding acquisition, Supervision, Writing – original draft, Writing – review & editing. SB: Conceptualization, Formal Analysis, Methodology, Supervision, Writing – original draft, Writing – review & editing, Data curation, Investigation, Software, Validation.
Funding
The author(s) declare financial support was received for the research and/or publication of this article. This work was supported by Institute for Information & communications Technology Promotion (IITP) grant funded by the Korea government (MSIT, No. RS-2023-00224823) and the Incheon National University research grant in 2023.
Conflict of interest
Author HJ was employed by the company Meditrix Co., Ltd.
The remaining authors declare that the research was conducted in the absence of any commercial or financial relationships that could be construed as a potential conflict of interest.
Generative AI statement
The author(s) declare that Generative AI was used in the creation of this manuscript. Grammarly AI is used to enhance the quality of writing.
Any alternative text (alt text) provided alongside figures in this article has been generated by Frontiers with the support of artificial intelligence and reasonable efforts have been made to ensure accuracy, including review by the authors wherever possible. If you identify any issues, please contact us.
Publisher’s note
All claims expressed in this article are solely those of the authors and do not necessarily represent those of their affiliated organizations, or those of the publisher, the editors and the reviewers. Any product that may be evaluated in this article, or claim that may be made by its manufacturer, is not guaranteed or endorsed by the publisher.
Supplementary material
The Supplementary Material for this article can be found online at: https://www.frontiersin.org/articles/10.3389/fpsyt.2025.1672260/full#supplementary-material
References
1
Liu Q He H Yang J Feng X Zhao F Lyu J . Changes in the global burden of depression from 1990 to 2017: Findings from the Global Burden of Disease study. J Psychiatr Res. (2020) 126:134–40. doi: 10.1016/j.jpsychires.2019.08.002
2
Javaid SF Hashim IJ Hashim MJ Stip E Samad MA Ahbabi A . Epidemiology of anxiety disorders: global burden and sociodemographic associations. Middle East Curr Psychiatry. (2023) 30:44. doi: 10.1186/s43045-023-00315-3
3
Luppa M Heinrich S Angermeyer MC König HH Riedel-Heller SG . Cost-of-illness studies of depression. J Affect Disord. (2007) 98:29–43. doi: 10.1016/j.jad.2006.07.017
4
American Psychiatric Association . Diagnostic and statistical manual of mental disorders. 5th. Washington, DC: American Psychiatric Publishing (2013).
5
Ballenger JC . Toward an integrated model of panic disorder. Am J Orthopsychiatry. (1989) 59:284–93. doi: 10.1111/j.1939-0025.1989.tb01661.x
6
Baxter AJ Patton G Scott KM Degenhardt L Whiteford HA . Global epidemiology of mental disorders: what are we missing? PloS One. (2013) 8:1–9. doi: 10.1371/journal.pone.0065514
7
Nochaiwong S Ruengorn C Thavorn K Hutton B Awiphan R Phosuya C et al . Global prevalence of mental health issues among the general population during the coronavirus disease-2019 pandemic: a systematic review and meta-analysis. Sci Rep. (2021) 11:1–18. doi: 10.1038/s41598-021-89700-8
8
Polanczyk GV Salum GA Sugaya LS Caye A Rohde LA . Annual research review: A meta-analysis of the worldwide prevalence of mental disorders in children and adolescents. J Child Psychol Psychiatry Allied Discip. (2015) 56:345–65. doi: 10.1111/jcpp.12381
9
Kendler KS Karkowski LM Prescott CA . Causal relationship between stressful life events and the onset of major depression. Am J Psychiatry. (1999) 156:837–41. doi: 10.1176/ajp.156.6.837
10
Hammen C . Stress and depression. Annu Rev Clin Psychol. (2005) 1:293–319. doi: 10.1146/annurev.clinpsy.1.102803.143938
11
Hammen C Kim EY Eberhart NK Brennan PA . Chronic and acute stress and the prediction of major depression in women. Depress Anxiety. (2009) 26:718–23. doi: 10.1002/da.20571
12
Goddard AW . The Neurobiology of Panic: A Chronic Stress Disorder. (Thousand Oaks). (2017). doi: 10.1177/2470547017736038
13
Domschke K Klauke B Deckert J Reif A Pauli P . Life Events in panic disorder-An update on “candidate stressors”. Depress Anxiety. (2010) 27:716–30. doi: 10.1002/da.20667
14
Conway CC Rutter LA Brown TA . Chronic environmental stress and the temporal course of depression and panic disorder: A trait-state-occasion modeling approach. J Abnormal Psychol. (2016) 125:53–63. Conway, Christopher C.: Department of Psychology, College of William & Mary, 540 Landrum Drive, Williamsburg, VA, US, 23188, conway@wm.edu: American Psychological Association. doi: 10.1037/abn0000122
15
Kessler RC . The effects of stressful life events on depression. Depress Sci Ment Heal. (2013) 6:67–91. doi: 10.1146/annurev.psych.48.1.191
16
Hickey BA Chalmers T Newton P Lin CT Sibbritt D McLachlan CS et al . Smart devices and wearable technologies to detect and monitor mental health conditions and stress: A systematic review. Sensors. (2021) 21:1–17. doi: 10.3390/s21103461
17
Castaldo R Melillo P Bracale U Caserta M Triassi M Pecchia L . Acute mental stress assessment via short term HRV analysis in healthy adults: A systematic review with meta-analysis. BioMed Signal Process Control. (2015) 18:370–7. doi: 10.1016/j.bspc.2015.02.012
18
Kim HGG Cheon EJJ Bai DSS Lee YH Koo BHH . Stress and heart rate variability: A meta-analysis and review of the literature. Psychiatry Investig. (2018) 15:235–45. doi: 10.30773/pi.2017.08.17
19
Immanuel S Teferra MN Baumert M Bidargaddi N . Heart rate variability for evaluating psychological stress changes in healthy adults: A scoping review. Neuropsychobiology. (2023) 82:187–202. doi: 10.1159/000530376
20
Task Force of The European Society of Cardiology and The North American Society of Pacing and Electrophysiology Malik M Bigger T Camm AJ Kleiger RE Malliani A et al . Heart rate variability, Standards of measurement, physiological interpretation, and clinical use. Eur Heart J. (1996) 17:354–81. doi: 10.1093/oxfordjournals.eurheartj.a014868
21
Haque Y Zawad RS Rony CSA Al Banna H Ghosh T Kaiser MS et al . State-of-the-art of stress prediction from heart rate variability using artificial intelligence. Cognit Comput. (2024) 16:455–81. doi: 10.1007/s12559-023-10200-0
22
Gedam S Paul S . A review on mental stress detection using wearable sensors and machine learning techniques. IEEE Access. (2021) 9:84045–66. doi: 10.1109/ACCESS.2021.3085502
23
Lee S Bin HH Park S Kim S JH H Jang Y et al . Mental stress assessment using ultra short term HRV analysis based on non-linear method. Biosensors. (2022) 12:465. doi: 10.3390/bios12070465
24
Liu K Jiao Y Du C Zhang X Chen X Xu F et al . Driver stress detection using ultra-short-term HRV analysis under real world driving conditions. Entropy. (2023) 25:194. doi: 10.3390/e25020194
25
Gorman JM Sloan RP . Heart rate variability in depressive and anxiety disorders. Am Heart J. (2000) 140:77–83. doi: 10.1067/mhj.2000.109981
26
Zhang Y Zhou B Qiu J Zhang L Zou Z . Heart rate variability changes in patients with panic disorder. J Affect Disord. (2020) 267:297–306. doi: 10.1016/j.jad.2020.01.132
27
Wang Z Luo Y Zhang Y Chen L Zou Y Xiao J et al . Heart rate variability in generalized anxiety disorder, major depressive disorder and panic disorder: A network meta-analysis and systematic review. J Affect Disord. (2023) 330:259–66. doi: 10.1016/j.jad.2023.03.018
28
Schiweck C Piette D Berckmans D Claes S Vrieze E . Heart rate and high frequency heart rate variability during stress as biomarker for clinical depression. A systematic review. Psychol Med. (2019) 49:200–11. doi: 10.1017/S0033291718001988
29
Kotianova A Kotian M Slepecky M Chupacova M Prasko J Tonhajzerova I . The differences between patients with panic disorder and healthy controls in psychophysiological stress profile. Neuropsychiatr Dis Treat. (2018) 14:435–41. doi: 10.2147/NDT.S153005
30
Tolin DF Lee E Levy HC Das A Mammo L Katz BW et al . Psychophysiological assessment of stress reactivity and recovery in anxiety disorders. J Anxiety Disord. (2021) 82:102426. doi: 10.1016/j.janxdis.2021.102426
31
Byun S Kim AY Shin M Jeon HJ Cho CH . Automated classification of stress and relaxation responses in major depressive disorder, panic disorder, and healthy participants via heart rate variability. Front Psychiatry. (2025) 15:1–22. doi: 10.3389/fpsyt.2024.1500310
32
Bu N Fukami M Fukuda O . Pattern recognition of mental stress levels from differential RRI time series using LSTM networks. LifeTech. (2021), 408–11. 2021 IEEE 3rd Glob Conf Life Sci Technol. 2021;(LifeTech :Nara, Japan). doi: 10.1109/LifeTech52111.2021
33
Oskooei A Chau SM Weiss J Sridhar A Martínez MR Michel B . DeStress: deep learning for unsupervised identification of mental stress in firefighters from heart-rate variability (HRV) data. Stud Comput Intell. (2021) 914:93–105. doi: 10.48550/arXiv.1911.1321
34
Bernardes A Couceiro R Medeiros J Henriques J Teixeira C Simões M et al . How reliable are ultra-short-term HRV measurements during cognitively demanding tasks? Sensors. (2022) 22:6528. doi: 10.3390/s22176528
35
Park MJ Jang EH Kim AY Kim H Kim HS . Comparison of peripheral biomarkers and reduction of stress response in patients with major depressive disorders vs. Panic disorder. Frontiers in Psychiatry. (2022) 13:1–8. doi: 10.3389/fpsyt.2022.842963
36
Hamilton MAX . Development of a rating scale for primary depressive illness. Br J Clin Psychol. (1967) 6:278–96. doi: 10.1111/j.2044-8260.1967.tb00530.x
37
Hamilton M . The assessment of anxiety states by rating. Br J Med Psychol. (1959) 32:50–5. doi: 10.1111/j.2044-8341.1959.tb00467.x
38
Shear MK Brown TA Barlow DH Money R Sholomskas DE Woods SW et al . Multicenter collaborative panic disorder severity scale. Am J Psychiatry. (1997) 154:1571–5. doi: 10.1176/ajp.154.11.1571
39
Thayer JF Yamamoto SS Brosschot JF . The relationship of autonomic imbalance, heart rate variability and cardiovascular disease risk factors. Int J Cardiol. (2010) 141:122–31. doi: 10.1016/j.ijcard.2009.09.543
40
Mandrick K Peysakhovich V Rémy F Lepron E Causse M . Neural and psychophysiological correlates of human performance under stress and high mental workload. Biol Psychol. (2016) 121:62–73. doi: 10.1016/j.biopsycho.2016.10.002
41
Zarjam P Epps J Chen F Lovell NH . Estimating cognitive workload using wavelet entropy-based features during an arithmetic task. Comput Biol Med. (2013) 43:2186–95. doi: 10.1016/j.compbiomed.2013.08.021
42
Giles GE Mahoney CR Brunyé TT Taylor HA Kanarek RB . Stress effects on mood, HPA axis, and autonomic response: Comparison of three psychosocial stress paradigms. PloS One. (2014) 9:1–19. doi: 10.1371/journal.pone.0113618
43
Lipovac D Žitnik J Burnard MD . A pilot study examining the suitability of the mental arithmetic task and single-item measures of affective states to assess affective, physiological, and attention restoration at a wooden desk. J Wood Sci. (2022) 68:35. doi: 10.1186/s10086-022-02042-5
44
Byun S Kim AY Jang EH Kim S Choi KW Yu HY et al . Entropy analysis of heart rate variability and its application to recognize major depressive disorder: A pilot study. Technol Heal Care. (2019) 27:1–18. doi: 10.3233/THC-199037
45
Sollers JJ Sanford TA Nabors-Oberg R Anderson CA Thayer JF . Examining changes in HRV in response to varying ambient temperature. IEEE Eng Med Biol Mag. (2002) 21:30–4. doi: 10.1109/MEMB.2002.1032636
46
Yamamoto S Iwamoto M Inoue M Harada N . Evaluation of the effect of heat exposure on the autonomic nervous system by heart rate variability and urinary catecholamines. J Occup Health. (2007) 49:199–204. doi: 10.1539/joh.49.199
47
Barbosa E García-Manso JM Martín-González JM Sarmiento S Calderón FJ Da Silva-Grigoletto ME . Effect of hyperbaric pressure during scuba diving on autonomic modulation of the cardiac response: application of the continuous wavelet transform to the analysis of heart rate variability. Mil Med. (2013) 175:61–4. doi: 10.7205/MILMED-D-02-0808
48
Tarvainen MP Niskanen JP Lipponen JA Ranta-aho PO Karjalainen PA . Kubios HRV - Heart rate variability analysis software. Comput Methods Programs Biomed. (2014) 113:210–20. doi: 10.1016/j.cmpb.2013.07.024
49
Pan J Tompkins WJ . Real-time qrs detection algorithm. IEEE Trans BioMed Eng. (1985) 32:230–6. doi: 10.1109/TBME.1985.325532
50
Yang D Ma R Yang N Sun K Han J Duan Y et al . Repeated long sessions of transcranial direct current stimulation reduces seizure frequency in patients with refractory focal epilepsy: An open-label extension study. Epilepsy Behav. (2022) 135:108876. doi: 10.1016/j.yebeh.2022.108876
51
Edmonds M Peynenburg V Kaldo V Jernelöv S Titov N Dear BF et al . Treating comorbid insomnia in patients enrolled in therapist-assisted transdiagnostic internet-delivered cognitive behaviour therapy for anxiety and depression: A randomized controlled trial. Internet Interv. (2024) 35:100729. doi: 10.1016/j.invent.2024.100729
52
He K Zhang X Ren S Sun J . Deep residual learning for image recognition. Proc IEEE Comput Soc Conf Comput Vis Pattern Recognit. (2016), 770–8. doi: 10.1109/CVPR.2016.90
53
Lee KH Byun S . Age prediction in healthy subjects using RR intervals and heart rate variability: A pilot study based on deep learning. Appl Sci. (2023) 13:2932. doi: 10.3390/app13052932
54
Ismail Fawaz H Forestier G Weber J Idoumghar L Muller PA . Deep learning for time series classification: a review. Data Min Knowl Discov. (2019) 33:917–63. doi: 10.1007/s10618-019-00619-1
55
Faust O Acharya UR . Automated classification of five arrhythmias and normal sinus rhythm based on RR interval signals. Expert Syst Appl. (2021) 181:115031. doi: 10.1016/j.eswa.2021.115031
56
Petrowski K Wichmann S Siepmann T Wintermann GB Bornstein SR Siepmann M . Effects of mental stress induction on heart rate variability in patients with panic disorder. Appl Psychophysiol Biofeedback. (2017) 42:85–94. doi: 10.1007/s10484-016-9346-9
57
Chen YS Lu WA Pagaduan JC Kuo CD . A novel smartphone app for the measurement of ultra-short-term and short-term heart rate variability: Validity and reliability study. JMIR mHealth uHealth. (2020) 8:1–16. doi: 10.2196/18761
58
Kemp AH Quintana DS Gray MA Felmingham KL Brown K Gatt JM . Impact of depression and antidepressant treatment on heart rate variability: A review and meta-analysis. Biol Psychiatry. (2010) 67:1067–74. doi: 10.1016/j.biopsych.2009.12.012
59
Licht CMM De Geus EJC Van Dyck R Penninx BWJH . Longitudinal evidence for unfavorable effects of antidepressants on heart rate variability. Biol Psychiatry. (2010) 68:861–8. doi: 10.1016/j.biopsych.2010.06.032
60
Greco A Valenza G Lazaro J Garzon-Rey JM Aguilo J de la Camara C et al . Acute stress state classification based on electrodermal activity modeling. IEEE Trans Affect Comput. (2023) 14:788–99. doi: 10.1109/TAFFC.2021.3055294
61
Tomitani N Kanegae H Suzuki Y Kuwabara M Kario K . Stress-induced blood pressure elevation self-measured by a wearable watch-type device. Am J Hypertens. (2021) 34:377–82. doi: 10.1093/ajh/hpaa139
62
Arpaia P Moccaldi N Prevete R Sannino I Tedesco A . A wearable EEG instrument for real-time frontal asymmetry monitoring in worker stress analysis. IEEE Trans Instrum Meas. (2020) 69:8335–43. doi: 10.1109/TIM.19
Summary
Keywords
RR intervals, major depressive disorder, panic disorder, stress detection, deep learning, machine learning, autonomic nervous system, physiological signals
Citation
Lee KH, Cho C-H, Kim AY, Jeon HJ and Byun S (2025) Deep learning-based stress detection from RR intervals in major depressive disorder, panic disorder, and healthy individuals. Front. Psychiatry 16:1672260. doi: 10.3389/fpsyt.2025.1672260
Received
24 July 2025
Accepted
10 September 2025
Published
25 September 2025
Volume
16 - 2025
Edited by
Francesco Monaco, Azienda Sanitaria Locale Salerno, Italy
Reviewed by
Luca Steardo Jr, University Magna Graecia of Catanzaro, Italy
Christina Hu, City University of Macau, China
Updates
Copyright
© 2025 Lee, Cho, Kim, Jeon and Byun.
This is an open-access article distributed under the terms of the Creative Commons Attribution License (CC BY). The use, distribution or reproduction in other forums is permitted, provided the original author(s) and the copyright owner(s) are credited and that the original publication in this journal is cited, in accordance with accepted academic practice. No use, distribution or reproduction is permitted which does not comply with these terms.
*Correspondence: Hong Jin Jeon, jeonhj@skku.edu; Sangwon Byun, swbyun@inu.ac.kr
†These authors have contributed equally to this work and share first authorship
Disclaimer
All claims expressed in this article are solely those of the authors and do not necessarily represent those of their affiliated organizations, or those of the publisher, the editors and the reviewers. Any product that may be evaluated in this article or claim that may be made by its manufacturer is not guaranteed or endorsed by the publisher.