 Xue Mo1†
 Xuemei Li2†
 Mengqi Liu1†
 Linlin Hu1Qian Li1Jie Wang1Haiqing Deng1
 Fajin Lv1
 Xinyu Zhou2Yun Mao1*
 Yang Huang1*
- 1Department of Radiology, The First Affiliated Hospital of Chongqing Medical University, Chongqing, China
- 2Department of Psychiatry, The First Affiliated Hospital of Chongqing Medical University, Chongqing, China
Background: Substantial interindividual variability exists in the response of adolescents with major depressive disorder (MDD) to selective serotonin reuptake inhibitors (SSRIs), and reliable early predictors of treatment response are lacking.
Methods: Resting-state functional magnetic resonance imaging (fMRI) data and clinical scale scores were collected from 69 adolescents with first-episode, drug-naïve MDD. Based on treatment response assessed after 8 weeks of SSRIs therapy, participants were categorized into a responder group (n=37) and a non-responder group (n=32). Graph-theoretical analysis was then performed on the pre-treatment resting-state functional networks of both groups.
Results: Significant group differences emerged in several global attribute metrics and multiple brain region node attribute metrics (including the left middle frontal gyrus, hippocampus, parahippocampal gyrus, amygdala, pallidum, as well as the right anterior cingulate cortex and inferior parietal lobule). Partial correlation analyses revealed negative correlations between nodal efficiency in the left middle frontal gyrus, hippocampus, and parahippocampal gyrus, as well as degree centrality in the right anterior cingulate gyrus, and the reduction rate in Hamilton Depression Rating Scale-17 score. Furthermore, logistic regression analysis identified lower nodal efficiency in the right inferior parietal lobule and higher clustering coefficient in the left pallidum as significant predictors of SSRIs treatment response.
Conclusions: Pre-treatment functional network topological metrics differentiating responders and non-responders demonstrate potential as predictors for SSRIs treatment response in adolescents with MDD.
1 Introduction
Major depressive disorder (MDD) is a common psychiatric disorder that severely impairs psychosocial functioning and reduces quality of life in affected individuals (1). Typically emerging during adolescence, MDD is characterized by core symptoms including persistent depressed mood, loss of interest or pleasure (anhedonia), and recurrent suicidal ideation (2). Epidemiologic studies indicate that approximately 20% of children and adolescents globally experience depressive symptoms or meet diagnostic criteria for depression, with prevalence rates exhibiting a concerning upward trend (3). Selective serotonin reuptake inhibitors (SSRIs) are currently recommended as the first-line pharmacological intervention for adolescents with MDD (4, 5). However, SSRIs exhibit a delayed therapeutic onset, typically requiring 2 to 6 weeks to become clinically apparent (6). Moreover, findings from multiple clinical studies demonstrate that the overall treatment response rate to SSRIs in adolescent MDD patients ranges only from 55% to 60% (7–9). Critically, reliable predictive biomarkers for early treatment response remain elusive.
Current longitudinal neuroimaging studies have not only confirmed that SSRIs induce structural and functional alterations in specific brain regions of MDD patients but also revealed differential changes between treatment responders and non-responders associated with symptomatic improvement (9, 10). These studies further suggest that baseline brain structure and function may serve as potential predictors of treatment outcome. Previous research utilizing multimodal MRI and clinical data with machine learning algorithms achieved a prediction accuracy of 63% for sertraline treatment response in adults with MDD (11). Similarly, another study successfully predicted the efficacy of SSRIs at 2 weeks post-treatment in adolescent MDD patients using baseline radiomic features extracted from structural MRI within a machine learning framework, yielding an AUC of 0.954 for treatment response prediction (12). However, significant limitations persist in studies predicting SSRIs response specifically in drug-naïve, first-episode adolescent MDD patients. For instance, some investigations focus solely on short-term efficacy assessment at 2 weeks (12), a time point when treatment outcomes remain unstable. Additionally, most studies concentrate on imaging analyses of single brain regions rather than whole-brain networks.
Mounting evidence highlights the role of whole-brain networks in the pathophysiology of MDD with antidepressant treatment effects distributed across multiple functional brain networks (13–15). Graph theory provides a robust framework for quantifying complex topological properties within structural and functional brain networks (16). Cross-sectional studies consistently reveal significant topological abnormalities in brain networks of adolescents with MDD (17–19), while longitudinal research further demonstrates that these networks undergo topological changes following 8 weeks of SSRIs treatment (20). Critically, graph-theoretical analyses in adult MDD populations indicate that reduced degree centrality in the dorsomedial prefrontal cortex (dmPFC) post-SSRIs treatment significantly correlates with clinical improvement (21). This evidence suggests that graph theory can identify therapy-relevant topological features with potential predictive utility for treatment response. Nevertheless, research specifically characterizing brain network topology underlying differential SSRIs responses in drug-naïve, first-episode adolescent MDD patients remains scarce.
Therefore, this study aims to employ whole-brain resting-state functional magnetic resonance imaging (fMRI) data from drug-naïve, first-episode adolescent MDD patients and apply graph-theoretic analysis to identify brain network topological features predictive of SSRIs treatment response. These findings may inform personalized treatment strategies to enhance clinical symptom management in this population. We hypothesize that: (1) Pre-treatment brain network topology significantly differs between treatment responders and non-responders following 8 weeks of SSRIs therapy; (2) Specific topological metrics correlate with clinical symptom improvement and demonstrate predictive potential for SSRIs response.
2 Materials and methods
2.1 Participants
Sixty-nine adolescent MDD were recruited through the Department of Psychiatry at The First Affiliated Hospital of Chongqing Medical University. The conduct of this study was approved by the Ethics Committee of the First Affiliated Hospital of Chongqing Medical University (Ethical approval No. 2020–864). All participants received a diagnosis of MDD based on the Diagnostic and Statistical Manual of Mental Disorders, Fifth Edition (DSM-5), confirmed through Structured Clinical Interviews (SCID) conducted by two board-certified psychiatrists. Demographic and clinical information was systematically collected for all included patients. Participants met the following criteria: (1) aged 13–18 years; (2) The 17-item Hamilton Depression Rating Scale (HAMD-17) score >7; (3) first depressive episode and psychotropic medication-naïve; (4) right-handed; (5) absence of severe medical/neurological conditions, psychiatric disorders other than MDD, substance abuse/dependence, or head trauma with loss of consciousness; and (6) no comorbid psychotic disorders—with the exception that anxiety comorbidity was permitted if MDD was the principal diagnosis and primary reason for clinical presentation; (7) Individuals with MRI contraindications were excluded. Written informed consent was obtained from all adolescent participants and their legal guardians.
2.2 Symptom assessment and grouping
HAMD-17 and Hamilton Anxiety Scale (HAMA) were administered to evaluate Severity of the patient’s depressive and anxiety symptoms. All patients underwent 8 weeks of SSRIs treatment and were subsequently stratified into responder (n=37) and non-responder (n=32) groups based on HAMD-17 score reduction rates (≥50% for responders; <50% for non-responders). The HAMA score is primarily used to describe pre-treatment clinical characteristics of the sample and to assess comparability between responder and non-responder groups regarding baseline anxiety levels in subsequent analyses.
2.3 MRI data acquisition
All participants underwent scanning using a 3.0-T MRI system (Skyra, Siemens Healthcare, Erlangen, Germany) with a 32-channel head coil, where foam pads and earplugs were utilized to minimize head motion and attenuate scanner noise. Participants were instructed to remain relaxed with closed eyes while maintaining wakefulness; no subjects reported discomfort or sleep onset during scanning. Conventional axial T2-weighted and fluid-attenuated inversion recovery (FLAIR) images (5-mm slice thickness) were acquired for lesion screening, followed by whole-brain resting-state fMRI data acquisition via gradient-echo echo-planar imaging (GRE-EPI) sequence with these parameters: 36 axial slices; 3-mm slice thickness (no gap); repetition time (TR)=2,000 ms; echo time (TE)=30 ms; flip angle=90°; matrix=64 × 64; voxel size=3.4 × 3.4 × 3 mm³; field of view (FOV)=220 × 220 mm². This 8-minute fMRI scan yielded 240 volumes per participant. High-resolution structural images were then obtained using a magnetization-prepared rapid gradient-echo (MPRAGE) T1-weighted sequence with parameters: 192 sagittal slices; 1-mm slice thickness (no gap); TR=2,000 ms; TE=2.56 ms; flip angle=9°; matrix=256 × 256; isotropic voxel size=1 × 1 × 1 mm³; FOV=256 × 256 mm². Finally, two radiologists performed visual quality control on all images to exclude lesions and artifacts.
2.4 Data processing
DICOM raw images were converted to NIFTI format using dcm2nii software. Resting-state fMRI data preprocessing was performed in MATLAB 2023a (MathWorks, Natick, MA, USA) via DPABI V9.0 (http://rfmri.org/DPABI) (22), which operates on the SPM12 platform. The preprocessing pipeline comprised: (1) removal of the first 10 time points, (2) slice timing correction, (3) three-dimensional rigid-body motion correction, and (4) spatial normalization to echo-planar imaging (EPI) template space with 3 × 3 × 3 mm³ resampling. Normalized images were smoothed with a 6-mm full-width-at-half-maximum (FWHM) Gaussian kernel followed by linear detrending. Nuisance covariates—including Friston-24 head motion parameters and white matter signals—were regressed from the fMRI time series. Temporal bandpass filtering (0.01–0.08 Hz) was subsequently applied. Volumetric outliers were scrubbed using framewise displacement (FD) thresholding (FD > 0.5 mm). Participants exhibiting excessive motion (>2.5 mm translation, >2.5° rotation, or >50% scrubbed volumes) were excluded from subsequent analyses. Functional networks were then constructed in DPABI using preprocessed fMRI data. The automated anatomical labeling (AAL) atlas parcellated the brain into 90 regions of interest (ROIs), serving as network nodes. For each subject, a 90 × 90 functional connectivity matrix was generated by computing Pearson correlation coefficients between regional time series.
Graph theoretical analysis was conducted using DPABINet 1.3 (http://rfmri.org/DPABI) to quantify topological properties of functional brain networks. Global topological metrics included: global efficiency (Eglob), local efficiency (Eloc), clustering coefficient (Cp), characteristic path length (Lp), normalized clustering coefficient (γ), normalized characteristic path length (λ), small-worldness scalar (σ), assortativity and modularity. Nodal topological properties (degree centrality, nodal efficiency, betweenness, and clustering coefficient) were additionally analyzed across all parcellated regions. We also computed the degree and link weight distribution for each patient group. The degree of a node was defined as the number of connections it possessed within the binary network. The degree distribution was extracted for each subject, and scatter plots were generated to compare the distributions between the two groups. The link weight distribution was defined as the probability distribution composed of the strength values of all existing functional connections. For each subject, all functional connectivity strength values were extracted from the functional connectivity matrix. Scatter plots were subsequently created to visualize and compare the link weight distributions of the two groups. Following established methodology (23), topological metrics were computed across a sparsity threshold range of 0.10–0.34 (incremental step=0.01) to ensure measurement robustness. For each topological metric, the area under the curve (AUC) was calculated over this sparsity range to generate threshold-insensitive integrated indices for network normalization.
2.5 Statistical analysis
Demographic and clinical characteristics between responders and non-responders were compared employing: Mann-Whitney U tests for non-normal continuous variables (age), chi-square tests for categorical variables (gender), and independent t-tests for normally distributed clinical scores (HAMD-17, HAMA). Group differences in network properties were assessed using nonparametric permutation tests on the AUC of each topological metric based on MATLAB. For each metric, all values were randomly assigned to two groups, and the inter-group mean difference was calculated. This randomization procedure was iterated 10,000 times, and the 95th percentile of each distribution was used as the critical value for a two-tailed test of the null hypothesis with a type I error of 0.05. Statistical significance for nodal measures was then corrected using false discovery rate (FDR) method (α=5%). We performed Kolmogorov-Smirnov (K-S) tests and Mann-Whitney U tests to statistically compare the degree and link weight distributions between the two groups. Partial correlation analyses-controlling for age and gender-examined relationships between network topology indices and symptom measures (Pre-treatment HAMD-17, ΔHAMD-17), with statistical significance defined as P<0.05. Significant global and nodal attributes identified through univariate regression subsequently underwent forward likelihood ratio (LR) binary logistic regression to identify SSRIs treatment response predictors.
3 Results
3.1 Demographic characteristics
Pre-treatment MRI and clinical data were collected from 69 adolescent MDD patients. Following 8 weeks of SSRIs treatment, 37 patients were classified as responders and 32 as non-responders. As presented in Table 1, the groups showed no statistically significant differences (P > 0.05) in age, sex distribution, Body Mass Index (BMI) or Pre-treatment scores on the HAMD-17 and HAMA scores.
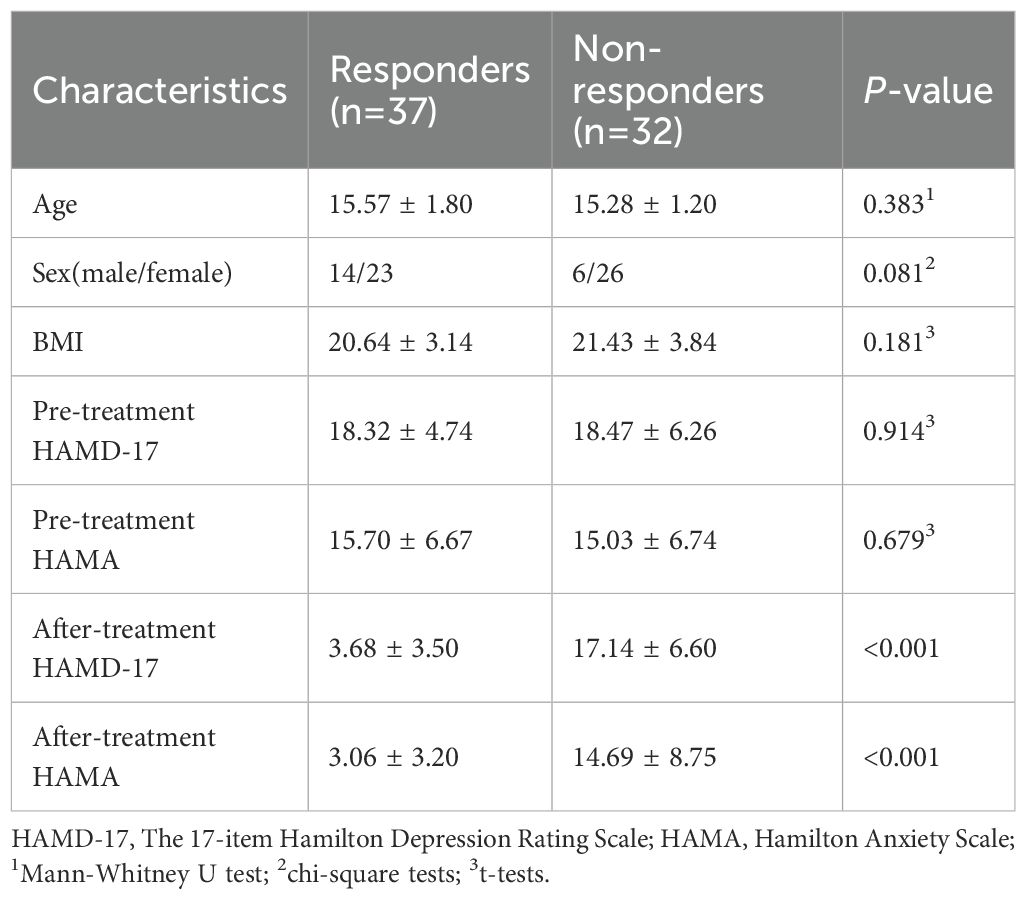
Table 1. Demographic and clinical characteristics.
3.2 Comparison of graph theory indicators
Compared to responders, non-responders exhibited significantly increased values in global network metrics including normalized Cp, Eloc, modularity, and σ (Figure 1, Table 2). At the nodal level: Higher nodal efficiency was observed in non-responders within the left middle frontal gyrus (MFG), left hippocampus, left parahippocampal gyrus, right inferior parietal lobule (IPL), and right angular gyrus. Elevated betweenness centrality occurred in the left pallidum, left postcentral gyrus, left cuneus, and right parahippocampal gyrus. Increased clustering coefficients were found in the left hippocampus, left parahippocampal gyrus, right IPL, and left amygdala but decreased in the bilateral putamen and left pallidum. Higher degree centrality was identified in the right anterior cingulate cortex (ACC), whereas reduced degree centrality was observed in both the right fusiform gyrus and the left supramarginal gyrus (P <0.05) (Figure 2, Table 3). For degree and link weight distribution, there was no statistically significant difference in degree distribution between the two patient groups, while the response group exhibited a higher link weight distribution. (see Supplementary Figures 1, 2).
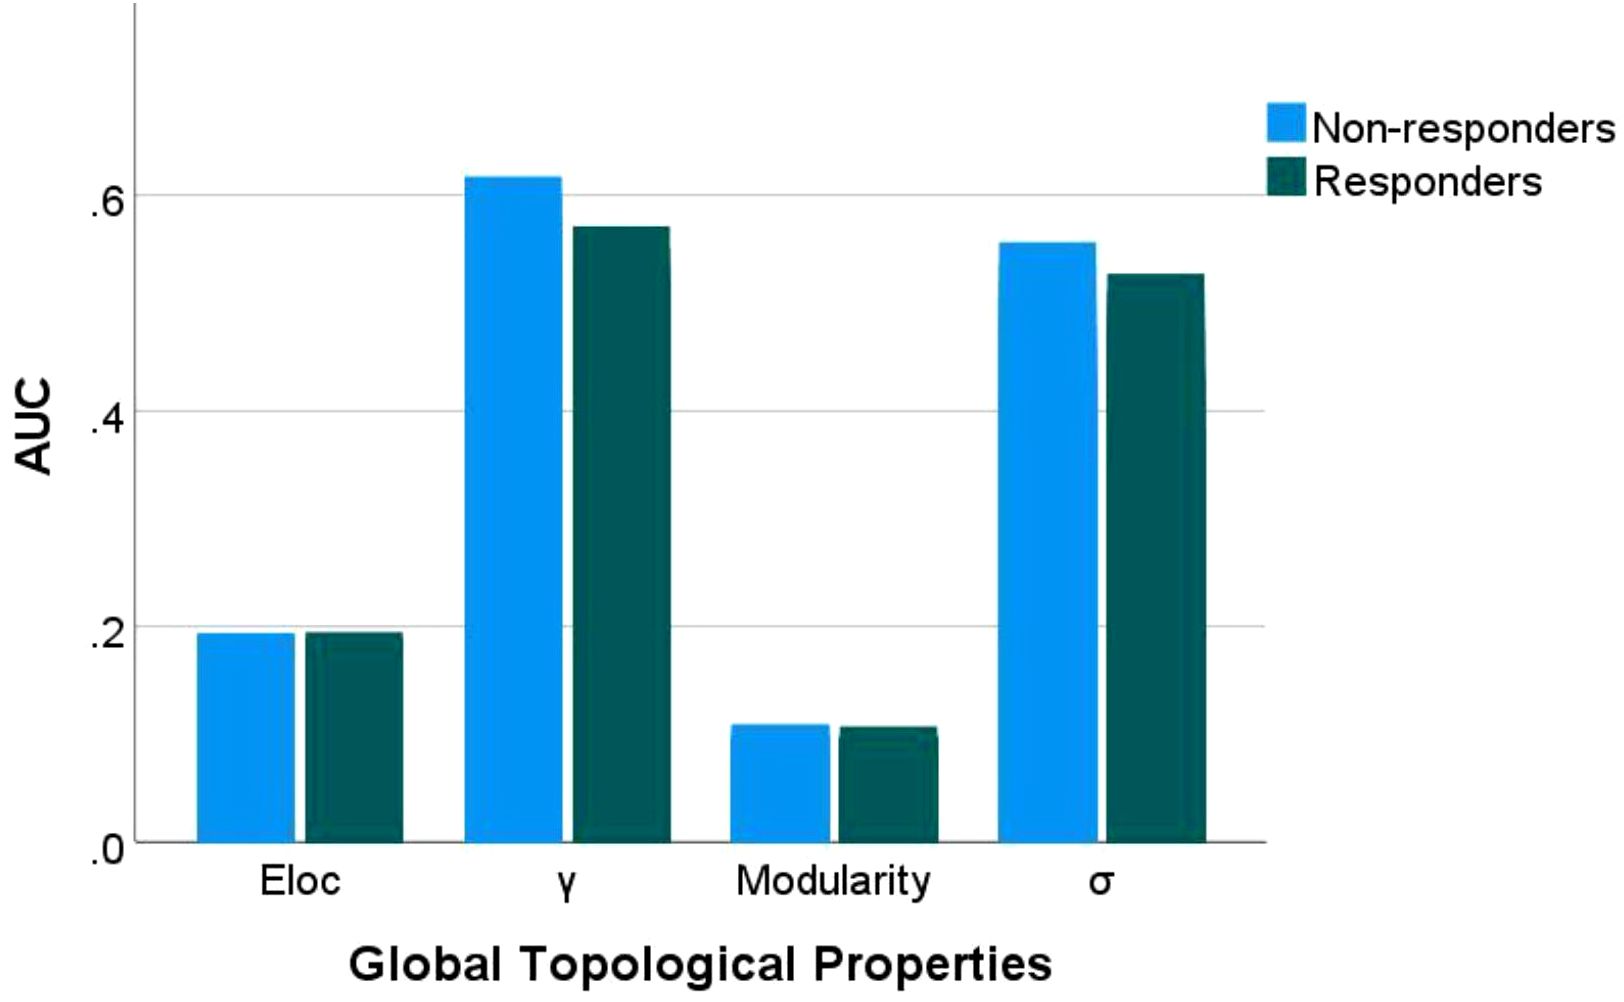
Figure 1. Group differences in global topological properties. Eloc: local efficiency; γ: normalized clustering coefficient; σ: small-worldness scalar. AUC, area under the receiver operating characteristic curve.
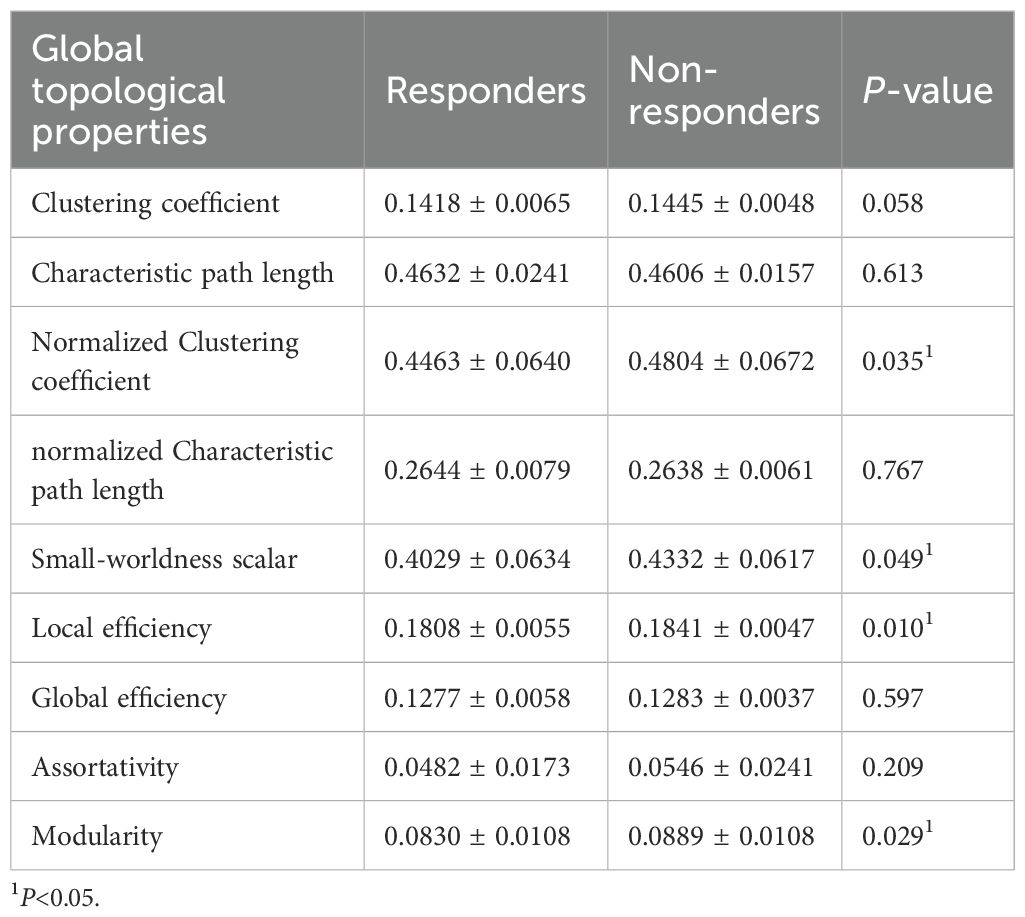
Table 2. Group differences in global topological properties.
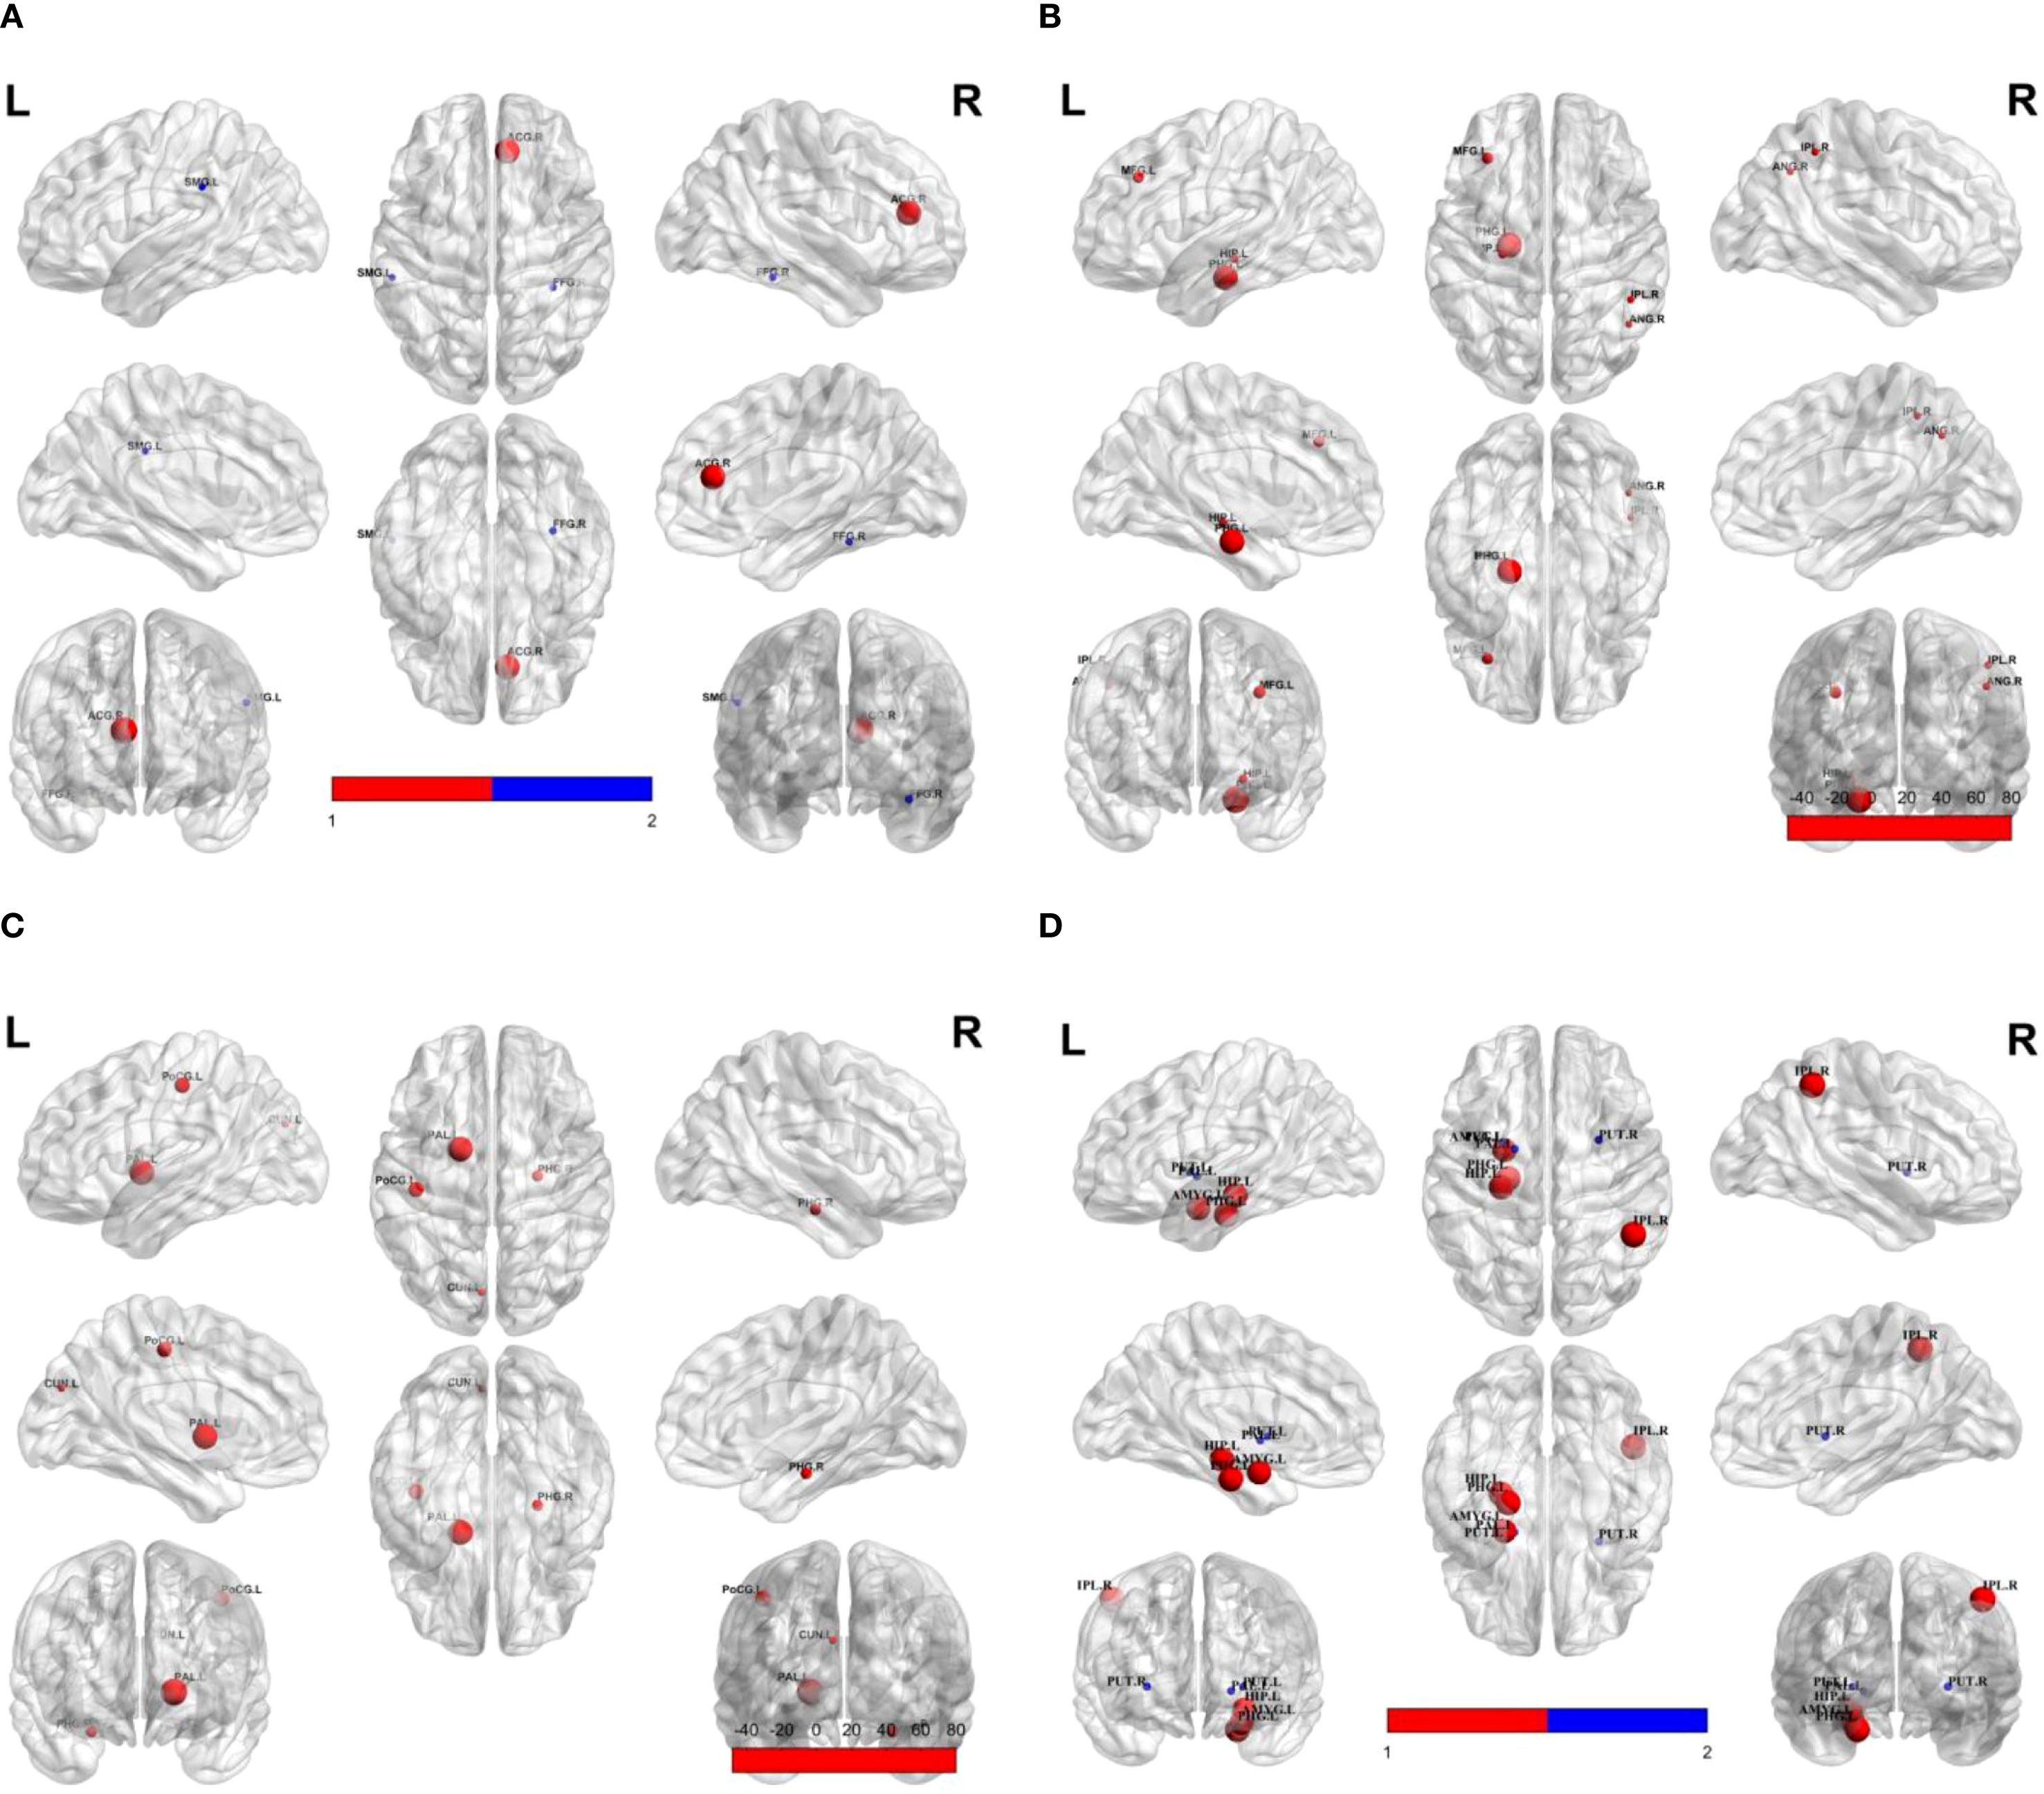
Figure 2. Group differences in nodal property metrics. Spheres represent brain regions showing significant differences between non-responders and responders. Red indicates higher values in non-responders; blue indicates lower values in non-responders relative to responders. (A) Degree centrality; (B) Nodal efficiency; (C) Betweenness; (D) Clustering coefficient. SMG.L, Left supramarginal gyrus; ACG.R, Right anterior cingulate gyrus; FFG.R, Right fusiform gyrus; MFG.L, Left middle frontal gyrus; HIP.L, Left hippocampus; PHG.L, Left parahippocampal gyrus; IPL.R, Right inferior parietal lobule; PoCG.L, Left postcentral gyrus; PAL.L, Left pallidum; CUN.L, Left cuneus; PHG.R, Right parahippocampal gyrus; PUT.L, Left putamen; AMYG.L, Left amygdala; PUT.R, Right putamen.
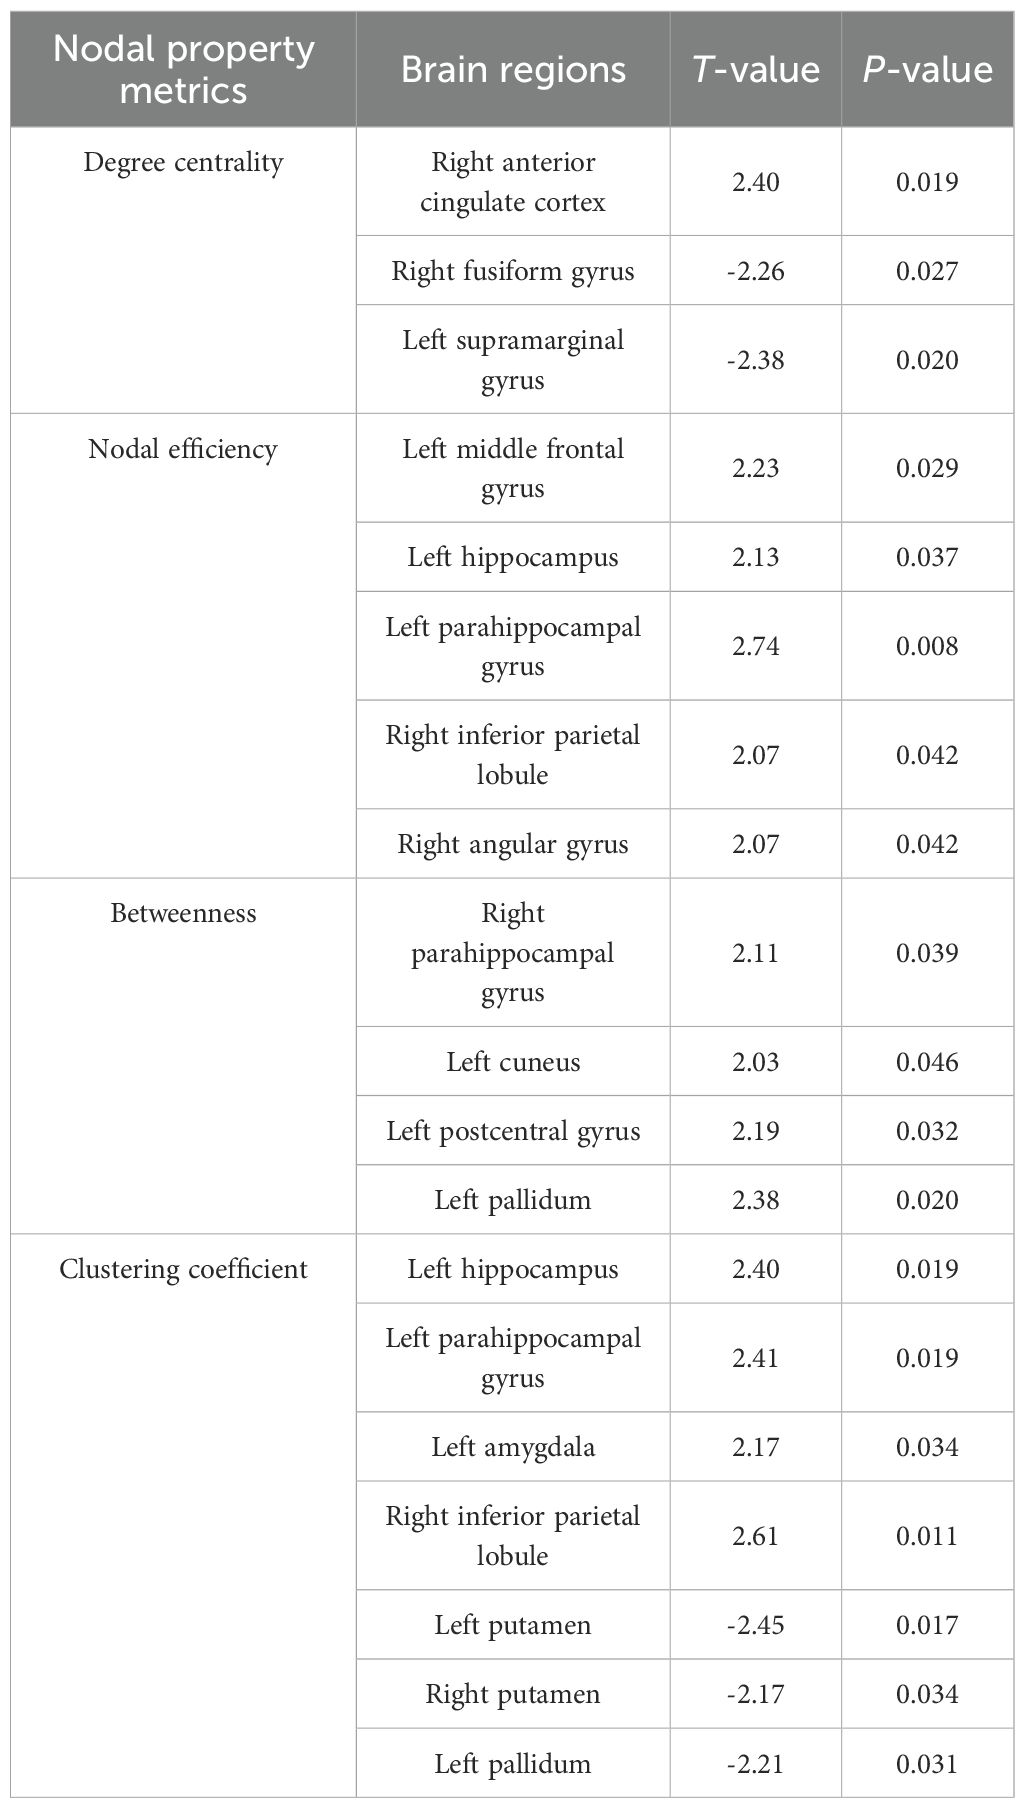
Table 3. Group differences in nodal property metrics.
3.3 Correlation with clinical symptoms
Partial correlation analyses controlling for age and sex revealed no significant associations between global network metrics and ΔHAMD-17 scores (P > 0.05). However, nodal metrics demonstrated significant correlations: betweenness centrality in the left cuneus, left postcentral gyrus and left pallidum; nodal efficiency in the left MFG, left hippocampus, left parahippocampal gyrus and right angular gyrus; and degree centrality in the right ACC showed negative correlations with ΔHAMD-17 (all P<0.05). Conversely, positive correlations were observed for the clustering coefficient in the left putamen and degree centrality in the right fusiform gyrus and left supramarginal gyrus (all P<0.05). Critically, nodal efficiency in the left MFG and degree centrality in the right ACC were negatively correlated with absolute HAMD-17 scores (P<0.05)(Figure 3). Subsequent binary logistic regression identified lower nodal efficiency in the right IPL (sensitivity=0.459, specificity=0.906, AUC=0.692) and higher clustering coefficient in the left pallidum (sensitivity=0.703, specificity=0.594, AUC=0.655) as significant predictors of 8-week SSRIs treatment response (Figure 4, Table 4).
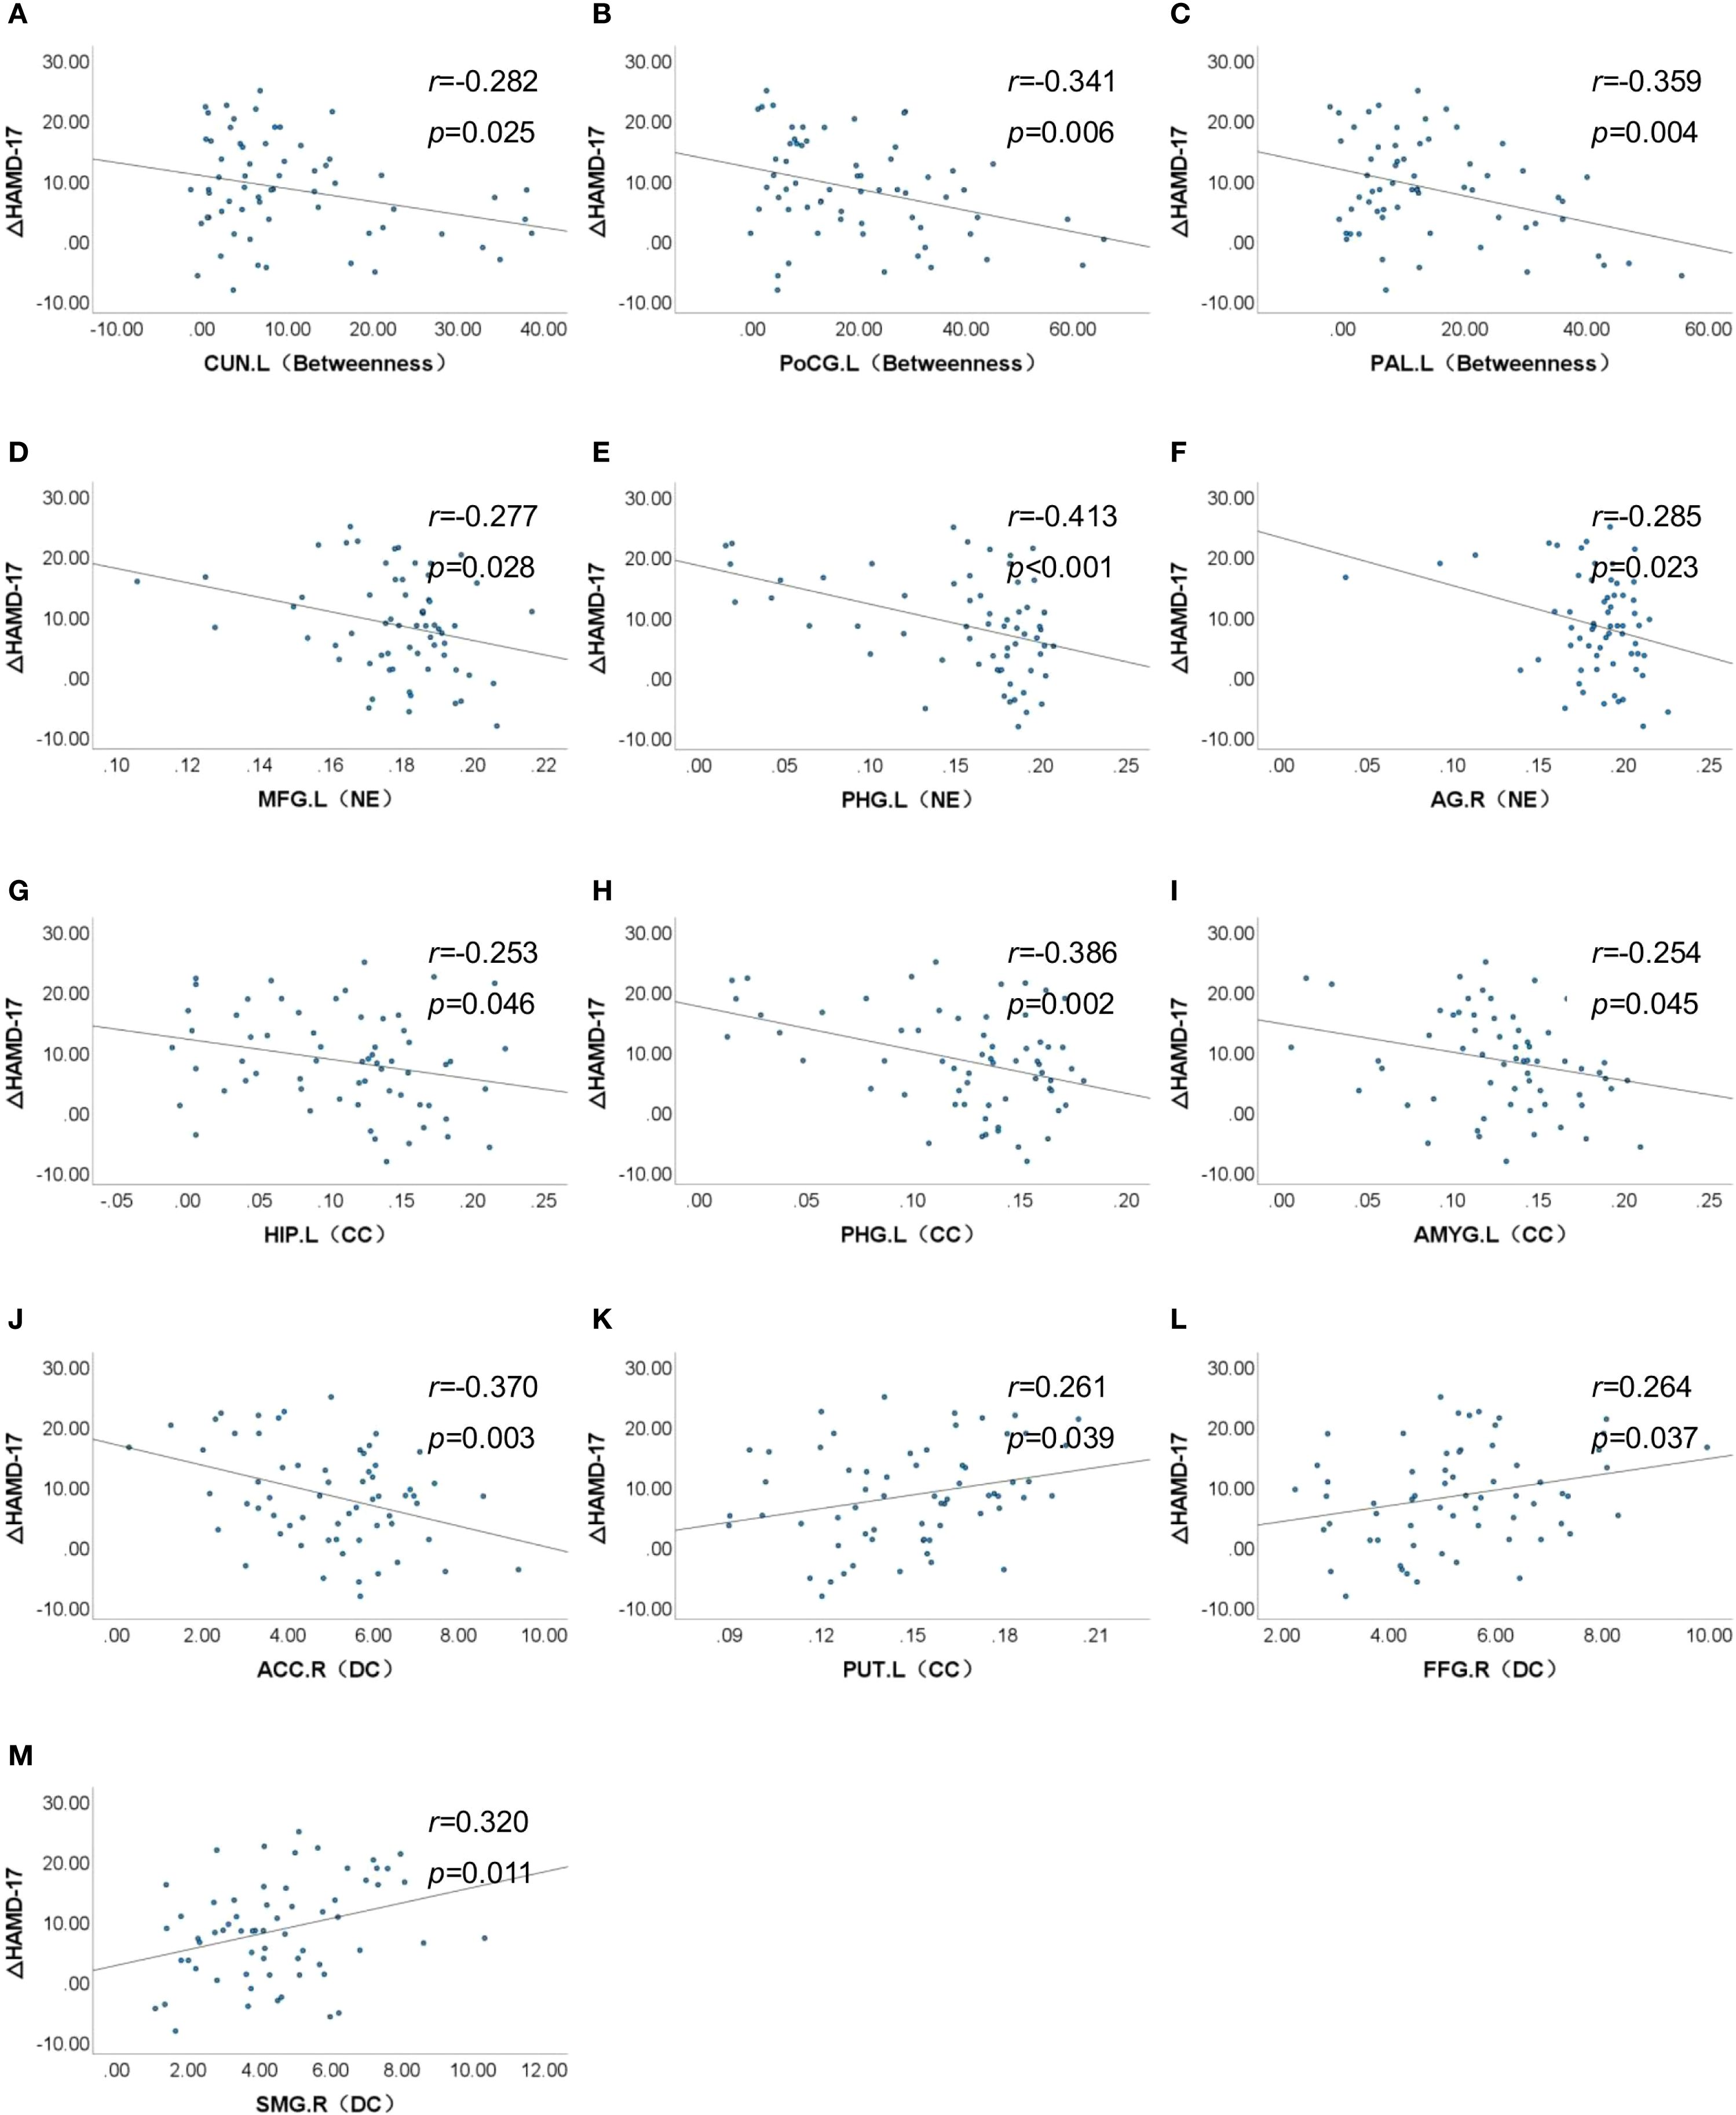
Figure 3. Association between nodal properties and ΔHAMD-17 scores. ΔHAMD-17: Pre-treatment HAMD-17 score minus Post-treatment HAMD-17 score; (A) CUN.L (Betweeness), Betweeness in the left cuneus; (B) PoCG.L (Betweeness), Betweeness in the left postcentral gyrus; (C) PAL.L (Betweeness), Betweeness in the left postcentral gyrus; (D) MFG.L (NE), Nodal efficiency in the left middle frontal gyrus; (E) PHG.L (NE), Nodal efficiency in the left parahippocampal gyrus; (F) AG.R (NE), Nodal efficiency in the right angular gyrus; (G) HIP.L (CC), Clustering coefficient in the left hippocampus; (H) PHG.L (CC), Clustering coefficient in the left parahippocampal gyrus; (I) AMYG.L (CC), Clustering coefficient in the left amygdala; (J) ACC.R (DC), Degree centrality in the right anterior cingulate cortex; (K) PUT.L (CC), Clustering coefficient in the left putamen; (L) FFG.R (DC), Degree centrality in the right fusiform gyrus; (M) SMG.R (DC), Degree centrality in the left supramarginal gyrus.
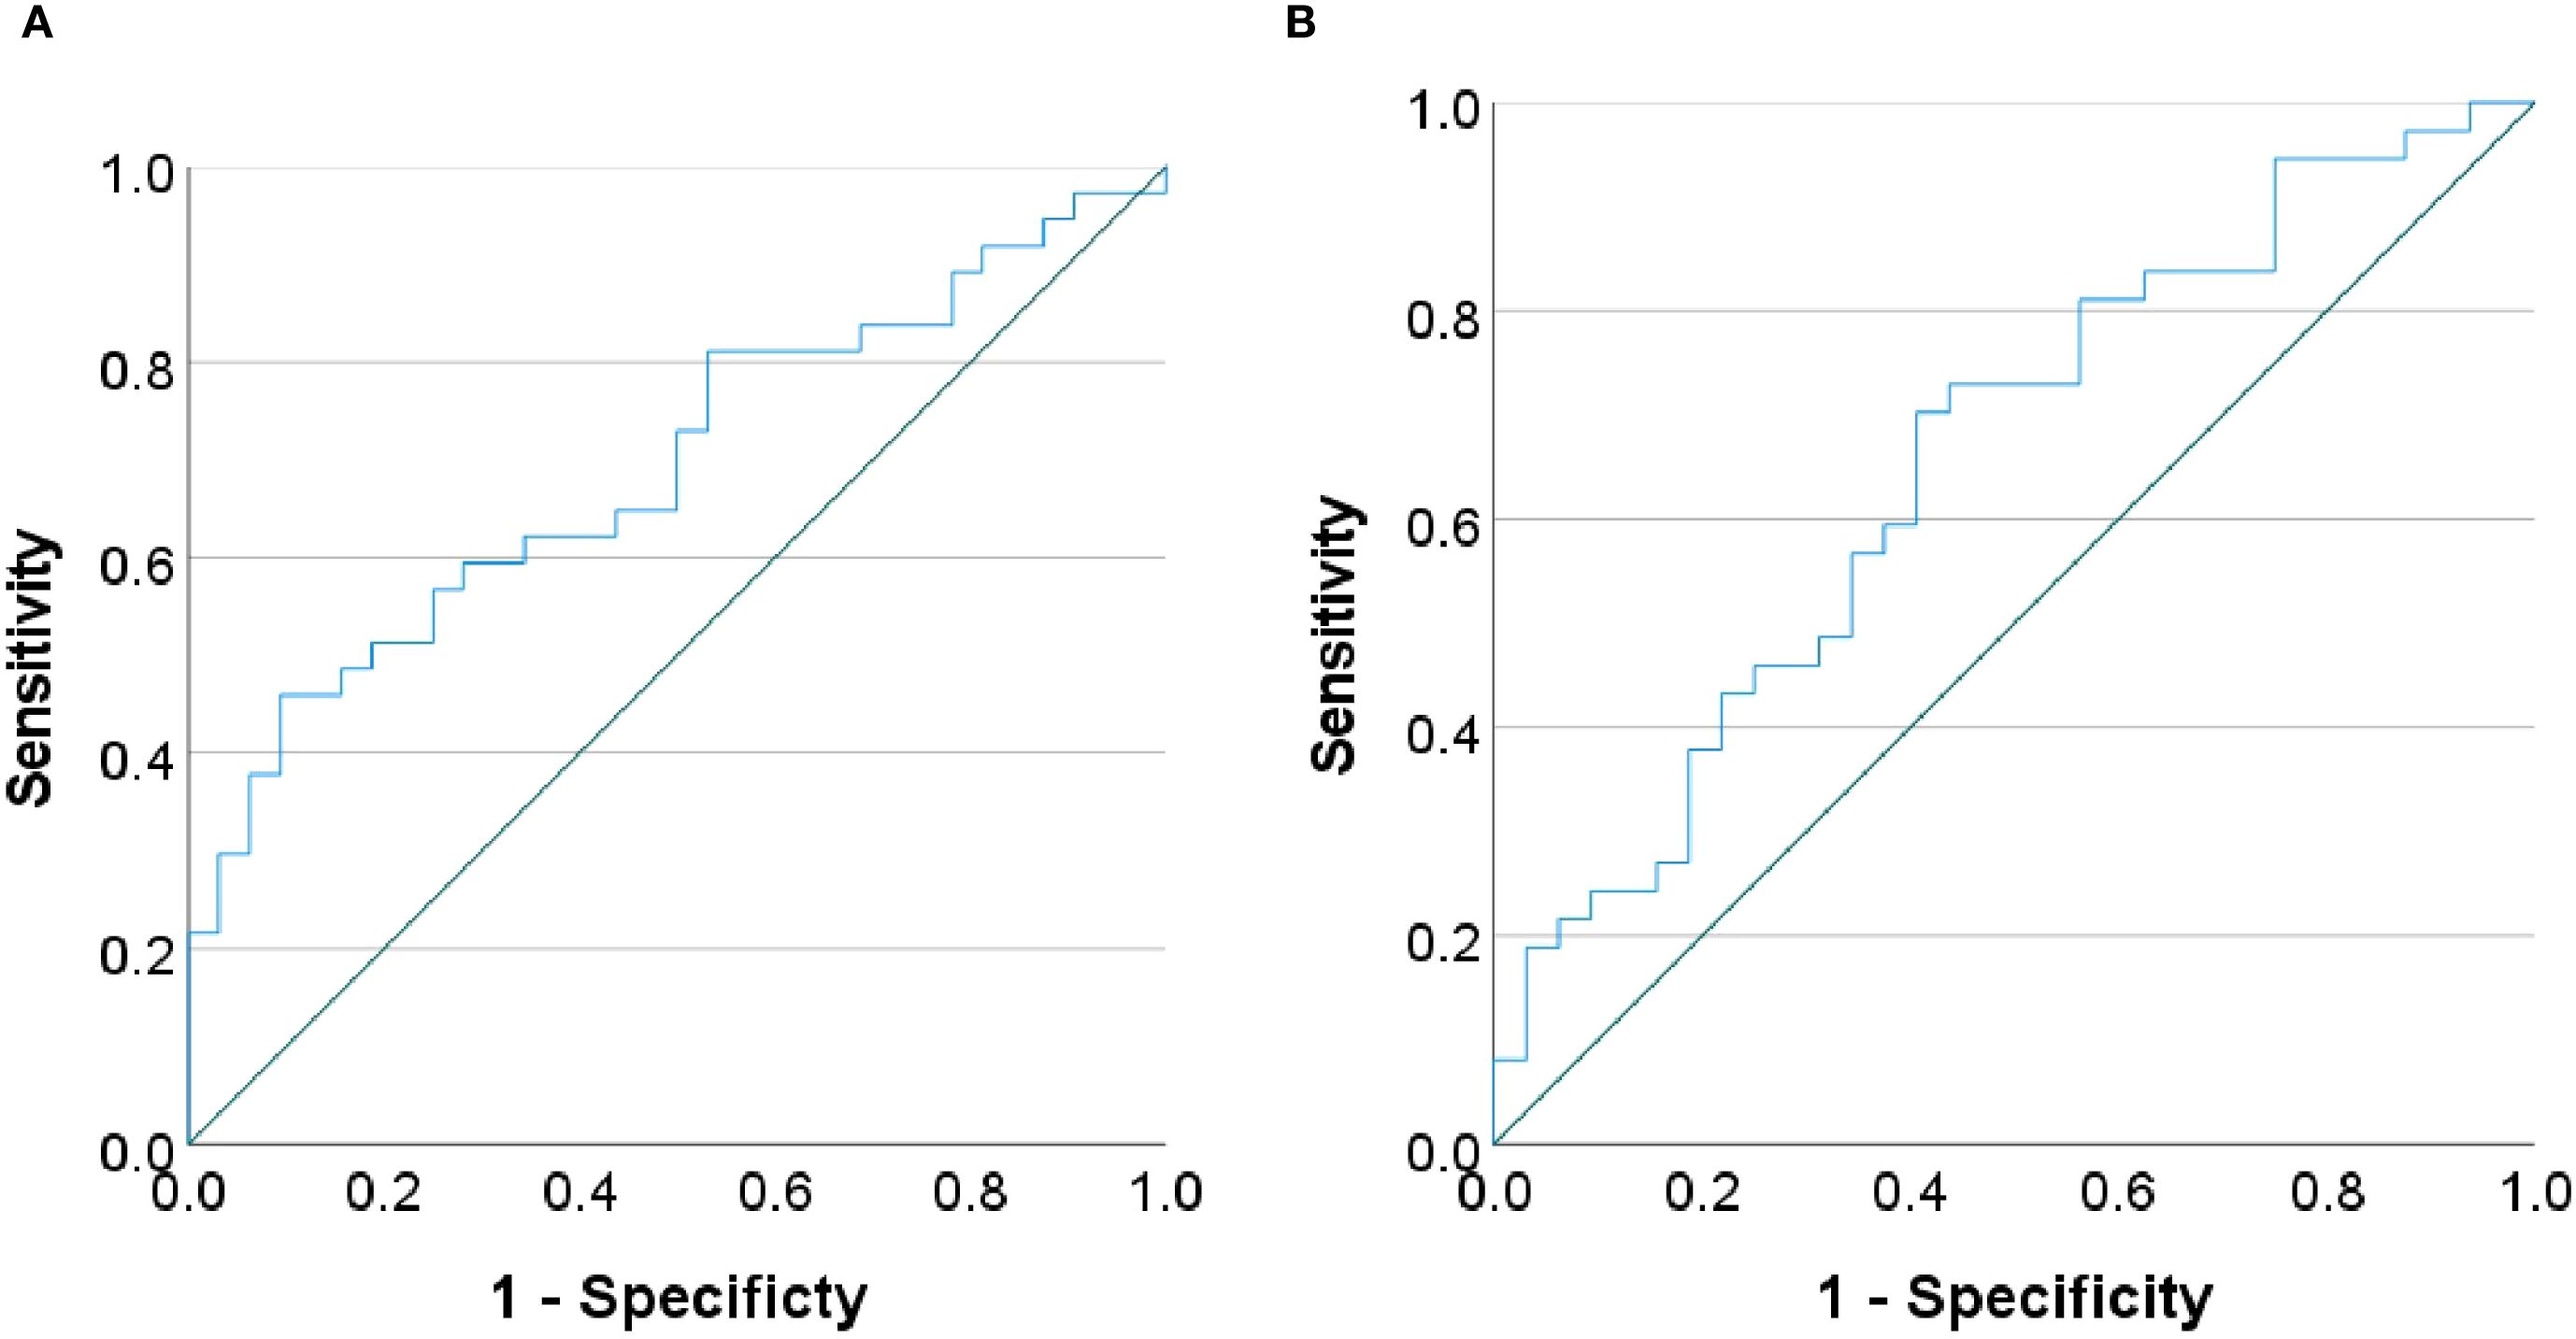
Figure 4. Receiver operating characteristic (ROC) curves. The curves demonstrating the performance of (A) nodal efficiency in the right inferior parietal lobule and (B) clustering coefficient in the left pallidum in predicting treatment response.
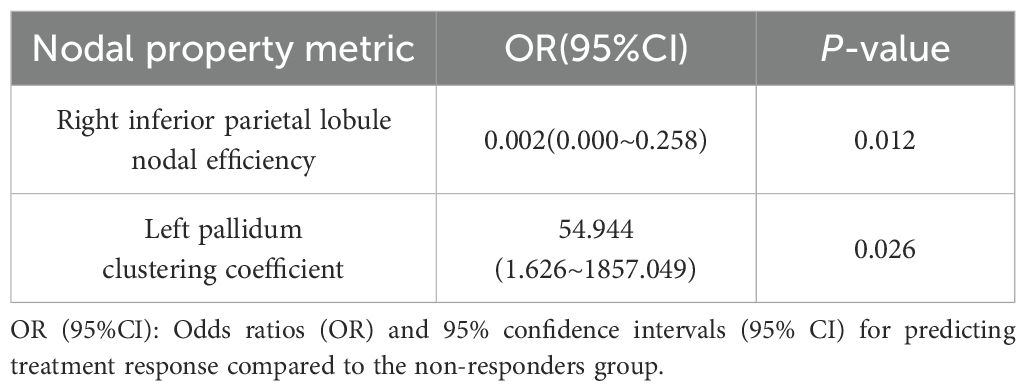
Table 4. Binary logistic regression analysis of nodal property metrics.
4 Discussion
This resting-state fMRI study identified potential biomarkers predictive of SSRIs treatment response by comparing Pre-treatment functional brain network topology between treatment responders and non-responders in first-episode, drug-naïve adolescents with MDD. We detected significant between-group differences in global network properties and nodal metrics across key brain regions at pre-treatment. Critically, lower nodal efficiency in the right IPL and higher clustering coefficients in the left pallidum emerged as predictors of treatment response. These findings demonstrate that graph-theoretic analysis effectively captures treatment-predictive topological features in brain networks.
This study reveals that non-responders to SSRIs exhibit treatment significantly elevated global network segregation metrics (γ, Eloc, modularity) compared to responders. Furthermore, non-responders showed a pronounced rise in σ and a notable reduction in link weight distribution. This decrease in link weight distribution may reflect a relative loss of redundant connections, which could potentially improve the efficiency of information integration within brain networks. This finding aligns with enhanced small-world characteristics in the non-responders. These results point to a more severe segregation-integration imbalance potentially underlying pharmacoresistance in non-responders (24, 25). Supporting evidence links global topology to SSRIs efficacy: Wang et al. demonstrated negative correlations between pre-treatment Lp, λ and HAMD-17 reduction after 8-week antidepressant treatment in adult MDD, while Eglob showed a positive correlation (26). Similarly, Nakamura et al. observed increased small-world efficiency and modularity paralleling clinical improvement in escitalopram-treated obsessive-compulsive disorder (OCD) patients after 16 weeks (27). Collectively, these results-including ours-position global topological metrics as transdiagnostic predictors of SSRIs response. Nevertheless, significant heterogeneity across studies necessitates large-sample longitudinal validation through graph-theoretic approaches.
Our findings revealed that elevated nodal efficiency in the left MFG of non-responders, indicating enhanced local information integration, is associated with unfavorable treatment outcomes. The MFG, a core component of the dorsolateral prefrontal cortex (DLPFC), plays well-established roles in cognitive control, working memory, and emotion regulation (28–30). Convergent longitudinal evidence demonstrates that escitalopram responders exhibit reduced resting-state functional connectivity (rsFC) between the right DLPFC and left MFG after 8-week treatment, while non-responders show no such change (10). Similarly, reduced left MFG activation during verbal working memory (VWM) task-fMRI at baseline correlates with better clinical outcomes (31), and structural MRI studies associate greater left MFG grey matter density with favorable SSRIs response (32). Additionally, we observed between-group differences in the betweenness centrality of the left postcentral gyrus, nodal efficiency and clustering coefficient of the right IPL- regions comprising the frontoparietal control network (FPCN) with the left MFG. The FPCN mediates executive control and coordinates goal-directed behaviors (33, 34). Notably, pre-treatment thalamo-FPCN functional connectivity predicts sertraline outcomes in adult MDD with moderate accuracy (R²=0.63) (35), further supporting FPCN’s predictive utility for SSRIs response. Collectively, these findings highlight both the left MFG and its embedded FPCN circuitry as critical neural substrates influencing SSRI response, warranting future multicenter studies that integrate these multimodal features via machine learning into robust, precision treatment prediction models.
Our study reveals elevated degree centrality in the right anterior cingulate cortex (ACC) of SSRI non-responders compared to responders, indicating hyperintegration of information processing in this key region for emotional regulation. The ACC mediates emotional regulation through its coordination of cognitive and affective processes within the prefrontal circuitry (36, 37). What we found aligns with task-based fMRI evidence linking ACC overactivation to poor antidepressant outcomes: symptom improvement in SSRI-treated adolescent MDD correlates with reduced activation in the rostral subgenual ACC during negative emotion tasks (38). Convergent evidence demonstrates that lower pre-treatment ACC responses during verbal working memory (VWM) tasks predict better clinical outcomes (31), while heightened pre-treatment ACC-amygdala connectivity during negative emotional processing predicts treatment non-response (39). Critically, ACC metrics show direct predictive utility: pre-treatment subgenual ACC (sgACC) resting-state functional connectivity achieves 72.64% accuracy in predicting 12-week escitalopram response (40), and support vector machine (SVM) models incorporating ACC features achieved 79.41% accuracy for SSRIs response prediction (41). Collectively, these findings establish pre-treatment ACC functional features—particularly its hyperconnectivity—as a robust predictor of SSRI treatment response, offering significant potential for guiding personalized treatment selection.
Our findings reveal elevated clustering coefficients in the left amygdala of SSRI non-responders compared to responders, indicating altered local functional integration within this key affective hub, which aligns with convergent evidence linking aberrant left amygdala activity and connectivity to poor antidepressant outcomes. The amygdala serves as a hub of the affective network (AN), critically enabling higher-order emotional processing including emotion perception, emotional memory formation, and affect regulation (42, 43). Evidence indicates left amygdala dominance, with preferential activation during affective challenges and unique responsiveness to top-down regulation (44, 45), suggesting heightened susceptibility to prefrontal modulation in affective pathology. Our finding aligns with reports that reduced left amygdala activation during masked emotional face tasks predicts superior citalopram response at 8 weeks (46), while pre-treatment hyperconnectivity between the amygdala and left supplementary motor area (SMA) correlates with SSRI non-response in adolescent MDD (47). Collectively, these differential left amygdala alterations hold promise for predicting SSRI efficacy. Future multicenter longitudinal studies should leverage multimodal MRI (structural, functional, connectomic) and machine learning to validate amygdala-based biomarkers for SSRI response prediction.
This study identifies elevated nodal efficiency and clustering coefficient in the left hippocampus/parahippocampal gyrus of SSRI non-responders compared to responders, suggesting aberrant local functional integration and heightened network engagement within these core limbic structures, which aligns with convergent evidence implicating left hippocampal/parahippocampal alterations in poor treatment outcomes. The hippocampus and parahippocampal gyrus constitute core limbic structures essential for emotion regulation, memory encoding and retrieval (36, 38, 48). We observed elevated nodal efficiency and clustering coefficient in the left hippocampus/parahippocampal gyrus of non-responders, suggesting aberrant local functional integration and heightened network engagement. This aligns with task-fMRI evidence linking reduced left hippocampal activation during positive word-pair encoding to poor treatment response (49). Structural MRI studies further associate baseline gray matter density/volume in these regions with SSRI outcomes (32, 50). However, divergent findings exist-such as positive correlations between left hippocampal nodal efficiency and early antidepressant symptom changes in adult MDD (51) - potentially attributable to treatment duration, illness chronicity, or sample size limitations. Additionally, non-responders exhibited increased nodal efficiency in the right angular gyrus and decreased degree centrality in the left supramarginal gyrus-regions belonging to the default mode network (DMN) alongside the hippocampal complex. The DMN supports self-referential processing, autobiographical memory, and social cognition (52, 53), with its hyperactivity potentially reflecting pathological self-focus in MDD. Crucially, DMN connectivity patterns (intra- and inter-network) demonstrate predictive utility for SSRIs treatment efficacy (54–57), solidifying its role as a key predictor. Collectively, these findings highlight both the left hippocampal/parahippocampal and their embedded DMN circuitry as potential SSRI response predictors. Future large-scale longitudinal studies integrating dynamic network analysis and machine learning should establish robust biomarkers.
Critically, this study identifies distinct pre-treatment alterations in the right inferior parietal lobule (IPL) and left pallidum as potential predictors of SSRI treatment response, with lower nodal efficiency in the right IPL and higher clustering coefficient in the left pallidum specifically associated with favorable outcomes. Non-responders exhibited elevated nodal efficiency in the right IPL but reduced clustering coefficient in the left pallidum compared to responders. The IPL mediates fundamental attention, language, and social cognition (58). Relevant evidence demonstrates IPL’s predictive relevance: structural MRI reveals significantly greater post-treatment cortical thickness increases in the right IPL of remitters after 8-week antidepressant therapy (59), while task-fMRI shows greater pre-treatment right IPL activation during Go/No Go tasks in eventual SSRIs remitters (60). Similarly, the pallidum contributes to emotional processing and antidepressant neuromodulation (61). Strikingly analogous to our results, fluoxetine responders exhibit a transient metabolic increase followed by a decrease in the left pallidum (62), with pre-treatment temporal variability in this region predicting 2-week HAMD reduction (r=0.62, P<0.01) (63). These converging lines of evidence establish both right IPL and left pallidum as robust predictors of SSRIs efficacy.
This study has several limitations. First, although all participants received SSRIs as primary treatment, potential confounding effects from concomitant medications (e.g.mirtazapine, buspirone) cannot be fully excluded in real-world clinical settings. Future studies should implement stricter enrollment criteria, medication stratification, or subgroup analyses to address this limitation. Second, the moderate sample size (n=69) constrains generalizability; multicenter collaborations with expanded cohorts are essential. Third, it should be noted that spatial smoothing was applied during preprocessing. This process may influence the estimation of the functional connectivity matrix and consequently bias the subsequent calculation of network metrics (64). To further demonstrate the robustness of our results, we repeated the analyses using unsmoothed data. The statistical results were similar to those obtained with smoothed data, suggesting that smoothing did not unduly affect our conclusions (see Supplementary Table 1). Fourth, the use of the AAL atlas for parcellation represents another potential limitation, as the choice of atlas can influence estimates of network topology (65). Future studies should therefore compare graph-theoretic results across multiple parcellation schemes. Fifth, the exclusive reliance on baseline MRI data precludes longitudinal assessment; future work should incorporate serial neuroimaging to establish causal relationships between network dynamics and treatment outcomes.
5 Conclusion
This study pioneers graph-theoretical analysis of pre-treatment functional brain networks to predict SSRI response in first-episode, drug-naïve adolescent MDD, revealing significant topological differences between responders and non-responders. Critically, reduced nodal efficiency in the right IPL and elevated clustering coefficient in the left pallidum emerged as key predictors of treatment response. These topology-based features offer potential neuroimaging indicators for precision medicine. Future multicenter longitudinal studies should validate these predictors using multimodal MRI, while machine learning frameworks integrating neuroimaging, genomics, and metabolomics could elucidate biological mechanisms and advance precision psychiatry for MDD.
Data availability statement
The raw data supporting the conclusions of this article will be made available by the authors, without undue reservation.
Ethics statement
The studies involving humans were approved by The Ethics Committee of the First Affiliated Hospital of Chongqing Medical University (Ethical approval No. 2020–864). The studies were conducted in accordance with the local legislation and institutional requirements. Written informed consent for participation in this study was provided by the participants’ legal guardians/next of kin. Written informed consent was obtained from the minor(s)’ legal guardian/next of kin for the publication of any potentially identifiable images or data included in this article.
Author contributions
XM: Data curation, Methodology, Writing – original draft. XL: Writing – review & editing, Resources. ML: Methodology, Software, Writing – review & editing. LH: Data curation, Writing – review & editing. QL: Writing – review & editing. JW: Data curation, Writing – review & editing. HD: Data curation, Writing – review & editing. FL: Supervision, Writing – review & editing. XZ: Resources, Writing – review & editing. YM: Formal Analysis, Supervision, Writing – review & editing. YH: Formal Analysis, Supervision, Writing – review & editing.
Funding
The author(s) declare that no financial support was received for the research, and/or publication of this article.
Acknowledgments
We express our sincere appreciation to all participants for their contributions to this study. All participants were informed of the requirement to disclose any potential conflicts of interest, and none were reported that could have influenced this work.
Conflict of interest
The authors declare that the research was conducted in the absence of any commercial or financial relationships that could be construed as a potential conflict of interest.
Generative AI statement
The author(s) declare that no Generative AI was used in the creation of this manuscript.
Any alternative text (alt text) provided alongside figures in this article has been generated by Frontiers with the support of artificial intelligence and reasonable efforts have been made to ensure accuracy, including review by the authors wherever possible. If you identify any issues, please contact us.
Publisher’s note
All claims expressed in this article are solely those of the authors and do not necessarily represent those of their affiliated organizations, or those of the publisher, the editors and the reviewers. Any product that may be evaluated in this article, or claim that may be made by its manufacturer, is not guaranteed or endorsed by the publisher.
Supplementary material
The Supplementary Material for this article can be found online at: https://www.frontiersin.org/articles/10.3389/fpsyt.2025.1675719/full#supplementary-material
References
1. Malhi GS and Mann JJ. Depression. Lancet. (2018) 392:2299–312. doi: 10.1016/S0140-6736(18)31948-2
2. Wickersham A, Sugg HVR, Epstein S, Stewart R, Ford T, and Downs J. Systematic review and meta-analysis: the association between child and adolescent depression and later educational attainment. J Am Acad Child Adolesc Psychiatry. (2021) 60:105–18. doi: 10.1016/j.jaac.2020.10.008
3. Lu B, Lin L, and Su X. Global burden of depression or depressive symptoms in children and adolescents: A systematic review and meta-analysis. J Affect Disord. (2024) 354:553–62. doi: 10.1016/j.jad.2024.03.074
4. Guideline Development Panel for the Treatment of Depressive Disorders. Summary of the clinical practice guideline for the treatment of depression across three age cohorts. Am Psychol. (2022) 77:770–80. doi: 10.1037/amp0000904
5. Walter HJ, Abright AR, Bukstein OG, Diamond J, Keable H, Ripperger-Suhler J, et al. Clinical practice guideline for the assessment and treatment of children and adolescents with major and persistent depressive disorders. J Am Acad Child Adolesc Psychiatry. (2023) 62:479–502. doi: 10.1016/j.jaac.2022.10.001
6. Korczak DJ, Westwell-Roper C, and Sassi R. Diagnosis and management of depression in adolescents. CMAJ. (2023) 195:E739–46. doi: 10.1503/cmaj.220966
7. Depression in children and young people: identification and management. London: National Institute for Health and Care Excellence (NICE) (2019). Available online at: https://www.ncbi.nlm.nih.gov/books/NBK547251/ (Accessed September 23, 2025).
8. March J, Silva S, Petrycki S, Curry J, Wells K, Fairbank J, et al. Fluoxetine, cognitive-behavioral therapy, and their combination for adolescents with depression: Treatment for Adolescents With Depression Study (Tads) randomized controlled trial. JAMA. (2004) 292:807–20. doi: 10.1001/jama.292.7.807
9. Tao R, Calley CS, Hart J, Mayes TL, Nakonezny PA, Lu H, et al. Brain activity in adolescent major depressive disorder before and after fluoxetine treatment. Am J Psychiatry. (2012) 169:381–8. doi: 10.1176/appi.ajp.2011.11040615
10. Lee KH, Shin J, Lee J, Yoo JH, Kim J-W, and Brent DA. Measures of connectivity and dorsolateral prefrontal cortex volumes and depressive symptoms following treatment with selective serotonin reuptake inhibitors in adolescents. JAMA Netw Open. (2023) 6:e2327331. doi: 10.1001/jamanetworkopen.2023.27331
11. Poirot MG, Ruhe HG, Mutsaerts H-JMM, Maximov II, Groote IR, Bjørnerud A, et al. Treatment response prediction in major depressive disorder using multimodal mri and clinical data: secondary analysis of a randomized clinical trial. Am J Psychiatry. (2024) 181:223–33. doi: 10.1176/appi.ajp.20230206
12. Ma H, Zhang D, Wang Y, Ding Y, Yang J, and Li K. Prediction of early improvement of major depressive disorder to antidepressant medication in adolescents with radiomics analysis after ComBat harmonization based on multiscale structural MRI. BMC Psychiatry. (2023) 23:466. doi: 10.1186/s12888-023-04966-8
13. Zeng L-L, Shen H, Liu L, Wang L, Li B, Fang P, et al. Identifying major depression using whole-brain functional connectivity: a multivariate pattern analysis. Brain. (2012) 135:1498–507. doi: 10.1093/brain/aws059
14. Hou X, Liu R, Zhou Y, Guan L, Zhou J, Liu J, et al. Shared and unique alterations of large-scale network connectivity in drug-free adolescent-onset and adult-onset major depressive disorder. Transl Psychiatry. (2024) 14:255. doi: 10.1038/s41398-024-02974-0
15. Li L, Su Y-A, Wu Y-K, Castellanos FX, Li K, Li J-T, et al. Eight-week antidepressant treatment reduces functional connectivity in first-episode drug-naïve patients with major depressive disorder. Hum Brain Mapp. (2021) 42:2593–605. doi: 10.1002/hbm.25391
16. Bullmore E and Sporns O. Complex brain networks: graph theoretical analysis of structural and functional systems. Nat Rev Neurosci. (2009) 10:186–98. doi: 10.1038/nrn2575
17. Wu B, Zhang X, Xie H, Wang X, Gong Q, and Jia Z. Disrupted structural brain networks and structural-functional decoupling in first-episode drug-naïve adolescent major depressive disorder. J Adolesc Health. (2024) 74:941–9. doi: 10.1016/j.jadohealth.2024.01.015
18. Cheng S, Tong HHY, Zhang C, Jian L, Ji J, Li T, et al. Disorganization of small-world functional brain networks in first-episode, treatment-naïve adolescents with major depressive disorder. Brain Behav. (2025) 15:e70323. doi: 10.1002/brb3.70323
19. Jin C, Gao C, Chen C, Ma S, Netra R, Wang Y, et al. A preliminary study of the dysregulation of the resting networks in first-episode medication-naive adolescent depression. Neurosci Lett. (2011) 503:105–9. doi: 10.1016/j.neulet.2011.08.017
20. Chu S-H, Parhi KK, Westlund Schreiner M, Lenglet C, Mueller BA, Klimes-Dougan B, et al. Effect of ssris on resting-state functional brain networks in adolescents with major depressive disorder. J Clin Med. (2021) 10:4322. doi: 10.3390/jcm10194322
21. Wang L, Xia M, Li K, Zeng Y, Su Y, Dai W, et al. The effects of antidepressant treatment on resting-state functional brain networks in patients with major depressive disorder. Hum Brain Mapp. (2015) 36:768–78. doi: 10.1002/hbm.22663
22. Yan C-G, Wang X-D, Zuo X-N, and Zang Y-F. Dpabi: data processing & analysis for (Resting-state) brain imaging. Neuroinformatics. (2016) 14:339–51. doi: 10.1007/s12021-016-9299-4
23. Lei D, Li W, Tallman MJ, Patino LR, McNamara RK, Strawn JR, et al. Changes in the brain structural connectome after a prospective randomized clinical trial of lithium and quetiapine treatment in youth with bipolar disorder. Neuropsychopharmacology. (2021) 46:1315–23. doi: 10.1038/s41386-021-00989-5
24. Tononi G, Sporns O, and Edelman GM. A measure for brain complexity: relating functional segregation and integration in the nervous system. Proc Natl Acad Sci U S A. (1994) 91:5033–7. doi: 10.1073/pnas.91.11.5033
25. Sporns O. Network attributes for segregation and integration in the human brain. Curr Opin Neurobiol. (2013) 23:162–71. doi: 10.1016/j.conb.2012.11.015
26. Zhang Y, Liu X, Hou Z, Yin Y, Xie C, Zhang H, et al. Global topology alteration of the brain functional network affects the 8-week antidepressant response in major depressive disorder. J Affect Disord. (2021) 294:491–6. doi: 10.1016/j.jad.2021.07.078
27. Shin D-J, Jung WH, He Y, Wang J, Shim G, Byun MS, et al. The effects of pharmacological treatment on functional brain connectome in obsessive-compulsive disorder. Biol Psychiatry. (2014) 75:606–14. doi: 10.1016/j.biopsych.2013.09.002
28. Wu B, Chen Y, Long X, Cao Y, Xie H, Wang X, et al. Altered single-subject gray matter structural networks in first-episode drug-naïve adolescent major depressive disorder. Psychiatry Res. (2023) 329:115557. doi: 10.1016/j.psychres.2023.115557
29. Koenigs M and Grafman J. The functional neuroanatomy of depression: distinct roles for ventromedial and dorsolateral prefrontal cortex. Behav Brain Res. (2009) 201:239–43. doi: 10.1016/j.bbr.2009.03.004
30. Pizzagalli DA and Roberts AC. Prefrontal cortex and depression. Neuropsychopharmacology. (2022) 47:225–46. doi: 10.1038/s41386-021-01101-7
31. Walsh ND, Williams SCR, Brammer MJ, Bullmore ET, Kim J, Suckling J, et al. A longitudinal functional magnetic resonance imaging study of verbal working memory in depression after antidepressant therapy. Biol Psychiatry. (2007) 62:1236–43. doi: 10.1016/j.biopsych.2006.12.022
32. Costafreda SG, Chu C, Ashburner J, and Fu CHY. Prognostic and diagnostic potential of the structural neuroanatomy of depression. PloS One. (2009) 4:e6353. doi: 10.1371/journal.pone.0006353
33. Dixon ML, Fox KCR, and Christoff K. A framework for understanding the relationship between externally and internally directed cognition. Neuropsychologia. (2014) 62:321–30. doi: 10.1016/j.neuropsychologia.2014.05.024
34. Spreng RN, Stevens WD, Chamberlain JP, Gilmore AW, and Schacter DL. Default network activity, coupled with the frontoparietal control network, supports goal-directed cognition. Neuroimage. (2010) 53:303–17. doi: 10.1016/j.neuroimage.2010.06.016
35. Hsu L-M, Lane TJ, Wu CW, Lin C-Y, Yeh C-B, Kao H-W, et al. Spontaneous thought-related network connectivity predicts sertraline effect on major depressive disorder. Brain Imaging Behav. (2021) 15:1705–17. doi: 10.1007/s11682-020-00364-w
36. Rive MM, van Rooijen G, Veltman DJ, Phillips ML, Schene AH, and Ruhé HG. Neural correlates of dysfunctional emotion regulation in major depressive disorder. A systematic review of neuroimaging studies. Neurosci Biobehav Rev. (2013) 37:2529–53. doi: 10.1016/j.neubiorev.2013.07.018
37. Naffaa MM. Significance of the anterior cingulate cortex in neurogenesis plasticity: Connections, functions, and disorders across postnatal and adult stages. Bioessays. (2024) 46:e2300160. doi: 10.1002/bies.202300160
38. Cullen KR, Klimes-Dougan B, Vu DP, Westlund Schreiner M, Mueller BA, Eberly LE, et al. Neural correlates of antidepressant treatment response in adolescents with major depressive disorder. J Child Adolesc Psychopharmacol. (2016) 26:705–12. doi: 10.1089/cap.2015.0232
39. Vai B, Bulgarelli C, Godlewska BR, Cowen PJ, Benedetti F, and Harmer CJ. Fronto-limbic effective connectivity as possible predictor of antidepressant response to SSRI administration. Eur Neuropsychopharmacol. (2016) 26:2000–10. doi: 10.1016/j.euroneuro.2016.09.640
40. Wang Y, Wang C, Zhou J, Chen X, Liu R, Zhang Z, et al. Contribution of resting-state functional connectivity of the subgenual anterior cingulate to prediction of antidepressant efficacy in patients with major depressive disorder. Transl Psychiatry. (2024) 14:399. doi: 10.1038/s41398-024-03117-1
41. Tian S, Sun Y, Shao J, Zhang S, Mo Z, Liu X, et al. Predicting escitalopram monotherapy response in depression: The role of anterior cingulate cortex. Hum Brain Mapp. (2020) 41:1249–60. doi: 10.1002/hbm.24872
42. Bickart KC, Dickerson BC, and Barrett LF. The amygdala as a hub in brain networks that support social life. Neuropsychologia. (2014) 63:235–48. doi: 10.1016/j.neuropsychologia.2014.08.013
43. Price JL. Comparative aspects of amygdala connectivity. Ann N Y Acad Sci. (2003) 985:50–8. doi: 10.1111/j.1749-6632.2003.tb07070.x
44. Baas D, Aleman A, and Kahn RS. Lateralization of amygdala activation: a systematic review of functional neuroimaging studies. Brain Res Brain Res Rev. (2004) 45:96–103. doi: 10.1016/j.brainresrev.2004.02.004
45. Ochsner KN, Ray RR, Hughes B, McRae K, Cooper JC, Weber J, et al. Bottom-up and top-down processes in emotion generation: common and distinct neural mechanisms. Psychol Sci. (2009) 20:1322–31. doi: 10.1111/j.1467-9280.2009.02459.x
46. Zilcha-Mano S, Wang Z, Peterson BS, Wall MM, Chen Y, Wager TD, et al. Neural mechanisms of expectancy-based placebo effects in antidepressant clinical trials. J Psychiatr Res. (2019) 116:19–25. doi: 10.1016/j.jpsychires.2019.05.023
47. Klimes-Dougan B, Westlund Schreiner M, Thai M, Gunlicks-Stoessel M, Reigstad K, and Cullen KR. Neural and neuroendocrine predictors of pharmacological treatment response in adolescents with depression: A preliminary study. Prog Neuropsychopharmacol Biol Psychiatry. (2018) 81:194–202. doi: 10.1016/j.pnpbp.2017.10.015
48. Jeneson A and Squire LR. Working memory, long-term memory, and medial temporal lobe function. Learn Mem. (2012) 19:15–25. doi: 10.1101/lm.024018.111
49. Toki S, Okamoto Y, Onoda K, Matsumoto T, Yoshimura S, Kunisato Y, et al. Hippocampal activation during associative encoding of word pairs and its relation to symptomatic improvement in depression: a functional and volumetric MRI study. J Affect Disord. (2014) 152–154:462–7. doi: 10.1016/j.jad.2013.07.021
50. Paolini M, Harrington Y, Colombo F, Bettonagli V, Poletti S, Carminati M, et al. Hippocampal and parahippocampal volume and function predict antidepressant response in patients with major depression: A multimodal neuroimaging study. J Psychopharmacol. (2023) 37:1070–81. doi: 10.1177/02698811231190859
51. Gong L, Hou Z, Wang Z, He C, Yin Y, Yuan Y, et al. Disrupted topology of hippocampal connectivity is associated with short-term antidepressant response in major depressive disorder. J Affect Disord. (2018) 225:539–44. doi: 10.1016/j.jad.2017.08.086
52. Zhou H-X, Chen X, Shen Y-Q, Li L, Chen N-X, Zhu Z-C, et al. Rumination and the default mode network: Meta-analysis of brain imaging studies and implications for depression. Neuroimage. (2020) 206:116287. doi: 10.1016/j.neuroimage.2019.116287
53. Dutta A, McKie S, Downey D, Thomas E, Juhasz G, Arnone D, et al. Regional default mode network connectivity in major depressive disorder: modulation by acute intravenous citalopram. Transl Psychiatry. (2019) 9:116. doi: 10.1038/s41398-019-0447-0
54. Spies M, Kraus C, Geissberger N, Auer B, Klöbl M, Tik M, et al. Default mode network deactivation during emotion processing predicts early antidepressant response. Transl Psychiatry. (2017) 7:e1008. doi: 10.1038/tp.2016.265
55. Korgaonkar MS, Goldstein-Piekarski AN, Fornito A, and Williams LM. Intrinsic connectomes are a predictive biomarker of remission in major depressive disorder. Mol Psychiatry. (2020) 25:1537–49. doi: 10.1038/s41380-019-0574-2
56. Neufeld NH, Mulsant BH, Dickie EW, Meyers BS, Alexopoulos GS, Rothschild AJ, et al. Resting state functional connectivity in patients with remitted psychotic depression: A multi-centre STOP-PD study. EBioMedicine. (2018) 36:446–53. doi: 10.1016/j.ebiom.2018.09.025
57. Chin Fatt CR, Jha MK, Cooper CM, Fonzo G, South C, Grannemann B, et al. Effect of intrinsic patterns of functional brain connectivity in moderating antidepressant treatment response in major depression. Am J Psychiatry. (2020) 177:143–54. doi: 10.1176/appi.ajp.2019.18070870
58. Numssen O, Bzdok D, and Hartwigsen G. Functional specialization within the inferior parietal lobes across cognitive domains. Elife. (2021) 10:e63591. doi: 10.7554/eLife.63591
59. Saricicek Aydogan A, Oztekin E, Esen ME, Dusmez S, Gelal F, Besiroğlu L, et al. Cortical thickening in remitters compared to non-remitters with major depressive disorder following 8-week antidepressant treatment. Acta Psychiatr Scand. (2019) 140:217–26. doi: 10.1111/acps.13065
60. Gyurak A, Patenaude B, Korgaonkar MS, Grieve SM, Williams LM, and Etkin A. Frontoparietal activation during response inhibition predicts remission to antidepressants in patients with major depression. Biol Psychiatry. (2016) 79:274–81. doi: 10.1016/j.biopsych.2015.02.037
61. Knowland D, Lilascharoen V, Pacia CP, Shin S, Wang EH-J, and Lim BK. Distinct ventral pallidal neural populations mediate separate symptoms of depression. Cell. (2017) 170:284–297.e18. doi: 10.1016/j.cell.2017.06.015
62. Mayberg HS, Brannan SK, Tekell JL, Silva JA, Mahurin RK, McGinnis S, et al. Regional metabolic effects of fluoxetine in major depression: serial changes and relationship to clinical response. Biol Psychiatry. (2000) 48:830–43. doi: 10.1016/s0006-3223(00)01036-2
63. Hou Z, Kong Y, He X, Yin Y, Zhang Y, and Yuan Y. Increased temporal variability of striatum region facilitating the early antidepressant response in patients with major depressive disorder. Prog Neuropsychopharmacol Biol Psychiatry. (2018) 85:39–45. doi: 10.1016/j.pnpbp.2018.03.026
64. Alakörkkö T, Saarimäki H, Glerean E, Saramäki J, and Korhonen O. Effects of spatial smoothing on functional brain networks. Eur J Neurosci. (2017) 46:2471–80. doi: 10.1111/ejn.13717
Keywords: major depressive disorder, adolescents, selective serotonin reuptake inhibitors, functional brain networks, graph theory
Citation: Mo X, Li X, Liu M, Hu L, Li Q, Wang J, Deng H, Lv F, Zhou X, Mao Y and Huang Y (2025) Resting-state fMRI graph theory analysis for predicting selective serotonin reuptake inhibitors treatment response in adolescent major depressive disorder. Front. Psychiatry 16:1675719. doi: 10.3389/fpsyt.2025.1675719
Received: 29 July 2025; Accepted: 18 September 2025;
Published: 01 October 2025.
Edited by:
Yosuke Morishima, University of Bern, SwitzerlandReviewed by:
Kuanjun He, Inner Mongolia University for Nationalities, ChinaOnerva Korhonen, Tampere University, Finland
Copyright © 2025 Mo, Li, Liu, Hu, Li, Wang, Deng, Lv, Zhou, Mao and Huang. This is an open-access article distributed under the terms of the Creative Commons Attribution License (CC BY). The use, distribution or reproduction in other forums is permitted, provided the original author(s) and the copyright owner(s) are credited and that the original publication in this journal is cited, in accordance with accepted academic practice. No use, distribution or reproduction is permitted which does not comply with these terms.
*Correspondence: Yun Mao, bWFveXVuMTk3OUAxNjMuY29t; Yang Huang, aHVhbmd5YW5nQGhvc3BpdGFsLmNxbXUuZWR1LmNu
†These authors have contributed equally to this work and share first authorship