Your new experience awaits. Try the new design now and help us make it even better

ORIGINAL RESEARCH article

Front. Quantum Sci. Technol., 09 December 2025

Sec. Quantum Sensing and Metrology

Volume 4 - 2025 | https://doi.org/10.3389/frqst.2025.1701548

This article is part of the Research TopicAdvanced Material Design and Post-Treatment Techniques for Enhancing Color Centers in Quantum TechnologiesView all 4 articles

Characterization of low-nitrogen quantum diamond for pulsed magnetometry applications

Jiashen Tang,Jiashen Tang1,2Connor A. RoncaioliConnor A. Roncaioli3Andrew M. EdmondsAndrew M. Edmonds4Atli DavidssonAtli Davidsson5Connor A. HartConnor A. Hart1Matthew L. MarkhamMatthew L. Markham4Ronald L. Walsworth,,
Ronald L. Walsworth1,2,6*
  • 1Quantum Technology Center, University of Maryland, College Park, MD, United States
  • 2Department of Physics, University of Maryland, College Park, MD, United States
  • 3DEVCOM Army Research Laboratory, Adelphi, MD, United States
  • 4Element Six Global Innovation Centre, Didcot, Oxfordshire, United Kingdom
  • 5Department of Chemistry and Biochemistry, University of Maryland, College Park, MD, United States
  • 6Department of Electrical Engineering and Computer Science, University of Maryland, College Park, MD, United States

Ensembles of nitrogen-vacancy (NV) centers in diamond are versatile quantum sensors with broad applications in the physical and life sciences. The concentration of neutral substitutional nitrogen ([Ns0]) strongly influences NV electronic spin coherence times, sensitivity, and optimal sensing strategies. Diamonds with [Ns0]  1–10 ppm are a focus of recent material engineering efforts, with higher concentrations being favorable for continuous-wave optically detected magnetic resonance (CW-ODMR) and lower concentrations expected to benefit pulsed magnetometry techniques through extended NV spin coherence times and improved sensing duty cycles. In this work, we synthesize and characterize low-[Ns0] (0.8 ppm), NV-enriched diamond material, engineered through low-strain chemical vapor deposition (CVD) growth on high-quality substrates, 12C isotopic purification, and controlled electron irradiation and annealing. Our results demonstrate good strain homogeneity in diamonds grown on CVD substrates and spin-bath-limited NV dephasing times. By measuring NV spin and charge properties across a wide range of optical NV excitation intensity, we provide direct comparisons of photon-shot-noise-limited magnetic field sensitivity between the current low-[Ns0] and previously studied higher-[Ns0] (14 ppm) NV-diamond sensors. We show that low-[Ns0] diamond can outperform higher-[Ns0] diamond at moderate and low optical NV excitation intensity. Our results provide practical benchmarks and guidance for selecting NV-diamond sensors tailored to specific experimental constraints and sensing requirements.

1 Introduction

Nitrogen-vacancy (NV) centers in diamond are a leading quantum sensing platform due to favorable optical and electronic spin properties (Barry et al., 2020), with wide-ranging applications, including in condensed matter physics (Ku et al., 2020; Zhang et al., 2021; Rovny et al., 2024), electronics systems (Turner et al., 2020; Garsi et al., 2024), geoscience (Glenn et al., 2017; Fu et al., 2023), and life science (Barry et al., 2016; Aslam et al., 2023; Schirhagl et al., 2014). Extensive research has focused on magnetic sensing and imaging using ensembles of NV centers. However, experimentally realized sensitivities remain several orders of magnitude below the fundamental spin-projection limit (Hart et al., 2021; Barry et al., 2024). A recent review (Barry et al., 2020) highlights strategies for further improving sensitivity, including extending spin coherence times through advanced pulse sequences and targeted material engineering.

A key material engineering parameter affecting NV ensemble magnetic sensing performance is the concentration of neutral substitutional nitrogen ([Ns0]), which strongly influences NV formation, charge stability, and spin coherence properties. Diamonds with higher [Ns0] provide increased NV center density and improved NV charge stability due to electron-donating nitrogen. However, higher [Ns0] also creates a dense paramagnetic spin bath, significantly limiting NV spin coherence times. Conversely, lower [Ns0] materials offer improved coherence at the expense of NV density and charge stability. Previous studies identified an optimal [Ns0] range around 1–10 ppm for balancing these competing factors (Bauch et al., 2018; Edmonds et al., 2021).

In prior work (Edmonds et al., 2021), we synthesized chemical vapor deposition (CVD) diamonds with relatively high [Ns0] (nominally 14 ppm), demonstrating a favorable balance between NV density and Ramsey dephasing time T2* for broadband DC magnetic sensing. Shorter T2* also reduces the demand on bias magnetic field homogeneity. However, sensitivity assessments using simplified metrics like η̃=([Ns0]×T2*)1/2 inadequately capture experimental overheads from NV spin initialization and readout. Such overheads particularly impact pulsed magnetometry protocols, which are advantageous for high-sensitivity measurements due to their separation of microwave and optical broadening effects inherent in continuous-wave optically detected magnetic resonance (CW-ODMR) methods (Barry et al., 2020). Accounting for these overheads shifts the sensitivity optimum toward lower [Ns0] diamonds (Figure 1), where longer coherence improves sensing duty cycles.

Figure 1
Graph a) shows the inverse of efficiency versus nitrogen concentration with two lines for different initial conditions. Graph b) includes two plots: the top shows normalized nitrogen concentration, and the bottom depicts the inverse efficiency ratio, both varying with time. Diagram c) illustrates laser, microwave, and readout timing for CW-ODMR and Ramsey sequences.

Figure 1. (a) NV ensemble DC magnetic field sensitivity estimated using the simplified metric 1/η̃=[Ns0]×T2*, assuming spin-bath-limited T2* and 99.995% isotopic enrichment of 12C. Corrections accounting for experimental overhead time (tO) are included by multiplying with 1/(T2*+tO)/T2* (cf. Equation 1). With zero overhead (blue line), sensitivity plateaus for [Ns0]1 ppm. However, incorporating an overhead of 10μ s, typical in pulsed Ramsey protocols, shifts the optimal [Ns0] towards lower values (red line). A preliminary comparison between the current low-[Ns0] samples (0.8 ppm) and a previously characterized high-[Ns0] sample (∼14ppm) suggests a nearly threefold sensitivity improvement. (b) Estimated optimal nitrogen concentration, and sensitivity improvement between 0.8 ppm and 14 ppm samples as functions of overhead time (tO). (c) Schematics comparing NV magnetometry protocols based on continuous-wave optically detected magnetic resonance (CW-ODMR) and pulsed Ramsey. CW-ODMR has nominally zero overhead but suffers from intrinsic competition between simultaneous microwave (MW) and optical NV excitation. Pulsed Ramsey avoids these competing effects but incurs non-negligible overhead from NV initialization and readout.

Realizing these sensing advantages with low-nitrogen diamond materials necessitates careful control of other material parameters. These include 12C isotopic purification to minimize 13C nuclear spin noise, optimization of growth conditions to reduce strain and other unwanted defect densities, and controlled irradiation and annealing processes to achieve high Ns0-to-NV conversion while preserving the NV charge fraction despite lower donor concentrations.

In this work, we report the synthesis and characterization of low-[Ns0] (0.8 ppm) diamond material for pulsed NV ensemble magnetometry. Focusing on Ramsey-based DC magnetic field sensing, we show that combining low-strain CVD growth, 12C isotopic purification, and controlled electron irradiation and annealing yields NV-enriched diamond materials with spin-bath-limited dephasing times. We directly compare photon-shot-noise-limited sensitivity between an example low-[Ns0] sample and a previously studied high-[Ns0] diamond Edmonds et al. (2021), by characterizing NV spin and charge properties across a range of laser intensities used for optical NV excitation (i.e., NV spin initialization and readout). The low-nitrogen sample demonstrates improved sensitivity, particularly at moderate and low optical powers. This study provides practical benchmarks and guidance for selecting NV diamond sensors across diverse magnetometry applications, considering experimental constraints and sensing requirements, and also informs future diamond material engineering efforts.

2 Material and experimental methods

2.1 Parameters relevant to sensitivity

The photon shot-noise-limited magnetic sensitivity of an NV ensemble Ramsey-based DC magnetometry protocol is given by:

ηRamseyphoton-shot=1Δmsγe1Nτ1e(τ/T2*)p1+1C2navgτ+tOτ,(1)

where Δms denotes the spin-state transition (1 for single-quantum and two for double-quantum transitions (Mamin et al., 2014)), γe is the electron gyromagnetic ratio, N is the total number of NV contributing to the measurement, τ is the spin free-precession time during sensing, T2* and p characterize the NV spin dephasing time and Ramsey decay envelope shape, C is the NV spin-state-dependent photoluminescence (PL) measurement contrast, navg is the average PL photon number detected per NV per measurement, and tO is the total experimental overhead time including initialization and readout.

T2* for an NV ensemble can be expressed as the inverse sum of several common dephasing mechanisms (Bauch et al., 2018; Barry et al., 2020):

1T2*=1T2,Ns0*+1T2,13C*+1T2,NV-NV*+1T2, strain*+1T2,bias*.(2)

The first two terms represent the spin-bath noise from substitutional nitrogen and residual 13C in the diamond lattice, with their contributions scaling directly with respective concentrations. The third term accounts for NV–NV dipolar interactions, which can be significant in high NV density samples created by irradiation and annealing. The last two terms account for spatial variation (inhomogeneity) in lattice strain and the applied bias magnetic field. Quantification of [Ns0], [NV], 13C content, and strain is therefore essential for confirming whether a given diamond sample achieves spin-bath-limited dephasing.

The NV optical excitation intensity further affects the photon-shot-noise-limited sensitivity by modifying the NV charge fraction, and hence the effective number of sensors N. Since NV and NV0 have overlapping emission spectra and different PL brightness, both the measurement contrast (C) and detected photon number per NV (navg) vary with excitation laser intensity. Additionally, the experimental overhead time tO, which includes NV spin initialization and readout, also depends on optical NV excitation intensity. Therefore, in addition to measuring T2*, it is important to characterize these parameters as functions of excitation intensity to enable a complete sensitivity assessment.

2.2 Diamond synthesis and treatment

The diamond samples studied here are grown on a diamond substrate by Element Six using microwave-plasma-assisted chemical vapor deposition (CVD). Nitrogen-doped CVD diamond materials can exhibit an increased fraction of positively charged substitutional nitrogen ([Ns+]), associated with undesirable brown coloration. This coloration increases absorption of excitation light and NV PL, and is correlated with elevated concentrations of paramagnetic defects related to vacancies (Khan et al., 2010; 2009; Hounsome et al., 2006; Fujita et al., 2009) and hydrogen (Glover et al., 2003; 2004). To mitigate these effects and achieve a homogeneous distribution of nitrogen with [Ns0] 1 ppm, key synthesis parameters–including substrate temperature, CH4/H2 ratio, and N2 concentration–are carefully chosen, according to the methods outlined elsewhere (Edmonds et al., 2021) and in the Supplementary Material. Additionally, CH4 sources isotopically enriched with 12C (>99.99%) are used. Deposition conditions are controlled for the duration of the run to avoid the formation of non-epitaxial crystallites on the main growth surface; and twinning at the edges of the samples is also minimized to avoid a reduction in usable surface area for the final processed plates.

Crystal strain in CVD-grown diamond layers is strongly influenced by the dislocation density, and dislocations typically propagate along the growth direction (Martineau et al., 2004; Gaukroger et al., 2008). Key sources of dislocations include those nucleated at the substrate–growth interface due to substrate polishing damage, and dislocations threading from the substrate into newly grown layers. Additionally, mismatches in nitrogen concentration between the substrate and growth layers can induce bulk stress due to lattice mismatch (Friel et al., 2009). Thus, careful selection and preparation of substrates is critical.

The substrates are CVD single-crystal diamonds with low nitrogen content ([Ns0]  1 ppm), closely matching the nitrogen concentration of the intended growth layer (0.8 ppm). Substrates are selected based on low birefringence, indicative of a low density of dislocations that are likely to thread into the growth. Substrates have typical dimensions of approximately 3.5×3.5× 0.3 mm3, with a mechanically polished {100} surface prepared by standard scaife techniques (Schuelke and Grotjohn, 2013; Hird and Field, 2004). After approximately 1.2 mm of growth, the newly grown CVD diamond layers are laser-sliced to detach from substrates, and only the central 3×3 mm2 region is retained, avoiding dislocations propagating from substrate edges.

Following processing, electron irradiation and annealing is performed to convert grown-in [Ns0] defects into NV centers. Samples are irradiated using a 1.5 MeV electron beam at an estimated dose of 4.8×1017 cm-2, targeting approximately 50% Ns0-to-NV conversion rate. This target maximizes NV PL whilst not introducing excess vacancies that are not converted to NV centers (Hartland, 2014) and could detrimentally affect NV charge stability and coherence time. Annealing is carried out using a previously established ramp profile with a final temperature of 1,200 °C for 2 h (Edmonds et al., 2021).

2.3 Wide-field strain mapping

Strain variations across each NV-diamond sample are mapped using CW-ODMR in a wide-field imaging configuration, as previously described in Ref. Roncaioli et al. (2024). Briefly, a 532 nm laser beam (1 W) illuminates the diamond at a shallow incidence angle. Before reaching the diamond, a 30 mm focal-length cylindrical lens shapes the laser beam into an elliptical profile, measuring 10 mm by 700μm, ensuring uniform illumination across the diamond. NV PL is collected using a 0.1NA, 4× objective and imaged onto a camera.

A bias magnetic field 50 G is applied to the NV-diamond sample under study using a pair of permanent magnets, with the field oriented such that spin resonances from all four NV orientations in the diamond lattice are resolved. This configuration allows extraction of the NV spin-strain coupling terms (Mz) following the method described in Kehayias et al. (2019). Microwaves are delivered to the sample using a loop-gap resonator (Eisenach et al., 2018). Pixel-by-pixel fitting of the NV Hamiltonian to the CW-ODMR spectra is performed using GPU-accelerated fitting (Przybylski et al., 2017), generating full-diamond strain maps.

2.4 Confocal spin and charge characterization

NV spin dephasing times (T2*), charge-state fractions, PL contrast, and experimental overhead (spin initialization and readout) are measured using a custom-built confocal setup. Measurements are performed as functions of optical NV excitation intensity.

To achieve uniform optical NV excitation, the 532 nm laser beam is focused to a waist diameter of about 15 μm by underfilling a 0.75NA, 20× objective. A pinhole in the detection path restricts NV PL collection to a smaller (6 μm diameter, 10μm depth) region at the center of the beam spot. The optical intensity at the diamond surface is determined from the average intensity within the restricted collection volume, and is controllably varied from approximately 103 to 101 mW/μm2.

Microwave pulses for NV spin-state manipulation are delivered via a coaxial loop near the diamond surface, achieving Rabi frequencies 5 MHz. A bias magnetic field (20 G), aligned along a single NV crystallographic axis, is optimized to minimize spatial inhomogeneity within the probed region, similar to Bauch et al. (2018).

For NV charge-state determination, PL emission is collected through a multimode optical fiber coupled to a spectrometer. Recorded emission spectra are decomposed into NV and NV0 spectral profiles (Aude Craik et al., 2020). NV charge fractions are then quantified using the intensity ratio between NV and NV0 PL (Alsid et al., 2019).

3 Results

3.1 Synthesized diamonds

We first study ten low-[Ns0] diamonds, grown in a single synthesis run, prior to irradiation and annealing. Measurements of [Ns0] performed via UV-Vis absorption (Edmonds et al., 2021) yield values in the range of 0.730.88 ppm. Optical birefringence imaging at 590 nm wavelength, performed using techniques outlined in (Glazer et al., 1996; Friel et al., 2009), yields average birefringence (Δn) across the samples between 2.6×10⁶ and 5.2×10⁶ (Figure 2), indicative of generally good strain homogeneity in this diamond cohort (Friel et al., 2009). Irradiation and annealing increase the NV concentration in each sample to approximately 0.39 (2) ppm, as measured by UV-Vis absorption in (Edmonds et al., 2021).

Figure 2
Ten micrographs labeled Sample 1 to Sample 10 show variations in birefringence, indicated by a color scale from blue to red. Sample 10 is highlighted, showing enlarged areas A and B with specific birefringence values: 5.4 x 10⁻⁵ and 6.4 x 10⁻⁵, respectively.

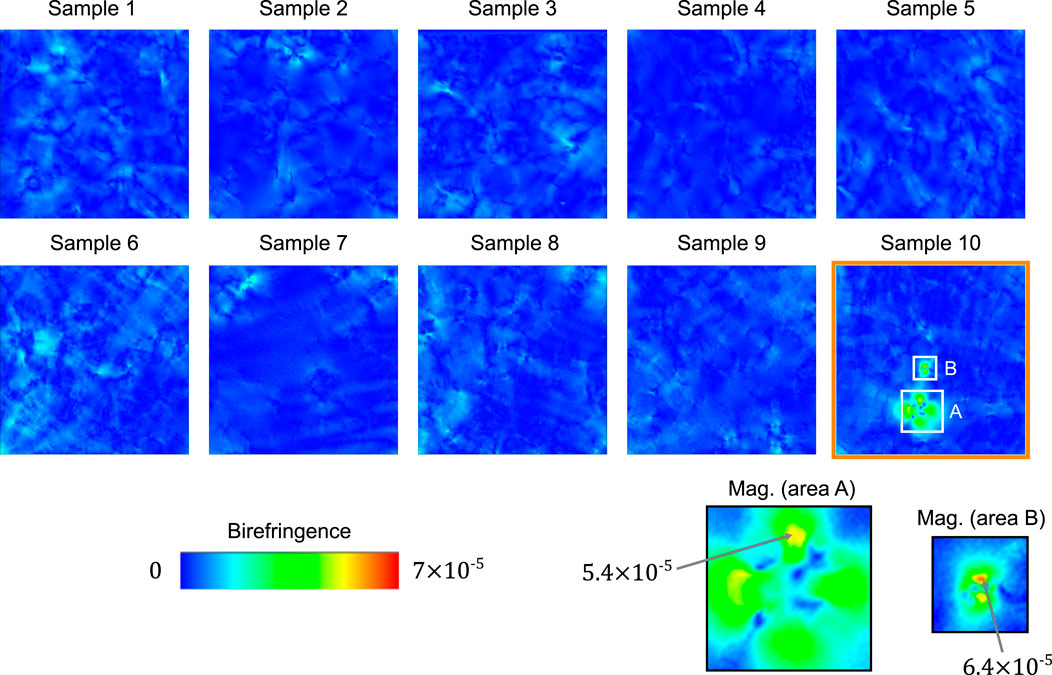
Figure 2. Optical birefringence images of ten low-[Ns0] diamond samples from a single CVD synthesis run, prior to irradiation and annealing. Sample 10, exhibiting the strongest birefringence features, is selected for subsequent NV-based measurements after irradiation and annealing. Magnified views are shown of two regions of sample 10 with higher levels of birefringence (labeled A and B), with example values of high birefringence indicated.

For subsequent characterizations (described below and in the Supplementary Material) we study sample 10, as this sample exhibits higher levels of birefringence from this growth process in certain spatially restricted regions, allowing us to examine both typical behavior for the low-[Ns0] diamonds (far from the high birefringence regions) as well as the worst-case impact of strain on NV spin dephasing and sensing performance (in the high birefringence regions).

The main factors governing NV ensemble Ramsey dephasing time (T2*) – namely, nitrogen and 13C concentrations and strain uniformity–are well established (Bauch et al., 2018; Barry et al., 2020; Edmonds et al., 2021), allowing reliable estimation of T2* from these parameters. The diamonds grown in the same synthesis run exhibit closely matched birefringence and nitrogen concentrations, indicating good sample-to-sample reproducibility.

3.2 NV spin dephasing time and strain contribution

Confocal Ramsey measurements of the single-quantum (SQ) NV ensemble spin dephasing time at three representative low-birefringence locations within sample 10 (Figures 3a,b) yield an average value T2,SQ*=17.5±1.0μs (an additional high-birefringence location measurement is shown in the Supplementary Material). These results are only slightly smaller than the theoretical spin-bath-limited value of approximately 20 μs, consistent with NV ensemble spin dephasing in the low-[Ns0] diamond samples being primarily limited by intrinsic nitrogen spin-bath interactions (see Supplementary Material). Achieving T2,SQ* values near the spin-bath limit–without using double-quantum techniques as in Bauch et al. (2018) – is enabled by improved strain control during CVD growth, including the use of low-dislocation CVD substrates instead of HPHT substrates and the growth optimizations described in Section 2.2. Similar measurements on a previously studied higher-[Ns0] (14 ppm) diamond sample (Edmonds et al., 2021) yield T2,SQ*1μs.

Figure 3
a) A 3D model with a blue surface showing three yellow crosses labeled 1, 2, and 3 indicating specific areas with a green highlighted region. b) A graph plotting C against τ in microseconds. Data points are scattered with a yellow dashed line showing the extracted NV ensemble dephasing time, approximately 17.7 microseconds across the range, with values fluctuating between 0.98 and 1.01.

Figure 3. Single-quantum (SQ) Ramsey measurements on diamond sample 10, far from the high birefringence regions. (a) Ramsey measurements performed at three representative locations of low strain, overlaid on the birefringence image from Figure 2. (b) Ensemble NV spin dephasing at location 2. Here the microwave frequency is detuned from the center of the hyperfine-split NV spin transitions, allowing the decay envelope to be separated from hyperfine-induced beating. The extracted ensemble NV dephasing time is T2,SQ*=17.7(4)μs.

Figure 4a shows the strain-induced frequency shifts (Mz) in NV spin resonances measured across sample 10 for one NV crystallographic orientation (maps for all four NV orientations are available in the Supplementary Material). The distribution of frequency shifts provides a quantitative estimate of the strain-limited NV electronic spin dephasing time (Barry et al., 2020), calculated as T2,strain*=(πΔ)1, where Δ is the full width at half maximum (FWHM) of the distribution. Histogram analysis of strain across the diamond (Figure 4c) yields Δ31 kHz, corresponding to T2,strain*10μs. These wide-field measurements integrate strain variations through the full thickness (about 500 μm for the samples studied here, which is roughly 5× thicker than the strain-imaged high-[Ns0] diamond in Edmonds et al. (2021)) and across the full diameter of the diamond, overestimating strain effects when considering smaller sensing volumes. For example, histogram analysis of strain in a smaller, low-birefringence region (500μm diameter) of sample 10 yields a narrower FWHM linewidth of about 15 kHz and hence T2*20μs (Figures 4b,d), indicating reduced strain inhomogeneity in this smaller region. Extrapolating to the volume probed with confocal measurements, we estimate a further order-of-magnitude reduction in strain inhomogeneity and hence a corresponding modest contribution to the SQ NV ensemble dephasing time T2,SQ* determined from confocal measurements. At lower nitrogen concentration, the spin-bath limit of NV dephasing occurs on a longer timescale, so achieving good strain homogeneity becomes essential to reach that limit. Our results confirm that this condition is satisfied in the present low-[Ns0] diamond.

Figure 4
Whole diamond strain map and sub-region strain map visualizations. Panel (a) shows a color-coded strain map of a diamond, with red indicating higher strain and blue lower strain, scale bar 500 micrometers. Panel (b) zooms into a sub-region with similar color coding, scale bar 100 micrometers. Panel (c) displays a histogram of strain values with a peak at zero megahertz, marked by a dashed line indicating a width of 31 kilohertz. Panel (d) shows a similar histogram for the sub-region with a dashed line indicating a width of 15 kilohertz.

Figure 4. Wide-field imaging of diamond strain for sample 10. (a,b) Spatial maps of strain-induced frequency shifts in NV spin transitions across the entire diamond sample and within a selected sub-area. Strain fields shown are projections onto one NV crystallographic orientation. Each spatial map is mean-subtracted so that the global average is zero, emphasizing relative strain variations relevant to NV spin dephasing. (c,d) Histogram distributions of the strain-induced frequency shifts extracted from the maps in (a) and (b), respectively. Lorentzian fits to the histograms are also shown, from which linewidths (FWHM) Δ are determined.

To evaluate the feasibility of scaling sensor sizes for bulk NV magnetometry, we analyze how strain-induced linewidth broadening changes with sensing region size (Lsensor). We partition the wide-field strain map shown in Figure 4a into square sub-regions of varying areas (30 μm2 to 3,000 μm2), computing strain-induced frequency shift distributions for each sub-region, as in Figures 4c,d. We find that the median of the distribution FWHM (Δ) varies only about a factor of three over this range (Figure 5a), indicating modest strain heterogeneity over large lengthscales within the diamond sample.

Figure 5
Graph a shows the relationship between Δ (in kilohertz) and sensor length (in micrometers) with minimum (yellow) and median (green) values, increasing with length. Graph b plots inverse effective T2 across sensor length on a logarithmic scale, showing a negative trend with a red dashed line representing L to the power of negative 0.95.

Figure 5. (a) Lorentzian-fitted FWHM (Δ) of strain-induced frequency shifts as a function of sensor size Lsensor for sample 10. Sensor size is systematically varied by partitioning the full-diamond strain map (Figure 4a) into smaller square sub-regions. Statistical analysis of Δ across sub-regions is presented, including minimum and median values. When more than five sub-regions are available, interquartile ranges are included: 25%–75% (vertical solid lines) and 10%–90% (vertical dotted lines). (b) Scaling of effective Ramsey DC magnetometry sensitivity metric with increasing sensor size. In the ideal scenario, where increasing the sensing volume introduces no additional NV ensemble dephasing–and thus no reduction in Ramsey T2* – the sensitivity metric scales inversely with sensor size. Here, fitting a power-law function to the effective sensitivity metric vs. Lsensor yields nearly inverse linear scaling behavior, indicating minimal strain limitation on the Ramsey dephasing time for bulk NV ensemble sensing using the present low-[Ns0] diamonds. The overall low-strain effect of these diamonds applies even to sample 10 with its isolated regions of relatively high strain.

To illustrate how size-dependent strain-induced dephasing affects NV ensemble sensor performance, we compute an effective Ramsey DC magnetometry sensitivity metric (T2,eff*×Lsensor)1, with T2,eff* derived from Equation 2 using the median Δ corresponding to each sensor size. Assuming a constant NV ensemble sensor thickness across all regions of the diamond sample, sensor volume (and hence the number of NVs being probed) scales as Lsensor2, resulting in inverse linear scaling of the effective sensitivity metric with Lsensor in the ideal case of no additional NV ensemble dephasing with increasing Lsensor. The observed nearly inverse linear scaling of the effective sensitivity metric for sample 10 (Figure 5b) indicates minimal reduction in Ramsey T2* on lengthscales 30μm, suggesting sensor-size scaling remains a viable strategy for improved bulk NV magnetometry using this low-[Ns0] diamond material.

3.3 Photoluminescence contrast, overhead time, and charge fraction

We characterize NV photoluminescence (PL) spin-state contrast (C) and spin initialization time (tI) as functions of optical excitation intensity. Figure 6a illustrates the protocol used to measure PL contrast and NV spin polarization dynamics. After initializing NV spins into either ms=0 or ms=1, we vary the delay (tdelay) to NV spin-state readout. PL contrast initially reaches a maximum before decreasing as NV spins repolarize to ms=0, allowing simultaneous extraction of C and tI from a single measurement (Figures 6b,c). To validate the experimental calibration of laser power to incident optical excitation intensity for the measured NV ensemble, we simulate NV spin polarization dynamics using a five-level photophysics model (Schloss, 2019) (see Supplementary Material). Simulated initialization times (tI) closely match experimental data across a wide range of optical intensities (Figure 6b), confirming accurate calibration of illumination conditions within the probed region.

Figure 6
Four graphs depicting experimental data. (a) A plot of Signal/Reference ratio against delay time, with an inset illustrating the experimental setup. (b) A graph showing a decreasing trend of time (t1) versus intensity, with yellow dots and a blue shaded area. (c) A plot showing the percentage change (C%) against intensity for low and high initial N0, marked by pink and purple dots. (d) A graph of a parameter (ψ) against intensity for low and high initial N0, marked by light and dark blue dots. Each plot investigates relationships between variables in a photonic experiment.

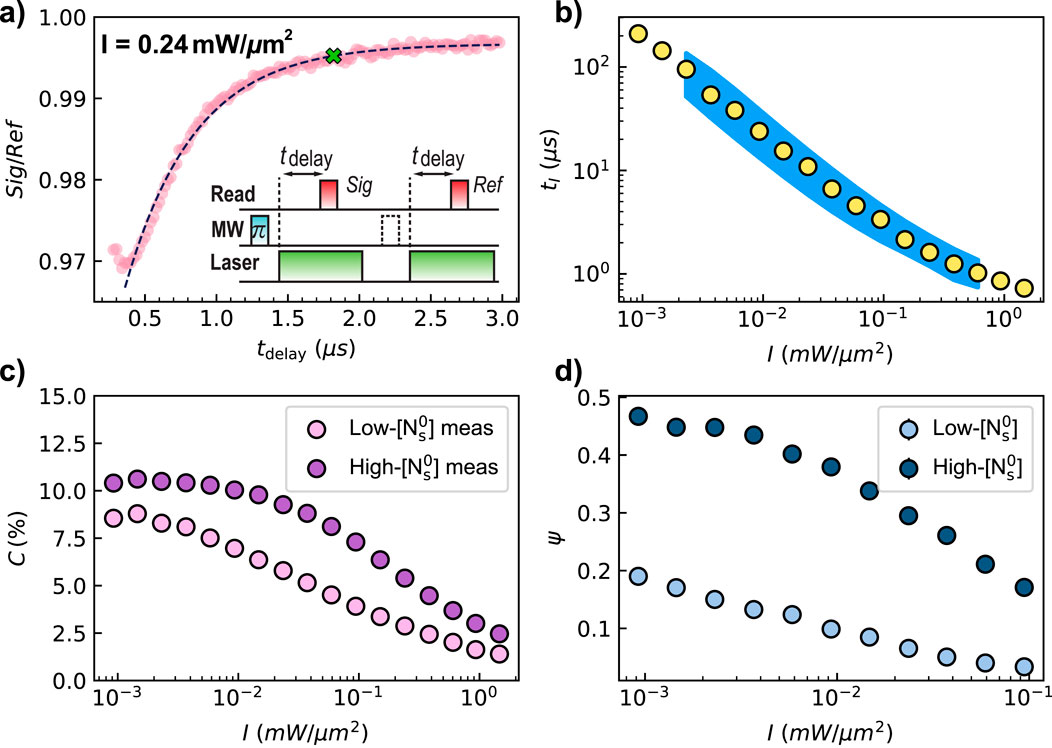
Figure 6. NV spin polarization dynamics, initialization time, PL contrast, and charge fraction as functions of laser excitation intensity. (a) Measured NV spin polarization dynamics and schematic measurement protocol (inset). A 1-ms laser pulse (not shown) initializes the NV ensemble into the ms=0 state prior to a microwave (MW) π pulse that initializes the NV ensemble into ms=1. A laser pulse then begins to repolarize the NV spins, with PL readout (Sig) acquired after a delay time tdelay. The measurement protocol is then repeated without the MW π pulse, and a reference PL measurement (Ref) is acquired. Example PL contrast measurement (Sig/Ref) at a laser intensity of 0.24 mW/μm2, shown as a function of tdelay. Spin initialization time tI (green cross) is extracted by fitting an exponential decay to the PL contrast data following its peak; we set tI as the delay at which contrast decays to 1/e3 of its peak value, corresponding to repolarization of 95% of the ensemble NV spins. With this measurement protocol, the readout time is included in the reported initialization time. (b) Measured NV initialization time (tI) as a function of laser intensity. The shaded blue region represents the range of initialization times predicted based on a five-level model of NV photophysics, with saturation intensities of 1 mW/μm2 and 3 mW/μm2 used to produce the lower and upper bounds, respectively (see Supplementary Material). (c) Measured peak PL contrast for low- and high-[Ns0]. diamonds as a function of laser intensity. (d) Experimentally-determined NV charge-state fraction ψ, defined as [NV]/([NV]+[NV0]), as a function of laser intensity for both low- and high-[Ns0] diamond samples. NV PL spectra used for decomposition analysis (see the main text) are collected using a 550 nm long-pass filter.

Observed PL contrast degradation at higher optical intensities (Figure 6c) is primarily attributed to increased NV ionization (Aslam et al., 2013; Manson and Harrison, 2005), raising the NV0 fraction and associated background PL. Similar contrast reduction at high optical intensity is observed in the higher-[Ns0] (14 ppm) diamond sample, but is partially mitigated in this sample due to increased nitrogen donor concentration stabilizing NV. Direct measurements of the NV charge-state fraction (ψ) using a PL emission spectrum decomposition technique (Aude Craik et al., 2020; Alsid et al., 2019) reveal decreasing NV fraction with increasing optical intensity (Figure 6d). The charge-state determination is limited to intensities 10−1 mW/μm2, where the relative PL emission ratio between NV0 and NV is reliably determined below NV saturation conditions (Alsid et al., 2019). Measurement of ψ also shows substantially lower NV fraction in low-[Ns0] compared to high-[Ns0] diamond (Figure 6d). However, the NV0 PL emission intensity is approximately 2.5× dimmer than that for NV under typical optical excitation (Alsid et al., 2019), and spectral filtering techniques used in NV experiments (passing PL >647 nm) further reduce the effect of NV0 PL on observed NV-spin-state contrast.

4 Discussion

The availability of low-[Ns0], NV-enriched, and 12C isotopically purified diamond material with good strain homogeneity presents opportunities for NV ensemble sensing applications. In particular, our systematic characterization of NV spin and charge-state properties for both low- and high-[Ns0] samples enables a comparison of their expected photon-shot-noise-limited DC magnetic field sensitivity as a function of optical excitation intensity.

Figure 7 summarizes volume-normalized DC sensitivity estimates for both diamond types, effectively replacing the NV number (N in Equation 1) with the NV concentration (NV). At moderate to low optical excitation intensities (below 0.03 mW/μm2), the low-[Ns0] sample exhibits better (i.e., smaller) estimated sensitivity compared to the high-[Ns0] sample, despite its lower NV density and reduced NV charge fraction. This sensitivity advantage is primarily due to the low-[Ns0] sample’s longer NV spin dephasing time T2* (see Equation 1), which improves the sensing duty cycle, particularly when experimental overhead times associated with initialization and readout are substantial. At higher optical excitation intensities, reduced overhead time narrows the difference in sensing duty cycles between the low- and high-[Ns0] diamonds, making differences in the NV charge-state fraction and effective NV density the dominant factors for sensitivity.

Figure 7
A graph shows the relationship between laser intensity and photoshot sensitivity for different quantum states. The x-axis represents laser intensity in milliwatts per square micrometer, and the y-axis indicates photoshot sensitivity in a unit involving picotesla per Hertz to the negative half power per square micrometer. The plot features two dashed lines for low quantum states (red) and high quantum states (blue) and two solid lines for low and high quantum states (purple and grey). The inset graph depicts sensitivity enhancement versus laser intensity.

Figure 7. Estimated volume-normalized photon shot-noise limited DC magnetic field sensitivity for low- and high-[Ns0] diamond samples as functions of optical excitation intensity. We assume a photon emission rate of 30 kcps per single NV at 1 mW/μm2 illumination intensity. Sensitivity-relevant parameters (see Equation 1), including the Ramsey dephasing times (T2* for both single- and double-quantum measurements), spin-state-dependent PL contrast (C), and experimental overhead time (tO), are directly measured as functions of laser intensity. Nitrogen concentration and NV charge-state fraction, experimentally determined using the UV-Vis absorption method (Section 2.2), are used to estimate the number of NV centers contributing to sensing at a given laser intensity. The inset shows the ratio of estimated sensitivity between high-[Ns0] and low-[Ns0] samples as a function of optical excitation intensity, for SQ (solid) and DQ (dashed) Ramsey protocols, highlighting the relative advantage of low-nitrogen material at moderate to low optical excitation intensities.

Double-quantum (DQ) Ramsey protocols applied to NV ensembles typically provide DC magnetic field sensitivity enhancement via a doubled effective gyromagnetic ratio (Δms=2 in Equation 1) and robustness against strain-induced NV spin dephasing (Hart et al., 2021). However, in diamond samples with good strain homogeneity–such as the low-[Ns0] diamond studied here–or for small interrogation volumes with minimal strain variation, the advantages of DQ sensing strongly depend on the relationship between the spin dephasing time (T2*) and experimental overhead time (tO). Due to increased sensitivity to spin-bath noise, DQ dephasing times are typically about half those of single-quantum (SQ) protocols. Thus, significant DQ sensitivity improvements primarily arise when dephasing times approach or exceed the overhead time (T2*tO), as sensitivity scales linearly with Δms but sublinearly with T2*. This criterion can be readily satisfied by low-[Ns0] diamonds, whereas the shorter dephasing times (1 μs) characteristic of higher-[Ns0] diamonds typically result in linear scaling of sensitivity with T2*.

We note that diamond sample 10 examined in this study (Figure 2) exhibited the highest level of birefringence among the ten low-[Ns0] plates initially characterized, with increased birefringence concentrated in two regions. The pattern is indicative of dislocation bundles, most likely originating from residual damage due to mechanical polishing of the CVD substrates, rather than from the underlying bulk dislocation content of the substrates. If further strain reduction is required, alternative polishing techniques and enhanced substrate characterization for subsurface damage can be implemented (Graziosi et al., 2023).

Our comprehensive assessment of NV PL contrast, charge fraction, spin dephasing time, and photon-shot-noise-limited sensitivity provides guidance to the community in selecting suitable NV-diamond materials for specific sensing applications and operational regimes. In particular, since the low-[Ns0] samples are estimated to exhibit comparable or better photon-shot-noise-limited DC magnetic field sensitivity at moderate-to-low optical illumination intensities, relative to higher-[Ns0] diamonds, applications with limited budgets for size, weight, power, and cost (SWaP-C), or biological sensing that aims to minimize phototoxicity caused by intense green laser illumination (Laissue et al., 2017), will benefit from low-[Ns0] diamonds. Additionally, the current limitations of low-[Ns0] diamonds under high-intensity optical illumination motivate the continued need to optimize NV charge-state stability in future diamond material engineering efforts.

5 Conclusion

We synthesized and systematically characterized low-[Ns0] (0.8 ppm), 12C-purified diamond samples tailored for pulsed DC magnetometry applications using NV ensembles. Our results demonstrate that carefully engineered low-[Ns0] diamond grown on CVD substrates can achieve high spatial strain homogeneity and spin-bath-limited NV spin dephasing times. Controlled irradiation and annealing enriches NV concentration while retaining relatively stable NV charge-state fraction under optical illumination. This combination of properties yields enhanced photon-shot-noise-limited DC magnetic field sensitivity, surpassing higher-[Ns0] diamond sensors at moderate to low optical excitation intensities.

These findings provide practical benchmarks and guidance for selecting NV-diamond sensors based on available optical power and application-specific requirements. Specifically, low-[Ns0] diamonds are advantageous for applications requiring low optical illumination intensity, e.g., providing reduced size, weight, power, and cost (SWaP-C) and minimal phototoxicity. Additionally, the NV spin dephasing times achievable in low-[Ns0] diamonds should benefit from spin-bath driving techniques (Barry et al., 2024; Bauch et al., 2018), potentially enabling DC magnetometry with advanced readout protocols (Arunkumar et al., 2023), further extending the sensitivity and application scope of NV-based quantum sensors.

Data availability statement

The raw data supporting the conclusions of this article will be made available by the authors, without undue reservation.

Author contributions

JT: Conceptualization, Formal Analysis, Investigation, Methodology, Software, Validation, Visualization, Writing – original draft, Writing – review and editing. CR: Formal Analysis, Investigation, Methodology, Resources, Software, Validation, Writing – original draft, Writing – review and editing. AE: Formal Analysis, Investigation, Methodology, Resources, Software, Validation, Visualization, Writing – original draft, Writing – review and editing. AD: Investigation, Writing – review and editing. CH: Conceptualization, Resources, Validation, Writing – review and editing. MM: Conceptualization, Resources, Writing – review and editing. RW: Conceptualization, Funding acquisition, Project administration, Resources, Supervision, Writing – review and editing.

Funding

The authors declare that financial support was received for the research and/or publication of this article. This work is supported by, or in part by, the U.S. Army Research Laboratory, under Contract No. W911NF2420143; the U.S. Army Research Office, under Grant No. W911NF2120110; and the University of Maryland Quantum Technology Center.

Acknowledgements

We thank Daniel Ang and Smriti Bhalerao for their help in setting up a birefringence microscope; and Mason Camp for initial characterization measurements on a second low-nitrogen diamond used in this study.

Conflict of interest

The authors declare that the research was conducted in the absence of any commercial or financial relationships that could be construed as a potential conflict of interest.

Generative AI statement

The authors declare that Generative AI was used in the creation of this manuscript. Generative AI (ChatGPT, OpenAI) was used only for language editing and polishing of the manuscript. All scientific content, data, analysis, and figures were generated and verified by the authors.

Any alternative text (alt text) provided alongside figures in this article has been generated by Frontiers with the support of artificial intelligence and reasonable efforts have been made to ensure accuracy, including review by the authors wherever possible. If you identify any issues, please contact us.

Publisher’s note

All claims expressed in this article are solely those of the authors and do not necessarily represent those of their affiliated organizations, or those of the publisher, the editors and the reviewers. Any product that may be evaluated in this article, or claim that may be made by its manufacturer, is not guaranteed or endorsed by the publisher.

Author disclaimer

The views and conclusions contained in this document are those of the authors and should not be interpreted as representing the official policies, either expressed or implied, of the Army Research Office or the U.S. Government. The U.S. Government is authorized to reproduce and distribute reprints for Government purposes notwithstanding any copyright notation herein.

Supplementary material

The Supplementary Material for this article can be found online at: https://www.frontiersin.org/articles/10.3389/frqst.2025.1701548/full#supplementary-material

References

Alsid, S. T., Barry, J. F., Pham, L. M., Schloss, J. M., O’Keeffe, M. F., Cappellaro, P., et al. (2019). Photoluminescence decomposition analysis: a technique to characterize N-v creation in diamond. Phys. Rev. Appl. 12, 044003. doi:10.1103/PhysRevApplied.12.044003

CrossRef Full Text | Google Scholar

Arunkumar, N., Olsson, K. S., Oon, J. T., Hart, C. A., Bucher, D. B., Glenn, D. R., et al. (2023). Quantum logic enhanced sensing in solid-state spin ensembles. Phys. Rev. Lett. 131, 100801. doi:10.1103/PhysRevLett.131.100801

PubMed Abstract | CrossRef Full Text | Google Scholar

Aslam, N., Waldherr, G., Neumann, P., Jelezko, F., and Wrachtrup, J. (2013). Photo-induced ionization dynamics of the nitrogen vacancy defect in diamond investigated by single-shot charge state detection. New J. Phys. 15, 013064. doi:10.1088/1367-2630/15/1/013064

CrossRef Full Text | Google Scholar

Aslam, N., Zhou, H., Urbach, E. K., Turner, M. J., Walsworth, R. L., Lukin, M. D., et al. (2023). Quantum sensors for biomedical applications. Nat. Rev. Phys. 5, 157–169. doi:10.1038/s42254-023-00558-3

PubMed Abstract | CrossRef Full Text | Google Scholar

Aude Craik, D., Kehayias, P., Greenspon, A., Zhang, X., Turner, M., Schloss, J., et al. (2020). Microwave-assisted spectroscopy technique for studying charge state in nitrogen-vacancy ensembles in diamond. Phys. Rev. Appl. 14, 014009. doi:10.1103/PhysRevApplied.14.014009

CrossRef Full Text | Google Scholar

Barry, J. F., Turner, M. J., Schloss, J. M., Glenn, D. R., Song, Y., Lukin, M. D., et al. (2016). Optical magnetic detection of single-neuron action potentials using quantum defects in diamond. Proc. Natl. Acad. Sci. U.S.A. 113, 14133–14138. doi:10.1073/pnas.1601513113

PubMed Abstract | CrossRef Full Text | Google Scholar

Barry, J. F., Schloss, J. M., Bauch, E., Turner, M. J., Hart, C. A., Pham, L. M., et al. (2020). Sensitivity optimization for NV-diamond magnetometry. Rev. Mod. Phys. 92, 015004. doi:10.1103/RevModPhys.92.015004

CrossRef Full Text | Google Scholar

Barry, J. F., Steinecker, M. H., Alsid, S. T., Majumder, J., Pham, L. M., O’Keeffe, M. F., et al. (2024). Sensitive ac and dc magnetometry with nitrogen-vacancy-center ensembles in diamond. Phys. Rev. Appl. 22, 044069. doi:10.1103/physrevapplied.22.044069

CrossRef Full Text | Google Scholar

Bauch, E., Hart, C. A., Schloss, J. M., Turner, M. J., Barry, J. F., Kehayias, P., et al. (2018). Ultralong dephasing times in solid-state spin ensembles via quantum control. Phys. Rev. X 8, 031025. doi:10.1103/PhysRevX.8.031025

CrossRef Full Text | Google Scholar

Edmonds, A. M., Hart, C. A., Turner, M. J., Colard, P.-O., Schloss, J. M., Olsson, K. S., et al. (2021). Characterisation of CVD diamond with high concentrations of nitrogen for magnetic-field sensing applications. Mater. Quantum Technol. 1, 025001. doi:10.1088/2633-4356/abd88a

CrossRef Full Text | Google Scholar

Eisenach, E., Barry, J., Pham, L., Rojas, R., Englund, D. R., and Braje, D. (2018). Broadband loop gap resonator for nitrogen vacancy centers in diamond. Rev. Sci. Instrum. 89, 094705. doi:10.1063/1.5037465

PubMed Abstract | CrossRef Full Text | Google Scholar

Friel, I., Clewes, S., Dhillon, H., Perkins, N., Twitchen, D., and Scarsbrook, G. (2009). Control of surface and bulk crystalline quality in single crystal diamond grown by chemical vapour deposition. Diam. Relat. Mater. 18, 808–815. doi:10.1016/j.diamond.2009.01.013

CrossRef Full Text | Google Scholar

Fu, R. R., Maher, B. A., Nie, J., Gao, P., Berndt, T., Folsom, E., et al. (2023). Pinpointing the mechanism of magnetic enhancement in modern soils using high-resolution magnetic field imaging. Geochem. Geophys. Geosyst. 24, e2022GC010812. doi:10.1029/2022GC010812

CrossRef Full Text | Google Scholar

Fujita, N., Jones, R., Öberg, S., and Briddon, P. (2009). Large spherical vacancy clusters in diamond – origin of the brown colouration? Diam. Relat. Mater. 18, 843–845. doi:10.1016/j.diamond.2008.10.061

CrossRef Full Text | Google Scholar

Garsi, M., Stöhr, R., Denisenko, A., Shagieva, F., Trautmann, N., Vogl, U., et al. (2024). Three-dimensional imaging of integrated-circuit activity using quantum defects in diamond. Phys. Rev. Appl. 21, 014055. doi:10.1103/PhysRevApplied.21.014055

CrossRef Full Text | Google Scholar

Gaukroger, M., Martineau, P., Crowder, M., Friel, I., Williams, S., and Twitchen, D. (2008). X-ray topography studies of dislocations in single crystal cvd diamond. Diam. Relat. Mater. 17, 262–269. doi:10.1016/j.diamond.2007.12.036

CrossRef Full Text | Google Scholar

Glazer, A., Lewis, J., and Kaminsky, W. (1996). An automatic optical imaging system for birefringent media. Proc. R. Soc. Lond. Ser. A Math. Phys. Eng. Sci. 452, 2751–2765. doi:10.1098/rspa.1996.0145

CrossRef Full Text | Google Scholar

Glenn, D. R., Fu, R. R., Kehayias, P., Le Sage, D., Lima, E. A., Weiss, B. P., et al. (2017). Micrometer-scale magnetic imaging of geological samples using a quantum diamond microscope. Geochem. Geophys. Geosyst. 18, 3254–3267. doi:10.1002/2017GC006946

CrossRef Full Text | Google Scholar

Glover, C., Newton, M. E., Martineau, P., Twitchen, D. J., and Baker, J. M. (2003). Hydrogen incorporation in diamond: the nitrogen-vacancy-hydrogen complex. Phys. Rev. Lett. 90, 185507. doi:10.1103/PhysRevLett.90.185507

PubMed Abstract | CrossRef Full Text | Google Scholar

Glover, C., Newton, M. E., Martineau, P. M., Quinn, S., and Twitchen, D. J. (2004). Hydrogen incorporation in diamond: the vacancy-hydrogen complex. Phys. Rev. Lett. 92, 135502. doi:10.1103/PhysRevLett.92.135502

PubMed Abstract | CrossRef Full Text | Google Scholar

Graziosi, T., Rathmill, A., Patel, R. L., Palmer, N., Edmonds, A. M., Markham, M. L., et al. (2023). Control of strain in thin diamond nitrogen-vacancy layers for magnetometry applications. Quantum sensing, imaging, and precision metrology. Editors J. Scheuer, and S. M. Shahriar (Bellingham, WA United States: International Society for Optics and Photonics (SPIE)), 12447. doi:10.1117/12.2649676

CrossRef Full Text | Google Scholar

Hart, C. A., Schloss, J. M., Turner, M. J., Scheidegger, P. J., Bauch, E., and Walsworth, R. L. (2021). N-V–diamond magnetic microscopy using a double quantum 4-ramsey protocol. Phys. Rev. Appl. 15, 044020. doi:10.1103/PhysRevApplied.15.044020

CrossRef Full Text | Google Scholar

Hartland, C. B. (2014). A study of point defects in CVD diamond using electron paramagnetic resonance and optical spectroscopy. Ph.D. thesis, Coventry, United Kingdom: University of Warwick.

Google Scholar

Hird, J. R., and Field, J. E. (2004). Diamond polishing. Proc. R. Soc. Lond. Ser. A Math. Phys. Eng. Sci. 460, 3547–3568. doi:10.1098/rspa.2004.1339

CrossRef Full Text | Google Scholar

Hounsome, L. S., Jones, R., Martineau, P. M., Fisher, D., Shaw, M. J., Briddon, P. R., et al. (2006). Origin of brown coloration in diamond. Phys. Rev. B 73, 125203–125208. doi:10.1103/PhysRevB.73.125203

CrossRef Full Text | Google Scholar

Kehayias, P., Turner, M. J., Trubko, R., Schloss, J. M., Hart, C. A., Wesson, M., et al. (2019). Imaging crystal stress in diamond using ensembles of nitrogen-vacancy centers. Phys. Rev. B 100, 174103. doi:10.1103/PhysRevB.100.174103

CrossRef Full Text | Google Scholar

Khan, R. U. A., Martineau, P. M., Cann, B. L., Newton, M. E., and Twitchen, D. J. (2009). Charge transfer effects, thermo- and photochromism in single crystal cvd synthetic diamond. J. Phys. Condens. Matter 21, 364214. doi:10.1088/0953-8984/21/36/364214

PubMed Abstract | CrossRef Full Text | Google Scholar

Khan, R., Martineau, P., Cann, B., Newton, M., Dhillon, H., and Twitchen, D. (2010). Color alterations in cvd synthetic diamond with heat and uv exposure: implications for color grading and identification. Gems & Gemology 46, 18–26. doi:10.5741/gems.46.1.18

CrossRef Full Text | Google Scholar

Ku, M. J., Zhou, T. X., Li, Q., Shin, Y. J., Shi, J. K., Burch, C., et al. (2020). Imaging viscous flow of the dirac fluid in graphene. Nature 583, 537–541. doi:10.1038/s41586-020-2507-2

PubMed Abstract | CrossRef Full Text | Google Scholar

Laissue, P. P., Alghamdi, R. A., Tomancak, P., Reynaud, E. G., and Shroff, H. (2017). Assessing phototoxicity in live fluorescence imaging. Nat. Methods 14, 657–661. doi:10.1038/nmeth.4344

PubMed Abstract | CrossRef Full Text | Google Scholar

Mamin, H., Sherwood, M., Kim, M., Rettner, C., Ohno, K., Awschalom, D., et al. (2014). Multipulse double-quantum magnetometry with near-surface nitrogen-vacancy centers. Phys. Rev. Lett. 113, 030803. doi:10.1103/PhysRevLett.113.030803

PubMed Abstract | CrossRef Full Text | Google Scholar

Manson, N., and Harrison, J. (2005). Photo-ionization of the nitrogen-vacancy center in diamond. Diam. Related Materials 14, 1705–1710. doi:10.1016/j.diamond.2005.06.027

CrossRef Full Text | Google Scholar

Martineau, P. M., Lawson, S. C., Taylor, A. J., Quinn, S. J., Evans, D. J. F., and Crowder, M. J. (2004). Identification of synthetic diamond grown using chemical vapor deposition (CVD). Gems. Gemmol. 40, 2–25. doi:10.5741/gems.40.1.2

CrossRef Full Text | Google Scholar

Przybylski, A., Thiel, B., Keller-Findeisen, J., Stock, B., and Bates, M. (2017). Gpufit: an open-source toolkit for gpu-accelerated curve fitting. Sci. Reports 7, 15722. doi:10.1038/s41598-017-15313-9

PubMed Abstract | CrossRef Full Text | Google Scholar

Roncaioli, C., Hart, C. A., Walsworth, R., and Fahey, D. P. (2024). All-in-one quantum diamond microscope for sensor characterization. AVS Quantum Sci. 6, 044403. doi:10.1116/5.0222809

CrossRef Full Text | Google Scholar

Rovny, J., Gopalakrishnan, S., Jayich, A. C. B., Maletinsky, P., Demler, E., and de Leon, N. P. (2024). Nanoscale diamond quantum sensors for many-body physics. Nat. Rev. Phys. 6, 753–768. doi:10.1038/s42254-024-00775-4

CrossRef Full Text | Google Scholar

Schirhagl, R., Chang, K., Loretz, M., and Degen, C. L. (2014). Nitrogen-vacancy centers in diamond: nanoscale sensors for physics and biology. Annu. Rev. Phys. Chem. 65, 83–105. doi:10.1146/annurev-physchem-040513-103659

PubMed Abstract | CrossRef Full Text | Google Scholar

Schloss, J. M. (2019). Optimizing nitrogen-vacancy diamond magnetic sensors and imagers for broadband sensitivity. Ph.D. thesis, Cambridge, MA United States: Massachusetts Institute of Technology.

Google Scholar

Schuelke, T., and Grotjohn, T. A. (2013). Diamond polishing. Diam. Relat. Mater. 32, 17–26. doi:10.1016/j.diamond.2012.11.007

CrossRef Full Text | Google Scholar

Turner, M. J., Langellier, N., Bainbridge, R., Walters, D., Meesala, S., Babinec, T. M., et al. (2020). Magnetic field fingerprinting of integrated-circuit activity with a quantum diamond microscope. Phys. Rev. Appl. 14, 014097. doi:10.1103/PhysRevApplied.14.014097

CrossRef Full Text | Google Scholar

Zhang, X.-Y., Wang, Y.-X., Tartaglia, T. A., Ding, T., Gray, M. J., Burch, K. S., et al. (2021). ac susceptometry of 2d van der waals magnets enabled by the coherent control of quantum sensors. PRX Quantum 2, 030352. doi:10.1103/PRXQuantum.2.030352

CrossRef Full Text | Google Scholar

Keywords: quantum sensing, nitrogen-vacancy (NV) centers, magnetic sensing, precision measurement, chemical vapor deposition (CVD)

Citation: Tang J, Roncaioli CA, Edmonds AM, Davidsson A, Hart CA, Markham ML and Walsworth RL (2025) Characterization of low-nitrogen quantum diamond for pulsed magnetometry applications. Front. Quantum Sci. Technol. 4:1701548. doi: 10.3389/frqst.2025.1701548

Received: 08 September 2025; Accepted: 24 November 2025;
Published: 09 December 2025.

Edited by:

Jean-Philippe Tetienne, RMIT University, Australia

Reviewed by:

Lillian B. Hughes, University of California-Santa Barbara, United States
Michal Kern, University of Stuttgart, Germany

Copyright © 2025 Tang, Roncaioli, Edmonds, Davidsson, Hart, Markham and Walsworth. This is an open-access article distributed under the terms of the Creative Commons Attribution License (CC BY). The use, distribution or reproduction in other forums is permitted, provided the original author(s) and the copyright owner(s) are credited and that the original publication in this journal is cited, in accordance with accepted academic practice. No use, distribution or reproduction is permitted which does not comply with these terms.

*Correspondence: Ronald L. Walsworth, d2Fsc3dvcnRoQHVtZC5lZHU=

Disclaimer: All claims expressed in this article are solely those of the authors and do not necessarily represent those of their affiliated organizations, or those of the publisher, the editors and the reviewers. Any product that may be evaluated in this article or claim that may be made by its manufacturer is not guaranteed or endorsed by the publisher.