 Yoshitada Katagiri
 Hiromi Ozaku2
- 1Department of Bioengineering, School of Engineering, The University of Tokyo, Tokyo, Japan
- 2Department of Rehabilitation Science, Kobe University Graduate School of Health Sciences, Kobe, Japan
- 3Mitou Medical and Science Foundation, Tokyo, Japan
Introduction: Continuous glucose monitoring is essential for the management of patients with metabolic syndromes in their daily lives. However, how metabolic risks are accessed using time-series glucose excursion data for healthy individuals remains unclear.
Methods: Thus, this study aimed to present a method for evaluating the risks of glucose dysregulation by analyzing glucose responses under reduced glycemic load using a phytochemical alpha-glucosidase inhibitor. A 14-day pilot trial with healthy adult participants was conducted to demonstrate the validity of the method.
Results and Discussion: The results showed that ultradian glucose spike packets with lower heights dominantly appeared under reduced glycemic load, replacing postprandial single-lobe glucose spikes with higher heights. Furthermore, the frequency dominance of ultradian spike packets contributed to the reduction of overall mean glucose excursions during the test period under reduced glycemic load. Based on the time-delay model, it was indicated that glycemic load reduction recovers regular glucose–insulin coupling accompanying ultradian oscillations, thereby contributing to the maintenance of glucose homeostasis. The findings of this study indicate that the frequency ratio between pulsatile spike packets and single-lobe spikes could be a marker for evaluating glucose regulation/dysregulation in healthy adults.
1 Introduction
Recently, wearable continuous glucose monitoring (CGM) systems have become widespread (Villena Gonzales et al., 2019; Zafar et al., 2022). Their validity has been demonstrated in individuals with diabetes mellitus who need optimal glycemic control (Langendam et al., 2012; Chan, 2017; Lawton et al., 2018; Cappon et al., 2019). The benefits of using CGM systems are not limited to the clinical field. Recently, great interest has been focused on the daily use of CGM systems by healthy individuals. This is due to their potential benefits in maintaining their physiological states via optimal control of diets and sleep, not only for the management of personalized health but also for achieving the best performance in sports (Jospe et al., 2020; Holzer et al., 2022; Keshet et al., 2023; Klupa et al., 2023; Wang et al., 2023; Freckmann et al., 2024).
CGM systems can provide consecutive time-series data on glucose excursions during daily life. Such data, even acquired in a limited short term, involve beneficial information such as postprandial hyperglycemia and subsequent reactive hypoglycemia (Zecchin et al., 2016; Freckmann et al., 2018; Yu et al., 2019). This advantage compensates for traditional pinpoint glycemic tests, including the oral glucose tolerance test (OGTT). CGM systems can provide versatile information involving neurophysiological activities that are not limited to conventional dietary glucose responses. A key to using the original features of CGM systems is to assess the time-series data. Notably, the criteria for evaluating the extent of dysregulation of glucose metabolism in individuals without diabetes mellitus remain unclear due to insufficient data for such healthy individuals with potential metabolic risks. Some attempts have been made referring to the diagnostic criteria for diabetes mellitus, which potentially leads CGM users to suboptimal behaviors, including unnecessary dietary restriction with a risk of undernutrition (Guess, 2023).
Therefore, a machine learning (ML)-based approach has been developed to extract abnormal patterns of glucose responses during daily life (Seo et al., 2019; Woldaregay et al., 2019; Mujahid et al., 2021; Alhaddad et al., 2022). This approach is advantageous for extracting useful information from large-scale data, although the underlying physiological mechanisms remain unclear. However, the ML-based approach has a limitation in that the machines cannot explain causal associations in their answers. This may become problematic if the answers are ineffective. Thus, explainable artificial intelligence has attracted much attention to overcome this problem (Nor et al., 2021; Chaddad et al., 2023; Duckworth et al., 2024).
Another approach has been developed by postulating a simple hypothesis. A previous study proposed and demonstrated a method for detecting glucose dysfunction in healthy individuals by classifying three glucotypes (high, medium, and severe glucose-variability phenotypes). These types were successfully classified by analyzing consecutive glucose excursion data acquired in daily life using ML techniques, and the assessments were consistent with conventional glycemic tests such as OGTT (Hall et al., 2018). The validity of this method has been independently demonstrated in another previous study (Breschi et al., 2021).
In this study, we propose a more explainable method for evaluating the risk of individualized glycemic dysregulation in daily life via CGM measurements under reduced glycemic load conditions. We hypothesized that, with a reduction in glycemic load, glycemic dysfunction would be readily recovered for lower-risk individuals, whereas dysregulation would remain for higher-risk individuals. This method evaluates the characteristic glucose dynamics associated with glycemic regulation/dysregulation to identify higher-risk individuals. Figure 1 shows the concept of the proposed method.
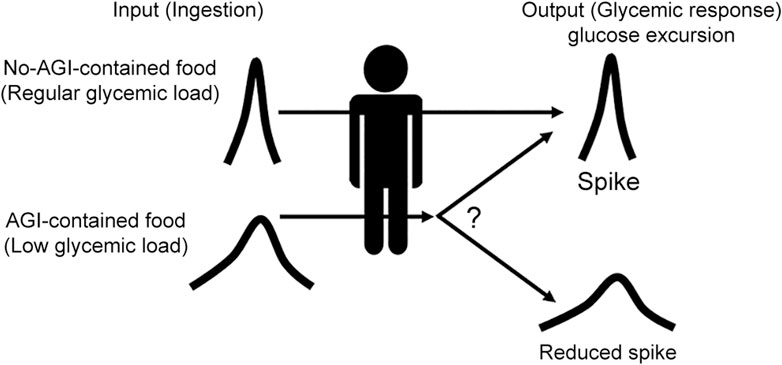
Figure 1. Concept of our proposal. How glycemic responses differ when the glycemic load is reduced was examined. AGI-containing supplemental foods were used to reduce the glycemic load via the effect of AGI, which slows down the absorption rate of glucose in the small intestine.
This study aimed to demonstrate the validity of the proposed method by conducting a 14-day pilot trial with healthy young and middle-aged healthy adult participants. For this purpose, we prepared small supplemental foods containing an alpha-glucosidase inhibitor (AGI) to generate low-glycemic load conditions. AGI has been reported to moderate glucose absorption in the small intestine by inhibiting alpha-glucosidase, which is involved in the breakdown of polysaccharides (like maltose) into glucose (Fang et al., 2017; Dong et al., 2021; Liu et al., 2021). Using such small supplemental foods is expected to help examine how dynamics are affected by glycemic load reduction from usual levels while maintaining usual diets and eating habits.
The characteristic glucose dynamics associated with glucose homeostasis and its disruption were extracted from the individualized time-series CGM data acquired over the three 14-day test periods. A model for explaining how our method can predict the potential risk of glycemic dysfunctions from the dynamic patterns of CGM traces in daily life was provided by correlating the data with clinical parameters.
2 Materials and methods
2.1 Ethics
Written informed consent was obtained from all participants before participation in this study. The study protocol was reviewed and approved by the Research Ethics Committee of the School of Engineering, The University of Tokyo (Approval No. KE22-34), and the Ethics Committee of the Kobe University Graduate School of Health Sciences (Approval No. 1124). Furthermore, the study protocol was officially registered with the UMIN Clinical Trials Registry (UMIN000051003) and is publicly accessible at https://www.umin.ac.jp/ctr/index.htm. All experiments were performed in accordance with the Declaration of Helsinki.
2.2 Participants
Healthy daytime workers aged 20–75 years with a high school graduate level in manufacturing companies were recruited by advertisement with a leaflet invitation to the study. The exclusion criteria included individuals who took medications acting on glucose metabolism, such as steroids, nonsteroidal antiinflammatory drugs, and antidiabetic drugs, those with HbA1c > 6.1% and body mass index >35 who needed treatment, and those who were at risk of subcutaneous bleeding by inserting a CGM sensor. Consequently, 17 participants (age: 45.8 ± 12.3 years), including 7 females, were included in this study.
2.3 Test-food preparation and overall experimental design
Salacia reticulata was used to prepare test foods containing AGI. Salacia reticulata involves salacinol as a phytochemical AGI, whose effect on reducing blood sugar has been demonstrated by many previous studies (Sim et al., 2010; Medagama, 2015; Morikawa et al., 2015; Stohs and Ray, 2015), including clinical trials with healthy/patient (mainly type 2 diabetes mellitus) participants (Collene et al., 2005; Heacock et al., 2005; Williams et al., 2007; Radha and Amrithaveni, 2009; Koteshwar et al., 2013; Kushwaha et al., 2016; Vyas et al., 2016). Baked confectioneries containing S. reticulata were provided as snack foods containing AGI (Test-food A). Furthermore, baked confectioneries without S. reticulata were provided as regular snack foods (Test-food B). Table 1 shows the specifications of the experimental test samples.
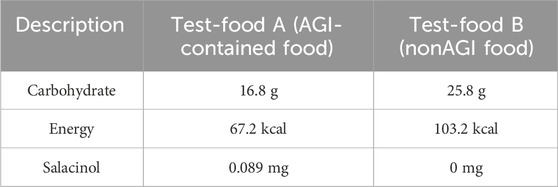
Table 1. Specifications of the foods used in the study represented by the content per ingestion.
A single-arm trial consisting of four study sessions was designed to test our proposal (Figure 2A). The first session (Session 1) was a 3-day nonintervention session, maintaining normal eating activities with unchanged diet quality. The second session (Session 2) was a 4-day regular snack session with Test-food B twice a day. The third session (Session 3) was a 4-day snack session with Test-food A. The fourth session (Session 4) was a 3-day session with Test-food A ingested with three meals.
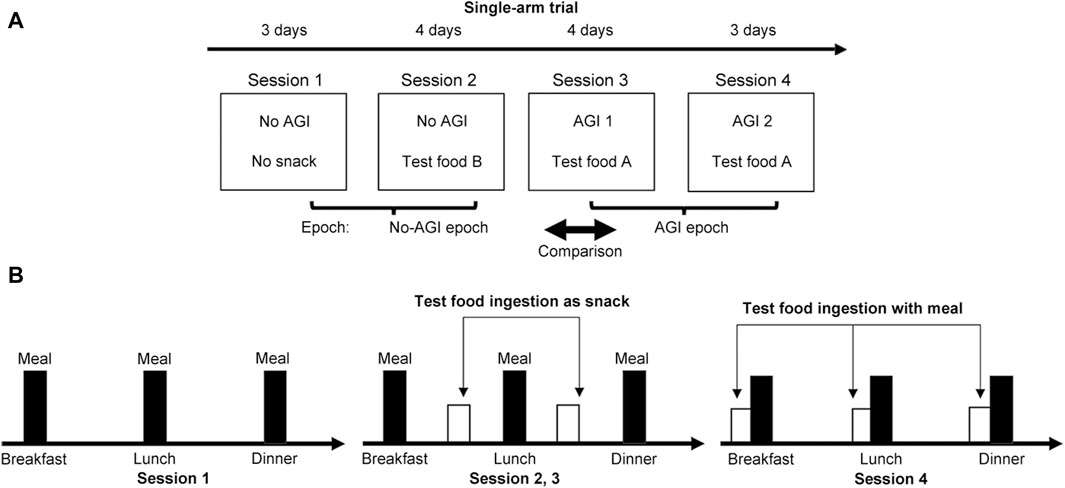
Figure 2. Summary of the methods used in this study. (A) A single-arm trial consisting of four sessions was designed to demonstrate the validity of our proposal. Glucose excursions were monitored using wearable CGM systems over the 14-day study period. (B) The dietary requirements imposed on participants during the study sessions.
The total test period was 14 days. The participants were asked to complete these sessions in accordance with the study instructions (Figure 2B). In Session 1, all participants were asked to eat their main meals three times a day while avoiding irregular snacking. In Session 2, participants were asked to consume interprandial Test-food B twice a day as a regular snack between breakfast and lunch and between lunch and dinner. In Session 3, participants were similarly asked to consume interprandial Test-food A as an AGI-containing snack food. Finally, in Session 4, participants were asked to take Test-food A with the three meals. Ingestion of any other snack food was strictly prohibited throughout the four sessions. Furthermore, the ingestion of any food containing corn syrup was strictly prohibited during the study period because syrup nullifies the effect of AGI.
Participants wore CGM sensors during the test period. The CGM data were analyzed afterward. The individual baseline was evaluated from the CGM data acquired in Sessions 1 and 2 with no foods containing AGI, considering the two possible eating habits with and without snacking in the usual life. In Session 3, Test-food A containing AGI was expected to reduce the glycemic load, thereby reducing glucose excursions. In Session 4, AGI was expected to exert more inhibitory effects on glucose excursions.
The effects of additional ingestion of test foods on individual glycemic regulation were evaluated to obtain reliable data. The additional energy by ingestion was 207 kcal at most per day (Table 2). This might affect the daily diet by an 8.7% increase at most. Furthermore, whether this energy increase by ingesting test foods could disturb glycemic regulation was examined by setting a checkpoint between Sessions 3 and 4. The test was continued with participants who showed no signs of glycemic dysfunction in Sessions 1 and 2 by checking their CGM data.

Table 2. Total ingestion amounts of components involved in the test food per day during each session epoch.
Participants were asked to maintain their food choices during the test sessions to eliminate health-conscious bias effects. Notably, participants were asked during the test period not to consume foods containing glucose syrup, which avoids the effect of AGI. Participants were also asked to keep their own time-stamped diet records during the study to confirm whether the experiments would be successfully completed with no health-conscious bias.
2.4 CGM measurement
To complete the test trial, we required a wearable CGM system that could operate continuously for 14 days. For this, we selected a commercially available CGM system (Freestyle Libre Pro, Abbot Diabetes Care Inc., United States, Japanese pharmaceutical approval: 22800BZX00227,000). This system consisted of a sensor attached to the upper arm. Plasma glucose levels translated from intercellular fluid were recorded every 15 min for 14 days. No data were missed as long as the CGM sensor was correctly attached (Tang et al., 2020). Although the sampling rate was fixed at 4 cycle/h (every 15 min), it provided sufficient data for the analysis of glucose excursions of >30 min (corresponding to 2 cycle/h) based on the conventional sampling theorem.
2.5 Data analysis
2.5.1 Net mean amplitude of glucose excursion (MAGE)
The MAGE is often used to numerically evaluate daily glucose excursions. The MAGE is the average of upward (MAGE+) and downward (MAGE−) excursions exceeding the standard deviation of glycemic excursion data over a day measured by CGM as follows:
The MAGE can be systemically derived from a series of peaks and nadir levels extracted from glycemic excursion profiles measured by CGM (Marling et al., 2011). Glycemic excursion fluctuations can be evaluated using the upper and lower envelopes of the excursion profiles. Therefore, net glycemic fluctuation amplitudes defined for each glycemic peak as
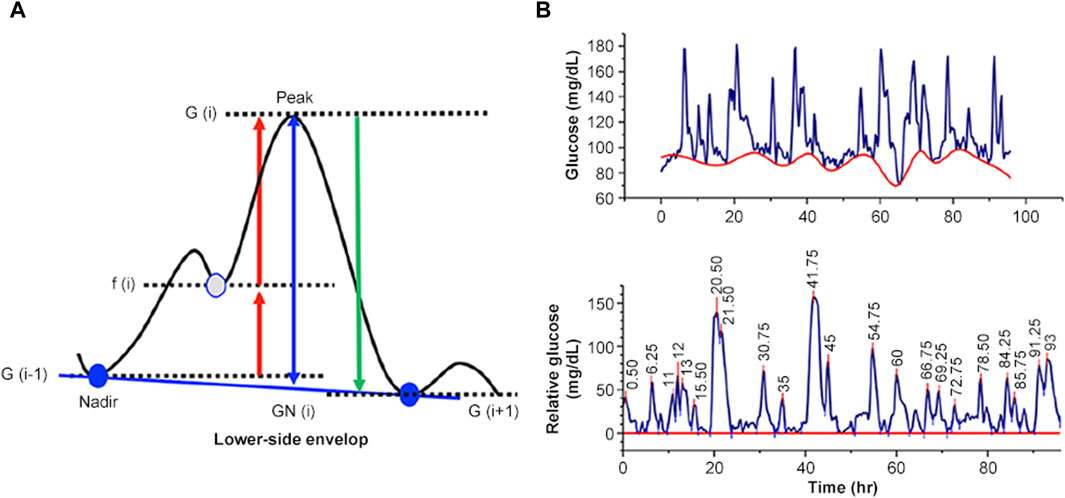
Figure 3. Numerical evaluation of net MAGE. (A) Principle of evaluation. (B) An example of evaluating net MAGE using a glucose excursion profile.
We evaluated individual net MAGE as a function of HbA1c. A regression analysis was conducted based on a conventional analysis of variance (ANOVA) to investigate whether these parameters were correlated. We then evaluated the individual basal net MAGE as a reflection of the measures in the daily lives of the participants, taking into account the net MAGE for Sessions 1 and 2 to minimize any confounding effect of snacking on glucose excursions. Using these individual basal net MAGE, we determined the difference between the relative net MAGE and the basal net MAGE for each session as △net MAGE. To simply evaluate the effect of AGI ingestion on net MAGE, we combined the data from Sessions 3 and 4 as the AGI-ingestion session and evaluated the session difference △net MAGE. The statistical significance was tested with a one-sample t-test. The △net MAGE was depicted as a function of HbA1c. A regression analysis based on ANOVA was performed.
2.5.2 Characterization of the postprandial glucose excursion pattern
In the current study, two types of postprandial glucose increase were observed: single-lobe spike (Figure 4A) and pulsatile glucose excursion (Figure 4B). Pulsatile excursion, which may be derived from a single-lobe glucose increase, was considered, and the pulsatile spike noted by P was counted while identifying the single-lobe glucose spike as S.
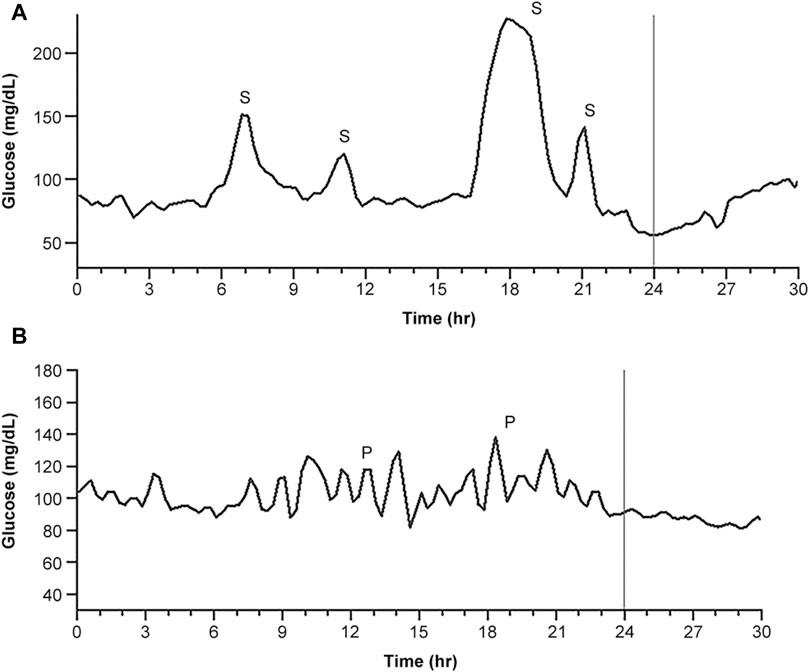
Figure 4. Typical daily CGM traces representing glucose spikes. (A) The trace dominantly provided postprandial single glucose spikes. (B) The trace dominantly provided postprandial pulsatile glucose excursions, which were presumed to be derived from a single glucose spike. S indicates a single-lobe glucose spike, and P indicates a pulsatile glucose spike packet.
All postprandial glucose excursions in the CGM traces for each session were classified. The ratio of the number of single-lobe and pulsatile spikes (PSR) emerging in each session was defined as follows:
The PSR for the session with no AGI was defined as PSR1, and that for the session with AGI was defined as PSR2. Furthermore, a ratio γ was defined as follows:
Because the PSR increases, the pulsatile spikes become more dominant. The ratio γ indicates the effect of AGI on the promotion of pulsatile spikes while suppressing single-lobe spikes.
Here, the PSR evaluation was performed by visual inspection VI), with single-lobe spikes identified as isolated large peaks and pulsatile spikes identified as a series of periodic small peaks. To avoid the risk of discrimination errors due to observer bias inherent in this VI method, we used signal detection theory (SDT) to determine the validity of the method. SDT provides a numerical framework for evaluating the detection of signals as distinct from noise (Decarlo, 2020) while separately assessing any cognitive bias of observers (Jayakumar and Simpson, 2020; Locke and Robinson, 2021). While these spikes were readily distinguishable by their typical waveforms, there were also undeterminable spikes that reduced the distance between the two populations and degraded their distinguishability. SDT can separate undeterminable spikes to evaluate the net distinguishability.
As shown in Figure 5A, we assumed two Gaussian populations corresponding to the pulsatile and single-lobe spikes as a function of the VI-based discrimination criteria. According to the SDT framework, we introduce four judgment categories. These were hit H), miss M), correct rejection (CR), and false alarm (FA). Hs and CRs could be attributed to the reliable detection of the pulsatile and single-lobe spikes, respectively, and corresponded to each nonoverlapping portion of the population curve (in the figure, blue represents pulsatile spikes and red, single-lobe spike). In contrast, the Ms and FAs attributed to the undeterminable spikes corresponded to the overlapping portions.
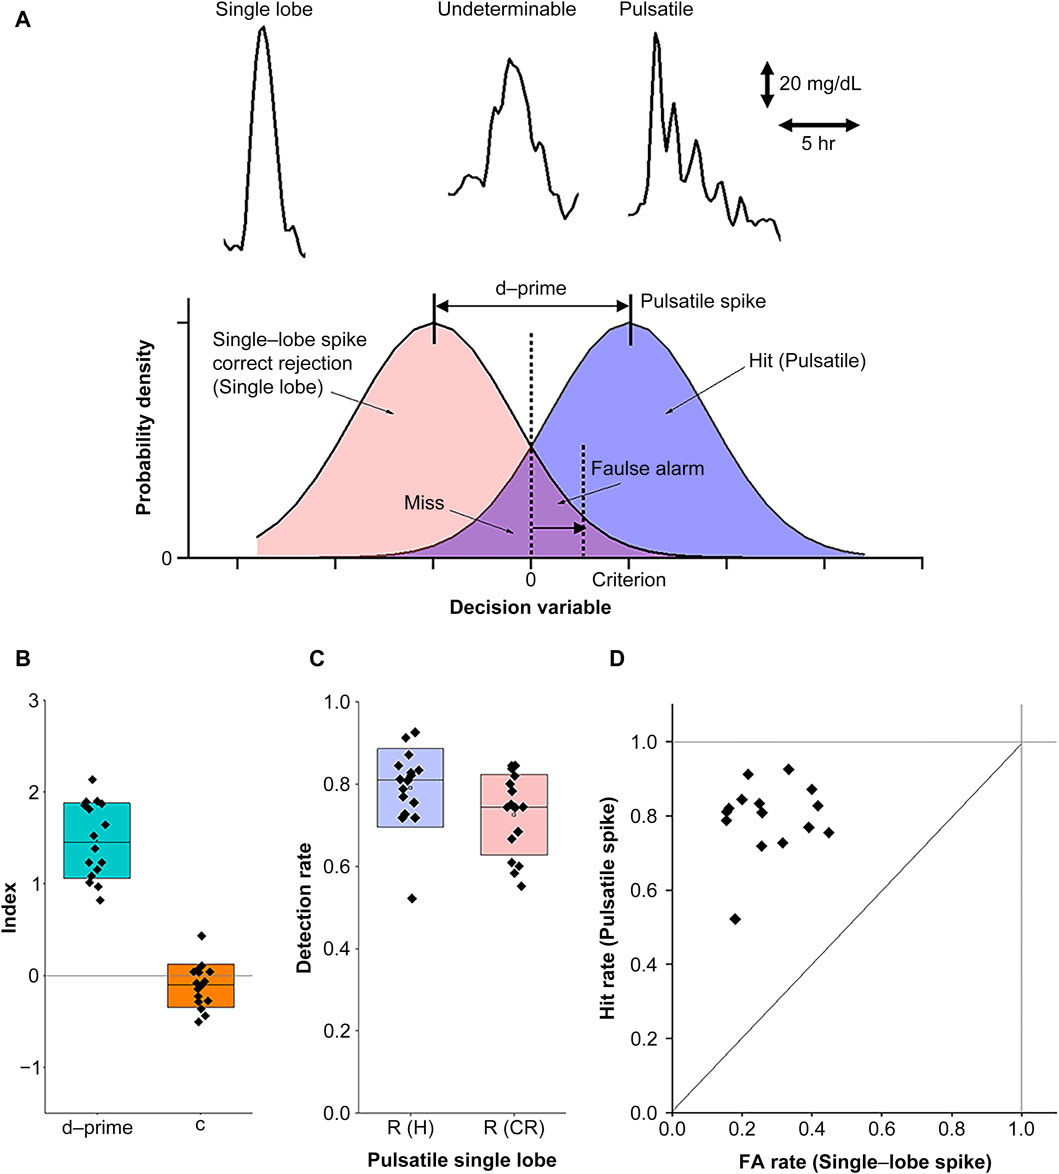
Figure 5. Numerical evaluation of PSR using the visual inspection (VI) method. (A) The signal detection theory (SDT) principles for evaluating the reliability of the VI method. The upper panel provides examples of typical CGM waveforms corresponding to single-lobe (left), pulsatile (right), and undeterminable (middle) spikes. The lower panel represents the use of probability distribution functions in SDT for the detection of pulsatile and single-lobe spikes as a function of the discrimination criteria of observers. (B) Index plots with box charts representing the means and standard deviations for the total detectability data (d-prime) and criterion (c). (C) Net detection rates of the pulsatile and single-lobe spikes after eliminating the undeterminable spikes. (D) The receiver operating characteristic (ROC) curve for the d-prime and criterion values as depicted in (B).
The distance between the two populations, defined as d-prime, represented distinguishability, and the criteria set the threshold to determine whether the spikes belonged to the pulsatile or single-lobe group. As d-prime increased, its distinguishability improved. Criterion (
where Z represents the normal inverse cumulative distribution function.
We further checked d-prime and the criteria for all the data acquired in the current study. Since the Ms and FAs for the underminable spikes were not dissociable, we evaluated R (FA) using half of the underminable spike number for convenience, assuming no significant differences between the pulsatile and single-lobe populations. As shown in Figure 5B, we confirmed that d-prime differed significantly from the zero level (averaged d-prime = 1.47, SD = 0.40, p = 3.6E-10, power = 1), suggesting that the VI method can provide fair distinguishability. In contrast, the slightly negative criterion (c = −0.11, SD = 0.23) did not reach statistical significance (p = 0.077, power = 0.43), suggesting sufficient neutrality to exclude the possibility of observer bias. With this VI method, we achieved sufficient detectability in both pulsatile (0.79 ± 0.095(SD)) and single-lobe spikes (0.73 ± 0.098 (SD)) for PSR evaluation (Figure 5C). Finally, we evaluated the receiver operating characteristic (ROC) curve (Figure 5D) to ensure that the IV-based discrimination was conducted according to the criterion while minimizing chance judgments. Taken together, these evaluations confirmed that the detection ratios obtained via the VI method were a reliable measure of PSR as
2.5.3 Evaluation of the periodicity of pulsatile spikes
The CGM traces were analyzed to evaluate the net MAGE through every glycemic peak on the traces as
2.5.4 Statistics
Differences in net MAGE between the groups were statistically evaluated using one-way repeated measures analysis of variance (ANOVA). Correlations between two parameters were evaluated by regression analysis using Pearson’s correlation coefficient r) and F and p-values based on ANOVA. A p-value <0.05 indicated statistical significance. All statistical analyses were performed using OriginPro 2021b (OriginLab Corporation, Northampton, MA, United States).
3 Results
3.1 Individualized AGI effects on glucose excursions
Although AGI ingestion overall reduced the glucose excursion, some participants showed large glucose excursions despite AGI ingestion (Figure 6A). Thus, the correlation between glucose excursion and HbA1c as a clinical parameter was investigated to clarify this individual difference (Figure 6B). A significant positive correlation was observed for nonAGI-ingestion sessions (r = 0.71, F = 14.5, p = 0.0019) and AGI-ingestion sessions (r = 0.76, F = 17.6, p = 0.0011). The correlation in the AGI session provided lower glucose excursions than that in the nonAGI-ingestion session. This indicates that AGI ingestion was generally effective for reducing glucose excursions independently of HbA1c, although glucose excursion increased with HbA1c.
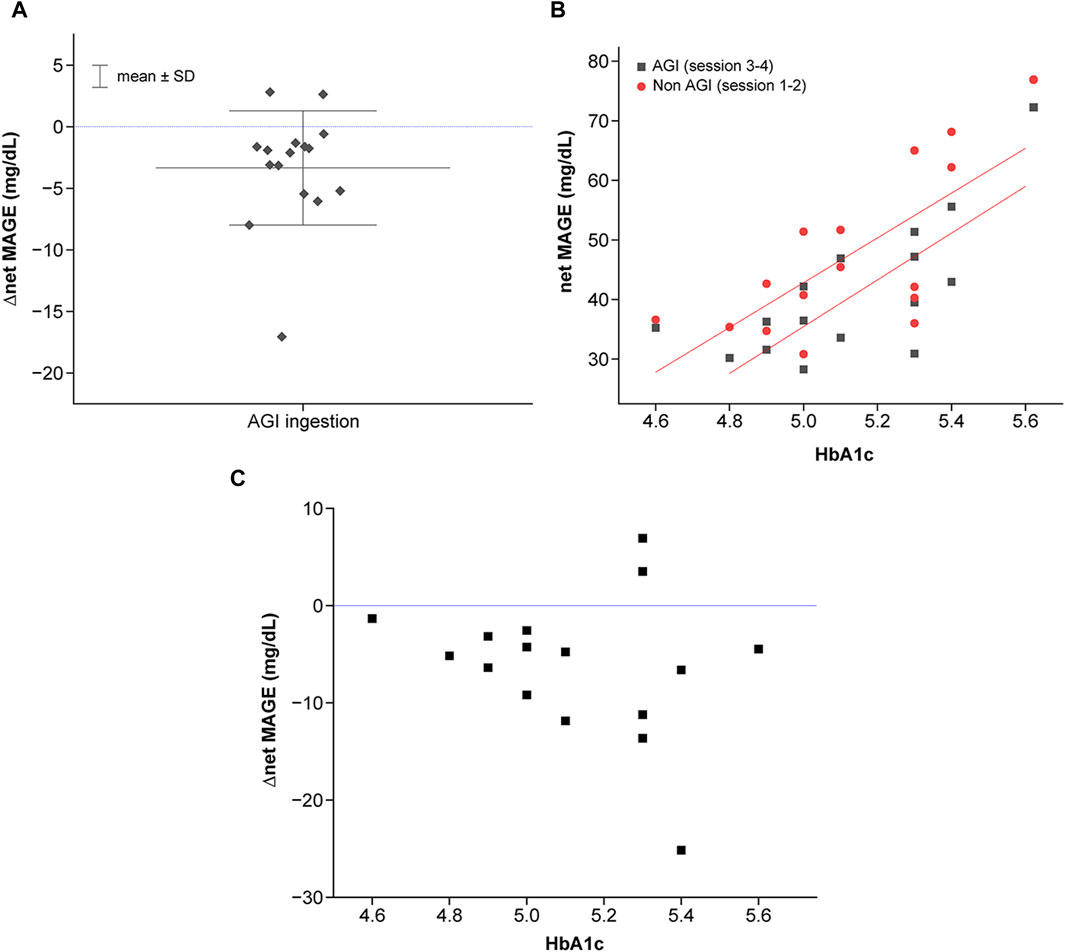
Figure 6. Characterization of individualized net MAGE. (A) Correlation between net MAGE and HbA1c in the nonAGI (represented by red color) and AGI (represented by block color) sessions. Statistically significant correlations were observed (AGI-ingestion session: r = 0.71, F = 14.5, p = 0.0019; AGI-ingestion session, r = 0.76, F = 17.6, p = 0.0011). (B) Individual differences in the effects of AGI on the reduction of glucose excursions. △net MAGE was calculated based on the average net MAGE in the nonAGI-ingestion session. (C) Individual differences in AGI effects (represented by △net MAGE between AGI-ingestion and nonAGI-ingestion sessions) as a function of HbA1c.
However, the efficiency of glucose excursion reduction differed. The efficiency, evaluated by △net MAGE between the nonAGI-ingestion and AGI-ingestion sessions, showed severe individual variance for higher HbA1c levels, whereas the efficiency tended to increase with increasing HbA1c levels (Figure 6C). The variance was attributed to individuals who deviated from the tendency, some of whom ruled out AGI effects. Hence, glucose responses for individuals with higher HbA1c levels should be considered by considering two glucose response types (higher and lower sensitivities to AGI).
3.2 Temporal features of postprandial glucose responses
As described in the Methods section, two postprandial glucose response patterns, i.e., single-lobe and pulsatile spikes were observed. Both of these two types appeared in almost all CGM traces across all participants. The frequencies of the single-lobe spike and pulsatile spike packet differed with the conditions (nonAGI ingestion or AGI ingestion) and individuals. The PSR was used to examine the differences arising from the conditions and individuals.
A significant negative correlation was observed between the individualized frequency ratio and HbA1c levels for both the nonAGI-ingestion session (r = −0.65, F = 10.7, p = 0.0055) and AGI-ingestion sessions (r = −0.61, F = 7.58, p = 0.016) (Figure 7A). These findings indicate that the frequency dominance of the pulsatile spike packets decreased with increasing HbA1c levels, and the frequency dominance of the single-lobe spikes increased with increasing HbA1c levels. Despite such HbA1c dependence, the PSR for the AGI-ingestion condition always exceeded that for the nonAGI-ingestion condition, indicating the inhibitory effect of AGI on glucose excursions independently of HbA1c.
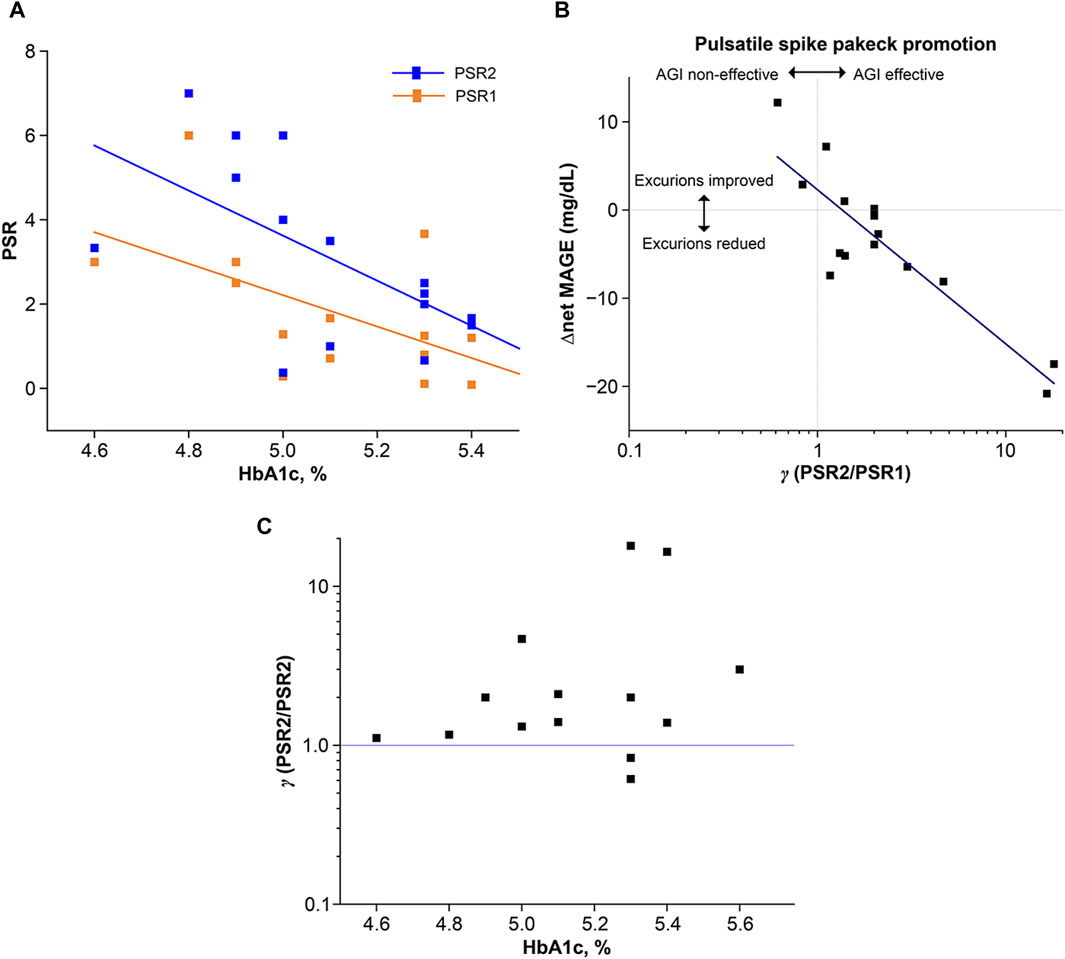
Figure 7. Characterization of postprandial glucose excursions using two typical glucose response types: single-lobe spike and pulsatile spike packet. The appearance frequency was numerically evaluated using the PSR, which was defined as the number of the types,
Because AGI ingestion had an impact on the reduction of glucose excursions and the increase of the frequency dominance of the pulsatile spike packets, the correlation between △net MAGE and γ (=PSR2/PSR2) was examined (Figure 7B), with γ representing the AGI effect on improving the frequency of pulsatile spike packets while suppressing the frequency of single-lobe spikes. A significant negative correlation was observed between △net MAGE and
Interestingly, γ tended to increase with increasing HbA1c levels while exhibiting a large variance for higher HbA1c levels. Furthermore, the two variant cases providing γ < 1 corresponded to the two variant cases providing △net MAGE >0 in the AGI-ingestion session. The tendency of increasing γ with increasing HbA1c levels and the negative correlation between PSR and increasing HbA1c levels appeared to be discrepant. However, upon visual inspection of all the CGM traces, the pulsatile spike packets were highly frequent for lower HbA1c levels independently of AGI ingestion, indicating that AGI did not contribute to suppressing the small-number single-lobe spikes in the AGI-ingestion session. In contrast, AGI effectively suppressed large-number single-lobe spikes in individuals with high HbA1c levels.
3.3 Periodicity analysis of the pulsatile glucose excursion
Pulsatile spike packets as a type of postprandial glucose response were observed. Furthermore, pulsatile glucose excursions not limited to postprandial responses were observed. Hence, the pulsatile glucose excursions that appeared during the entire session periods in the frequency domain were characterized. Thus, the distributions of peak-to-peak intervals of glucose excursions were examined.
Figure 5 shows the individualized KDE curves derived from the histograms of the intervals where the bin was set at 0.2 h. The participants provided similar KDE curves with peak intervals around 1.5 h, except for individuals who provided longer intervals beyond 2 h (Figure 8A). These longer intervals were attributed to the meal–meal interval, not pulsatile glucose oscillations. The correlation between individual intervals and HbA1c levels was investigated (Figure 8B). A significant negative correlation was observed (r = 0.53, F = 5.6, p = 0.033).
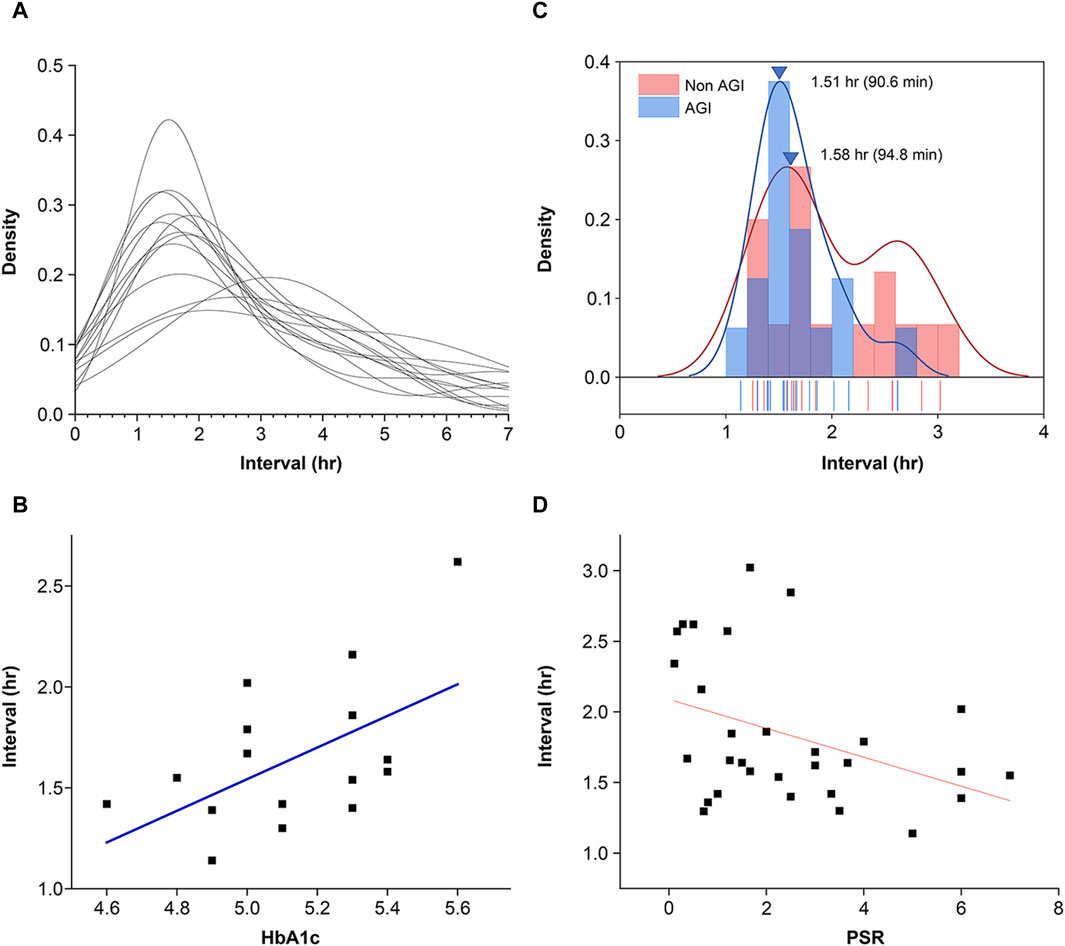
Figure 8. Features of pulsatile glucose excursions in the frequency domain. (A) Distribution of peak-to-peak intervals of glucose excursions provided by time-series CGM data. The distribution curves were produced using the kernel density evaluation (KDE) method. (B) Individual differences in peak interval versus HbA1c. Pearson’s correlation coefficient r = 0.53, F = 5.7, p = 0.033. Conventional statistical analysis of the intervals provided mean = 1.65 h (98 min) and SD = 0.38 h (23 min). (C) Distribution of individualized peak intervals of pulsatile glucose excursions. Although the intervals were widely distributed for the nonAGI condition, the interval distribution was reduced. The mean peak interval for the AGI-ingestion condition was significantly smaller than that for the nonAGI condition. (D) Intervals of pulsatile glucose excursions were negatively correlated with the frequency dominance of pulsatile spike packets replacing single-lobe glucose spikes. Pearson’s correlation coefficient r = −0.39 reached statistical significance (F = 5.1, p = 0.031). Intervals beyond 2.75 h were excluded because they were regarded as meal–meal or meal–snack intervals.
Glycemic load reduction by AGI ingestion was expected to shorten the intervals of pulsatile glucose spike packets. The individualized mean intervals were widely distributed for the nonAGI-ingestion condition, and the interval distributions were considerably reduced (Figure 8C). However, no significant difference in the peak interval was observed between the nonAGI- and AGI-ingestion conditions, whereas the mean interval for the AGI-ingestion condition was slightly smaller than that for the nonAGI condition. Furthermore, how the frequency dominance of the pulsatile glucose spike packets affected the pulse intervals was examined. The pulse intervals were negatively correlated with the frequency dominance of the pulsatile glucose spike packets (r = −0.39, F = 5.1, p = 0.031) (Figure 8D).
4 Discussion
This study demonstrated the validity of our proposed method for evaluating glucose dysregulation by CGM during a short-term test period under reduced glycemic load. The results showed that postprandial glucose excursions were divided into two types: single-lobe spike and pulsatile spike packet. The pulsatile spike packets exhibited ultradian rhythms with a mean of 98 min. Furthermore, such ultradian glucose oscillations were observed throughout the day and were not limited to postprandial glucose responses. These results showed that the observed ultradian glucose excursions, including the spike packets, could be attributed to pulsatile insulin secretion.
Many studies have revealed that insulin secretion is pulsed in two dissociable modes (Sonnenberg et al., 1992; Sturis et al., 1993). One is a fast mode with a period ranging from 5 to 15 min (Lang et al., 1979; Pørksen et al., 2002; Hollingdal et al., 2005; Pedersen et al., 2005; Schmitz et al., 2008), and the other is a slow mode with an ultradian period ranging from 50 to 150 min (Simon et al., 1987; Sturis et al., 1995; Simon, 1998; Simon and Brandenberger, 2002). These two insulin secretion modes arise from different mechanisms. The fast mode is attributed to intracellular coherent cooperation via tight junctions (Dyachok et al., 2008; Dhumpa et al., 2014; McKenna et al., 2016; Ng et al., 2021), whereas the slow mode is attributed to the glucose–insulin negative feedback system for maximizing glucose utilization (Sturis et al., 1991; Bruce et al., 2022). Because glucose and insulin are tightly coupled by this negative feedback loop, the glucose excursion reflects the ultradian insulin rhythms. Thus, the ultradian pulsatile glucose excursions, including postprandial spike packets, were thought to be caused by the above tight glucose–insulin coupling.
Ultradian pulsatile glucose excursions, including spike packets, exhibited frequency dominance by AGI ingestion while replacing single-lobe spikes. Since AGI reduces glycemic load, the frequency dominance of pulsatile glucose excursions could be attributed to this glycemic load reduction. However, the mechanism by which glycemic load reduction contributes to promoting ultradian pulsatile glucose excursions remains unclear. This may be attributed to the time-delay model (Li et al., 2006).
The model suggests that a large time difference between glucose and insulin generates large glucose spikes, whereas a small difference generates ultradian pulsatile glucose excursions via glucose–insulin coupling based on their native feedback loop (Figure 9A). Thus, we considered that AGI reduced the difference by reducing the glucose absorption rate, thereby achieving glucose–insulin coupling accompanied by ultradian glucose excursions (Figure 9B).
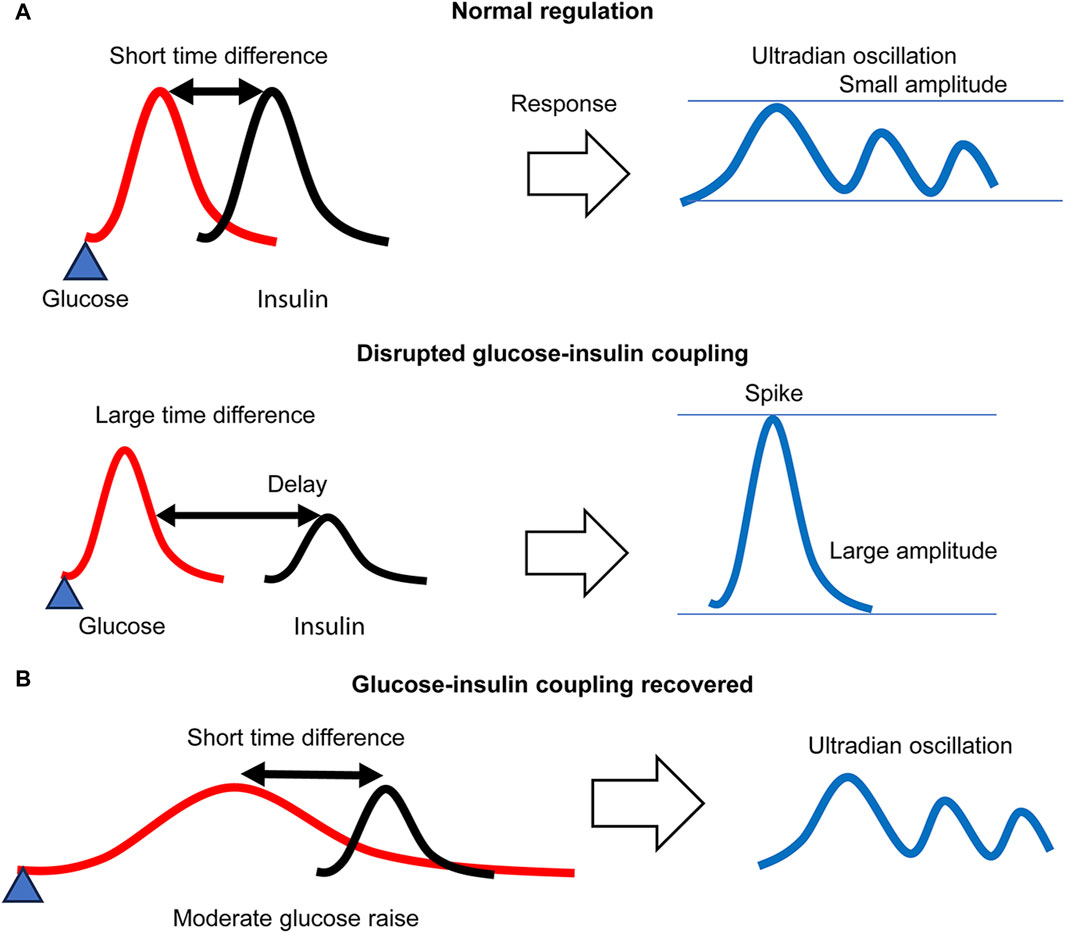
Figure 9. A glucose–insulin coupling model. (A) Under regular glycemic load, a small time difference between glucose and insulin forms an ultradian glucose–insulin coupling mode, whereas a large difference due to delayed insulin secretion disrupts glucose–insulin coupling, resulting in large spike generation. (B) Under reduced glycemic load, the time difference is effectively reduced, and the ultradian glucose–insulin coupling mode is recovered even for delayed insulin secretion. The glucose response necessarily exhibits ultradian oscillation.
Many studies have shown that pulsatile insulin secretion not only in the fast mode (Pørksen, 2002; Pørksen et al., 2002; Satin et al., 2015; Lee et al., 2017; Laurenti et al., 2021) but also in the slow mode (O’Meara et al., 1993; Simon et al., 1994) is beneficial for maintaining glucose homeostasis. The finding of this study that frequency dominance of the pulsatile glucose spike packets contributed to reducing overall glucose excursions throughout the day by AGI ingestion may be involved in such benefits. Therefore, the PSR, defined by the number of pulsatile spike packets and single-lobe glucose spikes, could be a key parameter for evaluating the risks of glycemic dysregulation.
The purpose of our proposed method was to provide personalized risk assessments of glucose dysregulation for non-DM patients beyond the limitations of conventional clinical diagnostic criteria. This aim was in line with that of the previous studies in which the concept of glucotypes was presented (Hall et al., 2018; Breschi et al., 2021). These studies argue for the validity of using the glucotypes for such personal assessments and consider whether glucotype classification is more informative than average glucose levels (Hulman et al., 2021).
Our finding that net MAGE is positively correlated with HbA1c is not very informative. However, we also found that the appearance ratio for pulsatile versus single-lobe spikes exhibited large variability at the higher end of the HbA1c range, suggesting that the ratio may reflect glucose dysregulation levels. Furthermore, the ratio was greatly improved in those with higher HbA1c by glycemic load reduction via AGI ingestion. This indicates that individual glucose responses may be dynamic and change in accordance with glycemic load. As such, it may provide a more useful measure than HbA1c. This finding in the present study diverges most from the focus of previous glucotype research.
The proposed method has some limitations. One is highlighted by the existence of individuals showing null effects of AGI on reducing their glucose excursions. Causes of elevated glucose levels include stress hormones associated with not only insulin-dependent endocrine systems but also the central nervous system, such as cortisol (Ortiz et al., 2019; Bentele et al., 2021; Ouyang et al., 2022). Further studies are needed to explore the mechanism by which glycemic dysregulation occurs in such individuals. Another limitation is highlighted by the validity of AGI in reducing the glycemic load. The results showed that the period of ultradian excursions increased with increasing HbA1c levels, suggesting that the AGI effect diminished with increasing HbA1c levels. This is explainable by the fact that an increase in HbA1c levels reflects the risk of glucose dysregulation that may obstruct glucose–insulin coupling. Nevertheless, some individuals with even higher HbAc1 levels improved ultradian glucose excursions by AGI, suggesting that AGI is expected to recover degraded glucose–insulin coupling for higher HbA1c levels. However, in this study, the maximum HbA1c level of the participants was 5.6%, which was within the normal range (4.6–6.0%). Further studies with individuals with much higher HbA1c levels (5.8–6.4%) are needed.
Another limitation was that we did not measure insulin and glucose simultaneously. Insulin resistance is a crucial risk factor for diabetes mellitus (DM). Hyperinsulinemia is a marker for metabolic dysfunctions, including insulin resistance (Ward et al., 1990; Dankner et al., 2009; Thomas et al., 2019), suggesting that hyperinsulinemia may be placed upstream of insulin resistance (Janssen, 2021). Thus, the progression of metabolic dysfunction can be evaluated by monitoring both insulin and glucose, which is why simultaneous insulin-glucose measurement is of great importance and provides greater benefits not only for DM patients but also those in the preclinical stages of DM (Meigs et al., 2020). Future studies should address this issue further, and this will be aided by the ongoing development of wearable insulin monitoring devices (Sabu et al., 2019; Liu et al., 2022; Psoma and Kanthou, 2023).
An issue we have not clarified in this study is the mechanism by which glycemic load reduction causes ultradian pulsatile glucose excursions. Recent research suggests that insulin oscillations regulate cellular energy metabolism via the AKT-insulin pathway in the frequency domain (Kubota et al., 2012; Purvis and Lahav, 2012; Kubota et al., 2018). Whether ultradian oscillations can be explained by such molecular mechanisms must be determined by future studies.
In conclusion, this study provides a simple method for evaluating the risks of glucose dysregulation from time-series data acquired by a wearable CGM system. This method analyzes data obtained during regular daily life while ingesting supplemental foods containing AGI to reduce the overall dietary glycemic load. The results showed that AGI effects on daily glucose excursions provided frequency-dominant pulsatile glucose spike packets with lower peaks, replacing single-lobe spikes with higher peaks. The analysis of the glucose excursion data in the frequency domain revealed that the pulsatile glucose spike packets were involved in ultradian glucose oscillation, which is an index to show the health of glucose–insulin homeostasis. The proposed method evaluates how glucose dysregulation is recovered by reducing the glycemic load during daily life. This method provides information that is much different from that of traditional tests conducted under higher glycemic load, compensating for them.
Many studies have used wearable CGM sensors to examine glucose excursions in the daily lives of healthy individuals and determine their potential as a tool with which to evaluate the risk of type-2 DM. However, these studies have only evaluated postprandial glucose excursions, and the data obtained is discussed in terms of the standard features of a conventional glucose–insulin response. Consequently, personal assessments tend to be based on the criteria used for diagnosis (Stefan et al., 2015; Taylor et al., 2019; Nguyen et al., 2020; Bermingham et al., 2023).
In contrast, our method of evaluating glucose excursions in relation to ultradian rhythms enables a more precise investigation of individual glucose dysregulation away from homeostasis (Asher and Zhu, 2023). There is growing evidence that glucose homeostasis is regulated not only by the simple glucose–insulin axis but also by complex nonlinear systems that respond to a wide variety of factors, including neurophysiological (Singh et al., 2018; Yaribeygi et al., 2022), genetic (Partch et al., 2014; El-Athman et al., 2019; Bonnefond and Semple, 2022), and epigenetic (Zheng et al., 2015; Maude et al., 2021; Wu et al., 2023) variables, as well as neurotransmitters such as serotonin (Paulmann et al., 2009; Ohara-Imaizumi et al., 2013). This study has highlighted the importance of developing a precise and individualized medical approach to DM (Chung et al., 2020; Franceschi, 2022). We hope that our method will contribute to this.
Data availability statement
The raw data supporting the conclusion of this article will be made available by the authors, without undue reservation.
Ethics statement
The studies involving humans were approved by the study protocol was reviewed and approved by the Research Ethics Committee of the School of Engineering, The University of Tokyo (Approval No. KE22-34), and the Ethics Committee of the Kobe University Graduate School of Health Sciences (Approval No. 1124). The studies were conducted in accordance with the local legislation and institutional requirements. The participants provided their written informed consent to participate in this study.
Author contributions
YK: Writing–original draft, Writing–review and editing. HO: Writing–review and editing. KK: Writing–review and editing.
Funding
The author(s) declare financial support was received for the research, authorship, and/or publication of this article. This study was funded by the Japan Society for the Promotion of Science (Grant Number: 22K04613).
Acknowledgments
The authors would like to thank Shin Surai and Shuken Uno for their technical support and Jun Nakagome of the Department of Bioengineering, The University of Tokyo, for providing technical support. The authors are also grateful to Professor Ungil Chung of the Department of Bioengineering, The University of Tokyo, for his insightful advice and encouragement.
Conflict of interest
The authors declare that the research was conducted in the absence of any commercial or financial relationships that could be construed as a potential conflict of interest.
Publisher’s note
All claims expressed in this article are solely those of the authors and do not necessarily represent those of their affiliated organizations, or those of the publisher, the editors and the reviewers. Any product that may be evaluated in this article, or claim that may be made by its manufacturer, is not guaranteed or endorsed by the publisher.
References
Alhaddad, A. Y., Aly, H., Gad, H., Al-Ali, A., Sadasivuni, K. K., Cabibihan, J. J., et al. (2022). Sense and learn: recent advances in wearable sensing and machine learning for blood glucose monitoring and trend-detection. Front. Bioeng. Biotechnol. 10, 876672. doi:10.3389/fbioe.2022.876672
Asher, G., and Zhu, B. (2023). Beyond circadian rhythms: emerging roles of ultradian rhythms in control of liver functions. Hepatology 77 (3), 1022–1035. doi:10.1002/hep.32580
Bentele, U. U., Meier, M., Benz, A. B. E., Denk, B. F., Dimitroff, S. J., Pruessner, J. C., et al. (2021). The impact of maternal care and blood glucose availability on the cortisol stress response in fasted women. J. Neural Transm. (Vienna) 128 (9), 1287–1300. doi:10.1007/s00702-021-02350-y
Bermingham, K. M., Smith, H. A., Gonzalez, J. T., Duncan, E. L., Valdes, A. M., Franks, P. W., et al. (2023). Glycaemic variability, assessed with continuous glucose monitors, is associated with diet, lifestyle and health in people without diabetes. Res. Sq. doi:10.21203/rs.3.rs-3469475/v1
Bonnefond, A., and Semple, R. K. (2022). Achievements, prospects and challenges in precision care for monogenic insulin-deficient and insulin-resistant diabetes. Diabetologia 65 (11), 1782–1795. doi:10.1007/s00125-022-05720-7
Breschi, A., Perelman, D., and Snyder, M. P. (2021). Response to Hulman and colleagues regarding “Glucotypes reveal new patterns of glucose dysregulation”. PLOS Biol. 19 (3), e3001092. doi:10.1371/journal.pbio.3001092
Bruce, N., Wei, I. A., Leng, W., Oh, Y., Chiu, Y. C., Roper, M. G., et al. (2022). Coordination of pancreatic islet rhythmic activity by delayed negative feedback. Am. J. Physiol. Endocrinol. Metab. 323 (6), E492–E502. doi:10.1152/ajpendo.00123.2022
Cappon, G., Vettoretti, M., Sparacino, G., and Facchinetti, A. (2019). Continuous glucose monitoring sensors for diabetes management: a review of technologies and applications. Diabetes Metab. J. 43 (4), 383–397. doi:10.4093/dmj.2019.0121
Chaddad, A., Peng, J., Xu, J., and Bouridane, A. (2023). Survey of explainable AI techniques in healthcare. Sensors (Basel) 23 (2), 634. doi:10.3390/s23020634
Chan, C. L. (2017). Use of continuous glucose monitoring in youth-onset Type 2 diabetes. Curr. Diab. Rep. 17 (9), 66. doi:10.1007/s11892-017-0905-0
Chung, W. K., Erion, K., Florez, J. C., Hattersley, A. T., Hivert, M.-F., Lee, C. G., et al. (2020). Precision medicine in diabetes: a consensus report from the American diabetes association (ADA) and the European association for the study of diabetes (EASD). Diabetes Care 43 (7), 1617–1635. doi:10.2337/dci20-0022
Collene, A. L., Hertzler, S. R., Williams, J. A., and Wolf, B. W. (2005). Effects of a nutritional supplement containing Salacia oblonga extract and insulinogenic amino acids on postprandial glycemia, insulinemia, and breath hydrogen responses in healthy adults. Nutrition 21 (7–8), 848–854. doi:10.1016/j.nut.2004.11.018
Dankner, R., Chetrit, A., Shanik, M. H., Raz, I., and Roth, J. (2009). Basal-state hyperinsulinemia in healthy normoglycemic adults is predictive of type 2 diabetes over a 24-year follow-up: a preliminary report. Diabetes Care 32 (8), 1464–1466. doi:10.2337/dc09-0153
DeCarlo, L. T. (2020). An item response model for true–false exams based on signal detection theory. Appl. Psychol. Meas. 44 (3), 234–248. doi:10.1177/0146621619843823
Dhumpa, R., Truong, T. M., Wang, X., Bertram, R., and Roper, M. G. (2014). Negative feedback synchronizes islets of Langerhans. Biophys. J. 106 (10), 2275–2282. doi:10.1016/j.bpj.2014.04.015
Dong, Q., Hu, N., Yue, H., and Wang, H. (2021). Inhibitory activity and mechanism investigation of hypericin as a novel α-glucosidase inhibitor. Molecules 26 (15), 4566. doi:10.3390/molecules26154566
Duckworth, C., Guy, M. J., Kumaran, A., O’Kane, A. A., Ayobi, A., Chapman, A., et al. (2024). Explainable machine learning for real-time hypoglycemia and hyperglycemia prediction and personalized control recommendations. J. Diabetes Sci. Technol. 18 (1), 113–123. doi:10.1177/19322968221103561
Dyachok, O., Idevall-Hagren, O., Sågetorp, J., Tian, G., Wuttke, A., Arrieumerlou, C., et al. (2008). Glucose-induced cyclic AMP oscillations regulate pulsatile insulin secretion. Cell Metab. 8 (1), 26–37. doi:10.1016/j.cmet.2008.06.003
El-Athman, R., Knezevic, D., Fuhr, L., and Relógio, A. (2019). A computational analysis of alternative splicing across mammalian tissues reveals circadian and ultradian rhythms in splicing Events. Int. J. Mol. Sci. 20 (16), 3977. doi:10.3390/ijms20163977
Fang, Y., Wang, S., Wu, J., Zhang, L., Wang, Z., Gan, L., et al. (2017). The kinetics and mechanism of α-glucosidase inhibition by F5-SP, a novel compound derived from sericin peptides. Food Funct. 8 (1), 323–332. doi:10.1039/c6fo01215a
Franceschi, R. (2022). Precision medicine in diabetes, current research and future perspectives. J. Pers. Med. 12 (8), 1233. doi:10.3390/jpm12081233
Freckmann, G., Link, M., Westhoff, A., Kamecke, U., Pleus, S., and Haug, C. (2018). Prediction quality of glucose trend indicators in two continuous tissue glucose monitoring SystemsParts of these data were previously presented at the 53rd annual meeting of the European association for the study of diabetes, september 11–15, 2017, Lisbon, Portugal. Diabetes Technol. Ther. 20 (8), 550–556. doi:10.1089/dia.2018.0112
Freckmann, G., Schauer, S., Beltzer, A., Waldenmaier, D., Buck, S., Baumstark, A., et al. (2024). Continuous glucose profiles in healthy people with fixed meal times and under everyday life conditions. J. Diabetes Sci. Technol. 18 (2), 407–413. doi:10.1177/19322968221113341
Guess, N. (2023). The growing use of continuous glucose monitors in people without diabetes: an evidence-free zone. Pract. Diab. 40 (5), 19–22a. doi:10.1002/pdi.2475
Hall, H., Perelman, D., Breschi, A., Limcaoco, P., Kellogg, R., McLaughlin, T., et al. (2018). Glucotypes reveal new patterns of glucose dysregulation. PLOS Biol. 16 (7), e2005143. doi:10.1371/journal.pbio.2005143
Heacock, P. M., Hertzler, S. R., Williams, J. A., and Wolf, B. W. (2005). Effects of a medical food containing an herbal α-glucosidase inhibitor on postprandial glycemia and insulinemia in healthy adults. J. Am. Diet. Assoc. 105 (1), 65–71. doi:10.1016/j.jada.2004.11.001
Hollingdal, M., Sturis, J., Gall, M. A., Damsbo, P., Pincus, S., Veldhuis, J. D., et al. (2005). Repaglinide treatment amplifies first-phase insulin secretion and high-frequency pulsatile insulin release in Type 2 diabetes. Diabet. Med. 22 (10), 1408–1413. doi:10.1111/j.1464-5491.2005.01652.x
Holzer, R., Bloch, W., and Brinkmann, C. (2022). Continuous glucose monitoring in healthy adults—possible applications in health care, wellness, and sports. Sensors (Basel) 22 (5), 2030. doi:10.3390/s22052030
Hulman, A., Foreman, Y. D., Brouwers, M. C., Kroon, A. A., Reesink, K. D., Dagnelie, P. C., et al. (2021). Towards precision medicine in diabetes? A critical review of glucotypes. PLOS Biol. 19 (3), e3000890. doi:10.1371/journal.pbio.3000890
Janssen, J. A. M. J. L. (2021). Hyperinsulinemia and its pivotal role in aging, obesity, Type 2 diabetes, cardiovascular disease and cancer. Int. J. Mol. Sci. 22 (15), 7797. doi:10.3390/ijms22157797
Jayakumar, V., and Simpson, T. L. (2020). Detectability and bias indices of pneumatic corneal stimuli using signal detection theory. Vis. Sci. Technol. 9 (12), 17. doi:10.1167/tvst.9.12.17
Jospe, M. R., de Bruin, W. E., Haszard, J. J., Mann, J. I., Brunton, M., and Taylor, R. W. (2020). Teaching people to eat according to appetite - does the method of glucose measurement matter? Appetite 151, 104691. doi:10.1016/j.appet.2020.104691
Keshet, A., Shilo, S., Godneva, A., Talmor-Barkan, Y., Aviv, Y., Segal, E., et al. (2023). CGMap: characterizing continuous glucose monitor data in thousands of non-diabetic individuals. Cell Metab. 35 (5), 758–769.e3. doi:10.1016/j.cmet.2023.04.002
Klupa, T., Czupryniak, L., Dzida, G., Fichna, P., Jarosz-Chobot, P., Gumprecht, J., et al. (2023). Expanding the role of continuous glucose monitoring in modern diabetes care beyond Type 1 disease. Diabetes Ther. 14 (8), 1241–1266. doi:10.1007/s13300-023-01431-3
Koteshwar, P., Raveendra, K. R., Allan, J. J., Goudar, K. S., Venkateshwarlu, K., and Agarwal, A. (2013). Effect of NR-Salacia on post-prandial hyperglycemia: a randomized double blind, placebo-controlled, crossover study in healthy volunteers. Pharmacogn. Mag. 9 (36), 344–349. doi:10.4103/0973-1296.117831
Kubota, H., Noguchi, R., Toyoshima, Y., Ozaki, Y., Uda, S., Watanabe, K., et al. (2012). Temporal coding of insulin action through multiplexing of the AKT pathway. Mol. Cell 46 (6), 820–832. doi:10.1016/j.molcel.2012.04.018
Kubota, H., Uda, S., Matsuzaki, F., Yamauchi, Y., and Kuroda, S. (2018). In vivo decoding mechanisms of the temporal patterns of blood insulin by the insulin-AKT pathway in the liver. Cell Syst. 7 (1), 118–128.e3. doi:10.1016/j.cels.2018.05.013
Kushwaha, P. S., Singh, A. K., Keshari, A. K., Maity, S., and Saha, S. (2016). An updated review on the phytochemistry, pharmacology, and clinical trials of Salacia oblonga. Pharmacogn. Rev. 10 (20), 109–114. doi:10.4103/0973-7847.194046
Lang, D. A., Matthews, D. R., Peto, J., and Turner, R. C. (1979). Cyclic oscillations of basal plasma glucose and insulin concentrations in human beings. N. Engl. J. Med. 301 (19), 1023–1027. doi:10.1056/NEJM197911083011903
Langendam, M., Luijf, Y. M., Hooft, L., Devries, J. H., Mudde, A. H., and Scholten, R. J. (2012). Continuous glucose monitoring systems for type 1 diabetes mellitus. Cochrane Database Syst. Rev. 1 (1), CD008101. doi:10.1002/14651858.CD008101.pub2
Laurenti, M. C., Matveyenko, A., and Vella, A. (2021). Measurement of pulsatile insulin secretion: rationale and methodology. Metabolites 11 (7), 409. doi:10.3390/metabo11070409
Lawton, J., Blackburn, M., Allen, J., Campbell, F., Elleri, D., Leelarathna, L., et al. (2018). Patients’ and caregivers’ experiences of using continuous glucose monitoring to support diabetes self-management: qualitative study. BMC Endocr. Disord. 18 (1), 12. doi:10.1186/s12902-018-0239-1
Lee, B., Song, T., Lee, K., Kim, J., Han, S., Berggren, P. O., et al. (2017). Phase modulation of insulin pulses enhances glucose regulation and enables inter-islet synchronization. PLOS ONE 12 (2), e0172901. doi:10.1371/journal.pone.0172901
Li, J., Kuang, Y., and Mason, C. C. (2006). Modeling the glucose-insulin regulatory system and ultradian insulin secretory oscillations with two explicit time delays. J. Theor. Biol. 242 (3), 722–735. doi:10.1016/j.jtbi.2006.04.002
Liu, S., Shen, Z., Deng, L., and Liu, G. (2022). Smartphone assisted portable biochip for non-invasive simultaneous monitoring of glucose and insulin towards precise diagnosis of prediabetes/diabetes. Biosens. Bioelectron. 209, 114251. doi:10.1016/j.bios.2022.114251
Liu, S. K., Hao, H., Bian, Y., Ge, Y. X., Lu, S., Xie, H. X., et al. (2021). Discovery of new α-glucosidase inhibitors: structure-based virtual screening and biological evaluation. Front. Chem. 9, 639279. doi:10.3389/fchem.2021.639279
Locke, S. M., and Robinson, O. J. (2021). Affective bias through the lens of signal detection theory. Comput. Psychiatry. 5 (1), 4–20. doi:10.5334/cpsy.58
Marling, C. R., Shubrook, J. H., Vernier, S. J., Wiley, M. T., and Schwartz, F. L. (2011). Characterizing blood glucose variability using new metrics with continuous glucose monitoring data. J. Diabetes Sci. Technol. 5 (4), 871–878. doi:10.1177/193229681100500408
Maude, H., Sanchez-Cabanillas, C., and Cebola, I. (2021). Epigenetics of hepatic insulin resistance. Front. Endocrinol. 12, 681356. doi:10.3389/fendo.2021.681356
McKenna, J. P., Dhumpa, R., Mukhitov, N., Roper, M. G., and Bertram, R. (2016). Glucose oscillations can activate an endogenous oscillator in pancreatic islets. PLOS Comput. Biol. 12 (10), e1005143. doi:10.1371/journal.pcbi.1005143
Medagama, A. B. (2015). Salacia reticulata (Kothala himbutu) revisited; a missed opportunity to treat diabetes and obesity? Nutr. J. 14, 21. doi:10.1186/s12937-015-0013-4
Meigs, J. B., Porneala, B., Leong, A., Shiffman, D., Devlin, J. J., and McPhaul, M. J. (2020). Simultaneous consideration of HbA1c and insulin resistance improves risk assessment in white individuals at increased risk for future type 2 diabetes. Diabetes Care 43 (8), e90–e92. doi:10.2337/dc20-0718
Morikawa, T., Akaki, J., Ninomiya, K., Kinouchi, E., Tanabe, G., Pongpiriyadacha, Y., et al. (2015). Salacinol and related analogs: new leads for type 2 diabetes therapeutic candidates from the Thai traditional natural medicine Salacia chinensis. Nutrients 7 (3), 1480–1493. doi:10.3390/nu7031480
Mujahid, O., Contreras, I., and Vehi, J. (2021). Machine learning techniques for hypoglycemia prediction: trends and challenges. Sensors (Basel) 21 (2), 546. doi:10.3390/s21020546
Ng, X. W., Chung, Y. H., and Piston, D. W. (2021). Intercellular communication in the islet of Langerhans in health and disease. Compr. Physiol. 11 (3), 2191–2225. doi:10.1002/cphy.c200026
Nguyen, M., Han, J., Spanakis, E. K., Kovatchev, B. P., and Klonoff, D. C. (2020). A review of continuous glucose monitoring-based composite metrics for glycemic control. Diabetes Technol. Ther. 22 (8), 613–622. doi:10.1089/dia.2019.0434
Nor, A. K. M., Pedapati, S. R., Muhammad, M., and Leiva, V. (2021). Overview of explainable artificial intelligence for prognostic and health management of industrial assets based on Preferred Reporting Items for Systematic Reviews and Meta-Analyses. Sensors (Basel) 21 (23), 8020. doi:10.3390/s21238020
Ohara-Imaizumi, M., Kim, H., Yoshida, M., Fujiwara, T., Aoyagi, K., Toyofuku, Y., et al. (2013). Serotonin regulates glucose-stimulated insulin secretion from pancreatic β cells during pregnancy. Proc. Natl. Acad. Sci. U. S. A. 110 (48), 19420–19425. doi:10.1073/pnas.1310953110
O’Meara, N. M., Sturis, J., Van Cauter, E., and Polonsky, K. S. (1993). Lack of control by glucose of ultradian insulin secretory oscillations in impaired glucose tolerance and in non-insulin-dependent diabetes mellitus. J. Clin. Invest. 92 (1), 262–271. doi:10.1172/JCI116560
Ortiz, R., Kluwe, B., Odei, J. B., Echouffo Tcheugui, J. B., Sims, M., Kalyani, R. R., et al. (2019). The association of morning serum cortisol with glucose metabolism and diabetes: the Jackson Heart study. Psychoneuroendocrinology 103, 25–32. doi:10.1016/j.psyneuen.2018.12.237
Ouyang, R., Yin, Y., Wang, J., Su, W., Zang, L., Chen, K., et al. (2022). Sex differences in hypercortisolism and glucose-metabolism disturbances in patients with mild autonomous cortisol secretion: findings from a single center in China. Front. Endocrinol. (Lausanne) 13, 857947. doi:10.3389/fendo.2022.857947
Partch, C. B., Green, C. B., and Takahashi, J. S. (2014). Molecular architecture of the mammalian circadian clock. Trends Cell Biol. 24 (2), 90–99. doi:10.1016/j.tcb.2013.07.002
Paulmann, N., Grohmann, M., Voigt, J.-P., Bert, B., Vowinckel, J., Bader, M., et al. (2009). Intracellular serotonin modulates insulin secretion from pancreatic β-cells by protein serotonylation. PLOS Biol. 7 (10), e1000229. doi:10.1371/journal.pbio.1000229
Pedersen, M. G., Bertram, R., and Sherman, A. (2005). Intra- and inter-islet synchronization of metabolically driven insulin secretion. Biophys. J. 89 (1), 107–119. doi:10.1529/biophysj.104.055681
Pørksen, N. (2002). Early changes in beta-cell function and insulin pulsatility as predictors for type 2 diabetes. Diabetes Nutr. Metab. 15 (6), 9–14.
Pørksen, N., Hollingdal, M., Juhl, C., Butler, P., Veldhuis, J. D., and Schmitz, O. (2002). Pulsatile insulin secretion: detection, regulation, and role in diabetes. Diabetes 51 (Suppl. 1), S245–S254. doi:10.2337/diabetes.51.2007.s245
Psoma, S. D., and Kanthou, C. (2023). Wearable insulin biosensors for diabetes management: advances and challenges. Biosens. (Basel). 13 (7), 719. doi:10.3390/bios13070719
Purvis, J. E., and Lahav, G. (2012). Decoding the insulin signal. Mol. Cell. 46 (6), 715–716. doi:10.1016/j.molcel.2012.06.005
Radha, R., and Amrithaveni, M. (2009). Role of medicinal plant Salacia reticulata in the management of Type II diabetic subjects. Anc. Sci. Life 29 (1), 14–16.
Sabu, C., Henna, T. K., Raphey, V. R., Nivitha, K. P., and Pramod, K. (2019). Advanced biosensors for glucose and insulin. Biosens. Bioelectron. 141, 111201. doi:10.1016/j.bios.2019.03.034
Satin, L. S., Butler, P. C., Ha, J., and Sherman, A. S. (2015). Pulsatile insulin secretion, impaired glucose tolerance and type 2 diabetes. Mol. Asp. Med. 42, 61–77. doi:10.1016/j.mam.2015.01.003
Schmitz, O., Rungby, J., Edge, L., and Juhl, C. B. (2008). On high-frequency insulin oscillations. Ageing Res. Rev. 7 (4), 301–305. doi:10.1016/j.arr.2008.04.002
Seo, W., Lee, Y. B., Lee, S., Jin, S. M., and Park, S. M. (2019). A machine-learning approach to predict postprandial hypoglycemia. BMC Med. Inf. Decis. Mak. 19 (1), 210. doi:10.1186/s12911-019-0943-4
Sim, L., Jayakanthan, K., Mohan, S., Nasi, R., Johnston, B. D., Pinto, B. M., et al. (2010). New glucosidase inhibitors from an ayurvedic herbal treatment for type 2 diabetes: structures and inhibition of human intestinal maltase-glucoamylase with compounds from Salacia reticulata. Biochemistry 49 (3), 443–451. doi:10.1021/bi9016457
Simon, C. (1998). Ultradian pulsatility of plasma glucose and insulin secretion rate: circadian and sleep modulation. Horm. Res. 49 (3–4), 185–190. doi:10.1159/000023169
Simon, C., and Brandenberger, G. (2002). Ultradian oscillations of insulin secretion in humans. Diabetes 51 (Suppl. 1), S258–S261. doi:10.2337/diabetes.51.2007.s258
Simon, C., Brandenberger, G., and Follenius, M. (1987). Ultradian oscillations of plasma glucose, insulin, and C-peptide in man during continuous enteral nutrition. J. Clin. Endocrinol. Metab. 64 (4), 669–674. doi:10.1210/jcem-64-4-669
Simon, C., Brandenberger, G., Saini, J., Ehrhart, J., and Follenius, M. (1994). Slow oscillations of plasma glucose and insulin secretion rate are amplified during sleep in humans under continuous enteral nutrition. Sleep 17 (4), 333–338. doi:10.1093/sleep/17.4.333
Singh, M. K., Leslie, S. M., Packer, M. M., Zaiko, Y. V., Phillips, O. R., Weisman, E. F., et al. (2018). Brain and behavioral correlates of insulin resistance in youth with depression and obesity. Horm. Behav. 108, 73–83. doi:10.1016/j.yhbeh.2018.03.009
Sonnenberg, G. E., Hoffmann, R. G., Johnson, C. P., and Kissebah, A. H. (1992). Low- and high-frequency insulin secretion pulses in normal subjects and pancreas transplant recipients: role of extrinsic innervation. J. Clin. Invest. 90 (2), 545–553. doi:10.1172/JCI115893
Stefan, N., Staiger, H., Wagner, R., Machann, J., Schick, F., Häring, H. U., et al. (2015). A high-risk phenotype associates with reduced improvement in glycaemia during a lifestyle intervention in prediabetes. Diabetologia 58 (12), 2877–2884. doi:10.1007/s00125-015-3760-z
Stohs, S. J., and Ray, S. (2015). Anti-diabetic and anti-hyperlipidemic effects and safety of Salacia reticulata and related species. Phytother. Res. 29 (7), 986–995. doi:10.1002/ptr.5382
Sturis, J., O’Meara, N. M., Shapiro, E. T., Blackman, J. D., Tillil, H., Polonsky, K. S., et al. (1993). Differential effects of glucose stimulation upon rapid pulses and ultradian oscillations of insulin secretion. J. Clin. Endocrinol. Metab. 76 (4), 895–901. doi:10.1210/jcem.76.4.8473402
Sturis, J., Scheen, A. J., Leproult, R., Polonsky, K. S., and van Cauter, E. (1995). 24-hour glucose profiles during continuous or oscillatory insulin infusion. Demonstration of the functional significance of ultradian insulin oscillations. J. Clin. Invest. 95 (4), 1464–1471. doi:10.1172/JCI117817
Sturis, J., Van Cauter, E., Blackman, J. D., and Polonsky, K. S. (1991). Entrainment of pulsatile insulin secretion by oscillatory glucose infusion. J. Clin. Invest. 87 (2), 439–445. doi:10.1172/JCI115015
Tang, L., Chang, S. J., Chen, C. J., and Liu, J. T. (2020). Non-invasive blood glucose monitoring technology: a review. Sensors (Basel) 20 (23), 6925. doi:10.3390/s20236925
Taylor, P. J., Thompson, C. H., Luscombe-Marsh, N. D., Wycherley, T. P., Wittert, G., and Brinkworth, G. D. (2019). Efficacy of real-time continuous glucose monitoring to improve effects of a prescriptive lifestyle intervention in type 2 diabetes: a pilot study. Diabetes Ther. 10 (2), 509–522. doi:10.1007/s13300-019-0572-z
Thomas, D. D., Corkey, B. E., Istfan, N. W., and Apovian, C. M. (2019). Hyperinsulinemia: an early indicator of metabolic dysfunction. J. Endocr. Soc. 3 (9), 1727–1747. doi:10.1210/js.2019-00065
Villena Gonzales, W., Mobashsher, A. T., and Abbosh, A. (2019). The progress of glucose monitoring—a review of invasive to minimally and non-invasive techniques, devices and sensors. Sensors (Basel) 19 (4), 800. doi:10.3390/s19040800
Vyas, N., Mehra, R., and Makhija, R. (2016). Salacia—the new multi-targeted approach in diabetics. Ayu 37 (2), 92–97. doi:10.4103/ayu.AYU_134_13
Wang, S., Huang, H., Wang, X., Zhou, Z., Luo, Y., Huang, K., et al. (2023). Recent advances in personal glucose meter-based biosensors for food safety hazard detection. Foods 12 (21), 3947. doi:10.3390/foods12213947
Ward, G. M., Walters, J. M., Aitken, P. M., Best, J. D., and Alford, F. P. (1990). Effects of prolonged pulsatile hyperinsulinemia in humans. Enhancement of insulin sensitivity. Diabetes 39 (4), 501–507. doi:10.2337/diab.39.4.501
Williams, J. A., Choe, Y. S., Noss, M. J., Baumgartner, C. J., and Mustad, V. A. (2007). Extract of Salacia oblonga lowers acute glycemia in patients with type 2 diabetes. Am. J. Clin. Nutr. 86 (1), 124–130. doi:10.1093/ajcn/86.1.124
Woldaregay, A. Z., Årsand, E., Walderhaug, S., Albers, D., Mamykina, L., Botsis, T., et al. (2019). Data-driven modeling and prediction of blood glucose dynamics: machine learning applications in type 1 diabetes. Artif. Intell. Med. 98, 109–134. doi:10.1016/j.artmed.2019.07.007
Wu, Y. L., Lin, Z. J., Li, C. C., Lin, X., Shan, S. K., Guo, B., et al. (2023). Epigenetic regulation in metabolic diseases: mechanisms and advances in clinical study. Signal Transduct. Target. Ther. 8 (1), 98. doi:10.1038/s41392-023-01333-7
Yaribeygi, H., Maleki, M., Butler, A. E., Jamialahmadi, T., and Sahebkar, A. (2022). Molecular mechanisms linking stress and insulin resistance. Excli J. 21, 317–334. doi:10.17179/excli2021-4382
Yu, Q., Aris, I. M., Tan, K. H., and Li, L. J. (2019). Application and utility of continuous glucose monitoring in pregnancy: a systematic review. Front. Endocrinol. (Lausanne) 10, 697. doi:10.3389/fendo.2019.00697
Zafar, H., Channa, A., Jeoti, V., and Stojanović, G. M. (2022). Comprehensive review on wearable sweat-glucose sensors for continuous glucose monitoring. Sensors (Basel) 22 (2), 638. doi:10.3390/s22020638
Zecchin, C., Facchinetti, A., Sparacino, G., and Cobelli, C. (2016). How much is short-term glucose prediction in Type 1 diabetes improved by adding insulin delivery and meal content information to CGM Data? A proof-of-concept study. J. Diabetes Sci. Technol. 10 (5), 1149–1160. doi:10.1177/1932296816654161
Keywords: continuous glucose monitoring, glucose homeostasis, metabolic risk management, glucose spike, pulsatile glucose oscillation, glucose excursion
Citation: Katagiri Y, Ozaku H and Kondo K (2024) A method for evaluating the risks of glucose dysregulation in daily life by continuous measurement of glucose excursions under reduced glycemic load: a pilot study. Front. Sens. 5:1382152. doi: 10.3389/fsens.2024.1382152
Received: 05 February 2024; Accepted: 18 April 2024;
Published: 07 May 2024.
Edited by:
Rouholah Zare Dorabei, Iran University of Science and Technology, IranReviewed by:
Sotiria Psoma, The Open University, United KingdomTao Wang, Hefei University of Technology, China
Copyright © 2024 Katagiri, Ozaku and Kondo. This is an open-access article distributed under the terms of the Creative Commons Attribution License (CC BY). The use, distribution or reproduction in other forums is permitted, provided the original author(s) and the copyright owner(s) are credited and that the original publication in this journal is cited, in accordance with accepted academic practice. No use, distribution or reproduction is permitted which does not comply with these terms.
*Correspondence: Yoshitada Katagiri, dGthdGFnaXJpQGcuZWNjLnUtdG9reW8uYWMuanA=