 Takuto Ojima
 Kazuo Hiekata
 Takuya Nakashima
- Department of Human and Engineered Environmental Studies, Graduate School of Frontier Sciences, The University of Tokyo, Kashiwa, Japan
In depopulated areas with aging populations, it is challenging to design public transportation services. This is because municipalities are expected to provide mobility to as many people as possible within a limited budget while considering the various modes of transportation in that municipality. This study therefore aims to explore sustainable transport policies that will improve both the mobility aspect for older adults and the financial aspect for municipalities. Specifically, we take Narita City, Chiba Prefecture, as an example, which operates demand-responsive transport (DRT) services and where urban and rural areas coexist. We then developed various transport policy scenarios, for example, varying the degree to which demand-responsive transport is operated, or adding a subsidy system through taxi ticket distribution, and comparing them on two axes: the municipality cost and the mobility indicator QoM (Quality of Mobility). By using QoM, we can evaluate changes in individual mobility and quantitatively analyze how transportation inconvenience and the impact of policy changes vary depending on individual attributes even within the same municipality. The results indicated that improving DRT convenience or introducing taxi subsidies led to increased costs to some extent but also significantly enhanced mobility levels. In particular, the more difficult it was for people to travel, the higher the impact– highlighting the importance of DRT for these individuals. Furthermore, we found that there were significant differences in mobility among residents depending on their residential area. This study suggests the need for a comprehensive approach that addresses not only public transportation but also urban planning to bridge these gaps.
1 Introduction
In regions experiencing population decline and an aging society, a certain number of residents find it difficult to even make the minimum necessary trips for daily life. For such transportation-disadvantaged individuals, the public transportation services provided by local governments are of paramount importance. One such public transportation service is demand-responsive transport (DRT), a shared-ride system where users can book their desired pick-up and drop-off locations and time. Compared to conventional fixed-route buses, DRT offers several advantages, such as the flexibility to adjust bus stops and routes according to users' demand and door-to-door service. Furthermore, as operations are based on reservations, vehicles do not need to run when there are no passengers, leading to shorter and more effective operating hours and reduced costs. Due to these benefits, the number of municipalities adopting DRT has been increasing year by year, with ~700 municipalities in Japan implementing it in fiscal year 2020 (Ministry of Land, Infrastructure, Transport and Tourism, 2020). Public transportation services are, therefore, key to the mobility of transportation-disadvantaged people.
However, even these effective services may face challenges to continue depending on the financial situation of the local government. In depopulated areas, DRT is often introduced to mitigate deficits incurred from operating fixed-route buses, leveraging its inherent advantages. Nevertheless, even with fare collection, the revenue generated by the local government is often insufficient to offset the expenses incurred in operating this service, making profitability extremely difficult to achieve. Furthermore, the costs associated with the DRT vehicles themselves, such as maintenance expenses and repair costs due to breakdowns, also contribute to the need for a comfortable financial situation to operate them (Currie and Fournier, 2020). Consequently, some municipalities, unable to disregard the operating deficits of DRT, have been forced to reduce or terminate the service (Sakamoto and Morimoto, 2013). Thus, these services are essential for local governments to protect the minimum livelihood of residents and facilitate their activities, but local governments must operate these services within a limited budget and maintain financial sustainability.
Currently, discussions about sustainable public transportation policy are active in various regions. First, we review the discourse within Japan. The Japan Transport and Tourism Research Institute (JTTRI) has summarized the current issues in regional transportation and proposed measures for realizing new mobility services that could offer solutions (Japan Transport and Tourism Research Institute, 2023). Among the requirements deemed necessary for their realization, they highlight three key aspects: “balance of revenue and expenditure for service provision,” “securing service providers,” and “acceptance of the provided service.”
Pandyaswargo et al. discuss the mobility challenges faced by older adults and the potential for introducing autonomous vehicles to address them (Pandyaswargo et al., 2023). They state that among older adults, those who own cars tend to engage in activities to support others' travel purposes, and introducing autonomous vehicles could allow them to maintain this tendency while enabling safer travel. Also, Eto conducted a survey of residents aged 75 and older in the Kozaki area of Kameoka City, Kyoto Prefecture, a region with transportation disadvantages, and analyzed their actual travel patterns (Eto, 2020). The findings indicate that most residents, regardless of their driver's license status, rely on cars for transportation, with limited use of community buses. However, it is noted that creating an environment where people can request pick-up and drop-off significantly influences their willingness to use door-to-door transportation. In essence, it can be said that DRT fulfills “acceptance of the provided service,” one of the three requirements mentioned by JTTRI. However, there is less discussion regarding the “balance of revenue and expenditure for service provision.” Furthermore, “securing service providers” is also related to the discussion of costs, indicating that cost is a crucial factor.
In the world, recent studies have extensively explored the evolution of transportation policies in the context of lifestyle shifts induced by the COVID-19 pandemic (Griffiths et al., 2021; Awad-Núñez et al., 2021; Basu and Ferreira, 2021). These studies have consistently argued that achieving sustainable mobility requires restricting automobile use and constructing a multimodal program centered on public transportation. Moreover, Mobility as a Service (MaaS) is a recent topic of discussion in the field of transportation. MaaS aims to seamlessly integrate multiple transportation services and provide them to users. Studies have discussed its applicability (Ho and Tirachini, 2024) and the changes in people's behavior following its introduction (Hasselwander et al., 2022). However, in sparsely populated areas where automobile use is indispensable, the introduction of this multimodal transportation program could lead to cost difficulties. On one hand, restricting automobile use could stimulate residents who without transportation difficulties to utilize public transportation, potentially leading to a surge in demand that overwhelms municipal capacity, particularly in economically constrained areas (Said and Dindar, 2024). Conversely, narrowly targeting transportation-disadvantaged individuals would result in low user numbers and an underutilized program because they are a minority. In summary, cost remains a problem in any condition.
In Japan, there are also other barriers to the introduction of MaaS. Geng et al. have systematically summarized measures to improve transportation for older adults in four countries, including Japan (Geng et al., 2025). They note that a distinctive feature of Japan is that the government often takes the lead in uniformly implementing systems, such as traffic safety education for older adults and making transportation facilities barrier-free. However, because of this, there are few systems that older adults themselves can directly engage with, leading to a lack of flexible local initiatives. They also state that the speed of social implementation for technological innovation is slow, which limits the expansion of MaaS. Furthermore, while transportation policies based on MaaS principles are being implemented amidst an aging population and declining population, these are often operated by individual businesses, with no national government-led initiatives (World Economic Forum, 2021). Therefore, without sufficient financial leeway, it's very difficult to quickly introduce MaaS in Japan. To improve the transportation network in such a situation, it's necessary to start with the introduction and improvement of simpler public transportation services.
To sum up, this study aims to identify sustainable transportation policies that comprehensively improve both the mobility of older adults and the fiscal health of local governments. For this verification, we will take Narita City, Chiba Prefecture, as it exhibits characteristics of both urban and rural areas. This will allow us to discuss which policies are effective when the challenges faced by residents in transportation-disadvantaged areas, as mentioned earlier, have varying degrees of importance within the same municipality.
2 Methods
This chapter describes a method for quantitatively comparing residents' mobility and municipal expenditures. A schematic diagram of the proposed method is shown in Figure 1.
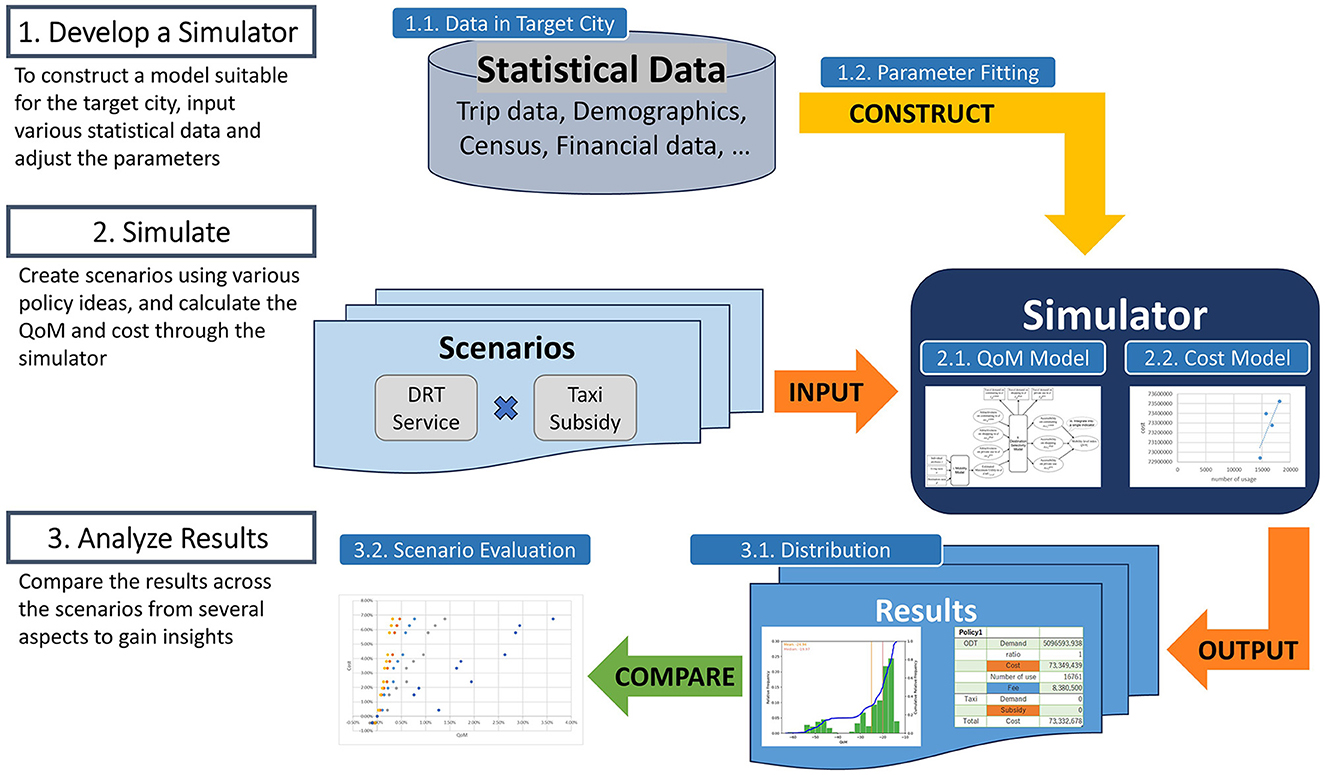
Figure 1. Schematic diagram of the proposed method. This method is divided into three stages: “Develop a Simulator,” “Simulate,” and “Analyze Results.”
2.1 Statistical data for the simulator
As illustrated in Figure 1, we first collected statistical data for the target region and used these data to calibrate the parameters of the simulator described below. Table 1 shows the data used and its overview.
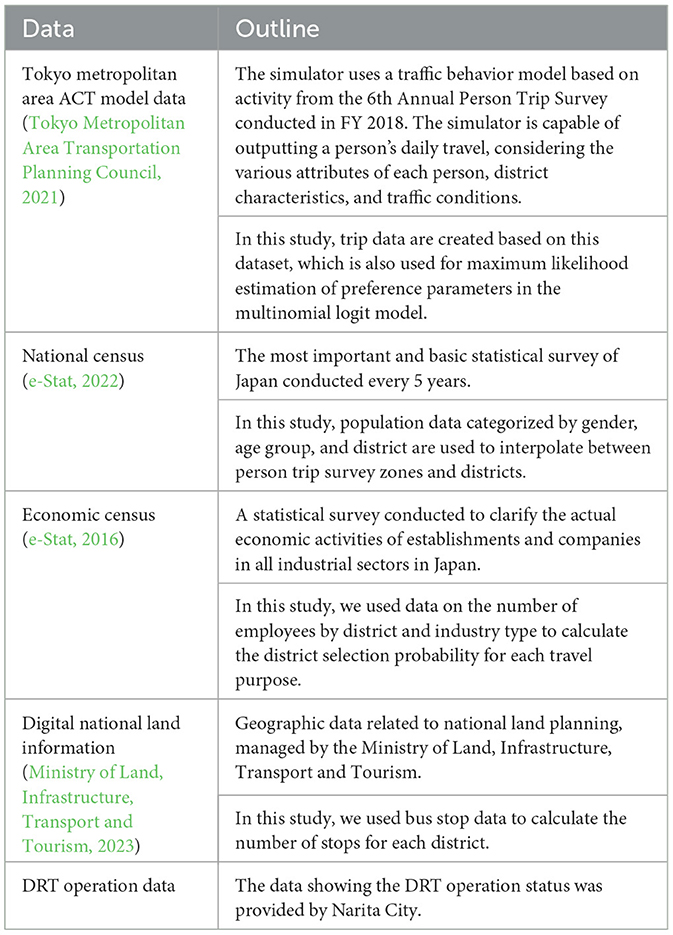
Table 1. Statistical data for the simulator.
2.2 Calculation of QoM
Once the parameters were determined, we conducted simulations under various transportation policy scenarios. The simulator developed in this study comprised two models: a QoM model for estimating the quality of individual mobility and a cost model for calculating the costs incurred by the municipal government.
“QoM” is short for “Quality of Mobility” and an index that objectively evaluates and calculates the mobility level of each individual, like QOL (Quality of Life). The QoM model (Eitoku and Mizokami, 2008) enabled quantitative comparisons by calculating the mobility of a target group under various transportation conditions.
Furthermore, because the QoM index was calculated based on accessibility for different travel purposes, it allowed for an evaluation that prioritized the minimum necessary trips for daily life. In other words, using this index, we could visualize the convenience of public transportation services for populations with limited mobility. Studies that have used QoM (Eitoku and Mizokami, 2008; Mizokami et al., 2010) have evaluated various road and transportation policies in urban areas, confirming its usefulness. Therefore, this study will also employ this method. While the QoM concept was proposed by Eitoku et al., in this study, we constructed a distinct model tailored to better assess the mobility of the older adults.
Figure 2 shows the structure of our QoM Model. In the figure, the most important variables calculated in each step of the model are represented by circles, while the input variables to the model and the output variables obtained from the model are represented by squares.
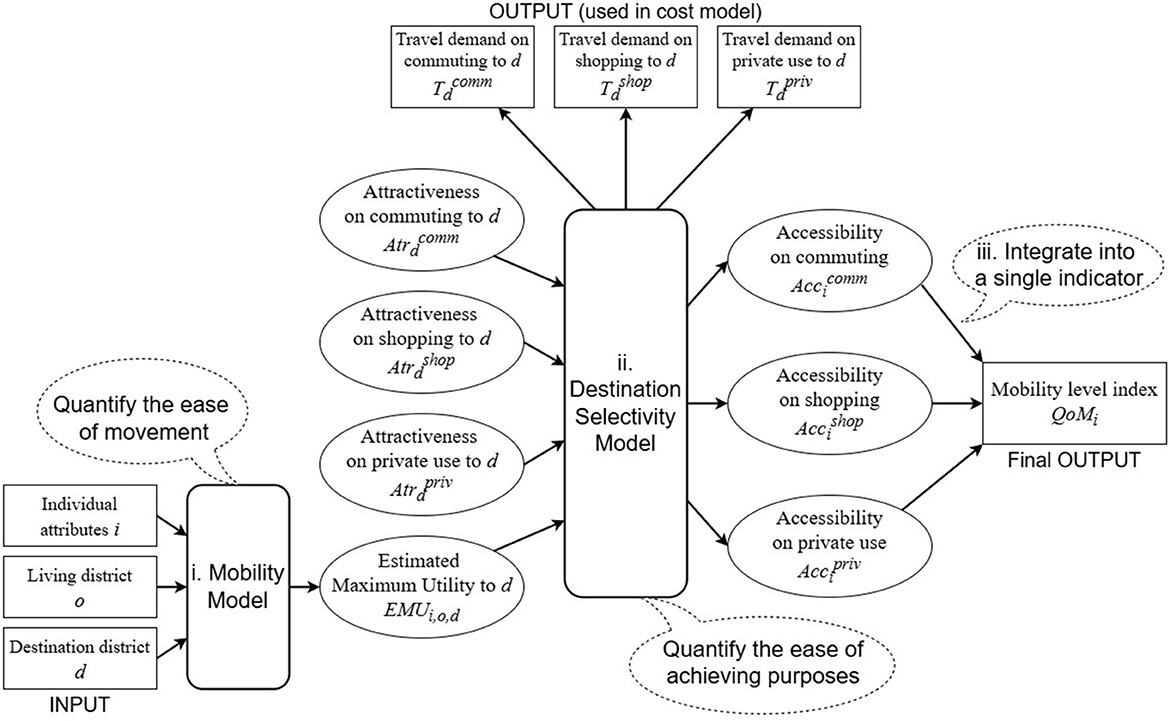
Figure 2. Overall structure of QoM. The most important variables are represented by circles, while the input variables to the model and the output variables obtained from the model are represented by squares.
This model is divided into the following three steps.
i. Mobility Model: Calculate estimated maximum utility, which quantifies the ease of traveling from an individual's place of residence to a certain destination.
ii. Destination Selectivity Model: Calculate accessibility by purpose to quantify the ease of achieving the individual mobility objectives based on ease of mobility.
iii. Integrate into a single indicator (QoM): Integrate accessibility by purpose.
Below, we describe the three steps in order.
2.2.1 Mobility Model
In the Mobility Model, we calculate a quantitative index that shows how easy it was for an individual to travel from their residence to a destination. Now, we calculate the utility that an individual can obtain when traveling to a destination, which can be calculated based on individual attributes and transportation information, for each mode of transportation. We then use the expected maximum utility of those modes of transportation choices as a quantitative index of ease of movement. The individual's choice of mode of transportation is expressed using a multinomial logit model (Páez and Boisjoly, 2022), which can explain individual behavior based on the utility, including individual randomness.
2.2.1.1 Modeling mode choice using a multinomial logit model
In the multinomial logit model used in this study, we assume that an individual chooses one mode of transportation with the highest utility from the set of mode choices M = {Walk, Bicycle, Bus, Car, DRT, Taxi}. In this model, we model travel behavior by assigning one type of mode of transportation to one trip using the concept of a representative mode of transportation in a person trip survey. Furthermore, by considering the availability of modes of transportation m, Availi(m) = {0, 1}, we can express situations where modes of transportation that have a significant impact on ease of movement cannot be selected.
Assuming that an individual i chooses the mode of transportation m that maximizes their utility when traveling from origin o to destination d, the probability Probi(m|o, d) of i choosing m for a trip from o to d can be expressed as:
The utility can be decomposed into a deterministic component , determined by the individual attributes and mode attributes, and a random component :
The deterministic component is expressed as a linear function of a vector of characteristics that includes i's attributes, information about o and d, and attributes of m, and a vector of preference parameters β representing the individual preferences:
Assuming that the random component follows a Gumbel distribution with a mean of 0, independently for each mode m, the probability of i choosing m for a trip from o to d can be calculated as follows. Note that this calculation considers Availi(m) = {0, 1}. Additionally, the same parameter vector β is used for all trips in this study.
Given the properties of the multinomial logit model, the expected maximum utility (EMUi, o, d) for i when traveling from o to d using any available mode m can be calculated as:
This EMUi, o, d represents the average utility across all available modes, considering i's specific circumstances. Therefore, it can be used as a quantitative indicator of ease of travel for i.
Table 2 shows the definition of Availi(m), and the definition of each characteristic variable in the transportation mode choice model. Note that l is the distance from o to d.
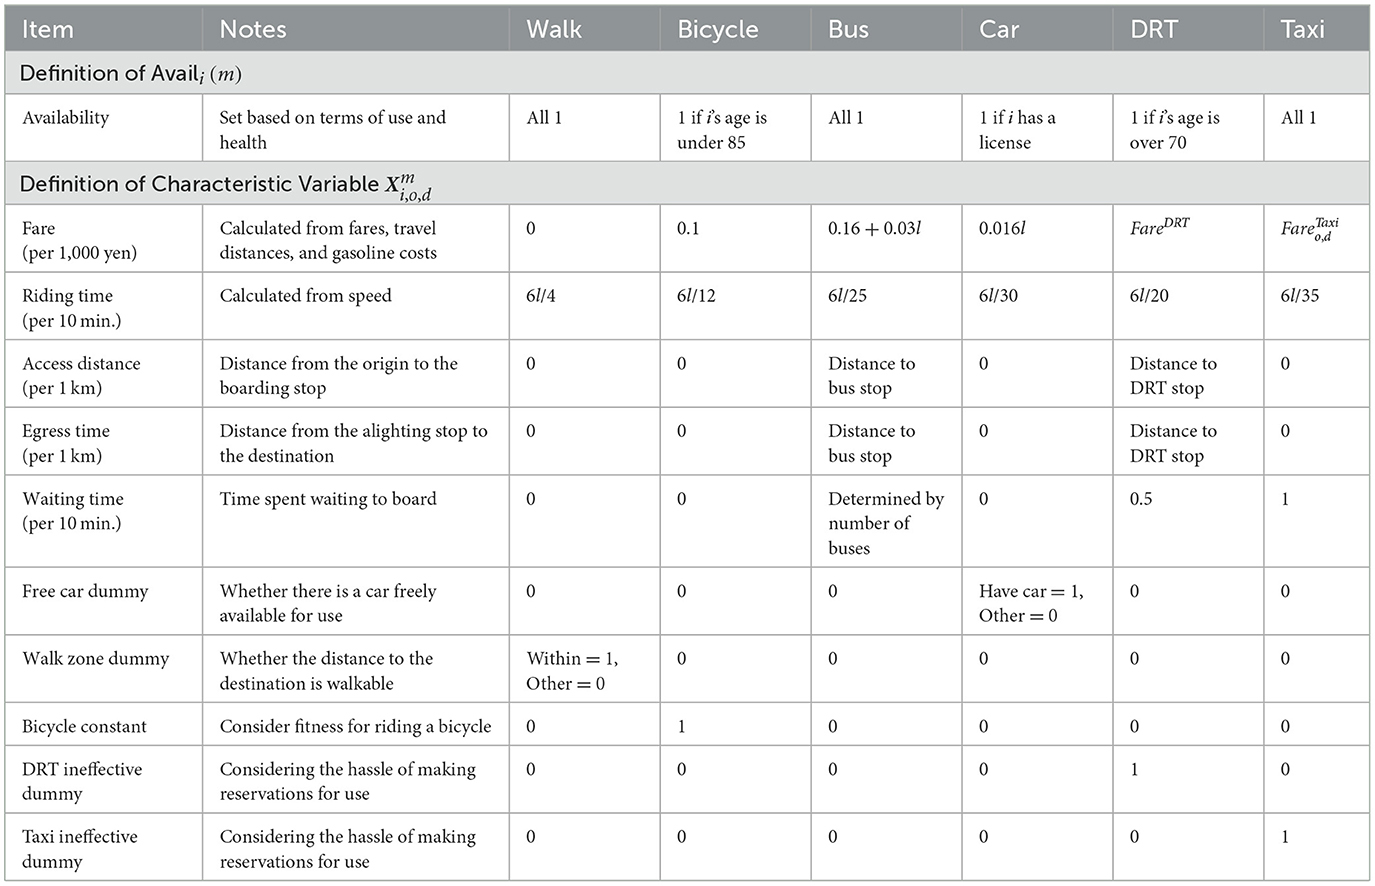
Table 2. Definition of variables in mobility model.
2.2.1.1.1 Estimation of preference parameters β
We estimate the preference parameter β in the mobility potential model. First, the likelihood function L(β) is formulated. Assume there are N behavioral outcomes for individual i. Here, the random variable is defined as below:
When the origin o and destination d are known for all individuals, the likelihood L that the individual's behavioral outcome is realized for all individuals' choices is as follows:
Therefore, the log-likelihood function lnL(β) is as follows:
In Maximum Likelihood Estimation, it is sufficient to find the vector that maximizes this value lnL(β).
2.2.1.1.2 Parameter estimation using spatial granularity interpolation via latent classes
In the actual estimation procedure, we first consider a mode choice model that does not include DRT and taxi, and estimate the parameter vector β. For estimation, we use the Tokyo metropolitan area ACT model data, which is based on a person trip survey, and perform Maximum Likelihood Estimation, taking into account the expansion factor for the results.
However, these data only investigate the origin and destination of trips at the small zone level (divisions defined based on population). Therefore, especially in rural areas, the spatial granularity is extremely coarse, making it very difficult to calculate precise travel distances. Thus, these trip data are first interpolated to district-level travel data using a latent class model to enhance spatial granularity, and then estimation is performed.
The specific formulation is as follows. The probability Probi(m|O, D) that i selects m when traveling from the origin small zone O to the destination small zone D can be expressed as follows, using the probability that the individual departs from o, Probi(o), and the probability that they head to d, Probi(d|o).
Here, represents the probability that i selects m when the explanatory variable for i follows a discrete probability distribution (NO and ND are the number of districts in small zones O and D, respectively). Also, Probi(d|o)Probi(o) indicates the probability that takes a specific value in the discrete probability distribution. At this point, since is calculated from a multinomial logit model, and also considering the expansion factor EFi the log-likelihood function of the model, lnL(β), becomes:
Here, Probi(o) and Probi(d|o) are calculated from district-specific parameters Ao and Ad, according to the trip purpose.
While Probi(d|o) is a conditional probability and not easily calculated, it is approximated by Probi(d) for the purpose of model estimation here. This approximation has a certain degree of validity if we consider the relationship where the destination of the current trip becomes the origin of the next trip in continuous trips. For origins, only the purpose of the trip that arrived at that origin, or the home location, is referenced.
Here, the parameters Ao and Ad for each district are calculated using data from the Economic Census. Specifically, for commuting trips, the total number of employees; for shopping trips, the number of wholesale and retail employees; for other private use trips, the number of tertiary industry employees; and for trips home or staying at home, the total population is used.
2.2.1.1.3 Estimation of ineffective dummy parameters
Next, based on actual DRT operation data, we estimate DRT Ineffective Dummy Parameter βDRT. We utilize the approximation that the current share rate of DRT SDRT is calculated as below:
is the average characteristic vector for all trips using m, and is the average availability of m for all individuals. Also, βm = 0 when m ≠ DRT. For the estimation of parameter βDRT, is substituted with the total registration rate to the DRT system among its target users. Furthermore, the average total number of DRT trips used to calculate DRT share rate is determined based on the ratio of the current DRT target population to the target population at the time of the person trip survey, following the concept of the unit cost method. In addition, Taxi Ineffective Dummy Parameter βTaxi is assumed to be 90% of βDRT, assuming that similar ineffectiveness exists.
2.2.2 Destination Selectivity Model
The Destination Selectivity Model calculates a quantitative index indicating how accessible a destination is for an individual who wants to achieve a particular purpose, considering EMUi, o, d obtained from the Mobility Model and the attractiveness of each destination for that purpose. This calculation employs a gravity model, which explains the traffic demand between origin and destination based on the attractiveness of each destination and the travel impedance between them. The attractiveness within the gravity model is defined as accessibility to a location that fulfills a specific purpose.
In the gravity model, the traffic demand from origin o to destination d for purpose p is given by:
where is the total trip demand for p originating from o, Lo, d is the travel impedance from o to d for p, is the relative attractiveness of d for p, and γp is a scale parameter for p. Here, both and γp are assumed to be positive and , Lo, d is defined as a variable that is always positive.
Under this gravity model, the accessibility for an individual i to reach a location fulfilling p from o can be expressed as:
where Z represents the area considered for calculating accessibility.
To connect Destination Selectivity Model with the Mobility Model and enable individual-level calculations, we construct a model using the normalized expected maximum utility Lo, d as explanatory variables.
By taking the difference, we ensure that Lo, d is always positive. However, o is assumed to be i's residence. Therefore, the accessibility for i regarding p can be expressed as:
This is a quantitative indicator of how accessible a location is for the individual to achieve a particular purpose, considering both the ease of travel represented by the expected maximum utility and the attractiveness of each destination for that purpose.
Note that by determining accessibility here, paradoxically, the gravity model can be used to calculate the traffic demand for i to travel from o to d for p using m. Where Probi(m|o, d) can be calculated by the Mobility Model. is used in the cost calculation.
2.2.2.1 Determination parameters in destination selectivity model
In the gravity model, the following formula holds using for traveling to d, averaged for individuals residing in o.
Therefore, if the total number of travelers to d, , and the number of departures from o, , are known, the attractiveness parameter can be determined as follows using the individual-averaged . For the calculation of , the previously estimated and the average individual attributes of people residing in the small zone containing o are used.
Furthermore, if individual behavioral data are available at the district level, these can be used to calculate , , and . Here, assuming that this behavioral data includes an error with a mean of 0, the least squares method can be applied by treating for each o as an observed value. That is, we need to find the value that minimizes the residual shown below.
However, the scale parameter γp cannot be determined as it is. Therefore, for each purpose p, γp is determined such that the attractiveness in the least attractive district is .
For the determination of parameters in this model, we use the number of trip occurrences for each purpose in the trip data and the number of uses of each boarding/alighting point analyzed from the DRT operation data.
Let be the total number of DRT trips for p from o to d. This value is obtained from the DRT operation data. Here, the purpose of DRT is identified by referring to the category of the arrival boarding/alighting point.
At this time, can be expressed as follows, using the probability that an individual residing in o uses DRT when heading to d, and .
For and , they are calculated based on the attributes of individuals moving from the small zone containing o to the small zone containing d in the trip data.
At this time, using the total number of people who moved to d by DRT, , obtained from the usage counts of each boarding/alighting point in DRT, the attractiveness parameter is determined as:
In either method, if for all origins o, then will always be 0.
2.2.3 Integrate into a single indicator
The Quality of Mobility (QoMi) index is defined as a Cobb-Douglas function (Burkett, 2006) of the accessibility for each purpose obtained from the Destination Selectivity Model, as follows.
The allocation parameter Rp for each purpose's accessibility is determined by the relative proportion of trips for each purpose within the operating area Z of the DRT service. In this study, we considered three purposes for everyone: commuting (p = comm), shopping (p = shop), and other private use (p = priv). Additionally, since Rp is a relative proportion, Rcomm + Rshop + Rpriv = 1.
As shown in these calculations, the ideal value (and maximum value) of QoMi is 0. However, it is generally not zero and often takes a negative value. In other words, this value can be interpreted as indicating “how far the current mobility state is from the ideal mobility state.”
2.3 Calculation of costs
Additionally, we develop the cost model. This model could calculate the municipality's cost to operate public transportation services based on data obtained from the QoM model. This enabled quantitative comparisons of the costs associated with providing public transportation services.
In this study, we focused on two policies: “operation of DRT” and “subsidies for taxi usage.” By varying the conditions of each policy, we created various scenarios. Here, Inturri et al.'s research (2021) can be cited as an example that deals with DRT and taxis. They employed agent-based simulation to investigate the conditions under which Demand Responsive Shared Transport (DRST, closely resembling DRT) offers advantages over conventional taxi services within the city of Ragusa, Italy, a locale characterized by limited public transportation options. Their findings suggested that while maintaining taxi services proved efficient in areas with low demand, DRST exhibited superiority in terms of transportation cost reduction and other relevant metrics in areas experiencing high demand. Nevertheless, while this study evaluated the transportation system itself using various indicators, it did not assess changes in the mobility level of each person in the target area. Our study differs in that it can evaluate individual mobility levels, including other mobility services and geographical factors, by using QoM.
Below, we describe the costs associated with operating each service.
2.3.1 Operation of DRT
The financial flow involved in operating DRT includes operating costs and fares. Operating costs represent an expenditure for the municipality, while fares generate revenue.
2.3.1.1 Operating cost of DRT
The operating costs of DRT can be divided into fixed costs, such as system usage fees and vehicle maintenance costs (in this study, the number of buses is fixed), and variable costs, such as fuel costs. Therefore, we used a linear equation to calculate them.
Then, we substitute the total demand for DRT, , obtained from the Destination Selectivity Model of the QoM model, normalized by the number of trips, norm_TDRT, into the derived equation to calculate the operating costs.
2.3.1.2 DRT fare
The total fare for DRT Total_FareDRT can be calculated by multiplying the number of DRT trips norm_TDRT by the fare per trip, FareDRT.
2.3.2 Subsidy for taxi usage
The amount of subsidies for taxi usage, SubTaxi, is calculated based on data from the Chugoku Transport Bureau, Ministry of Land, Infrastructure and Transport (2020), with slight modifications. While there are two methods for determining the amount of subsidies—fixed-amount subsidies, where a fixed amount is subsidized per trip, and fixed-rate subsidies, where a certain percentage is subsidized per trip—this study only considers proportional subsidies.
First, the total taxi demand from o to d is calculated as follows:
Next, the total amount of subsidies for travel from o to d is calculated by multiplying the taxi fare from o to d by the subsidy rate r and the total taxi demand . By calculating this for all origins and destinations and summing them up, the total amount of subsidies SubTaxi is obtained.
In summary, the total cost of operating public transportation services can be calculated as follows:
Simulations were conducted for each scenario, and the results were output in the form of the QoM distribution for all targeted individuals and the total cost incurred by the municipality. By comparing the results of each scenario in terms of QoM and cost, we aimed to identify the optimal policy or gain useful insights.
3 Case study
3.1 Case study target
This study conducted a case study in Narita City, Chiba Prefecture, which currently operates a DRT service. The general shape of Narita City is shown in Figure 3. As of March 2023, Narita City has a population of 131,148 and an older individuals' population ratio of 24.3%. Narita City is currently divided into 10 statistical areas. The southern part of the city, centered around the three areas of Narita, New Town, and Kozu, which account for more than 60% of the total population, is home to major commercial facilities, hospitals, and airports. On the other hand, the northern part is a rural area with few such facilities.
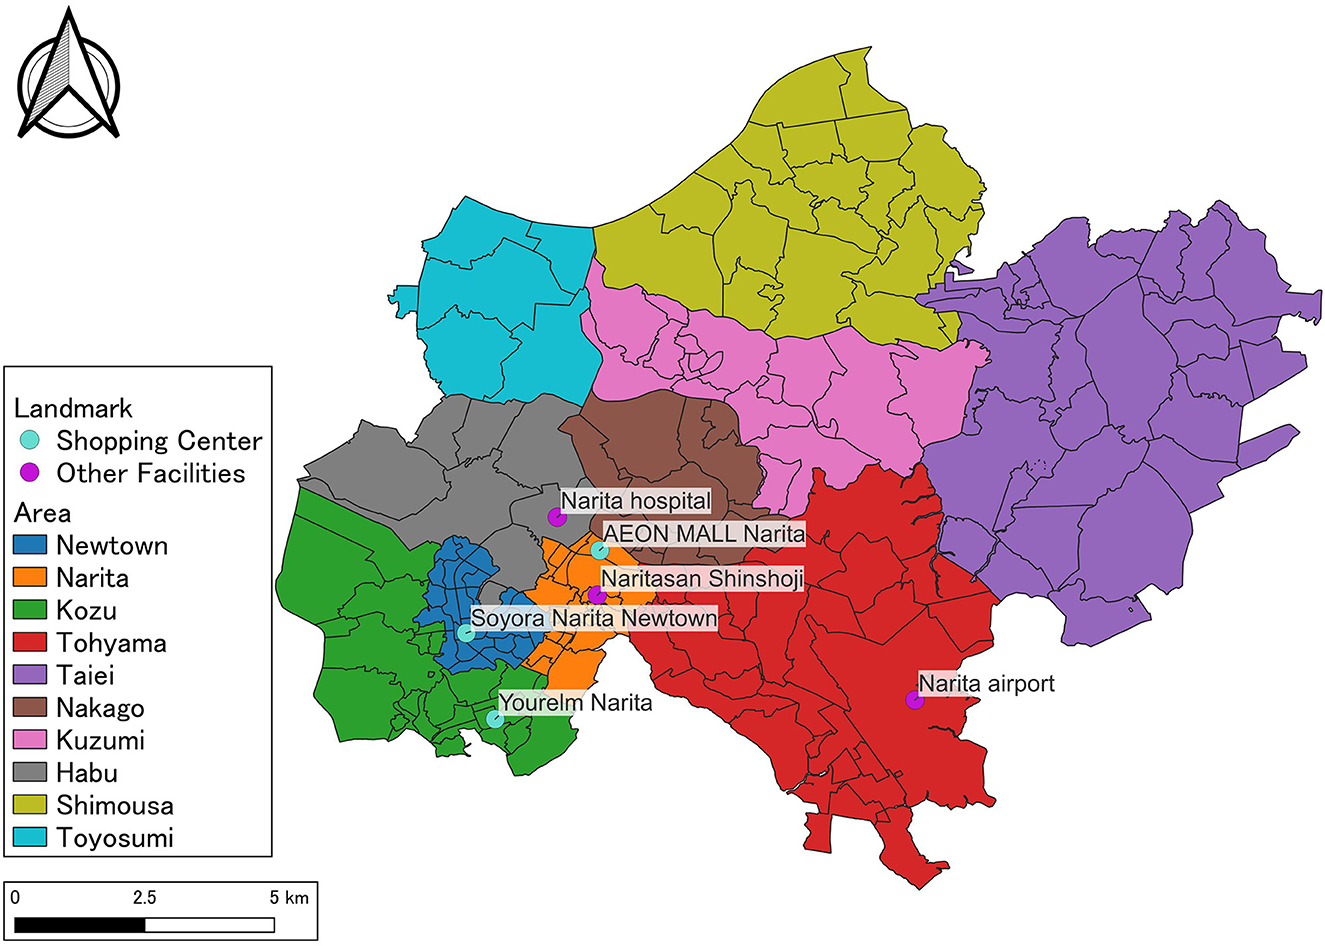
Figure 3. Narita City.
3.2 Parameter fitting
To construct each model, we used various data from Narita City described Section 2.1 and estimated parameters. Table 3 shows the value of each parameter used for Narita City data.
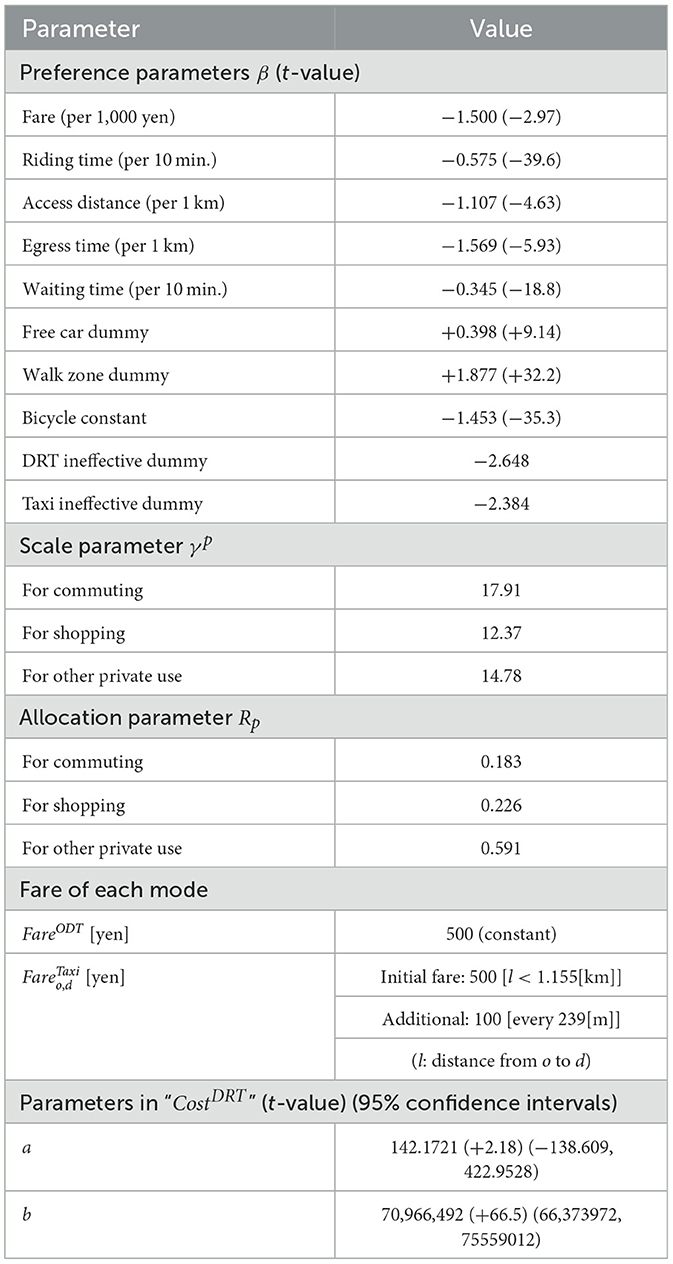
Table 3. Value of each parameter.
Regarding the parameters β obtained through maximum likelihood estimation, all parameters conformed to the expected sign conditions. Furthermore, the significance of each parameter at the 1% level was confirmed based on the t-values.
The scale parameter γp was estimated based on the number of trips for each travel purpose obtained from DRT operation data, and trip data of Narita City residents aged 70 and older, and the allocation parameter Rp was derived from the total number of trips for each purpose within the trip data.
FareODTand were determined from Narita City data directly, and a and b in the cost model were determined by the method described in 2.3.3.1, based on data from the past 4 years, considering price increases. The significance of each parameter at the 5% level was confirmed based on the t-values.
3.3. Public transportation policy scenarios' setting
In the following sections, we evaluated public transportation services using the constructed models. These evaluations were conducted for residents aged 70 and over. In this research, we focused on two policies: the convenience of DRT and the taxi subsidy system.
3.3.1 Convenience of DRT
To use DRT, residents must go to bus stops scattered in various locations at the reserved time. Thus, in this study, the number of bus stops was used to represent changes in the convenience of DRT. As the number of bus stops increased, the convenience improved, and conversely, as the number of bus stops decreased, the convenience decreased. In addition, DRT bus stops were not as well-maintained as those for regular buses. The cost of installing new bus stops was almost negligible.
3.3.2 Taxi subsidy system
A taxi subsidy system was established where the municipality pays a portion of the taxi fare for residents. The subsidy rate varied for each scenario. Table 4 shows the description of each scenario.
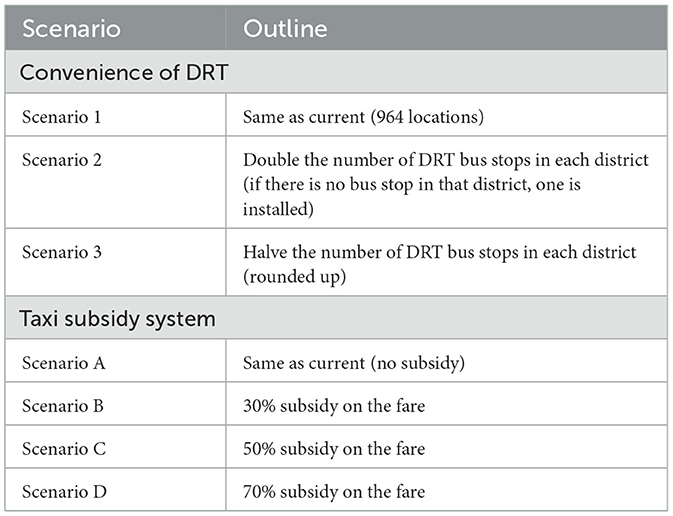
Table 4. Options for each policy decision.
In the following, each scenario combining these two types of policies is denoted by its number connected by a hyphen (For example, the current scenario is represented as “1-A”).
3.4 Evaluation of current services (Scenario 1-A)
Firstly, to examine mobility trends among residents, we evaluated the current public transportation policy scenario in Narita City (operating DRT, no taxi subsidy system). The histogram and cumulative distribution of QoM with the population as the frequency are shown in Figure 4. This indicated a distinct bimodal distribution of the QoM, with a pronounced division occurring at a QoM value of −35. The lower QoM group accounts for ~20% of the total population. Conversely, this means that ~80% of the population maintains a certain level of mobility or higher.
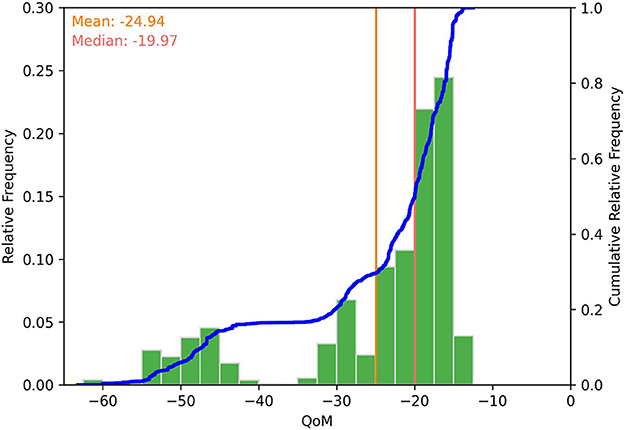
Figure 4. Distribution of QoM in current public transportation services (Scenario 1-A). The green bars indicate the relative frequency, while the blue line represents the cumulative relative frequency. The distribution is bimodal, with ~20% of the population belonging to the lower QoM group.
To further explore this heterogeneity, Figure 5 presents box plots of QoM stratified by area and age group. The age group is represented on the horizontal axis, and the districts are indicated by color. It's important to note here that due to the bimodal distribution, there are many outliers in the box plot. The results suggested a positive correlation between age and the likelihood of belonging to the low QoM group. And in urban areas like Newtown and Narita, a substantial proportion of residents under 85 had a QoM of −30 or higher. However, this trend reversed sharply for those aged 90 and over. On the other hand, in rural areas such as Habu, Shimousa, and Toyosumi, a certain proportion of residents had low QoM from the age of 70, and this proportion became the majority among those aged 85 and over. These findings suggest that while urban areas have developed infrastructure that supports independent living within their boundaries, rural areas lack such infrastructure, making car use indispensable for daily activities.
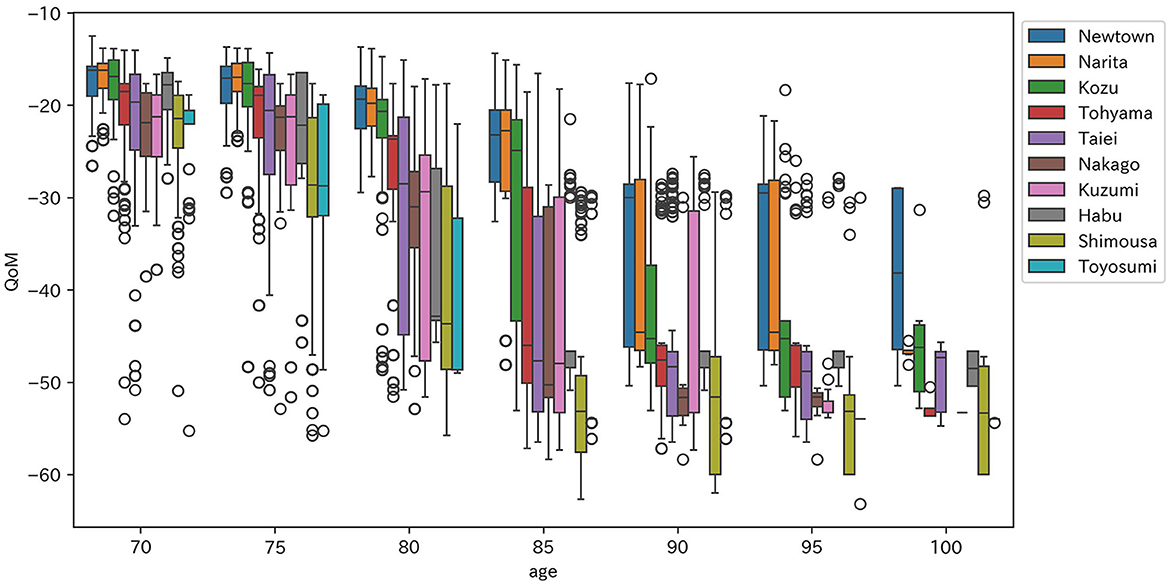
Figure 5. Distribution of QoM in Scenario 1-A by area and age group. This figure shows that the proportion of residents belonging to the lower QoM group increases with age and is higher in rural areas.
The total cost for this scenario was 73,332,678 JPY. In the following sections, we compare scenarios based on these values.
3.5 Scenario evaluation
Next, we evaluated the changes in QoM and costs when various policy scenarios were implemented. Figure 6 shows the QoM for residents and the total cost incurred by the municipality for each of the 12 scenarios. Because there are no significant differences among the scenarios, this figure presents the percentage change in QoM and cost relative to Scenario 1-A to represent the differences between the scenarios more clearly. Note that “Upper Average” represents the mean QoM of individuals with a QoM score of −35 or greater in baseline scenario 1-A, and “Lower Average” denotes the mean QoM of those with a QoM score below −35. Furthermore, “Top 5%” and “Bottom 5%” refer to the QoM values corresponding to the 95th and 5th percentiles of the QoM distribution, respectively.
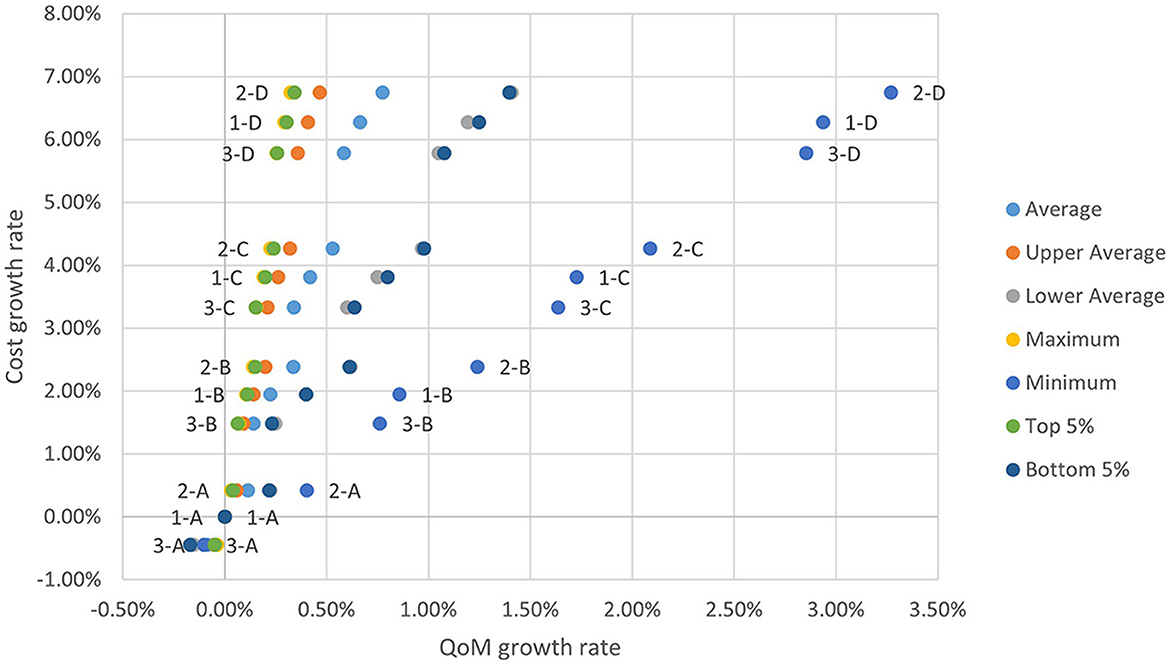
Figure 6. Comparison of QoM and cost (change ratio). Both improving DRT convenience and introducing a taxi subsidy system show a high impact on residents who currently have low QoM values.
A comparison of costs revealed that while total costs remained relatively stable across different levels of DRT effectiveness, taxi subsidies resulted in a substantial increase of about 2% (over one million yen) for each increment in the subsidy rate. On the other hand, focusing on the distribution of QoM, it was found that both improving the convenience of DRT and providing taxi subsidies had a greater effect on residents with currently low QoM. Nevertheless, the magnitude of change in QoM attributable to these additional scenarios was relatively modest when considered in the broader context.
4 Discussion
Based on the results presented in Chapter 3, this chapter conducts further analyses and discussion from various perspectives.
4.1 Feasibility of implementation: budget and governance constraints
In this section, we'll examine the characteristics of each policy and discuss their feasibility.
4.1.1. Mobility equity among residents
First, we evaluate mobility equity among residents, that is, whether the mobility level of each resident is evenly distributed. To quantify the extent of mobility inequality across different scenarios, we employ the Gini coefficient, a standard measure of inequality. A lower Gini coefficient indicates a more equitable distribution, while a higher value suggests greater inequality. To examine potential disparities in mobility equality and its changes between urban and rural settings, we selected Newtown and Shimousa as representative cases and computed the Gini coefficient of QoM for each scenario. The results for change ratio from Scenario 1-A are summarized in Table 5.
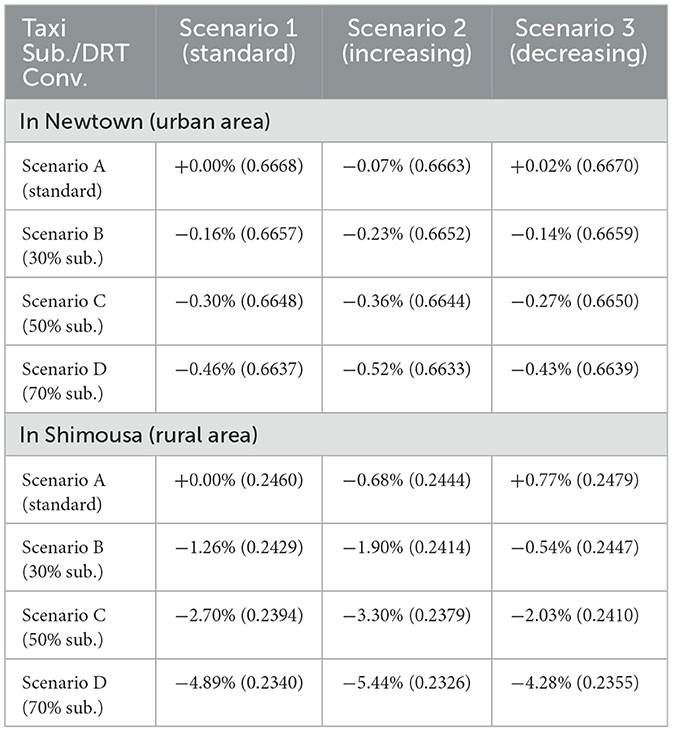
Table 5. Comparison of Gini coefficients (change ratio and values).
The reason why the value in Scenario 1-A for the urban area is larger than that for the rural area is that there are a few residents with low QoM in the urban area. These results indicate that taxi subsidies have a certain degree of effectiveness in reducing mobility disparities among residents and that the effect is stronger in depopulated areas.
In addition, according to Figure 6 shown in Section 3, when comparing the scenario of doubling the number of DRT bus stops (Scenario 2-A) with the scenario of reducing the number of DRT bus stops by half while increasing the taxi subsidy rate by one level (Scenario 3-B), the latter scenario incurs higher costs, but the rate of increase in the average QoM is almost the same. Furthermore, as shown in Table 5, there is no significant difference between those two scenarios regarding the Gini coefficient. This suggests that at least reducing DRT and increasing the taxi subsidy rate might incur high costs relative to the effectiveness. This result is also supported by the Chugoku Transport Bureau, Ministry of Land, Infrastructure and Transport (2020), which stated that 56% of municipalities that have introduced taxi subsidy systems reported securing financial resources as a challenge, indicating the high-cost barrier associated with implementing this system.
These results provide an important basis for making efficient policy choices within a limited budget.
4.1.2 Effect of each DRT convenience and taxi subsidy
Next, we focus on two scenarios: Scenario 2-A (DRT convenience improvement) and Scenario 1-B (30% taxi subsidy), and investigate their mobility improvement effects.
Figure 7 shows the distributions of QoM increases for each resident in Scenario 2-A and Scenario 1-B compared to the current scenario (Scenario 1-A). Residents are divided into four groups based on their QoM values in Scenario 1-A. A paired t-test performed on these two data sets resulted in a t-value of −100.7, indicating a significant difference even at the 1% level. So we examine the differences in these distributions. From this figure, both scenarios have a greater impact on residents with lower QoM. Furthermore, taxi subsidies (Scenario 1-B) have a higher overall effect on improving QoM compared to improving DRT convenience (Scenario 2-A). On the other hand, while improving DRT convenience does not have as strong an effect as taxi subsidies, it has a significant impact on some residents with low QoM.
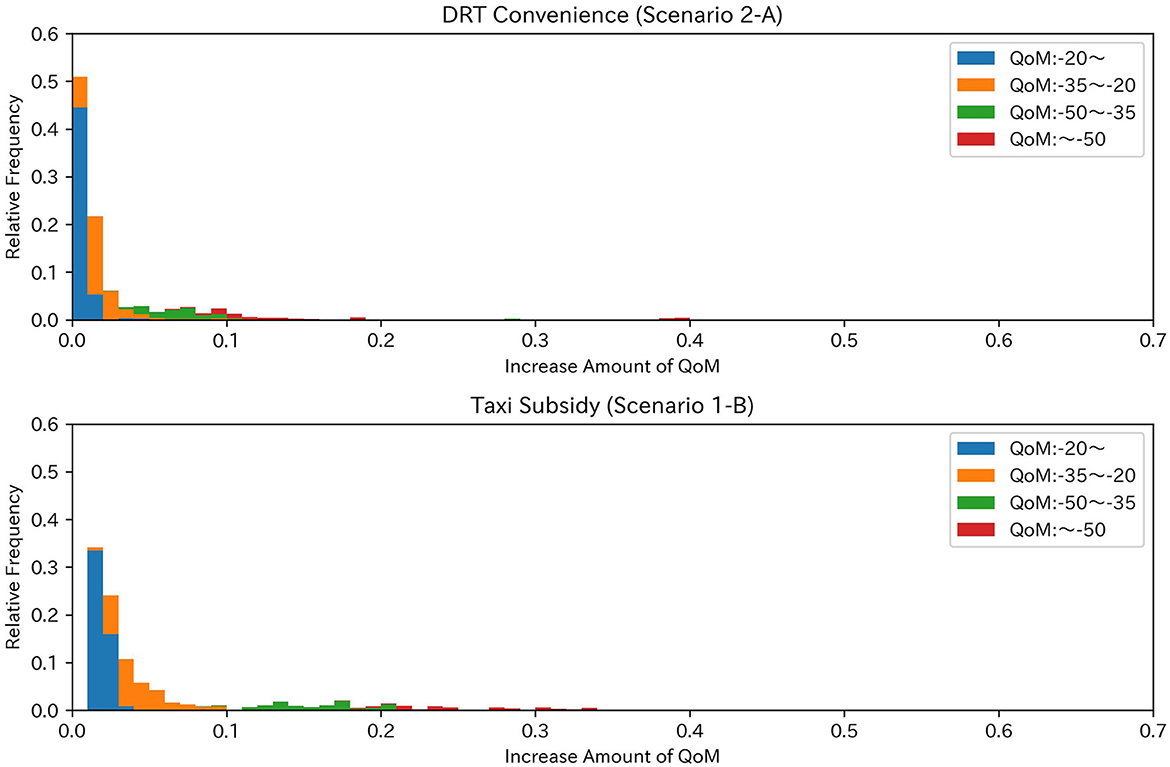
Figure 7. QoM increases from the current situation. A paired t-test performed on these two distributions yielded a t-value of −100.7, indicating significance at the 99% level.
4.1.3 Characteristics of DRT convenience effectiveness
In the previous subsection, we examined the effects of DRT convenience improvement and taxi subsidies and found that DRT had a particularly strong impact on some residents. In this section, we will discuss this finding in detail.
Table 6 shows several residents who strongly benefited from DRT convenience improvement and taxi subsidies, respectively. Note that only one resident is shown for those with identical attributes that do not affect QoM values. This table shows that residents who strongly benefit from taxi subsidies are scattered among transportation-disadvantaged people in various regions, particularly in the northern part. Notably, the top three individuals are the same as the three with the lowest QoM values in the current scenario, indicating that this scenario is highly effective for transportation-disadvantaged individuals. On the other hand, residents who strongly benefited from DRT convenience improvements are concentrated in the Taiei area.
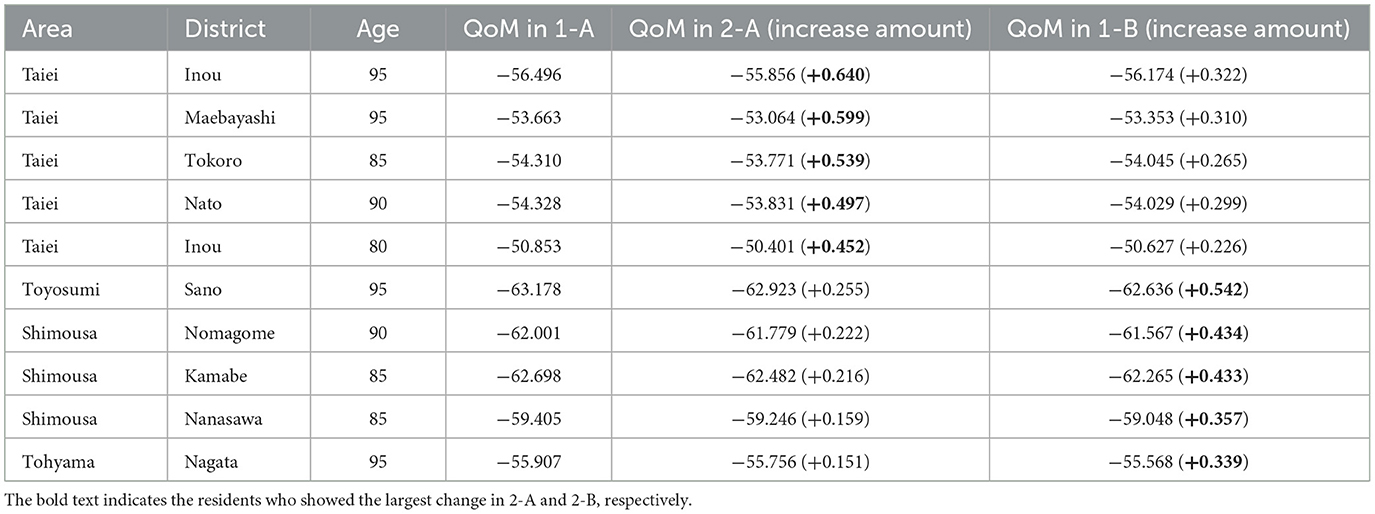
Table 6. The five most impacted residents in scenario 2-A and Scenario 1-B.
Figure 8 shows a map of the current density of DRT bus stops by district. The redder the color of the district, the higher the density of DRT stops. While it is natural that the density of DRT bus stops is high in the southwestern part of the city, which is highly urbanized, the map also shows that the density of bus stops is high in the Taiei area. In other words, Scenario 2 has been shown to be more beneficial for residents who already live in areas with high DRT convenience. On the other hand, it is found to be less effective for residents who originally had low DRT convenience. One possible policy option for the future is to focus on residents who frequently use DRT and have low QoM, and to prioritize the installation of DRT bus stops in locations that are easily accessible to these residents.
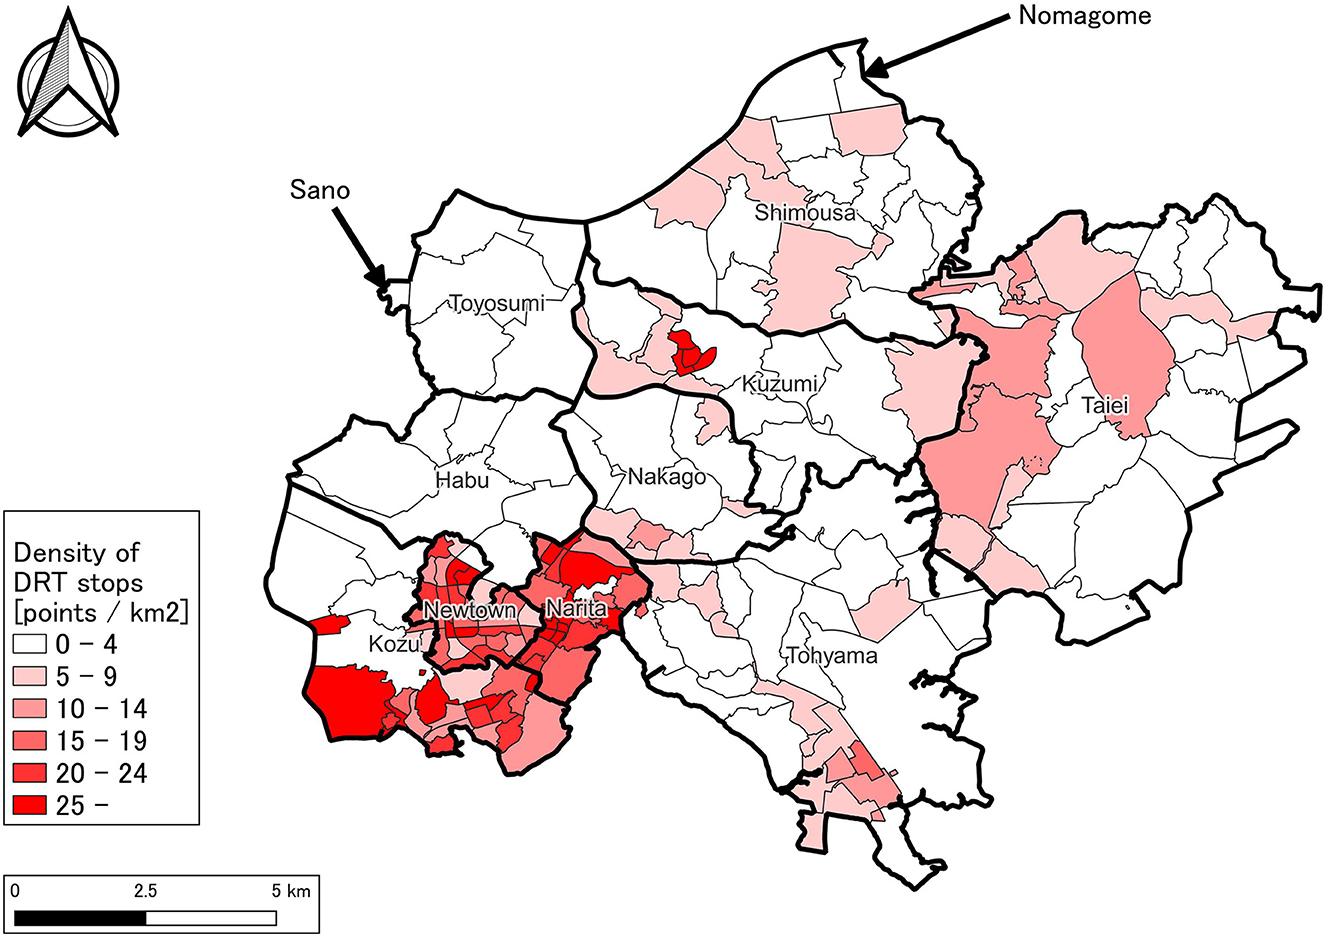
Figure 8. Density of DRT stops. The redder the color of the district, the higher the density of DRT stops.
From these discussions, it's clear that implementing policy requires the administration to possess governance capabilities that enable them to grasp local characteristics and respond flexibly.
4.2 Integration into decision-making: local policymaking applications
This section discusses how the results of this study can be reflected in local policymaking.
The indicators used in this study, such as QoM (Quality of Mobility) and the Gini coefficient, are valuable tools for policy formation as they can objectively visualize mobility inequality. As shown in Figure 5 in Chapter 3, it was clear that some residents in urban areas suffer from low QoM, and rural areas have a higher proportion of transportation-disadvantaged individuals. These analysis results suggest which regions should be prioritized for what kind of support when municipalities formulate policies. For instance, it's important to note that residents in remote areas may require urban planning interventions, such as the relocation of urban functions, as transportation improvements alone are unlikely to significantly enhance their QoM.
4.2.1 Geographical factors of Narita City
Figure 9 shows the distribution of QoM (in Scenario 1-A) according to whether a car can be used. Here, residents who can use a car have a Car Availability of 1, and those who cannot use it have a Car Availability of 0. This figure demonstrates that all residents who can use a car are classified within the high QoM group, whereas those who cannot use a car are predominantly found in the low QoM group. This disparity is particularly pronounced among rural residents, creating a substantial gap compared to other residents. In fact, all 10 residents listed in Table 6 cannot use cars. For these residents to use cars, they need someone else to drive. Therefore, if there is no such person, spontaneous mobility is difficult, and significant improvement is unlikely without municipal support.
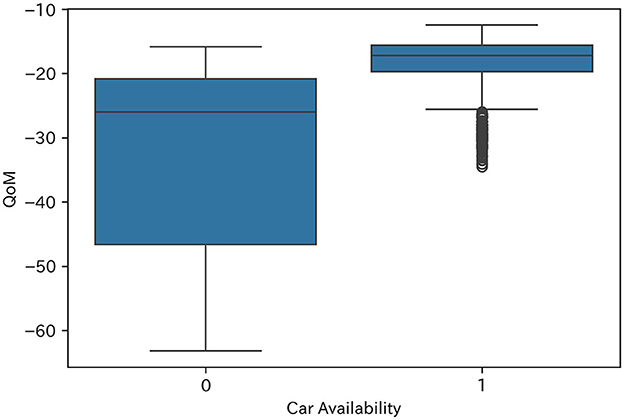
Figure 9. QoM in Scenario 1-A by car availability. This figure shows that all residents who can use a car belong to the high QoM group.
Now, let's take residents living in Sano and Nomagome, who have the lowest QoM. Figure 8 also illustrates the locations of Sano and Nomagome. As the map indicates, traveling to urban areas such as Newtown and Narita requires over 5 kilometers from Sano and over 10 kilometers from Nomagome, even when considering the straight-line distance. In other words, no matter how much public transportation is improved, it will still take a considerable amount of time to reach major facilities in the city.
Therefore, to improve the QoM of such residents and ensure equality of mobility throughout the city, it is necessary to fundamentally change not only from the mobility side but also from the perspective of urban development, such as locating essential facilities for living, like large hospitals and supermarkets, in more accessible locations.
This is echoed in similar research papers (Abduljabbar et al., 2021). For example, Shergold and Parkhurst (2010) investigated the mobility characteristics of residents in rural areas of the UK, where the aging population is progressing, and examined the feasibility of sustainable transportation. Their results showed that car use among older adults in rural areas is lower than average in areas where shops and hospitals are within walking distance, but higher than average in other areas. Therefore, they concluded that it is important for local governments to intervene in spatial planning for the location of major facilities such as hospitals, and that there is a need for sufficient discussion on the extent to which the public should be guaranteed access. Additionally, Kii et al. (2021) analyzed how policy reforms, such as bus route reorganization, might affect future demand in Takamatsu City, Kagawa Prefecture, which can be considered a medium-sized city. Their findings indicate that redesigned routes are expected to see increased demand, but this will eventually decline with future population decreases. Conversely, promoting a “compact city” approach leads to increased demand. Thus, they concluded that public transportation policies and land use policies have synergistic effects, and an urban spatial strategy is necessary to mitigate the decline in demand density for public transportation.
4.3 Equity considerations: mobility as a justice issue
This study quantitatively evaluated mobility equity using QoM and the Gini coefficient, clarifying which resident demographics are impacted by transportation policies. As shown in Table 6 (from Section 4.1.3), taxi subsidies were found to have a strong effect, especially for residents with low QoM, demonstrating their effectiveness as a support measure for transportation-disadvantaged individuals. However, Figure 9 also indicated that residents unable to use private cars remain in a disadvantageous position, highlighting that social support is essential to correct mobility disparities.
These results suggest that mobility equity should be viewed not merely as an issue of efficiency but as a “social justice issue.” Going forward, the ethical perspective of “who benefits fairly, and by what means” should be integrated into the design of transportation policies.
4.4 Limitations and future work
The QoM model used in this study has some simplifications for simulation purposes. For instance, it does not account for multiple transportation modes in a single trip, or control for individuals' physical mobility solely by age. Additionally, the model doesn't consider behavioral changes resulting from actual transportation policy shifts, such as increased awareness due to advertising effects. Therefore, one future improvement is to develop an enhanced model that considers these factors.
And when the findings from this study were shared with Narita City, the feedback was positive. However, to use these findings in actual decision-making, it's necessary to set objective functions that allow for a more appropriate interpretation of the results (e.g., whether to prioritize the QoM threshold or the average value). In summary, setting objective functions that align with the financial situation of municipalities is also identified as a future challenge.
5 Conclusion
This study aimed to find sustainable transportation policies that improve both the mobility of residents, particularly those who have difficulty moving independently due to the declining and aging population in rural areas, and the financial situation of municipalities.
Our analysis revealed that both increasing the convenience of DRT and implementing taxi subsidies can significantly improve the quality of mobility, especially for residents with low mobility. However, we found that the effect of QoM increase varied greatly depending on individual attributes, regional conditions, and costs. So, municipalities should choose measures that balance effectiveness and cost, such as taxi subsidies for transportation-disadvantaged individuals, in accordance with the characteristics of their residents.
Furthermore, transportation policies alone have limited effectiveness; to improve the QoM of residents in remote areas, it is necessary to review urban development and the placement of key facilities. Going forward, further research is needed to examine the policy effects considering a wider variety of resident attributes and behavioral characteristics, as well as to study the coordination with urban planning.
Data availability statement
The raw data supporting the conclusions of this article will be made available by the authors, without undue reservation.
Author contributions
TO: Writing – original draft, Conceptualization, Formal analysis, Investigation, Methodology, Software, Data curation, Validation, Visualization. KH: Writing – review & editing, Project administration, Supervision. TN: Writing – review & editing, Investigation, Project administration, Supervision.
Funding
The author(s) declare that no financial support was received for the research and/or publication of this article.
Acknowledgments
We would like to thank the members of our laboratory for their useful discussion.
Conflict of interest
The authors declare that the research was conducted in the absence of any commercial or financial relationships that could be construed as a potential conflict of interest.
Generative AI statement
The author(s) declare that no Gen AI was used in the creation of this manuscript.
Publisher's note
All claims expressed in this article are solely those of the authors and do not necessarily represent those of their affiliated organizations, or those of the publisher, the editors and the reviewers. Any product that may be evaluated in this article, or claim that may be made by its manufacturer, is not guaranteed or endorsed by the publisher.
References
Abduljabbar, R. L., Liyanage, S., and Dia, H. (2021). The role of micro-mobility in shaping sustainable cities: a systematic literature review. Transp. Res. Part D Transp. Environ. 92:102734. doi: 10.1016/j.trd.2021.102734
Awad-Núñez, S., Julio, R., Moya-Gómez, B., Gomez, J., and Sastre González, J. (2021). Acceptability of sustainable mobility policies under a post-COVID-19 scenario. Evidence from Spain. Transp. Policy 106, 205–214. doi: 10.1016/j.tranpol.2021.04.010
Basu, R., and Ferreira, J. (2021). Sustainable mobility in auto-dominated Metro Boston: challenges and opportunities post-COVID-19. Transp. Policy 103, 197–210. doi: 10.1016/j.tranpol.2021.01.006
Burkett, J. P. (2006). “Production and costs,” in Microeconomics: Optimization, Experiments, and Behavior, ed. J. P. Burkett (New York, NY: Oxford University Press), 44–59. doi: 10.1093/acprof:oso/9780195189629.003.0004
Chugoku Transport Bureau, Ministry of Land, Infrastructure and Transport. (2020). Towards the Use of the ‘Taxi Subsidy System' as a Regional Public Transport System (in Japanese). Available online at: https://wwwtb.mlit.go.jp/chugoku/00001_00503.html (Accessed February 17, 2025).
Currie, G., and Fournier, N. (2020). Why most DRT/micro-transits fail – what the survivors tell us about progress. Res. Transp. Econ. 83:100895. doi: 10.1016/j.retrec.2020.100895
Eitoku, Y., and Mizokami, S. (2008). A method on evaluation of differences in QoM among regions. Infrastruct. Plann. Rev. 25, 109–119. doi: 10.2208/journalip.25.109
e-Stat. (2016). Economic Census – Basic Survey/2014 Economic Census – Basic Survey/Aggregation by Town and District. Available online at: https://www.e-stat.go.jp/stat-search/files?page=1andtoukei=00200552andtstat=000001072573andtclass1=000001080756andcycle_facet=tclass1 (Accessed May 13, 2025).
e-Stat. (2022). National Census/2020 Population Census/Sub-regional Counting (Main Contents: Population by Basic Unit, Town, Street, Character, etc.). Available online at: https://www.e-stat.go.jp/stat-search/files?page=1andtoukei=00200521andtstat=000001136464andtclass1=000001136472 (Accessed May 13, 2025).
Eto, A. (2020). Mobility of elderly people in areas with traffic inconvenience, and desirable outing support measures (in Japanese). J. Rural Probl. 56, 62–69. doi: 10.7310/arfe.56.62
Geng, J., Shi, Q., and Dong, R. K. (2025). A systematic review of government measures to improve age-friendly transportation in the U.S., U.K., Japan, and China. Sustainability 17:2989. doi: 10.3390/su17072989
Griffiths, S., Furszyfer, D. R. D., and Sovacool, B. (2021). Policy mixes to achieve sustainable mobility after the COVID-19 crisis. Renew. Sust. Energy Rev. 143:110919. doi: 10.1016/j.rser.2021.110919
Hasselwander, M., Bigotte, J. F., Antunes, A. P., and Sigua, R. G. (2022). Towards sustainable transport in developing countries: preliminary findings on the demand for mobility-as-a-service (MaaS) in Metro Manila. Transp. Res. Part A Policy Practi. 155, 501–518. doi: 10.1016/j.tra.2021.11.024
Ho, C., and Tirachini, A. (2024). Mobility-as-a-Service and the role of multimodality in the sustainability of urban mobility in developing and developed countries. Transp. Policy 145, 161–176. doi: 10.1016/j.tranpol.2023.10.013
Inturri, G., Giuffrida, N., Ignaccolo, M., Le Pira, M., Pluchino, A., Rapisarda, A., et al. (2021). Taxi vs. demand responsive shared transport systems: an agent-based simulation approach. Transp. Policy 103, 116–126. doi: 10.1016/j.tranpol.2021.01.002
Japan Transport and Tourism Research Institute. (2023). Recommendations on Measures to Ensure Mobility for the Older adults (in Japanese). Available online at: https://www.jttri.or.jp/202306_Elderly_People_teigen.pdf (Accessed May 21, 2025).
Kii, M., Goda, Y., Tamaki, T., and Suzuki, T. (2021). Evaluating public transit reforms for shrinking and aging populations: the case of Takamatsu, Japan. Fut. Transp. 1, 486–504. doi: 10.3390/futuretransp1030026
Ministry of Land Infrastructure, Transport and Tourism. (2020). The First Basic Plan for Transport Policy (FY2014-2020) (in Japanese). Available online at: https://www.mlit.go.jp/sogoseisaku/transport/sosei_transport_tk_000057.html (Accessed February 17, 2025).
Ministry of Land Infrastructure, Transport and Tourism. (2023). National Land Information Download Site/Bus Stop Data. Available online at: https://nlftp.mlit.go.jp/ksj/gml/datalist/KsjTmplt-P11-2022.html (Accessed May 13, 2025).
Mizokami, S., Kamiya, S., and Tsuda, K. (2010). Applicability of QOM index to mobility evaluation of local public transport regeneration plan. Infrastr. Plann. Rev. 27, 881–892. doi: 10.2208/journalip.27.881
Páez, A., and Boisjoly, G. (2022). “Logit,” in Discrete Choice Analysis with R, eds. A. Páez and G. Boisjoly (Cham: Springer International Publishing), 85–104. doi: 10.1007/978-3-031-20719-8_4
Pandyaswargo, A. H., Siregar, T. H., and Onoda, H. (2023). Exploring Japan's older adults mobility challenges and the potential role of autonomous vehicles. Transp. Res. Part A Policy Pract. 176:103818. doi: 10.1016/j.tra.2023.103818
Said, Z. M., and Dindar, S. (2024). Key challenges and strategies in the evaluation of sustainable urban regeneration projects: insights from a systematic literature review. Sustainability 16:9903. doi: 10.3390/su16229903
Sakamoto, Y., and Morimoto, S. (2013). “Identifying the areas unsuitable for demand responsive transport (in Japanese),” in Proceedings of the Annual Conference of the Japan Society for Management Information 2013 (Autumn) (Tokyo: Japan Society for Management Information), 127–130.
Shergold, I., and Parkhurst, G. P. (2010). Operationalising ‘sustainable mobility': the case of transport policy for older citizens in rural areas. J. Transp. Geogr. 18, 336–339. doi: 10.1016/j.jtrangeo.2009.08.002
Tokyo Metropolitan Area Transportation Planning Council. (2021). Special page for the 6th Tokyo Metropolitan Area PT Survey (Conducted in 2018). Available online at: https://www.tokyo-pt.jp/special_6th (Accessed May 13, 2025).
World Economic Forum. (2021). Ageing Is Changing the Way We Move. Japan Shows How Transport Systems Can Adapt. Available online at: https://www.weforum.org/stories/2021/04/japan-ageing-population-transport (Accessed May 21, 2025).
Keywords: aging society, local public transportation, mobility, subsidy, transportation service planning
Citation: Ojima T, Hiekata K and Nakashima T (2025) A cost-effective strategy for enhancing mobility in aging communities: the case of Narita City. Front. Sustain. 6:1578781. doi: 10.3389/frsus.2025.1578781
Received: 18 February 2025; Accepted: 16 July 2025;
Published: 06 August 2025.
Edited by:
Adam C. G. Cooper, University College London, United KingdomReviewed by:
Ciro Gaona, Alzheimer's Foundation of Venezuela, VenezuelaSerdar Dindar, Yıldırım Beyazıt University, Türkiye
Copyright © 2025 Ojima, Hiekata and Nakashima. This is an open-access article distributed under the terms of the Creative Commons Attribution License (CC BY). The use, distribution or reproduction in other forums is permitted, provided the original author(s) and the copyright owner(s) are credited and that the original publication in this journal is cited, in accordance with accepted academic practice. No use, distribution or reproduction is permitted which does not comply with these terms.
*Correspondence: Takuto Ojima, b2ppbWEtdGFrdXRvNTcyQGcuZWNjLnUtdG9reW8uYWMuanA=