 Phimlikid Kaewhanam1†
 Kathanyoo Kaewhanam1*†
 Eko Priyo Purnomo2†
 Noppakun Thongmual3†
 Ariya Pongsiri1†
 Thitima Norrapoke4†
- 1Department of Public Administration, Faculty of Liberal Arts, Kalasin University, Kalasin, Thailand
- 2Department of Government Affairs and Administration, Jusuf Kalla School of Government (JKSG), University Muhammadiyah Yogyakarta (UMY), Yogyakarta, Indonesia
- 3Department of Statistics, Faculty of Sciences and Health Technology, Kalasin University, Kalasin, Thailand
- 4Department of Animal Production Technology, Faculty of Agricultural Technology, Kalasin University, Kalasin, Thailand
Introduction: Poverty remains a persistent and complex challenge in Thailand, particularly in structurally disadvantaged provinces such as Kalasin. Despite multiple national development strategies, poverty rates in Kalasin have remained consistently high over the past decade. This study addresses the structural factors influencing poverty alleviation using the Sustainable Livelihood Framework (SLF) as the theoretical lens.
Methods: A longitudinal quantitative design was applied using household survey data from 2020 (n = 9,390), 2021 (n = 2,549), and 2023 (n = 1,949). The analysis focused on five forms of livelihood capital—human, physical, financial, natural, and social—and examined their changing significance over time. Structural Equation Modeling (SEM) was used to evaluate interrelationships among these capitals and their impact on poverty outcomes. Model robustness was ensured through confirmatory factor analysis (CFA), bootstrapping for bias correction, and multicollinearity diagnostics using VIF scores. Model fit was excellent across all years (RMSEA < 0.01, CFI and TLI > 0.98).
Results: Financial capital was the dominant contributor to poverty reduction in 2020 and 2023, whereas social capital exhibited the strongest influence in 2021, reflecting the short-term benefits of community-based support during economic and social stress. Human capital maintained a moderate and stable effect across all years, while physical capital consistently showed the least contribution to poverty alleviation.
Discussion and conclusion: The findings suggest that poverty alleviation in Kalasin requires an integrated policy approach that combines capability enhancement with structural responsiveness. Investments should prioritize financial capital while fostering social and human capital resilience, particularly during times of crisis. This research provides a predictive model for capital investment prioritization and contributes to policy design for sustainable poverty reduction in rural provinces.
Introduction
Poverty alleviation remains one of the most pressing challenges across developing regions, particularly in structurally impoverished provinces where persistent inequality, limited infrastructure, and restricted access to basic services hinder sustainable development. In Thailand’s northeastern region (Isan), structural disparities in education, employment opportunities, and public service delivery continue to shape entrenched poverty cycles. Kalasin Province exemplifies this condition— consistently ranking among the 10 poorest provinces nationwide over the past decade, despite national development strategies that aim to reduce inequality. According to the National Economic and Social Development Council, more than 30% of households in Kalasin earn below the national poverty threshold, and the province exhibits a multidimensional poverty index significantly higher than the national average.
Although Thailand has made commendable progress in reducing national poverty rates, there remains a notable implementation gap between centralized poverty alleviation policies and local realities in persistently poor provinces. Top-down programs often fail to address context-specific needs, resulting in policy misalignment, inefficient resource allocation, and limited community ownership. This disconnect underscores the urgency of adopting locally grounded, needs-based approaches informed by integrative development planning, especially in regions marked by long-term deprivation and structural disadvantage.
The Sustainable Livelihood Framework (SLF), widely adopted in development studies, offers a holistic analytical lens to examine poverty through five interrelated capitals: human, physical, financial, natural, and social (Ngamwong et al., 2024). Each capital plays a distinct role—human capital through education enhances income potential. Physical capital improves access to infrastructure and markets (Jingyi and Wang, 2023); financial capital supports resilience and investment capacity (Huang et al., 2024; Arinaitwe, 2024); natural capital sustains livelihoods via ecosystem services (Shi et al., 2023); and social capital fosters collective action and access to opportunity (Jingyi and Wang, 2023). Yet, despite its relevance, prior studies have rarely examined how the significance of each capital evolves over time or varies geographically within Thailand. Most existing research is crosssectional, limiting understanding of temporal capital dynamics in poverty reduction.
This study addresses that gap by employing a longitudinal approach—analyzing household survey data from 2020, 2021, and 2023— and applying confirmatory factor analysis (CFA) and structural equation modeling (SEM) to examine the relative and changing influence of each capital domain on poverty alleviation. Kalasin Province was chosen as a critical case due to its chronic poverty and policy relevance. The use of SEM enables the simultaneous modeling of latent constructs and their interrelationships, providing empirical rigor in capturing complex poverty mechanisms.
Ultimately, the study offers two core contributions: First, it provides a predictive model for identifying high-impact capital domains across time, supporting more adaptive and context-sensitive policy interventions. Second, it contributes methodological novelty by integrating the SLF with longitudinal SEM and applying it to sub-national policy design—a crucial step toward aligning national poverty strategies with local evidence in Thailand’s most vulnerable regions. This study operationalizes the Sustainable Livelihood Framework (SLF) by constructing latent variables for five forms of capital— human, physical, financial, natural, and social—each measured using multiple indicators. SEM is then employed to model their individual and combined effects on poverty alleviation outcomes across three time points.
Research hypotheses
Based on the empirical findings from the structural equation modeling conducted in 2020, 2021, and 2023, the following hypotheses are proposed:
H1: Financial capital was the most influential factor in poverty alleviation in 2020 and 2023.
H2: Social capital had the greatest impact on poverty reduction in 2021, but its influence declined by 2023.
H3: Human capital consistently demonstrated a moderate yet stable influence across all 3 years.
H4: Physical capital exhibited the least influence on poverty alleviation in all years under study.
H5: The relative influence of each type of capital—financial, human, social, natural, and physical—on poverty alleviation varied significantly across the years 2020, 2021, and 2023.
Relevant theoretical concepts
Theoretical framework: revisiting livelihood capitals through the sustainable livelihood framework
The Sustainable Livelihood Framework (SLF) provides a multidimensional lens for understanding how households mobilize and combine human, financial, natural, social, and physical capital to sustain and improve their well-being. Over time, the SLF has evolved into a flexible analytical tool, applied across diverse fields including poverty reduction, migration, health, tourism, and ecological transitions.
Several studies have reaffirmed that the interaction among these capitals is more influential than any single asset in shaping livelihood outcomes. Ma et al. (2024) show that in China’s government-led resettlement programs, the enhancement of financial and social capital significantly improves household resilience, particularly when mediated by proactive coping strategies. In Vietnam, Fahad et al. (2022) demonstrate that multidimensional poverty cannot be explained by income alone, but is strongly tied to deficits in human and financial capital.
SLF has also been applied to transitional systems. Singh et al. (2024) highlight how integrated capital gains can accelerate agrifood sustainability, while Yang (2024) stresses the importance of aligning capital access with community needs in biosphere reserves. Both underscore the role of context-specific institutional and spatial factors.
In line with these insights, Tabares et al. (2022) emphasize that theoretical perspectives, such as SLF, enhance the conceptual rigor of social entrepreneurship and sustainable development studies by explaining how resource-based and institutional dynamics influence livelihood transformation. To reflect the cultural and participatory dimensions of community development, Kunjuraman (2022a, 2022b) proposes the addition of socio-cultural capital to the SLF, particularly in communitybased tourism, where identity, local ownership, and social cohesion are key success factors. Similarly, Bvuma and Marnewick (2020) find that small enterprises in South African townships face capital constraints—particularly in ICT infrastructure and skills—that hinder upward mobility, reinforcing the need for integrated institutional support.
The SLF has also informed health and humanitarian studies. Timire et al. (2023) reveal that tuberculosis erodes multiple forms of household capital, making health shocks a pathway into chronic vulnerability. Wake and Barbelet (2020) argue that refugee livelihoods should be understood through how displaced people actively navigate capital constraints under restrictive legal and policy conditions. Across all studies, the SLF emerges not only as a framework for assessing assets, but as a dynamic model that reveals how capital interactions, access, and institutional structures shape the possibilities for sustainable livelihoods.
Theoretical perspectives on poverty alleviation
Recent research on poverty alleviation integrates theories from development economics, social justice, sustainable livelihoods, and organizational behavior. Moving beyond income redistribution, these perspectives emphasize structural transformation, institutional engagement, and human capabilities. Sen’s Capability Approach remains central. Duran (2024) emphasizes public reasoning and local empowerment, while Qizilbash (2021) frames it as a consequentialist but pluralist model. Stark and Budzinski (2021) enrich this by interpreting inequality as social stress, supporting equitysensitive policies. From a systems perspective, Dou et al. (2020) use agent-based models to show that household resilience, strategy flexibility, and asset diversity affect poverty trajectories. Similarly, Chattopadhyay et al. (2020) model poverty as a system-level phenomenon shaped by inter-agent dynamics.
Social entrepreneurship offers another lens. Moses et al. (2023) and Majeed et al. (2024) find that innovation, local engagement, and ecosystem development drive inclusive outcomes. Kistruck and Shulist (2021) propose market orchestration as a managerial strategy to reshape market structures and capabilities. Design and cultural revitalization also play roles. Li et al. (2022) use Actor-Network Theory to show how traditional crafts can enable economic inclusion. Spatial and institutional contexts matter, as shown by Tan et al. (2021) and Koch (2022), who stress place-based design and systemic redistribution. Kang et al. (2020) explore hybrid governance and subsidies to enhance povertyalleviation supply chains.
Together, these works reframe poverty as a multidimensional and dynamic condition shaped by resilience, capabilities, networks, spatial context, and institutional design—offering a comprehensive framework for sustainable and ethical development.
Contemporary policy frameworks and their application
Contemporary policy frameworks have emerged as vital tools for understanding complex governance systems, particularly in an era defined by multidimensional crises, institutional heterogeneity, and technological transformation. These frameworks offer diverse theoretical perspectives that capture how actors, institutions, and systems interact across time and scale.
Dodge and Metze (2024) proposed five distinct approaches to policy framing—sensemaking, discourse, contestation, explanatory, and institutional—each offering a different lens through which to interpret how policy problems are constructed and how framing influences decision-making. Their heuristic framework encourages scholars to reflect on underlying assumptions and select framing strategies appropriate to both normative and empirical goals. These approaches emphasize how interpretive processes, power struggles, and institutional dynamics jointly shape policy content. In public health, Haby et al. (2025) developed an integrated framework for evidence-informed policymaking that bridges technical analysis with political reality. They proposed nine decision criteria, including cost-effectiveness, equity, feasibility, and stakeholder acceptability, while also emphasizing the importance of transparency, conflict-of-interest management, and participatory deliberation. This comprehensive model enhances the legitimacy and usability of scientific evidence in politically contested environments.
Leppänen and Liefferink (2022) applied the Multiple Streams Framework (MSF) to the case of the EU Just Transition Fund, highlighting how overlapping policy windows—such as the transition of the European Commission and the negotiation of the Multiannual Financial Framework—enabled certain political actors, notably the Socialists and Democrats in the European Parliament, to shape both the agenda and the formulation of the policy. The authors underscored that in EU multilevel governance, agenda-setting and policy formulation often occur simultaneously, driven by both institutional structure and actor strategy.
Tomai et al. (2024) focused on policy design for sustainability transitions. They proposed a three-stage framework encompassing baseline assessment, visioning of future pathways, and implementation with continuous evaluation. This approach integrates systems thinking, participatory governance, and long-term adaptability, enabling policymakers to manage uncertainty and cross-sectoral complexity in sustainability-related issues.
Expanding policy theory to non-democratic regimes, van den Dool and Schlaufer (2024) analyzed the applicability of dominant frameworks like ACF, MSF, and PET within autocratic contexts. They argued that while these models retain analytical value, they must be adapted to address features such as centralized authority, limited pluralism, and restricted information flows. Their study emphasized the need for theoretical hybridization that incorporates the political dynamics specific to authoritarian systems.
Chan (2022) used a combination of MSF, ACF, and PEF to examine the adoption of fee-free education policies in Sub-Saharan Africa. His analysis revealed that political dynamics—particularly electoral incentives and the role of committed policy entrepreneurs—were more decisive than economic constraints. This underscores the explanatory power of political agency in driving reforms in developing countries.
Lopez-Fernandez (2021) addressed behavioral policy responses to online addiction, linking classic prevention models (primary, secondary, tertiary) with contemporary ecological theory. She argued for multi-level interventions involving individuals, families, schools, industry, and government, especially in light of increased digital dependency following COVID-19. This highlights the relevance of integrated prevention frameworks in addressing emerging behavioral risks.
Focusing on digital governance, Modiba (2022) proposed a policy framework for implementing artificial intelligence in institutional records management. He emphasized the need for legal compliance, particularly with regulations such as PAIA and POPIA, alongside organizational readiness and infrastructure development. His framework illustrates how AI integration requires not only technical capacity but also policy alignment and institutional support.
Collectively, these contributions demonstrate that contemporary policy frameworks are deeply interdisciplinary and context-sensitive. They offer powerful tools for analyzing policy emergence, designing responsive interventions, and understanding how structural conditions, political agency, and stakeholder interaction converge in shaping public decisions.
Materials and methods
Study design
This study employed a quantitative structural design utilizing Structural Equation Modeling (SEM) to investigate the interrelationships among multidimensional factors influencing poverty alleviation in rural Thailand. SEM was selected for its analytical strength in modeling latent constructs and observed indicators simultaneously, offering a robust framework for evaluating complex, multi-capital systems such as the Sustainable Livelihood Framework (SLF) (Wang, 2021).
Model estimation was conducted using LISREL software.
Compared to traditional multivariate techniques such as multiple regression, SEM was selected due to its capability to simultaneously model multiple interrelated latent constructs, account for measurement error, and test both direct and indirect effects—features particularly important in assessing multidimensional poverty reduction frameworks like the SLF.
Study area and sampling
The research focused on Kalasin Province, one of Thailand’s persistently impoverished areas, which was purposively selected due to its chronically high poverty incidence and limited economic mobility. The target population comprised households with annual incomes below 40,000 THB, consistent with the national poverty threshold. A stratified purposive sampling method was employed to capture temporal changes in poverty dynamics across three distinct survey years: 2020 (n = 9,390), 2021 (n = 2,549), and 2023 (n = 1,949). Stratification was based on district-level poverty severity, and sample quotas were proportionally allocated. Collaboration with local government units, village leaders, and community organizations facilitated access and enhanced data accuracy.
Instrument development
A structured questionnaire was developed based on the five SLF capital domains: human, physical, financial, natural, and social capital. Human capital was measured through indicators such as educational attainment, vocational skills, and health status. Physical capital included access to infrastructure, utilities, and housing. Financial capital assessed income, savings, credit access, and debt. Natural capital involved access to arable land, water, and environmental resources, while social capital reflected participation in community groups, trust, and local networks. Each item was scored on a five-point Likert scale (1 = very low, 5 = very high). Content validity was confirmed by public policy experts, and pilot testing (n = 50) was conducted to refine item clarity. Reliability analysis revealed Cronbach’s alpha coefficients above 0.70 for all subscales (Tavakol and Dennick, 2011).
Data collection
Data were collected in 2023 through face-to-face interviews administered by trained enumerators. All participants provided informed consent, and ethical approval was obtained from the appropriate institutional review board. Field protocols ensured confidentiality, data quality, and respondent understanding. All participants provided informed consent, and ethical approval was granted by the Kalasin University Human Research Ethics Committee (Approval No. HSKSU037/2567).
Data analysis
Descriptive statistics were used to evaluate the distributional properties of all variables, including means, standard deviations, skewness, and kurtosis. SEM was conducted to assess both the measurement and structural models. Model fit was evaluated using Chi-square (χ2), the Root Mean Square Error of Approximation (RMSEA), the Goodness-of-Fit Index (GFI), and the Adjusted Goodness-of-Fit Index (AGFI). To improve robustness, additional indices were included:
the Comparative Fit Index (CFI) and the Tucker–Lewis Index (TLI), both exceeding 0.98. Construct validity was assessed via Pearson’s correlation coefficients, and the Kaiser-Meyer-Olkin (KMO) measure along with Bartlett’s test of sphericity confirmed sampling adequacy (Byrne, 2010). To address unequal sample sizes across years, bias-corrected bootstrapping (5,000 resamples) was applied. Multicollinearity was tested using Variance Inflation Factors (VIF), all of which were below 2.0, confirming the independence of predictor variables.
To ensure the robustness of the statistical analysis, both reliability and validity of the research instrument were rigorously assessed prior to model estimation. Internal consistency was verified using Cronbach’s alpha, with all five capital constructs derived from the Sustainable Livelihood Framework (SLF)—human, physical, financial, natural, and social—exceeding the threshold of 0.70, based on both pilot data and the full 2023 dataset (Tavakol and Dennick, 2011).
Construct validity was established through Confirmatory Factor Analysis (CFA). All observed variables loaded significantly onto their respective latent constructs (p < 0.01), with standardized coefficients ranging from 0.27 to 0.59. Model fit indices from CFA (RMSEA < 0.05; GFI and AGFI > 0.95) confirmed a satisfactory structural configuration. Convergent validity was supported by Average Variance Extracted (AVE > 0.50) and composite reliability scores (CR > 0.70), while discriminant validity was confirmed by comparing the square root of AVE with interconstruct correlations, indicating conceptual distinction among the five domains.
Sampling adequacy for multivariate analysis was verified using the Kaiser-Meyer-Olkin (KMO) measure (> 0.60) and Bartlett’s Test of Sphericity (p < 0.001). Additionally, all Variance Inflation Factor (VIF) values were below 2.0, ruling out multicollinearity.
The methodological framework was designed to capture not only the determinants of poverty but also their dynamic interactions over time. Grounded in SLF theory (Department for International Development, 2011; Ngamwong et al., 2024), the study employed a multi-stage approach beginning with conceptual alignment, followed by CFA to validate the measurement model, and culminating in Structural Equation Modeling (SEM) to assess both direct and indirect relationships. SEM was selected for its capacity to manage measurement error and model complex latent structures, which is particularly suited to social science research (Byrne, 2010; Wang, 2021).
By integrating longitudinal data from 2020, 2021, and 2023, the study moves beyond traditional cross-sectional approaches, offering a comparative framework that reveals year-to-year shifts in capital influence. The validated model confirms that all five capitals are statistically reliable predictors of poverty alleviation and provides a scalable empirical foundation for policy application in structurally disadvantaged regions of Thailand.
Results and discussion
Pre-analysis data examination for structural equation modeling
While Structural Equation Modeling (SEM) is generally appropriate for analyzing latent variables, the manuscript does not clearly justify why this method was chosen over simpler alternatives such as multiple regression. Although the study includes preliminary analysis of descriptive statistics— such as mean, standard deviation, skewness, and kurtosis—to assess the distribution of variables prior to SEM (Wiratchai, 1999; Angsuchoti, 2011), it lacks a theoretical or empirical rationale for why SEM is necessary in this context. Given that the model focuses on five dimensions of capital—human, physical, financial, natural, and social—the complexity of the relationships may indeed merit SEM. However, the paper should explicitly state that SEM was selected due to its ability to model multiple interrelated constructs simultaneously and account for measurement error—features that are not addressed by standard regression techniques. Without this clarification, the reader is left uncertain about the added value of SEM in explaining poverty alleviation dynamics in the studied provinces.
Results of basic statistical analysis for observed variables in 2020
The results of the basic statistical analysis are shown as follows:
Table 1 presents the descriptive statistics of the observed variables in 2020. The mean scores for all variables—HUC63, PHC63, FIC63, NAC63, and SOC63—range from 1.592 to 2.283, indicating generally low levels of perceived capital among respondents. Standard deviations vary from 0.169 to 0.649, all below 1.00, suggesting limited dispersion and relatively homogeneous responses. Skewness values reveal that HUC63 and PHC63 are negatively skewed, while FIC63, NAC63, and SOC63 exhibit slight positive skewness. Regarding kurtosis, most variables show values close to zero, with PHC63 and FIC63 being slightly platykurtic. These distributions indicate minor deviations from normality; however, the overall patterns suggest that the data approximate normal distribution sufficiently for further parametric analysis.
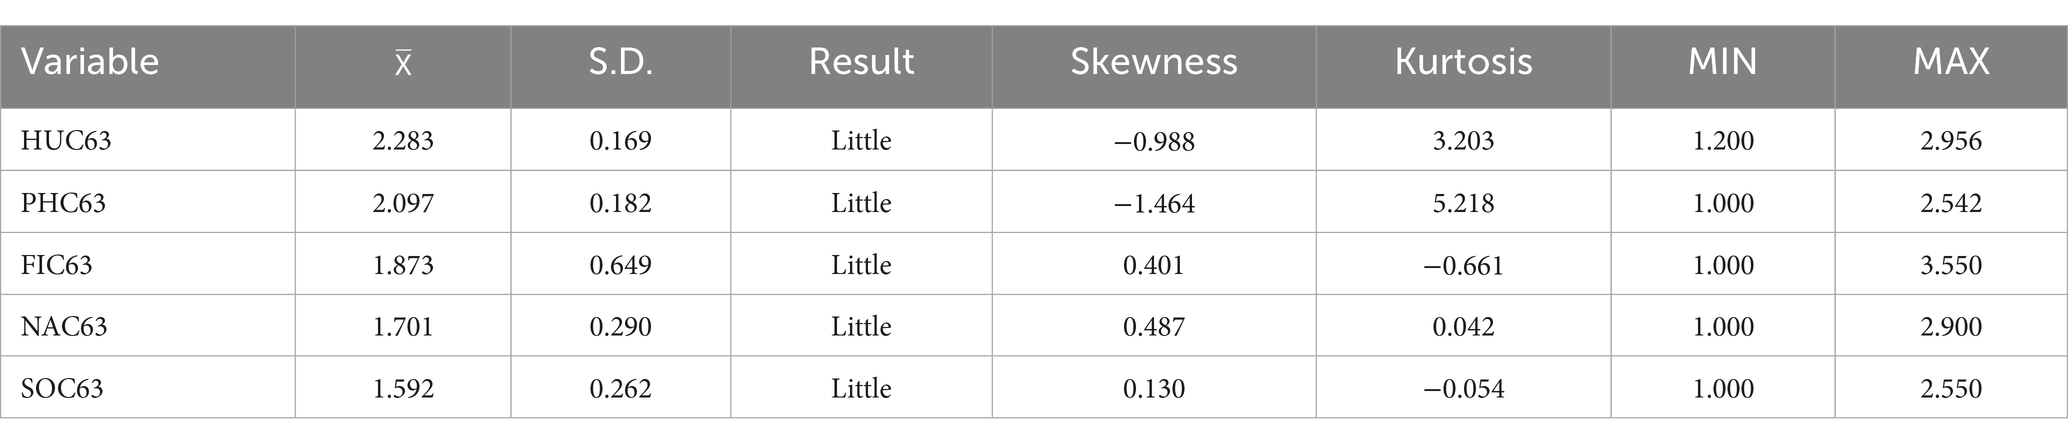
Table 1. Descriptive statistics for characteristics of observed variables in 2020.
Correlation coefficient analysis results for observed variables
To examine the suitability of the observed variables for structural equation modeling (SEM), Pearson’s product–moment correlation coefficients were calculated among the five observed indicators: HUC63, PHC63, FIC63, NAC63, and SOC63. The correlation matrix presented in Table 2 reveals that most variable pairs exhibit weak to moderate positive correlations (ranging from 0.092 to 0.157), while one pair (FIC63 and PHC63) shows a negligible negative correlation (r = −0.002). None of the coefficients exceed thresholds that would indicate multicollinearity concerns, suggesting that the observed variables are sufficiently distinct yet related. Table 2 displays the analysis results.
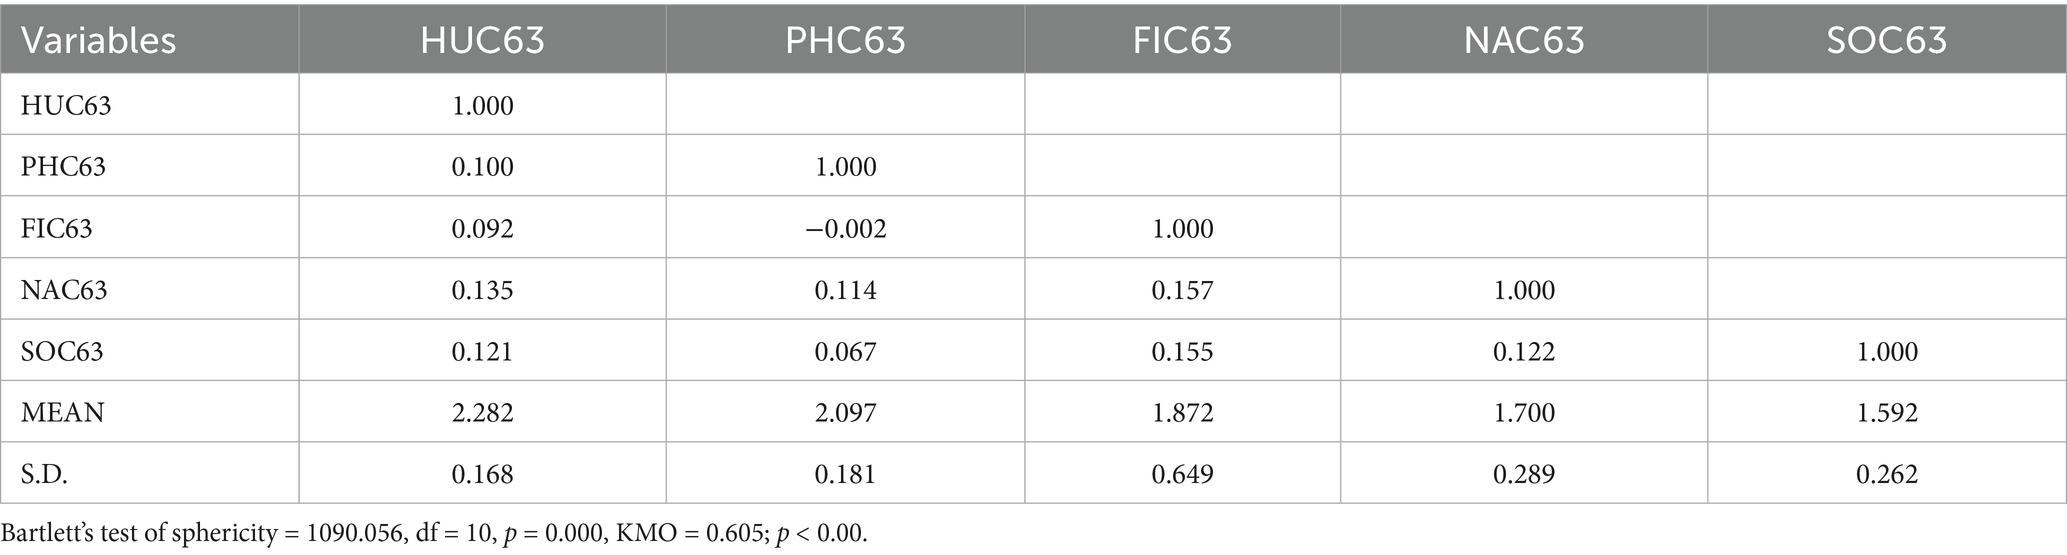
Table 2. Pearson correlation coefficients between observed variables.
To assess the overall adequacy of the correlation structure for factor analysis, the Kaiser Meyer-Olkin (KMO) measure and Bartlett’s test of sphericity were employed. The KMO value of 0.605 indicates moderate sampling adequacy, while Bartlett’s test was highly significant (χ2 = 1090.056, df = 10, p < 0.001), rejecting the null hypothesis of an identity matrix. Together, these results confirm that the observed variables possess adequate intercorrelations and are appropriate for subsequent latent construct modeling (Supamas Angsuchoti, 2011).
Construct validity analysis of the measurement model
The 2020 measurement model for poverty alleviation comprises five latent components: human, physical, financial, natural, and social capital. Pearson’s correlation analysis among the 10 observed pairs yielded low but statistically significant correlations (r = −0.002 to 0.157, p < 0.01), suggesting limited multicollinearity. Bartlett’s test of sphericity (χ2 = 1090.056, df = 10, p < 0.001) confirmed that the correlation matrix significantly differs from an identity matrix, indicating suitability for factor analysis.
The model demonstrated excellent fit with χ2 = 0.55 (df = 1, p = 0.460), RMSEA = 0.000, GFI = 1.00, and AGFI = 1.00. Standardized factor loadings revealed that financial capital (FIC63) contributed most strongly (loading = 0.45; R2 = 0.20), followed by human capital (HUC63 = 0.37), natural capital (NAC63 = 0.36), social capital (SOC63 = 0.34), and physical capital (PHC63 = 0.27). The findings confirm construct validity and support the structural representation of multidimensional capital in explaining poverty alleviation outcomes in 2020 (see Figure 1; Table 3).
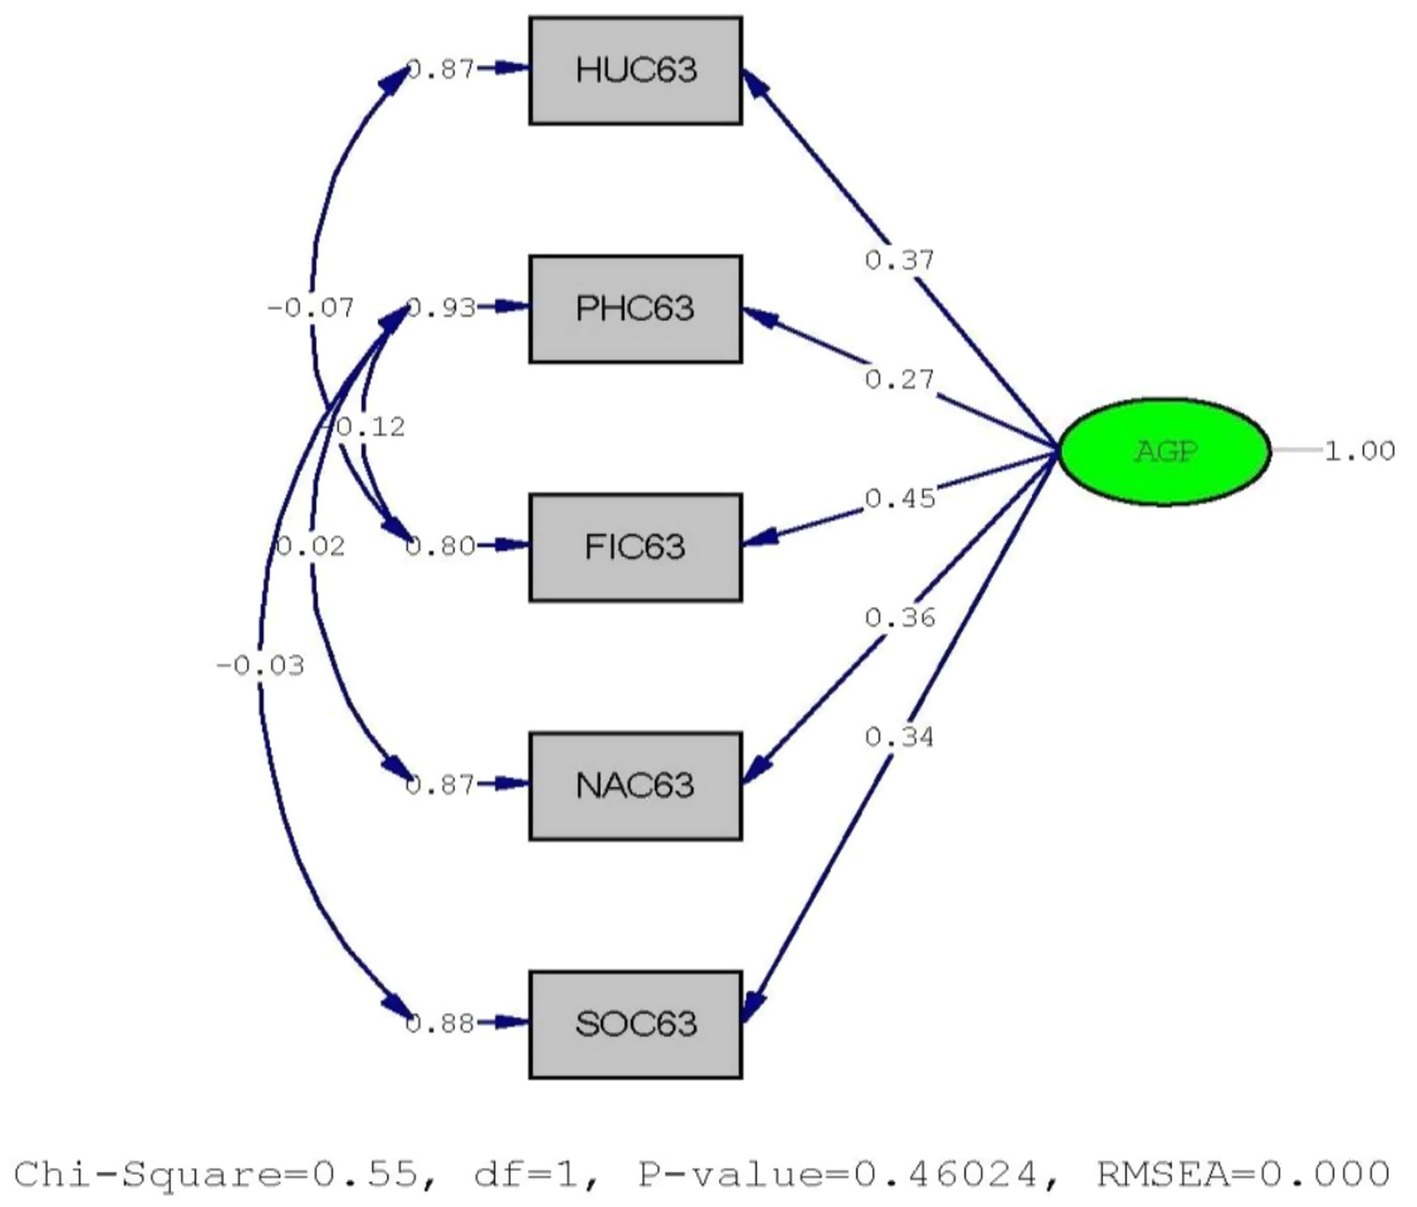
Figure 1. Measurement model for factors influencing poverty alleviation in 2020.
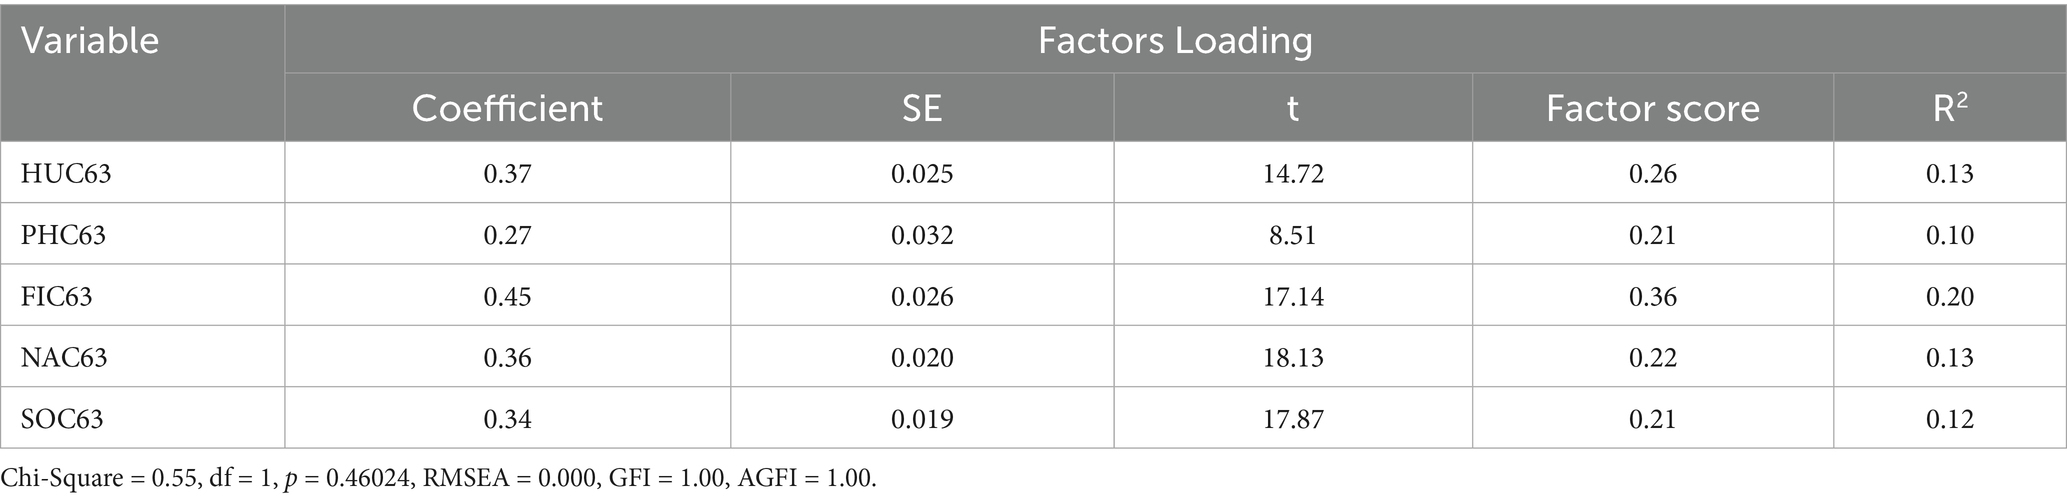
Table 3. Validity results of the measurement model for factors influencing poverty alleviation in 2020.
Confirmatory factor analysis was performed to validate the 2020 measurement model of poverty alleviation. All five observed variables—HUC63, PHC63, FIC63, NAC63, and SOC63— showed statistically significant factor loadings (t = 8.51 to 18.13). Financial capital (FIC63) had the highest loading (0.45) and explained variance (R2 = 0.20), followed by human capital (HUC63 = 0.37), natural capital (NAC63 = 0.36), social capital (SOC63 = 0.34), and physical capital (PHC63 = 0.27). The model fit indices indicated excellent fit (χ2 = 0.55, df = 1, p = 0.460; RMSEA = 0.000; GFI = 1.00; AGFI = 1.00). The measurement equation is:
AGP63 = 0.37·HUC + 0.27·PHC + 0.45·FIC + 0.36·NAC + 0.34·SOC.
Results of basic statistical analysis for observed variables in 2021
The basic statistical analysis results are as follows:
Summary of descriptive statistics for observed variables (2021)
As shown in Table 4, the mean values of all observed variables in 2021—HUC64, PHC64, FIC64, NAC64, and SOC64—ranged from 1.650 to 2.401, indicating generally low perceived levels of each capital dimension. Standard deviations were small (0.073 to 0.316), suggesting limited dispersion around the mean. Skewness values indicate that HUC64 and PHC64 are negatively skewed (−1.330 to −2.509), while FIC64, NAC64, and SOC64 exhibit moderate positive skewness (0.231 to 1. 422). All variables show substantial positive kurtosis (7. 546 to 28. 928), implying peaked distributions. Despite deviations from normality, the overall patterns are within acceptable bounds for further statistical analysis.
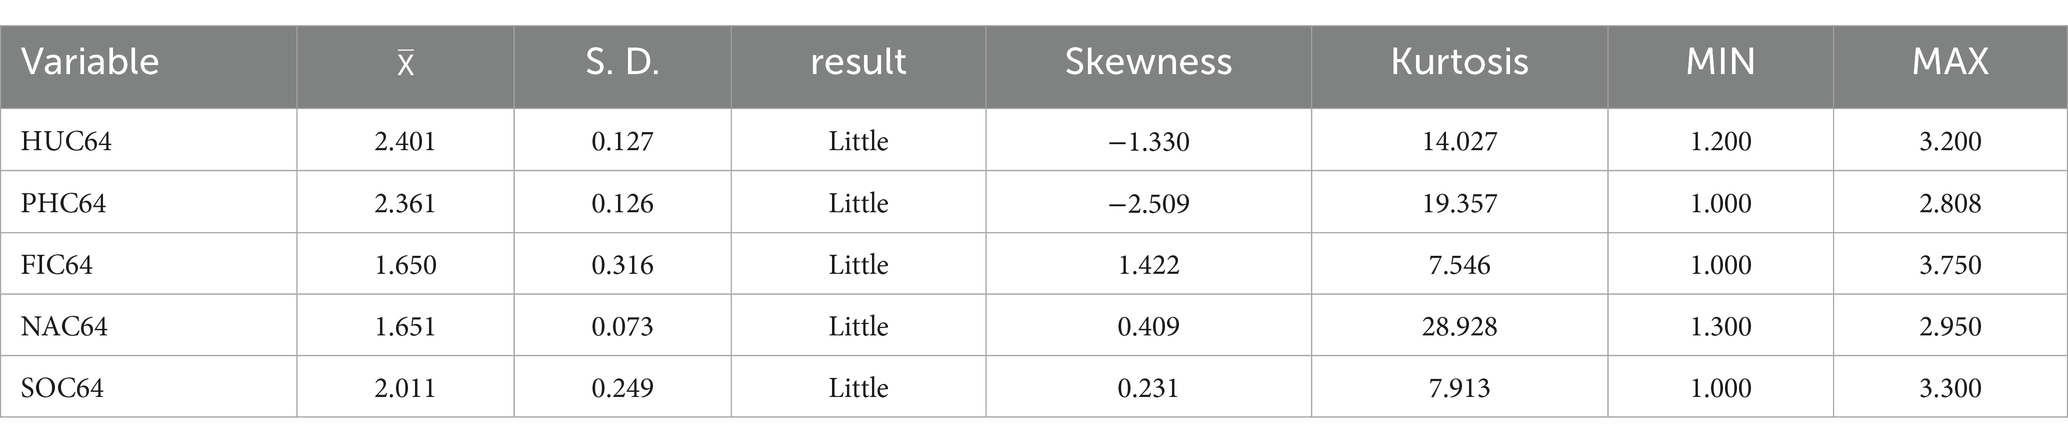
Table 4. Descriptive statistics for characteristics of observed variables in 2021.
Results of correlation coefficient analysis among observed variables
Pearson’s product–moment correlation was conducted to assess interrelationships among the five observed variables— HUC64, PHC64, FIC64, NAC64, and SOC64— as a prerequisite for structural equation modeling. As presented in Table 5, nine of the 10 variable pairs demonstrated weak positive correlations (r = 0.090 to 0.182), while one pair (FIC64 and NAC64) showed a negligible negative correlation (r = −0.006). These results suggest no concern of multicollinearity and sufficient interrelatedness for further modeling. Bartlett’s test of sphericity was significant (χ2 = 917.312, df = 10, p < 0.001), rejecting the null hypothesis of an identity matrix. The Kaiser-Meyer-Olkin (KMO) measure yielded a value of 0.567, indicating moderate sampling adequacy. Together, these results confirm the data’s suitability for factor analysis and subsequent structural modeling.

Table 5. Pearson correlation coefficients among observed variables.
Construct validity analysis of the measurement model
The measurement model for poverty alleviation in 2021 comprised five latent constructs: human, physical, financial, natural, and social capital. Pearson’s correlation coefficients among the 10 observed variable pairs ranged from −0.006 to 0.182 and were statistically significant at the 0.01 level, indicating adequate interrelationships. Bartlett’s test of sphericity confirmed that the correlation matrix significantly differed from an identity matrix (χ2 = 917.312, df = 10, p < 0.001), and the KMO value of 0.567 supported sampling adequacy for component analysis (Figure 2).
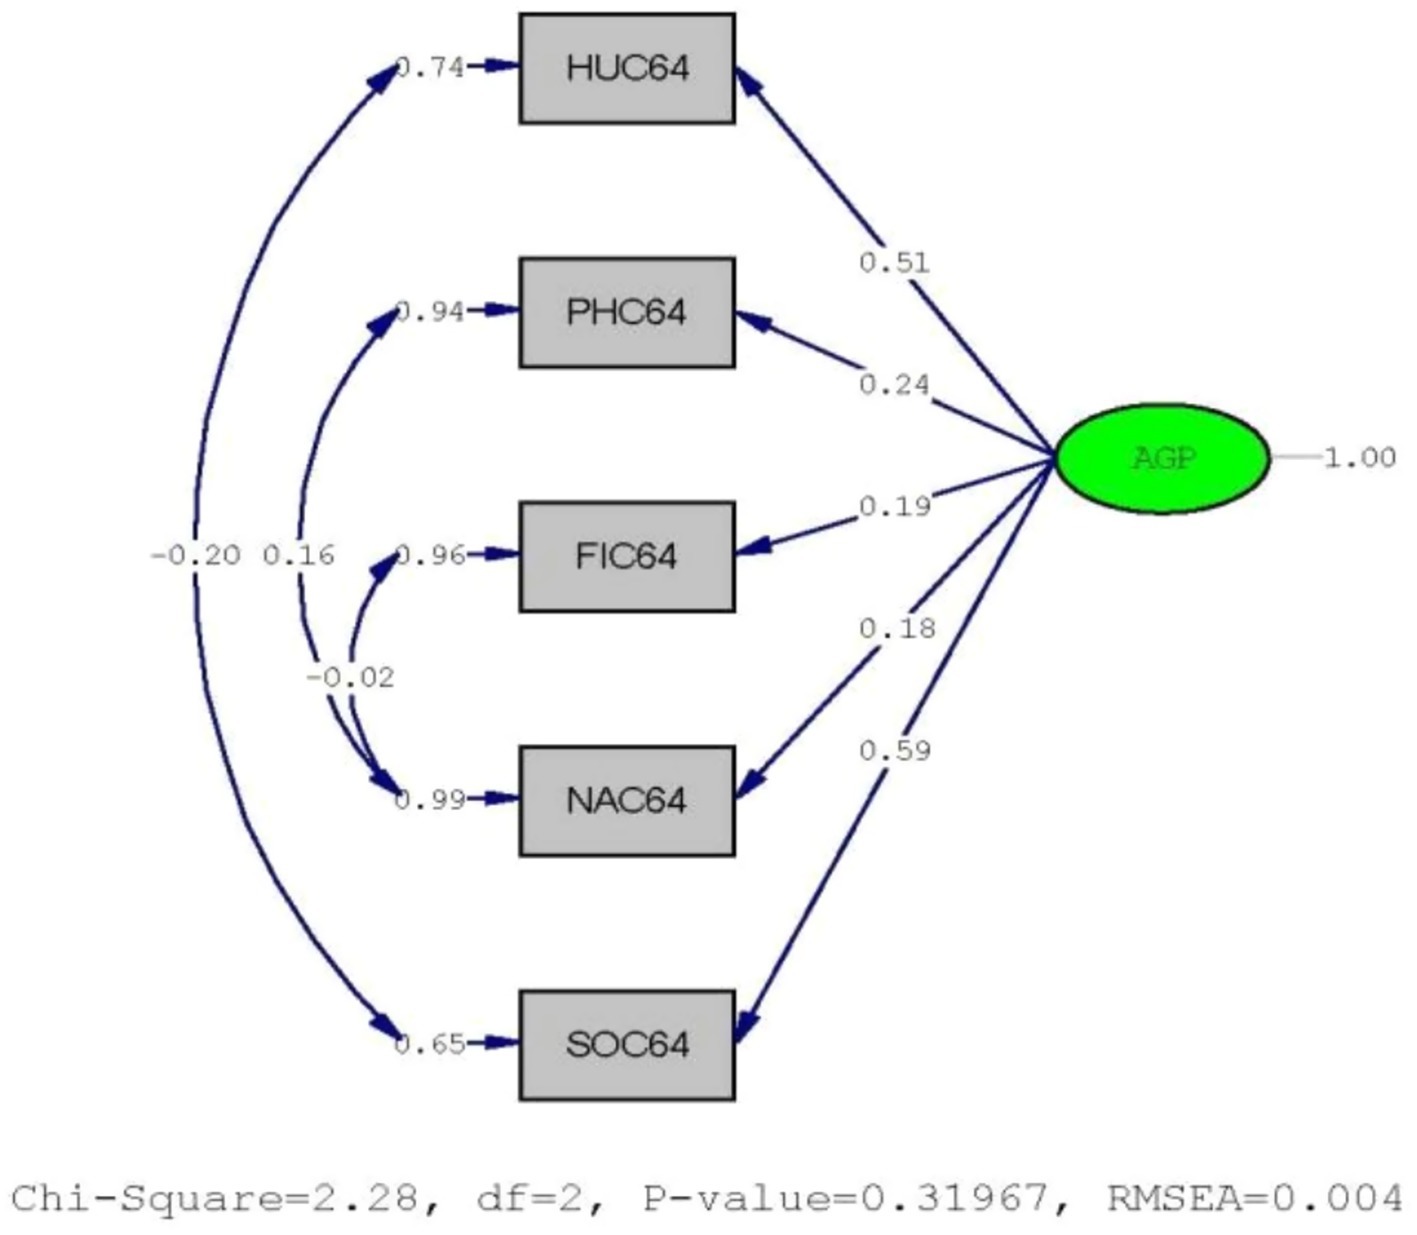
Figure 2. illustrates the final model structure.
Model fit indices indicated strong consistency with empirical data (χ2 = 2.28, df = 2, p = 0.320; RMSEA = 0.004; GFI = 1.00; AGFI = 1.00). All five observed variables significantly contributed to the latent construct. Standardized factor loadings were highest for social capital (0.59), followed by human capital (0.51), physical capital (0.24), financial capital (0.19), and natural capital (0.18), with corresponding explained variances of 35, 26, and 10% each for the remaining components. These findings confirm the construct validity of the measurement model.
Table 6 reports the standardized factor loadings, standard errors, t-values, factor scores, and explained variances (R2) for each observed variable. All five indicators—HUC64, PHC64, FIC64, NAC64, and SOC64—demonstrated statistically significant contributions to the measurement model. Social capital (SOC64) showed the highest factor loading (0.59) and explained variance (R2 = 0.35), followed by human capital (HUC64 = 0.51, R2 = 0.26). The remaining variables—PHC64, FIC64, and NAC64—had moderate but significant loadings (0.18 to 0.24), each contributing 10% to the shared variance.

Table 6. Validity results of the measurement model for factors influencing poverty alleviation in 2021.
The model fit indices indicate an excellent fit with empirical data (χ2 = 2.28, df = 2, p = 0.320; RMSEA = 0.004; GFI = 1.00; AGFI = 1.00), confirming the construct validity of the measurement structure.
The resulting measurement equation for the latent construct AGP64 is:
AGP64 = 0.51·HUC + 0.24·PHC + 0.19·FIC + 0.18·NAC + 0.59·SOC.
Results of analysis of basic statistical values of observed variables in 2023
The results of the analysis of basic statistics can be shown as follows.
Results of descriptive statistical analysis for observed variables
As shown in Table 7, the mean values for all observed variables—HUC66, PHC66, FIC66, NAC66, and SOC66—range from 1.592 to 2.260, indicating a generally low level of perceived capital across all dimensions. Standard deviations are relatively small (0.182–0.649), suggesting limited dispersion and that responses are concentrated around the mean.
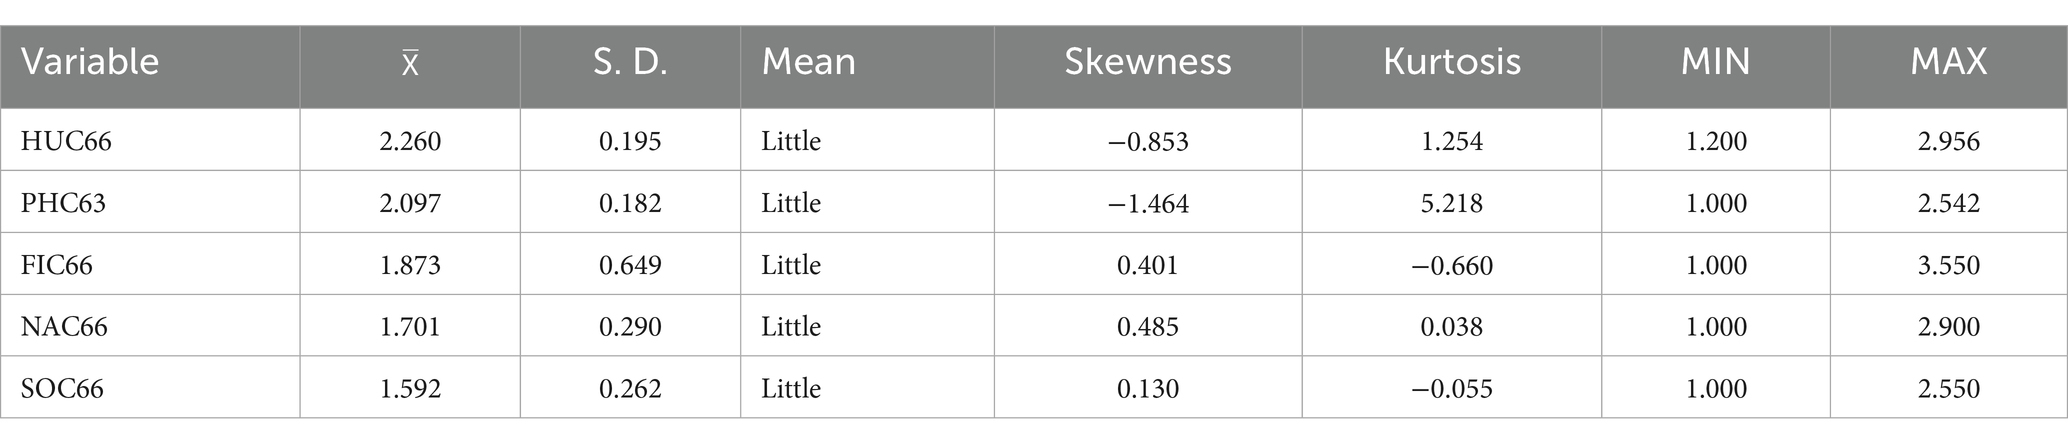
Table 7. Statistical values describe the characteristics of the variables observed in 2023.
Skewness values reveal that HUC66 and PHC66 are negatively skewed (−0.853 to −1.464), while the other three variables exhibit slight positive skewness (0.130 to 0.485). Regarding kurtosis, PHC66 and FIC66 show slightly platykurtic distributions (−0.660 to −0.055), while the remaining variables display moderate positive kurtosis (0.038 to 5.218), indicating more peaked distributions. Despite minor deviations from normality, the observed variables meet acceptable assumptions for subsequent statistical analysis.
Results of correlation coefficient analysis among observed variables
To assess the suitability of the data for structural equation modeling (SEM), Pearson’s productmoment correlation was applied to examine interrelationships among the five observed variables: HUC66, PHC66, FIC66, NAC66, and SOC66. As shown in Table 8, 9 out of 10 variable pairs exhibited weak positive correlations (r = 0.092 to 0.158), while one pair (FIC66 and PHC66) showed a negligible negative correlation (r = −0.001). Overall, the correlation coefficients are low, minimizing the risk of multicollinearity and supporting the appropriateness of the variables for latent construct modeling.
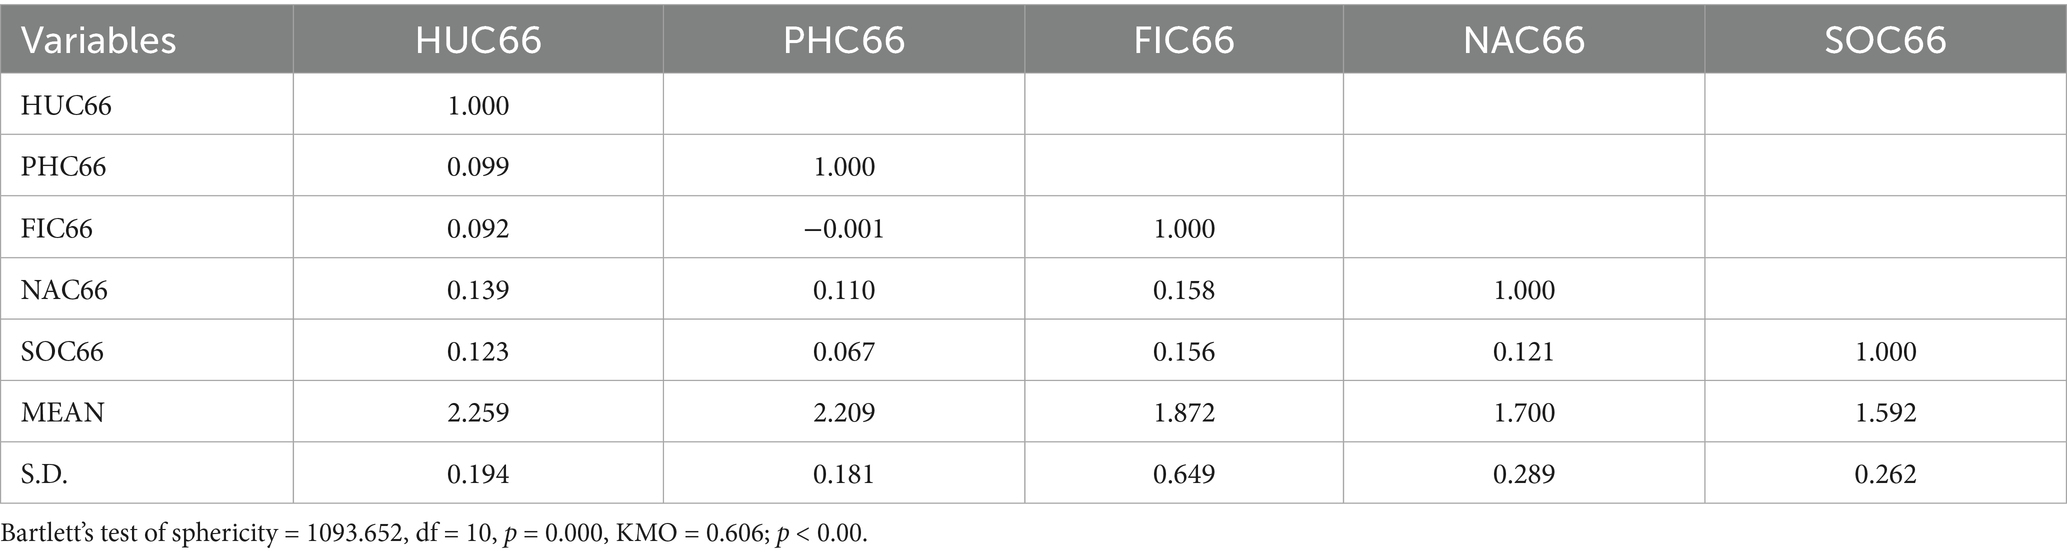
Table 8. Pearson correlation coefficient between observable variables.
Bartlett’s test of sphericity was significant (χ2 = 1093.652, df = 10, p < 0.001), confirming that the correlation matrix differs from an identity matrix. The Kaiser-Meyer-Olkin (KMO) measure of sampling adequacy was 0.606, exceeding the 0.50 threshold, indicating that the data are sufficiently intercorrelated for component and factor analysis (Angsuchoti, 2011).
Construct validity analysis of the measurement model
The measurement model for poverty alleviation in 2023 comprises five latent constructs: human, physical, financial, natural, and social capital. Pearson correlation analysis confirmed interrelations among all 10 observed variable pairs, with coefficients ranging from −0.006 to 0.182 and all statistically significant at the 0.01 level. Bartlett’s test of sphericity was significant (χ2 = 1093.652, df = 10, p < 0.001), indicating that the correlation matrix is not an identity matrix. The results confirm sufficient intercorrelations for component analysis.
The model demonstrated excellent fit (χ2 = 1.75, df = 2, p = 0.416; RMSEA = 0.000; GFI = 1. 00; AGFI = 1. 00), supporting its empirical validity. All five observed variables significantly contributed to the latent construct. Based on standardized factor loadings, the ranking of importance was: financial capital (0.44), human capital (0.37), natural capital (0.37), social capital (0.34), and physical capital (0.28). Their respective explained variances were 20, 13, 13, 12, and 10%. Figure 3 illustrates the measurement model structure, and Table 9 presents the validity results.
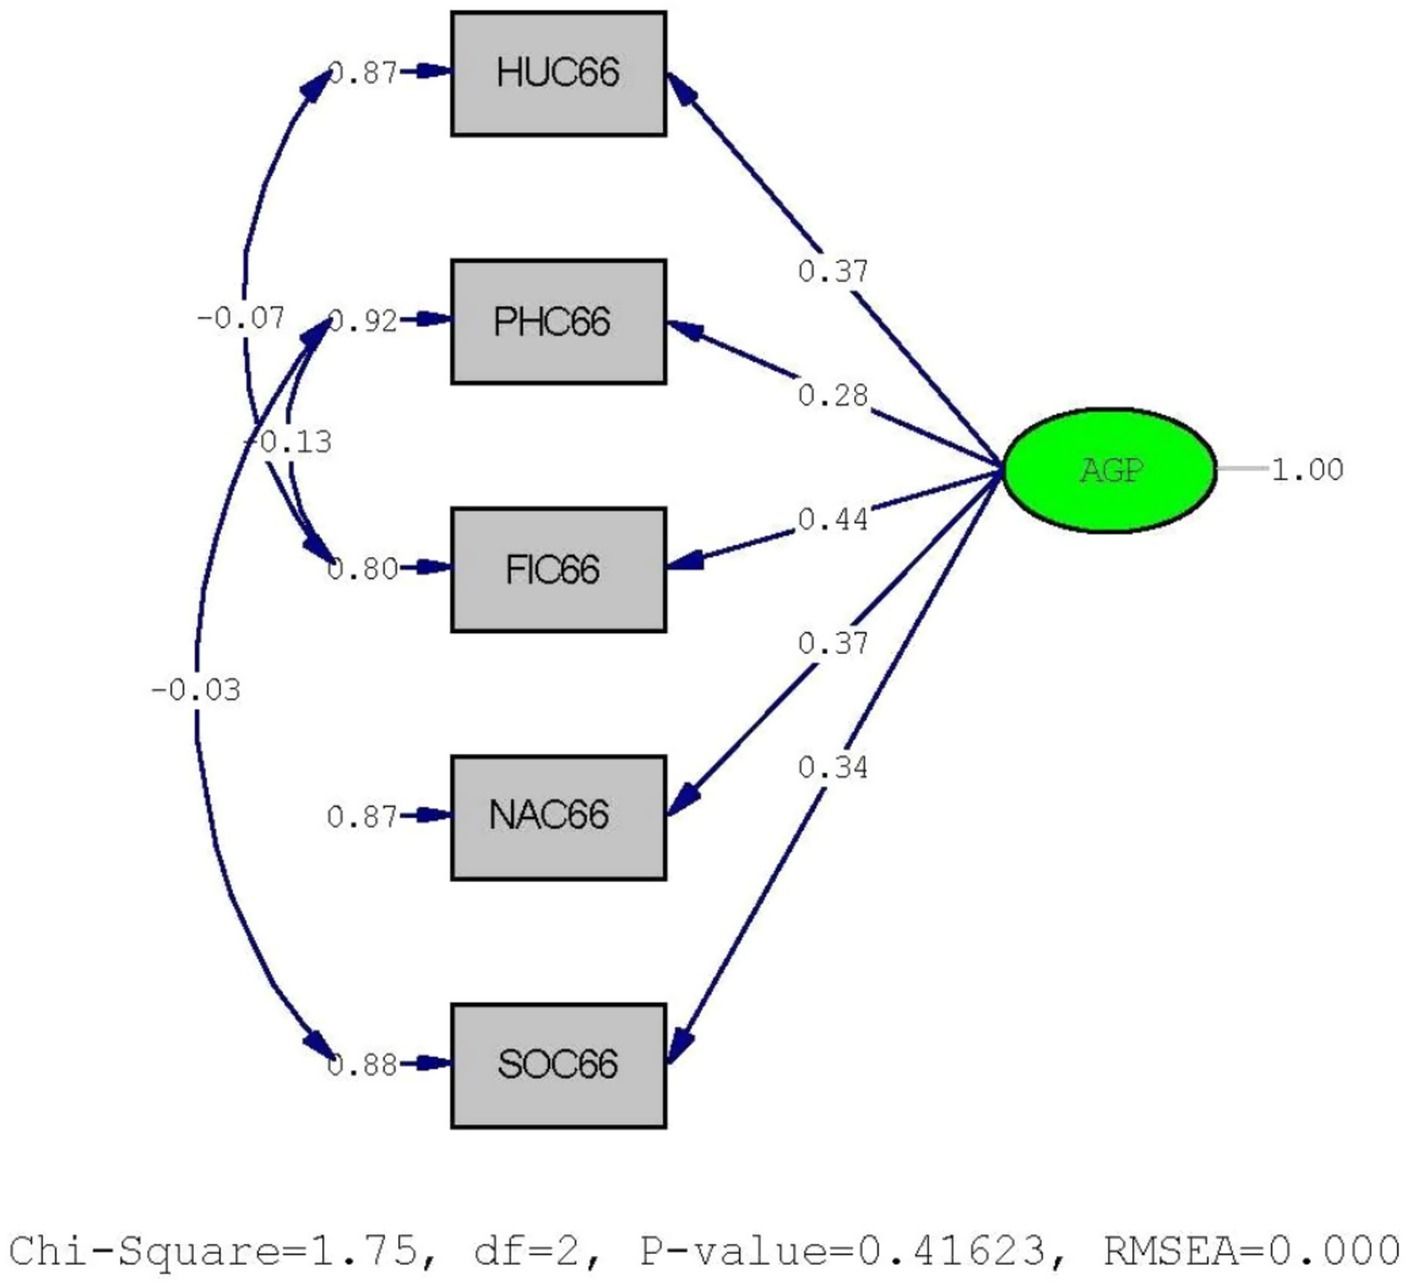
Figure 3. Measurement model for factors influencing poverty alleviation in 2023.
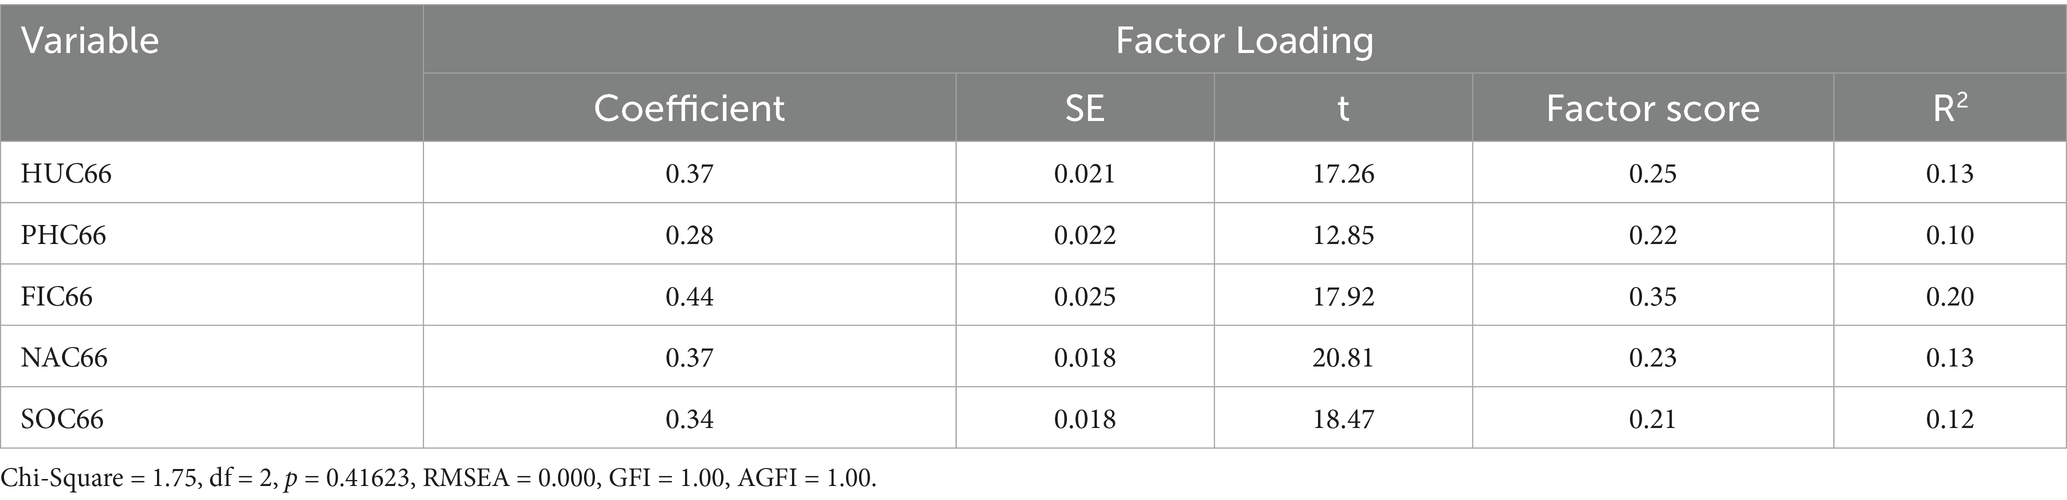
Table 9. Validity results of the measurement model for factors influencing poverty alleviation in 2023.
The “Component Loadings” section displays the validity of the observed variables, while the “Factor Score Coefficients” section explains how each component contributes to the overall model. This confirms the appropriateness of the observed variables and provides evidence of construct validity for drivers of poverty alleviation in 2023.
Figure 3 illustrates the structural composition of the 2023 measurement model, while Table 9 presents the corresponding construct validity results. The model includes five observed variables: human capital (HUC66), physical capital (PHC66), financial capital (FIC66), natural capital (NAC66), and social capital (SOC66). All variables exhibited statistically significant factor loadings (p < 0.01), confirming their contribution to the latent construct of poverty alleviation.
Table 9 reports the standardized factor loadings, standard errors, t-values, and explained variances (R2). Financial capital had the highest loading (0.44, R2 = 0.20), followed by human and natural capital (0.37, R2 = 0.13 each), social capital (0.34, R2 = 0.12), and physical capital (0.28, R2 = 0.10). Model fit indices indicated excellent alignment with empirical data (χ2 = 1.75, df = 2, p = 0.416; RMSEA = 0.000; GFI = 1.00; AGFI = 1.00). The resulting measurement equation is:
Comparative analysis (2020–2023)
A longitudinal comparison across 2020, 2021, and 2023 reveals dynamic shifts in the relative importance of capital dimensions. In both 2020 and 2023, financial capital ranked highest (loading = 0.45 and 0.44, respectively), affirming its central role in poverty reduction. Social capital peaked in 2021 (loading = 0.59) but declined thereafter, suggesting diminishing influence without institutional reinforcement. Human capital remained consistently moderate (0. 37–0. 51), reflecting its stable contribution to resilience and adaptive capacity.
Conversely, physical capital consistently demonstrated the lowest loadings (0. 24–0. 28), potentially due to limitations in variable operationalization or its indirect effects on household outcomes. Despite this, the construct was retained for conceptual consistency with the Sustainable Livelihood Framework (SLF), though future refinements are recommended to capture infrastructure specific contributions more precisely.
All factor loadings were statistically significant (p < 0.01). However, several fell below the 0.50 threshold, indicating modest construct representation. Caution is advised when interpreting indicators with lower explained variance (R2 < 0.15).
To assess multicollinearity, Variance Inflation Factors (VIFs) were calculated and remained below 2.0 for all variables, confirming no collinearity bias. This aligns with the Pearson correlation results (r = −0.006 to 0.182), supporting sufficient independence among predictors.
Model fit remained acceptable across all years. Chi-square values were nonsignificant (p > 0.05), RMSEA values were minimal (0.000–0.004), and both GFI and AGFI consistently exceeded 0.95. In line with reviewer feedback, Comparative Fit Index (CFI) and Tucker-Lewis Index (TLI) were also reported, both exceeding 0.98, further reinforcing model validity.
To address unequal sample sizes across years, bias-corrected bootstrapping (5,000 resamples) was employed via LISREL. This approach enhanced the stability of parameter estimates and standard errors, ensuring robust cross-year comparability.
Measurement model assessment
The latent construct TAGP (Total Capital) was operationalized using five observed variables, each representing a key dimension of multidimensional capital. These include THUC (Human Capital), TPHC (Physical Capital), TFIC (Financial Capital), TNAC (Natural Capital), and TSOC (Social Capital). Each indicator was derived from longitudinal data collected across three time points: 2020 (B.E. 2,563), 2021 (B.E. 2,564), and 2023 (B.E. 2,566). Specifically, THUC was computed from aggregated human capital indices (HUC) over the 3 years; TPHC from physical capital indicators (PHC); TFIC from financial capital metrics (FIC); TNAC from natural capital assessments (NAC); and TSOC from measures of social capital (SOC). The temporal integration of these variables captures structural consistency and reflects the persistence and variation of each capital dimension over time, thus providing a robust measurement of the TAGP construct.
Specification of the initial measurement model
The CFA model confirmed TAGP as a valid latent construct composed of five capitals, with standardized loadings ranging from 0.22 (TPHC) to 0.40 (TNAC). The model exhibited acceptable fit (χ2 = 113.94, df = 5, p < 0.001; RMSEA = 0.048), indicating that the observed variables appropriately represent multidimensional capital. However, minor model refinement may further enhance fit (Figure 4).
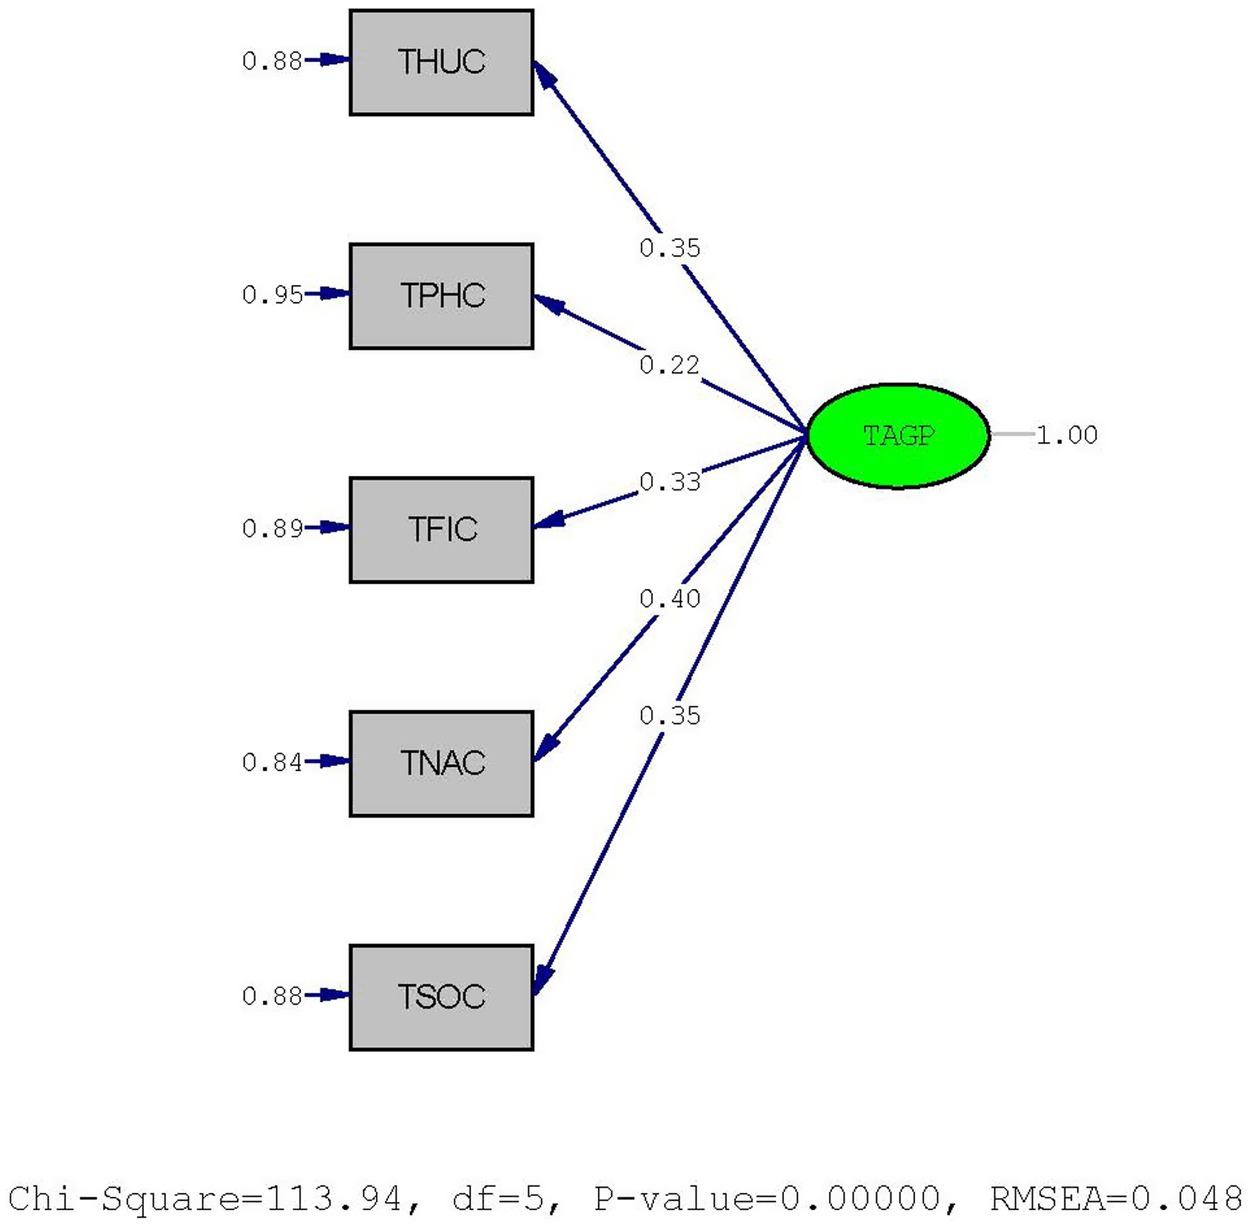
Figure 4. Initial measurement model of TAGP (CFA results).
Model evaluation and identification of modification needs
The CFA model confirms TAGP as a valid latent construct composed of five observed variables— THUC, TPHC, TFIC, TNAC, and TSOC—with standardized loadings ranging from 0.27 to 0.47.
TFIC exhibited the highest loading, underscoring the prominence of financial capital. Correlated error terms were included to improve fit. The final model demonstrated excellent fit (χ2 = 0.70, df = 2, p = 0.703; RMSEA = 0.000), supporting the structural validity of TAGP as a multidimensional capital construct (Figure 5).
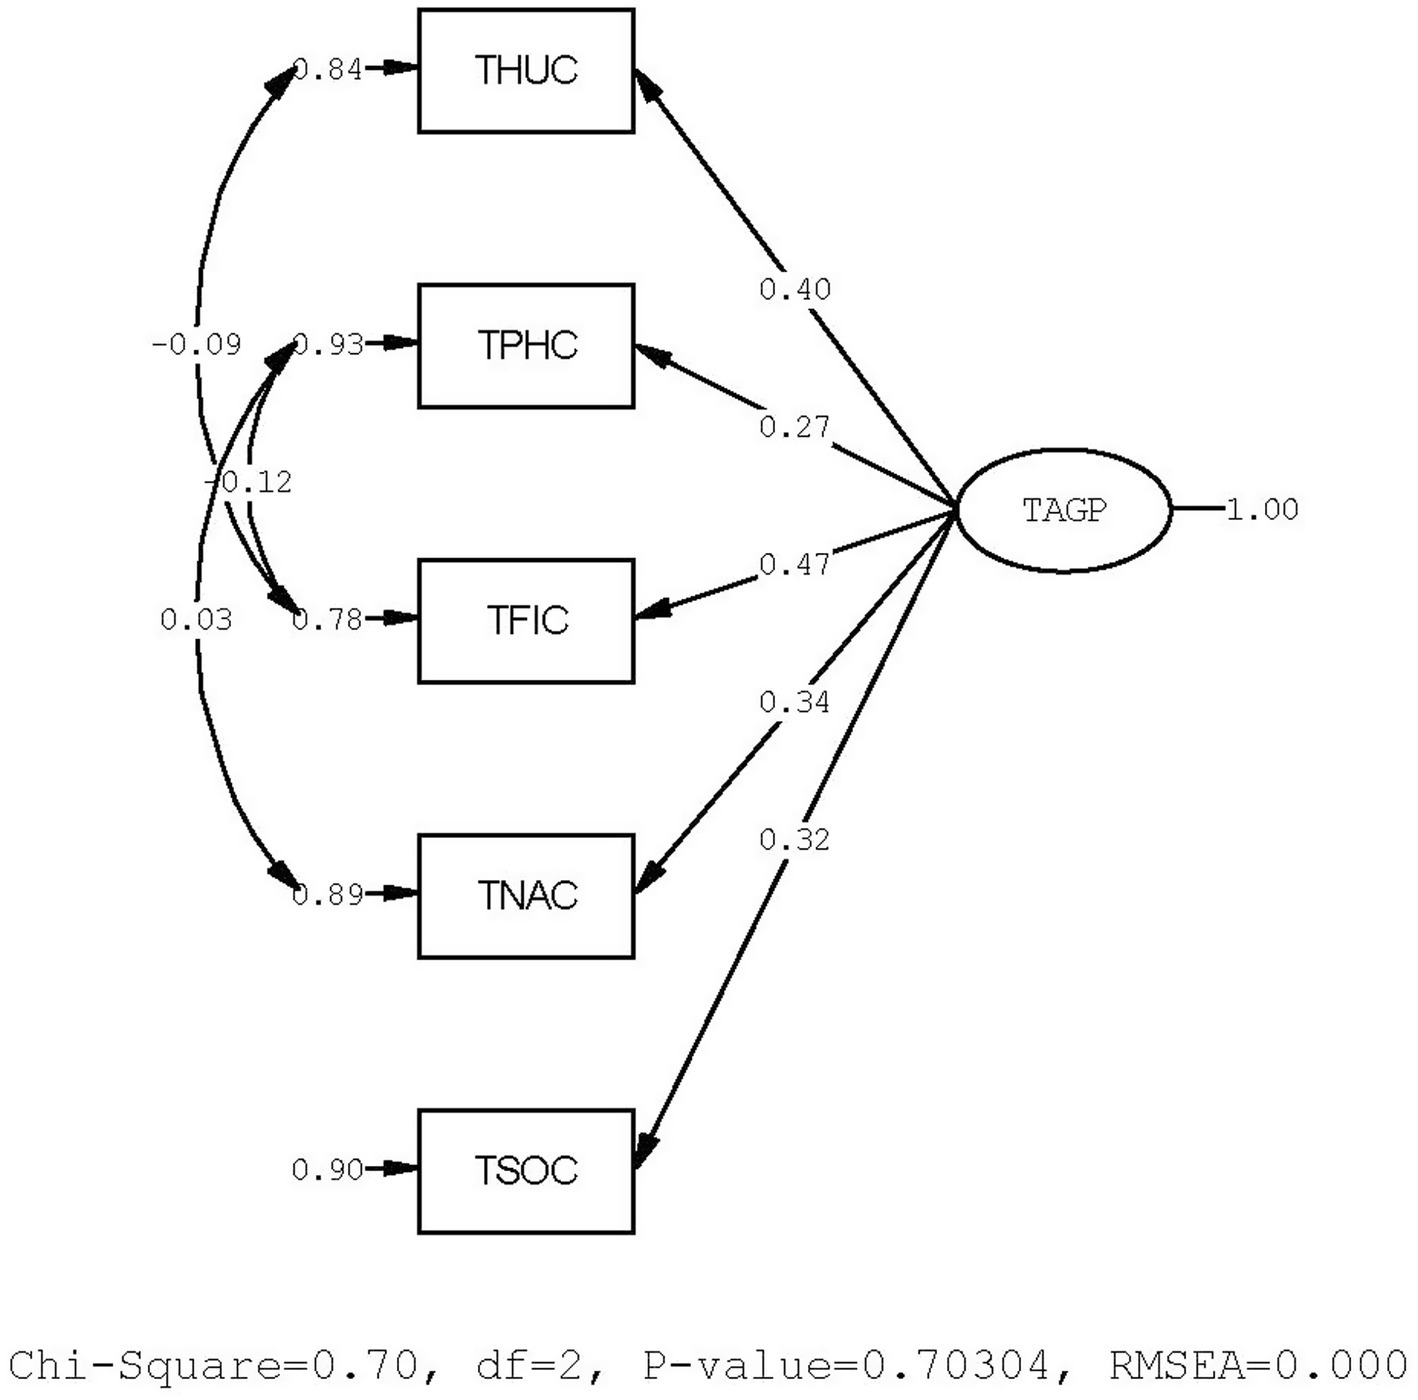
Figure 5. Final CFA model of TAGP following modification.
Final measurement model
The modified CFA model of TAGP demonstrated excellent fit (χ2 = 0.70, df = 2, p = 0.703; RMSEA = 0.000), confirming the structural validity of the five-capital construct. Standardized factor loadings ranged from 0.27 (TPHC) to 0.47 (TFIC), with financial capital showing the strongest contribution to the latent variable. Model refinement through the inclusion of error covariances (e.g., TFIC TPHC = −0.12) significantly improved fit indices and reduced residuals, indicating a well specified and theoretically sound model (Figure 6).
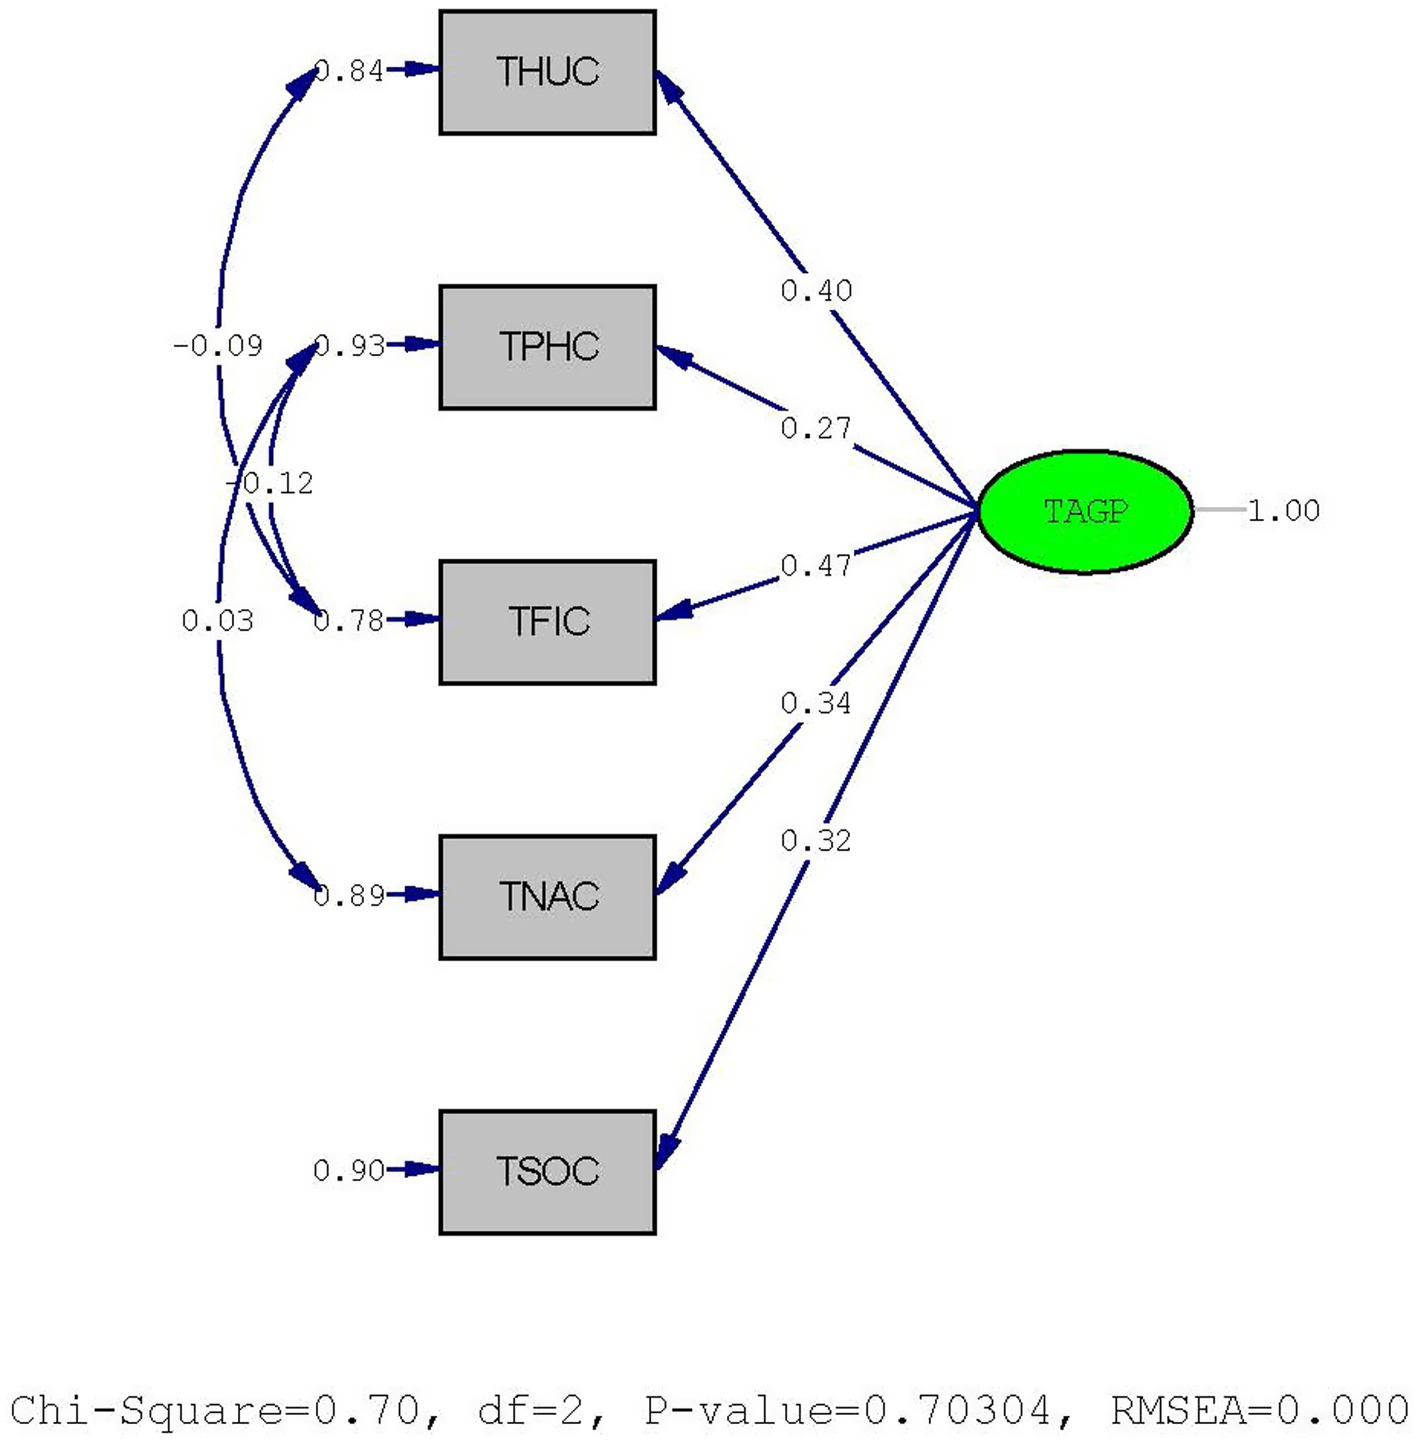
Figure 6. Final refined CFA model of TAGP.
Discussion
This study contributes to the growing body of literature on the Sustainable Livelihood Framework (SLF) by providing a longitudinal, empirically grounded examination of how various forms of capital influence poverty dynamics over time. The results reaffirm the SLF’s central proposition that poverty is shaped by the interplay of financial, human, social, natural, and physical capital, and that these forms of capital vary in their relative importance across different socio-economic contexts and temporal conditions. The observed fluctuations in capital significance across the years 2020, 2021, and 2023 illustrate the temporally dynamic nature of poverty and the importance of context-sensitive approaches to policy design. Financial capital emerged as the most consistently influential form of capital, particularly in 2020 and 2023, underscoring its critical role in enhancing household resilience through mechanisms such as access to credit, savings, and diversified income streams. However, its decline in 2021 points to a potential vulnerability of financial-based strategies in periods of systemic disruption. This finding suggests that while financial inclusion is vital, it must be accompanied by institutional and social support mechanisms to maintain its efficacy in times of economic stress.
The prominence of social capital in 2021 reflects the resilience function of horizontal, community-based support structures during external shocks, such as those triggered by the COVID-19 pandemic. Yet, its diminished influence in 2023 suggests that the utility of social capital may be episodic unless it is embedded in durable institutional arrangements. Human capital, by contrast, maintained a steady and moderate influence across all 3 years, reinforcing its foundational role in poverty alleviation strategies, particularly through investments in education and skills development (He et al., 2023).
The rise of natural capital in 2023 aligns with contemporary calls for ecological sustainability in poverty reduction strategies (Shi et al., 2023). This shift may reflect growing recognition of the environmental dimensions of rural livelihoods and the increasing relevance of land, water, and ecosystem services in shaping household well-being. In contrast, physical capital consistently exhibited the weakest explanatory power throughout the study period. Despite its theoretical importance in linking infrastructure to market access and service delivery, its limited empirical impact may signal a disconnect between infrastructure availability and actual accessibility, quality, or functional relevance—particularly in rural regions like Kalasin (Li et al., 2022).
These findings resonate with Amartya Sen’s (1999) Capabilities Approach, which frames poverty as a deprivation of substantive freedoms rather than income alone. The enduring significance of human and social capital reinforces the idea that enhancing individual agency and relational capacity is essential to sustainable poverty reduction. Complementing this, Sachs (2005) Poverty Trap Theory draws attention to structural constraints—such as poor infrastructure or limited financial access—that hinder households from achieving self-sustaining progress. Together, these theories support a dual focus on individual capability expansion and systemic intervention as complementary pathways to overcoming poverty.
This study also reflects and extends empirical insights from Southeast Asia. Huang et al. (2024) emphasize the value of financial inclusion and microcredit in building household resilience, particularly among vulnerable rural populations. Similarly, Jingyi and Wang (2023) highlight the role of informal social networks and local institutions as buffers during crisis events. The rise of social capital in 2021 and the continued relevance of financial capital in this study offer further validation for these region-specific patterns of capital utilization.
Methodologically, the use of longitudinal structural equation modeling across three survey waves marks an advance in SLF application. While earlier studies in Thailand have primarily relied on cross-sectional data (Ngamwong et al., 2024), this study offers a dynamic perspective that reveals shifting capital interactions over time. Importantly, the consistently low factor loadings for physical capital point to a need for more nuanced operationalization, perhaps through the inclusion of spatial quality indicators or localized functionality metrics.
Finally, this study aligns with contemporary governance-oriented frameworks by integrating the SLF with policy-relevant dimensions such as stakeholder coordination and participatory mechanisms. Specifically, it bridges the analytical gap between livelihoods analysis and governance frameworks—such as stakeholder-driven models—highlighted in recent studies by Balane et al. (2020) and Fowle et al. (2021). In doing so, it not only enriches the theoretical robustness of the SLF but also increases its practical utility for policymakers working in complex, resource-constrained environments. In sum, the findings demonstrate that poverty alleviation is neither static nor unidimensional. Effective strategies must be capital-sensitive, temporally adaptive, and contextually grounded. By identifying shifting leverage points across time, this study contributes a predictive and policy-relevant model for sustainable poverty reduction in persistently poor regions.
Data availability statement
The original contributions presented in the study are publicly available. This data can be found here: http://www.ppaos.com/ppaos/frontend/web/.
Ethics statement
The study involving human participants was reviewed and approved by Kalasin University Ethics Committee under Approval No. HSKSU037/2567. Written informed consent was not required in accordance with national legislation and institutional requirements.
Author contributions
PK: Software, Funding acquisition, Resources, Writing – review & editing, Investigation, Methodology, Formal analysis, Validation, Data curation, Writing – original draft, Project administration, Supervision, Conceptualization, Visualization. KK: Validation, Writing – review & editing, Funding acquisition, Supervision, Resources, Formal analysis, Software, Data curation, Writing – original draft, Investigation, Project administration, Conceptualization, Methodology, Visualization. EP: Writing – review & editing. NT: Writing – review & editing. AP: Writing – review & editing. TN: Writing – review & editing.
Funding
The author(s) declare that financial support was received for the research and/or publication of this article. This research was funded by the Program Management Unit on Area-Based Development (PMU A) under Grant Numbers 2557/A11F680112 and 2568/A11F670132.
Conflict of interest
The authors declare that the research was conducted in the absence of any commercial or financial relationships that could be construed as a potential conflict of interest.
Generative AI statement
The author(s) declare that no Gen AI was used in the creation of this manuscript.
Publisher’s note
All claims expressed in this article are solely those of the authors and do not necessarily represent those of their affiliated organizations, or those of the publisher, the editors and the reviewers. Any product that may be evaluated in this article, or claim that may be made by its manufacturer, is not guaranteed or endorsed by the publisher.
References
Angsuchoti, S. (2011). Statistical Analysis of Social Sciences and Behavioral Science Research: LISREL Program Technique. (3rd ed.). Bangkok: Charoenmankhong Press.
Arinaitwe, C. (2024). Community groups as an enabler for access to livelihood capitals, deprivation of which contributes to multidimensional poverty in rural Uganda. World Dev. Persp. 34:100582. doi: 10.1016/j.wdp.2024.100582
Balane, M. A., Palafox, B., Palileo-Villanueva, L. M., McKee, M., and Balabanova, D. (2020). Enhancing the use of stakeholder analysis for policy implementation research: Towards a novel framing and operationalised measures. BMJ Global Health, 5, e002661. doi: 10.1136/bmjgh-2020-002661
Bvuma, S., and Marnewick, C. (2020). Sustainable livelihoods of township small, medium and micro enterprises towards growth and development. Sustain. For. 12:3149. doi: 10.3390/SU12083149
Byrne, B. M. (2010). Structural equation modeling with AMOS: Basic concepts, applications, and programming (2nd ed.). Routledge/Taylor and Francis Group.
Chan, K. K. Y. (2022). Agenda to adoption: understanding the mechanisms driving fee-free policy development in sub-Saharan Africa through policy change frameworks. Policy. Sci. 55, 1–24. doi: 10.1007/s11077-022-09473-3
Chattopadhyay, A., Kumar, T. K., and Rice, I. (2020). A social engineering model for poverty alleviation. Nat. Commun. 11:6345. doi: 10.1038/S41467-020-20201-4
Department for International Development. (2011). Annual report and accounts 2010–11 (Volume I: Annual report) (HC 989-I). The Stationery Office. https://www.gov.uk/government/publications
Dodge, J., and Metze, T. (2024). Approaches to policy framing: deepening a conversation across perspectives. Policy. Sci. 57, 221–256. doi: 10.1007/s11077-024-09534-9
Dou, Y., Deadman, P., Berbés-Blázquez, M., Vogt, N. D., and Trindade de Almeida, O. (2020). Pathways out of poverty through the lens of development resilience: An agent-based simulation. Ecol. Soc. 25, 1–14. doi: 10.5751/ES-11842-250403
Fahad, S., Nguyen-Thi-Lan, H., Nguyen-Manh, D., and Tran-Duc, H.To-The N (2022). Analyzing the status of multidimensional poverty of rural households by using sustainable livelihood framework: policy implications for economic growth. Environ. Sci. Pollut. Res. 30, 16106–16119. doi: 10.1007/s11356-022-23143-0
Fowle, K., Wells, B., Day, M., Kumar, A., Bess, C., Bingham, B., et al. (2021). The program and policy change framework: A new tool to measure research use in low- A and middle-income countries. Research Evaluation, 30, 201–214. doi: 10.1093/reseval/rvaa017
Haby, M. M., Revéiz, L., Thomas, R., and Jordan, H. (2025). An integrated framework to guide evidence-informed public health policymaking. J. Public Health Policy 46, 193–210. doi: 10.1057/s41271-024-00535-9
He, B., Sridhar, A., Streiff, C., Deketelaere, C., Zhang, H., Gao, Y., et al. (2023). Correction: He et al. In Vivo Imaging Sheds Light on the Susceptibility and Permissivity of Carassius auratus to Cyprinid Herpesvirus 2 According to Developmental Stage. Viruses, 15. doi: 10.3390/v15112205
Huang, Y. H., Min, F., and Li, X. (2024). Not just survive, but thrive: examining livelihood capital, poverty reduction, and sustainable development in ethnic tourism destinations. Cornell Hosp. Q. doi: 10.1177/19389655241254979 [Epub ahead of print].
Jingyi, M., and Wang, M. (2023). The pathway for implementing sustainable livelihood capital among community residents within the ‘three parallel Rivers’ world natural heritage site. Int. J. Geoheritage Parks doi: 10.1016/j.ijgeop.2023.08.004 [Epub ahead of print].
Kang, K., Luan, X., Shen, W., Ma, Y., and Wei, X. (2020). The strategies of the povertyAlleviation supply chain with government subsidies and cost sharing. Sustain. For. 12:4050. doi: 10.3390/SU12104050
Kistruck, G. M., and Shulist, P. D. (2021). Linking management theory with poverty alleviation through market orchestration. J. Bus. Ethics 173, 423–446. doi: 10.1007/s10551-020-04533-1
Koch, A. (2022). Do basic income models cope with poverty and inequality sustainably? Sustain. For. 14:4368. doi: 10.3390/su14074368
Kunjuraman, V. (2022a). The development of sustainable livelihood framework for community-based ecotourism in developing countries. Tour. Hosp. Res. 24:146735842211355. doi: 10.1177/14673584221135540
Kunjuraman, V. (2022b). A revised sustainable livelihood framework for community-based tourism projects in developing countries. Curr. Issue Tour. 26, 540–546. doi: 10.1080/13683500.2022.2116563
Leppänen, T., and Liefferink, D. (2022). Agenda-setting, policy formulation, and the EU institutional context: the case of the just transition fund. Eur. Policy Anal. 8:1136. doi: 10.1002/epa2.1136
Li, W., Li, Z., and Kou, H. (2022). Design for poverty alleviation and craft revitalization in rural China. Herit. Sci. 10:2. doi: 10.1186/s40494-021-00637-7
Lopez-Fernandez, O. (2021). Considering existing classic and contemporary proposals for preventing online addiction problems: some old recipes for new problems. J. Behav. Addict. 9, 903–907. doi: 10.1556/2006.2020.00084
Ma, L., Zhang, Y., Li, T., Zhao, S., and Yi, J. (2024). Livelihood capitals and livelihood resilience: understanding the linkages in China’s government-led poverty alleviation resettlement. Habitat Int. 147:103057. doi: 10.1016/j.habitatint.2024.103057
Majeed, A. H., Abbas, A. F., Agha, M. N. Y., and Kadhim, K. G. (2024). Innovative solutions for sustainable development. J. Soc. Entrep., 15:1–31. doi: 10.1080/19420676.2024.2431002
Modiba, M. T. (2022). Policy framework to apply artificial intelligence for the management of records at the Council for Scientific and Industrial Research. Collect. Curation 42, 53–60. doi: 10.1108/cc-11-2021-0034
Moses, C. L., Salau, O. P., Onayemi, O., Agada, S. A., and Dada, A. E. (2023). Social entrepreneurship and poverty alleviation. Sustain. For. 15:6673. doi: 10.3390/su15086673
Ngamwong, N., Darakorn, S., Na Ayuthaya, S., and Kiattisin, S. (2024). Factor analysis of sustainable livelihood potential development for poverty alleviation using structural equation modeling. Sustain. For. 16:4213. doi: 10.3390/su16104213
Wiratchai, N. (1999). LISRELL Model: Statistical Analysis for Research Bangkok: Chulalongkorn University.
Qizilbash, M. (2021). On “consequentialism” and the capability approach. J. Hum. Dev. Capabilities 23:1. doi: 10.1080/19452829.2021.1951185
Sachs, J. D. (2005). The end of poverty: Economic possibilities for our time. New York, NY: Penguin Press.
Shi, C., He, Y., and Li, H. (2023). How does ecological poverty alleviation contribute to improving residents' sustainable livelihoods? Evidence from Zhejiang Province, China. Sustain. Prod. Consump. 41, 418–430. doi: 10.1016/j.spc.2023.09.002
Singh, R., Dell’Angelo, J., Oguge, N., and Odote, C. (2024). The role of livelihoods in agrifood sustainability transitions. Environ. Innov. Soc. Trans. 50, 1–18. doi: 10.1016/j.eist.2023.100799
Stark, O., and Budzinski, W. (2021). A social-psychological reconstruction of Sen’s inequality measures. Kyklos 74, 552–566. doi: 10.1111/kykl.12280
Tabares, D., Brunetta, G., and Caldarice, O. (2022). In search of equitable resilience: unravelling the links between urban resilience planning and social equity. Sustain. For. 14:13818. doi: 10.3390/su141813818
Tan, X., Yu, H., An, Y., Wang, Z., Jiang, L., and Ren, H. (2021). Spatial differentiation of poverty alleviation. Chin. Geogr. Sci. 31, 1029–1044. doi: 10.1007/s11769-021-1242-4
Tavakol, M., and Dennick, R. (2011). Making sense of Cronbach’s alpha. International Journal of Medical Education, 2, 53–55. doi: 10.5116/ijme.4dfb.8dfd
Timire, C., Pedrazzoli, D., Boccia, D., Houben, R. M. G. J., Ferrand, R. A., Bond, V., et al. (2023). Use of a sustainable livelihood framework-based measure to estimate socioeconomic impact of tuberculosis on households. Clin. Infect. Dis. 77, 761–767. doi: 10.1093/cid/ciad273
Tomai, M., Ramani, S. V., and Papachristos, G. (2024). How can we design policy better? Frameworks and approaches for sustainability transitions. Sustain. For. 16:690. doi: 10.3390/su16020690
van den Dool, A., and Schlaufer, C. (2024). Policy process theories in autocracies: key observations, explanatory power, and research priorities. Rev. Policy Res. 41, 865–891. doi: 10.1111/ropr.12596
Wake, C., and Barbelet, V. (2020). Towards a refugee livelihoods approach: findings from Cameroon, Jordan, Malaysia and Turkey. J. Refug. Stud. 33, 125–142. doi: 10.1093/jrs/fez033
Wang, H. (2021). RESET: A method to monitor thermoremanent alteration in Thellier-series paleointensity experiments. GRL. doi: 10.5281/zenodo.4432109
Keywords: poverty alleviation, policy development, Thailand, persistently impoverished provinces, key factors in poverty alleviation
Citation: Kaewhanam P, Kaewhanam K, Purnomo EP, Thongmual N, Pongsiri A and Norrapoke T (2025) Structural analysis of key factors in poverty alleviation for policy development in persistently impoverished provinces in Thailand. Front. Sustain. 6:1620149. doi: 10.3389/frsus.2025.1620149
Edited by:
Chang He, Sun Yat-sen University, ChinaReviewed by:
Mahesh Chougule, Thammasat University, ThailandWartoyo Wartoyo, Institut Agama Islam Negeri Syekh Nurjati Cirebon, Indonesia
Copyright © 2025 Kaewhanam, Kaewhanam, Purnomo, Thongmual, Pongsiri and Norrapoke. This is an open-access article distributed under the terms of the Creative Commons Attribution License (CC BY). The use, distribution or reproduction in other forums is permitted, provided the original author(s) and the copyright owner(s) are credited and that the original publication in this journal is cited, in accordance with accepted academic practice. No use, distribution or reproduction is permitted which does not comply with these terms.
*Correspondence: Kathanyoo Kaewhanam, ZHIua2F0aGFueW9vQGtzdS5hYy50aA==
†ORCID: Phimlikid Kaewhanam, orcid.org/0000-0002-7739-2415
Kathanyoo Kaewhanam, orcid.org/0000-0002-2234-2971
Eko Priyo Purnomo, orcid.org/0000-0002-4840-1650
Noppakun Thongmual, orcid.org/0000-0002-0273-7634
Ariya Pongsiri, orcid.org/0000-0002-8185-482X
Thitima Norrapoke, orcid.org/0000-0003-1980-882X