 Juan Pablo Ríos-Ocampo
 Michael Shayne Gary
- 1Department of Management Science, University of Strathclyde, Glasgow, United Kingdom
- 2UNSW Business School, University of New South Wales, Sydney, NSW, Australia
Cities worldwide face housing pressure due to rapid population growth exceeding the housing supply. Despite efforts to increase housing supply, housing affordability continues to decline. Understanding policymakers' perceptions of the housing sector in urban planning is critical to guaranteeing housing opportunities for everyone. We examine the complexities of housing affordability in the urban planning process by analyzing three urban planning reports in Greater Sydney. We use an existing dataset for Greater Sydney urban planning reports and causal mapping to analyze policymakers' perceptions about the relationships that drive the housing demand, housing supply, and housing prices. The findings highlight the need for a better understanding of the drivers of urban sprawl, the limitations of current supply-side strategies, and alternative solutions to control urban growth and mitigate housing crises in urban areas.
1 Introduction
Housing affordability has become a major problem in many cities around the world (Alves, 2022; Coupe, 2021; Leishman et al., 2023). Policymakers at all levels have designed policies intended to alleviate this crisis (Anthony, 2023; Han et al., 2021) while also promoting population growth (Ríos-Ocampo and Gary, 2025). However, the rapid population growth in urban areas has outpaced growth in the housing supply for several decades, amplifying the housing affordability problem (Leishman et al., 2023; Sager, 2011; Searle, 2020).
Cities like Greater Sydney struggle to cope with rapid population growth and the associated demand for housing because significant time delays constrain the rate of housing supply expansion (Searle, 2020; van den Nouwelant et al., 2022). It takes time for policymakers to release more land for urban development, for local utilities to approve and build new infrastructure projects that provide essential services (e.g., water, sewerage, power, roads), for real estate developers to propose housing development projects on newly released land, for local councils to review and approve these new projects, for developers to initiate the projects once approved, and for developers to build new houses and neighborhoods once construction begins.
Over several decades, population growth outpacing the growth in housing supply has negatively impacted Sydney residents' quality of life, urban shape (Lawton and Morrison, 2022; Mahtta et al., 2022) and environmental quality (Haase et al., 2013; Ríos-Ocampo and Gary, 2025; Sager, 2011). In addition, residents in larger cities face longer commutes to access job opportunities, higher education and health services, and social and cultural facilities and amenities (Bassolas et al., 2019; Giles-Corti et al., 2022; Kelly and Donegan, 2015; Lu et al., 2021). Expanding cities have also prioritized housing development at the expense of green spaces, replacing green spaces with concrete (Karlen et al., 2022; Lawton and Morrison, 2022) and consequently affecting urban temperatures (Bubathi et al., 2023; Chaston et al., 2022; Li et al., 2020; Sharifi and Lehmann, 2015; Stone et al., 2010; Valencia et al., 2023).
Previous research has examined housing strategies in urban areas in response to decreasing housing affordability. Traditionally, policymakers have concentrated on increasing housing supply to cope with population growth and the associated increasing demand for dwellings by promoting zoning and changes in land use (Infranca, 2019; Pawson et al., 2020), approval of new housing projects (Birrell and McCloskey, 2016), housing development (Palm et al., 2020) and urban renewal projects (Han et al., 2021). These traditional strategies also include increasing the supply of affordable and social housing (Morris, 2021; van den Nouwelant et al., 2022) to support low- and medium-income residents (CHIA, 2024; Han et al., 2021), increasing urban density (Duranton and Puga, 2020; Giles-Corti et al., 2022; Vij et al., 2021) and implementing tax policies (Morris, 2021). However, these strategies have been implemented for decades, and housing affordability issues persist with a negative impact on economic growth (Anthony, 2023), water access (Meehan et al., 2025), urban sprawl (Li et al., 2021; Mahtta et al., 2022), access to urban amenities (Giles-Corti et al., 2022), city walkability (Gunn et al., 2022), quality of life (Chung et al., 2020), green spaces (Karlen et al., 2022; Lawton and Morrison, 2022) and societal wellbeing (Ríos-Ocampo and Gary, 2025). Previous simulation modeling research has examined the aging of housing and changes in land use (Forrester, 1969), interaction between business, housing, and population while using limited land (Alfeld and Graham, 1976; Ghaffarzadegan et al., 2011), housing construction dynamics (Eskinasi et al., 2009), housing growth and shrinkage scenarios (Lauf et al., 2012) and housing system dynamics (Eskinasi, 2014) and others (Bach et al., 2019). However, more research is needed to understand the causes of housing affordability in urban areas, how policymakers perceive this urban challenge, and to identify policies that improve the situation. Urban systems are complex, and strategies and policies must account for this complexity to avoid unintended consequences.
We adopt Forrester's Attractiveness Principle (Forrester, 1969; Meadows, 2002) to explore alternatives to control growth by focusing on the overall quality of life. The Attractiveness Principle holds that people preparing to move will move to the most attractive city (e.g., Sydney) in their consideration set. This principle has been supported by findings from migration researchers (Dorigo and Tobler, 1983; Reia et al., 2024; Van Hear et al., 2018). As the population of the most attractive city increases, housing affordability in the city eventually declines, job opportunities become scarce, traffic congestion increases, and the overall quality of life for the residents of the city decreases. These impacts reduce the city's attractiveness, and according to this principle, population growth will slow down and ultimately cease when the city becomes less attractive than other locations. However, policymakers have historically attempted to adopt urban plans and strategies that create urban areas that are attractive to everyone. In particular, policymakers have implemented policies to promote population growth and economic growth, and expected market forces to create the best outcome (Sager, 2011), instead of limiting urban and population growth to proactively limit the growth of cities. We apply the attractiveness principle and causal mapping to evaluate potential housing strategies that may be implemented to manage growth in Greater Sydney, while also maintaining a high overall quality of life and societal wellbeing.
We adopt a systems approach to understand the factors that limit the effectiveness of traditional strategies to improve housing affordability. We use an existing dataset (Ríos-Ocampo and Gary, 2024) from Greater Sydney urban planning reports coded using text analysis. The causal relationships reported in this dataset are used to build causal maps and capture policymakers' beliefs about the relationships that drive the housing demand, housing supply, and housing prices in Greater Sydney. Greater Sydney is used as a case study because housing affordability has become an acute problem due to the rapid population growth experienced in the city over the last five decades. People have historically been attracted to Sydney because of the high quality of life and the extensive opportunities the city offers to residents (EIU, 2023; Innovation Cities, 2021). But the high and increasing cost of housing relative to the median Australian income has resulted in decreasing attractiveness for the city over the last 10 years. We also selected Greater Sydney as the case study because so much data are available about the city since many scholars have studied Greater Sydney for urban research (Birrell and McCloskey, 2016; Bunker et al., 2017; Clark and Moonen, 2016; Farid Uddin et al., 2022; Lawton and Morrison, 2022; Morris, 2021; Ríos-Ocampo and Gary, 2025; Searle, 2020; Sharifi and Lehmann, 2015).
2 Materials and methods
To analyze the housing affordability crisis in Greater Sydney, we use the dataset published by Ríos-Ocampo and Gary (2024) that includes the data from three existing urban planning reports in Greater Sydney: (i) Sydney region: Outline plan (State Planning Authority of NSW, 1968); (ii) City of Cities: A plan for Sydney's Future (Department of Planning, 2005); and (iii) A Metropolis of Three Cities—connecting people (Greater Sydney Commission, 2018). These urban planning reports represent policymakers' mental models (Forrester, 1980) about the causal relationships at work in the urban system, and also describe the strategies policymakers adopted to advance the city.
The dataset was analyzed by implementing text analysis (Eker and Zimmermann, 2016; Kim and Andersen, 2012; Tomoaia-Cotisel et al., 2022) to identify variables and causal relationships between variables. These variables and causal relationships are recorded using Computer-aided qualitative data analysis software (CAQDAS), as suggested in Eker and Zimmermann (2016). We subsequently mapped the variables and causal relationships in causal maps (Luna-Reyes and Andersen, 2003). The causal maps use a hybrid of a causal loop diagram and a stock and flow diagram to represent the most important stocks essential for understanding the dynamics of the system and explaining the physical flow through it (Sterman, 2000). Causal maps enable us to capture policymakers' perceptions about the causal relationships in the urban system associated with housing dynamics (Groesser and Schaffernicht, 2012; Lane, 2000; Stave and Kopainsky, 2015; Sterman, 2000). To build the causal maps, we take the individual causal relationships identified in the urban reports, which represent policymakers' perception of the relationship between two urban elements, and integrate them into a single map. The causal maps also help to understand policymakers' mental models, revealing unintended consequences of misunderstanding urban dynamics. Prior studies have used text analysis to code Federal Open Market Committee meetings (Kim and Andersen, 2012), circular economy activities in the textile sector (Manolchev et al., 2024), health sector reports (Pineo et al., 2020), housing sector reports (Zolghadr et al., 2022), and other global challenges (Buzogany et al., 2024).
Causal maps use arrows to indicate the direction of causality. A “+” sign at the arrowhead denotes that an increase in the independent variable causes the dependent variable to rise above what it would have been, ceteris paribus (and a decrease causes a decrease). A “–” sign denotes that an increase in the independent variable causes the dependent variable to decrease beyond what it would have been. Causal maps reveal two types of feedback loops, labeled as “R” for reinforcing (positive) feedback loops and “B” for balancing (negative) feedback. The square box indicates stock (or state) variables that accumulate or deplete over time, the piped arrows into or out of the stock variables indicate flow variables (inflows into or outflows from the stock), and the clouds signify sources or sinks (Sterman, 2000).
3 Population, gross regional product, and housing affordability in Greater Sydney
Greater Sydney is a well-known and recognized city worldwide because of its economic attractiveness, innovation capacity, quality of life, and sustainability programs (Arcadis, 2022; C40, 2022; EIU, 2023; Innovation Cities, 2021). However, rapid urban and population growth over the last five decades has negatively impacted housing affordability (Bangura and Lee, 2019) and other social and environmental indicators (BITRE, 2015; Bubathi et al., 2023; Committee for Sydney and Ipsos, 2023; Lawton and Morrison, 2022).
Policymakers prioritized Greater Sydney's population growth and economic growth over the last five decades (Ríos-Ocampo and Gary, 2025; Searle, 2020). Population growth has created increasing demand for dwellings, as shown in Figures 1, 2. Figure 1 shows the population of Greater Sydney between 1971 and 2071 (ABS, 2024a) and the Gross Regional Product (GRP) and GRP per capita in Greater Sydney between 2001 and 2023 (.idcommunity, 2025). Greater Sydney's population has grown by 32.9% from 2001 to 2023 to a value of 5.45 million people (the population has grown by 81% from 1971; ABS, 2019, 2023c, 2024b). In comparison, the Gross Regional Product (GRP) per capita in Greater Sydney has grown by 33.1% to reach AU$91,707 in 2023 compared to 2001 (.idcommunity, 2025).
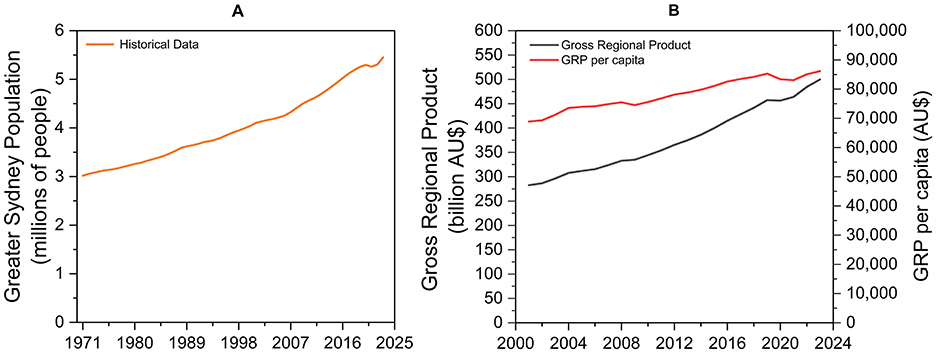
Figure 1. Population and gross regional product behavior over time. (A) Greater Sydney Population Table 3.1 Population (a), capital city (b) and rest of state, states and territories, 30 June (c), 1901 onwards−1960–2015—(ABS, 2019), Estimated resident population, Greater Capital City Statistical Areas (Australian Statistical Geography Standard) 2021, Australia (ABS, 2024b)−2016–2022 and Projected population from 2022 to 2071 (ABS, 2023b, 2024a). Data for the medium scenario was obtained in the ABS (2024a) and used to estimate other scenarios based on the NSW scenarios (ABS, 2024b). (B) Gross Regional Product (left) and Gross Regional Product per capita (right) in Greater Sydney. Data from 2001 to 2023—line—taken from .idcommunity (2025).
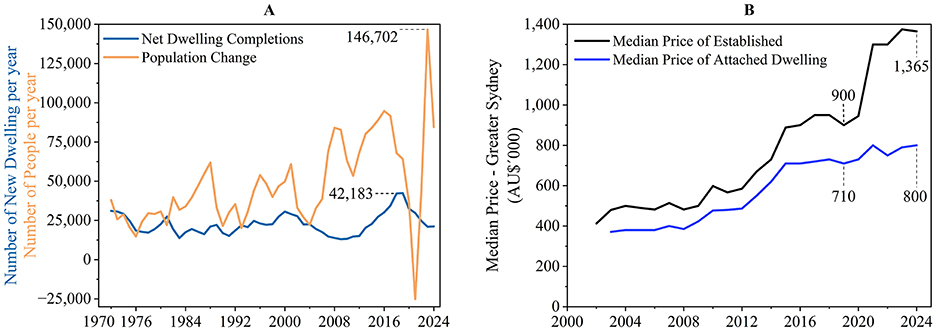
Figure 2. Housing sector behavior over time. (A) (orange line) population growth per year and (blue line) new dwellings (housing) per year (NSW Government, 2023). (B) Median house price in Greater Sydney, September 2002 to September 2024 (ABS, 2024c). Attached Dwellings include flats, units, apartments, and semi-detached, row, and terrace houses.
The Greater Sydney population is projected to reach between 7.2 million (32% higher than the 2023 level) and 10.7 million people by 2071 (96% higher; ABS, 2024a). Population growth in cities has put upward pressure on dwelling (i.e., housing) and transport infrastructure, land usage and urban sprawl, water and energy consumption, and waste generation (ABS, 2024a; Department of the Prime Minister and Cabinet, 2016; McPhearson et al., 2021; Ríos-Ocampo and Gary, 2025; UN-Habitat, 2020).
The housing sector in Greater Sydney has experienced increased pressure due to population growth. Figure 2 shows housing supply, demand for housing, and the median housing price in Greater Sydney. Figure 2A highlights the discrepancy between population change each year (orange line)—a proxy for changes in housing demand—and the number of new dwellings completed each year (blue line)—a proxy for changes in housing supply—in Greater Sydney between 1972 and 2024. In the last 52 years, the net dwelling completions have exceeded population change in only 8 years. The most significant population change was in 2023, while the greatest number of dwellings completed was in 2019. Although net population growth includes families and people willing to share a dwelling, the higher demand for housing is reflected in the median price of established houses and attached dwellings (e.g., apartments, units and terrace houses; ABS, 2024c). Figure 2B shows the evolution of the median housing and attached dwelling prices from September 2002 to September 2024. While the population and GRP per capita has grown in this period by around 32% at an annual rate of 1.3%, the median price of established houses has increased by 231% at 6% annually, and the price of attached dwellings by 116% (from 2003) at an annual rate of 3.9%. The reduction of housing affordability is also reflected in rental prices, which have increased regardless of distance from the CBD (ABS, 2023a).
4 Evolution of housing strategies in Greater Sydney
In this section, we present the results of the analysis of the urban planning reports in Greater Sydney published in 1968, 2005, and 2018. The findings show that policymakers' mental models about housing development changed from 1968 to 2005, but remained mostly unchanged from 2005 to 2018.
4.1 Housing sector in the 1968 urban development plan
The analysis of the 1968 urban plan shows that policymakers focused on allocating land for urban development, investing in infrastructure, and promoting housing development projects in new areas in advance of the expected population growth. This strategy also aimed to ensure the necessary public utilities, transport infrastructure, and new housing developments were in place as the population grew.
Figure 3 captures policymakers' perceptions about causal relationships in the housing sector in the 1968 urban planning report. The “Housing Pressure” loop (labeled as B1) shows policymakers' strategy to cope with the demand for dwellings. As the urban population grows, the demand for new dwellings increases, increasing the demand for more public investment to expand the water, sewerage, drainage, electricity, gas and telecommunications infrastructure to deliver services to new neighborhoods and then also to build schools, hospitals, transport infrastructure, and other public buildings in these new neighborhoods. This demand for public investment stimulates policymakers, who have the authority to define land use in the city, to first make a commitment to make those public investments, and subsequently to change land use, leading to an increase in land allocated for urban development that eventually is released for urban development. Some of the land released for urban development is devoted to the land needed to construct new dwellings. As more land is released and more land is devoted to construct new dwellings, more new houses are built, increasing the housing supply and reducing the demand for new dwellings relative to what it would have been if all conditions in the system had remained the same. These causal relationships close the “Housing Pressure” balancing loop (B1). To clarify the terminology, Land Allocated for Urban Development is the land designated for future urban development. Land Released for Urban Development is the land available for housing, employment, transport or other developments. Finally, Land for Dwellings is the land designated for housing development. Policymakers stated in 1968, in anticipation of population growth, that “new areas must be opened up for industrial and residential development on a major scale as rapidly as possible” (State Planning Authority of NSW, 1968, p. 1). Policymakers also highlighted the need for increasing housing density in existing areas: “if as many as 350,000 more people […] were to be accommodated within the zoned main urban area, this would necessitate as much as 35% of the dwellings in that area being either home units or new forms of medium density housing, rather a high proportion” (State Planning Authority of NSW, 1968, p. 25).
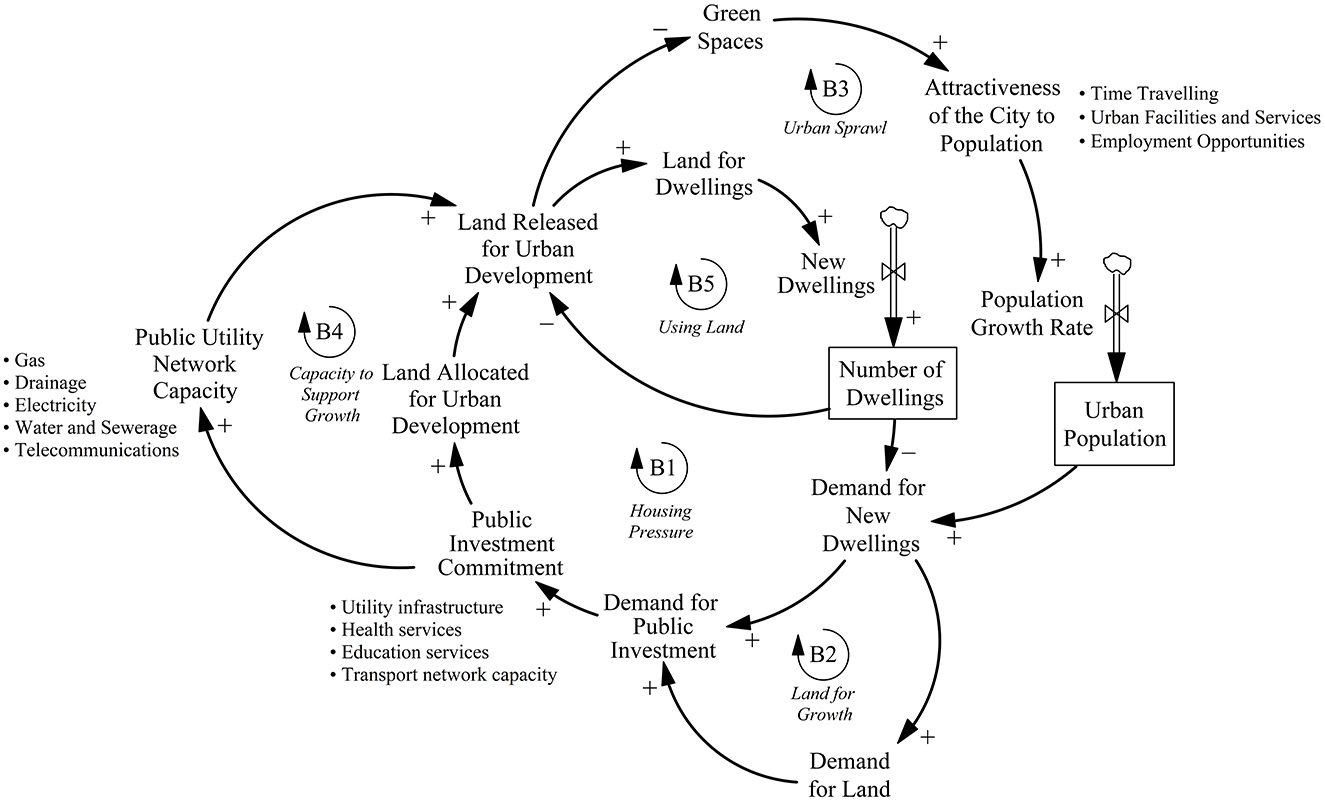
Figure 3. Housing dynamics in Greater Sydney in 1968.
The demand for new dwellings also increases the demand for land to support urban growth, increasing the demand for public investment in land use. The demand for public investment increases the public investment commitment and leads to an increase in land allocated and then released for urban development. Some of this land is devoted to new dwellings, and an increase in new dwellings reduces the pressure of demand for dwellings in the housing sector and also the demand for land relative to what it would have been if all conditions in the system had remained the same. These causal relationships close the “Land for Growth” loop (B2). In the 1968 urban plan, policymakers recognized that “Sydney's expected population growth of about 2,750,000 will require the zoning of an additional 250,000 acres.” (State Planning Authority of NSW, 1968, p. 97). The change of land use from green spaces to urban development negatively impacted the green spaces across the city, leading in a decline in the city's attractiveness compared to what it could have been if all factors in the system had remained unchanged. These causal relationships close the “urban Sprawl” balancing loop (B3).
In addition, the pressure on the public sector to increase investment in 1968 drove expansion of the public utility network and, because the public infrastructure was ready for new neighborhoods, more land could be released for urban development. As new neighborhoods and new houses are developed, the pressure on demand for new dwellings decreases relative to what it would have been if all conditions in the system had remained the same. These causal relationships close the “Capacity to Support Growth” balancing loop (B4). It is important to highlight that policymakers made commitments for the needed investment in public infrastructure before any housing development could start. Developers could not construct houses if there were no roads, water, power, storm drains or telecommunications lines on the land. Therefore, getting public infrastructure (including utilities) in place, enabled the release of land for housing development. “Given […] a limitation on the availability of public funds at any time, it is important that land development and the expansion of public utility services should be closely coordinated” (State Planning Authority of NSW, 1968, p. 47).
New dwellings are developed on land previously released for urban development, reducing the land available for future projects and closing another balancing loop: “Using Land” (B5). Policymakers recognized in 1968 that the previous land released for urban development may be insufficient for the expected population growth. The report “shows that it would be very difficult to find space for all the population growth expected within the County of Cumberland, consistent with the establishment of a sound and effective urban pattern and an acceptable living environment for the people. Thus, the need to plan for substantial urban growth outside the County of Cumberland is reinforced” (p. 26).
Importantly, notice that house prices and housing affordability do not feature at all in the causal diagram of the Greater Sydney housing sector from the 1968 urban plan. Land was abundant and policymakers released land outside of Cumberland County—where jobs, services, amenities, and houses were concentrated—and invested in public infrastructure in advance of expected population growth in the city. These policies helped housing supply keep pace with population growth, and kept housing affordable for the average resident of the city.
4.2 Evolution of housing strategies in Greater Sydney in 2005 and 2018
The sustained population growth in Greater Sydney over the last five decades has required policymakers to take action. Particularly in the housing sector, policymakers have focused on releasing land for new urban developments while promoting strategic centers, and also promoting housing projects. From 1971 to 2018, the Greater Sydney population increased by 81% and this growth caused a range of issues, including rising housing prices, falling housing affordability (because incomes did not rise as rapidly as house prices), increased traffic congestion, residents moving further from the city center to afford housing, longer commuting times, increased pollution, and less undeveloped green space. These changes led policymakers to shift their mental models and to rethink the urban planning policies that underpinned the traditional outward expansion of the city limits around a single city center. Instead, policymakers adopted policies to establish multiple strategic centers to distribute new developments and opportunities across the city, and to mitigate the negative social and environmental impacts stemming from the growing population (e.g., traffic congestion, long commuting times, and pollution). However, strategies to establish multiple strategic centers have not been effective. To the contrary, these strategies have reinforced the urban sprawl, modified land use, altered urban temperatures, and attracted even more people to the city, resulting in further increasing the housing demand and housing affordability problem. The implications of these policymakers' strategies are captured in Figure 4.
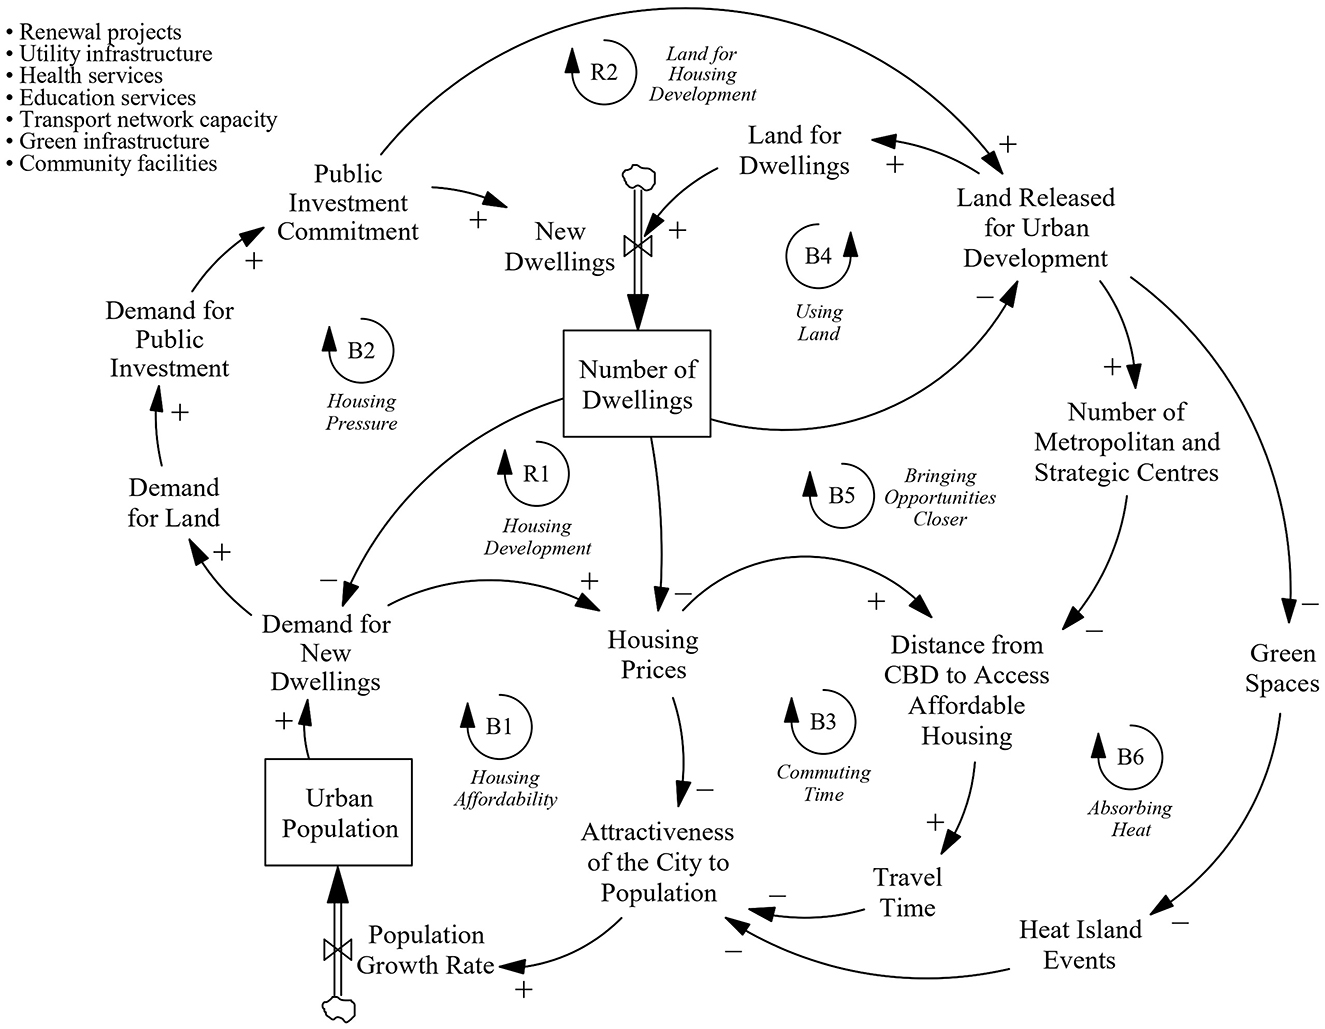
Figure 4. Housing dynamics in Greater Sydney in 2005 and 2018.
Figure 4 shows policymakers' beliefs about the causal relationships in the housing sector in the 2005 and 2018 urban reports. We combine the 2005 and 2018 urban reports into a single causal map because these urban reports reveal similar causal structures for the housing sector. The strong population growth in Greater Sydney from 1968 to 2018 motivates policymakers to find strategies to cope with this growth and to find ways to more evenly distribute services and opportunities across the city.
As the urban population grows, the demand for detached, semi-detached houses and apartments increases and this increases housing prices (and negatively impacts housing affordability). Rising housing prices decrease the attractiveness of the city to residents and to potential new residents. As the city's attractiveness declines, population growth slows because fewer people are attracted to live in the city. These causal relationships close the “Housing Affordability” balancing loop (B1). In 2005, policymakers highlighted that “…some areas of Sydney have difficulty in attracting workers because of high housing prices and rents. This gives rise to skill shortages or leads to extended journey to work distances and travel times.” (Department of Planning, 2005, p. 76). In 2018, policymakers recognized that housing affordability challenged the attractiveness of the city. “Being an in-demand global city brings growth, which in turn brings opportunities [but] it also brings challenges. The biggest of these is housing affordability, which is a pressing social and economic issue across Greater Sydney” (Greater Sydney Commission, 2018, p. 48).
As the urban population grows, rising housing prices (and lower housing affordability) also impacts the time people spend traveling from home to the workplace and other facilities. Historically, job opportunities, services, and facilities in Greater Sydney were concentrated in the Central Business District (CBD). As a result, this area of the city is in high demand and has become very expensive. As housing prices and rents increase in areas close to most of the work opportunities, some residents must look further from the city center for more affordable housing options. As a result, some residents must live far from the CBD, increasing the travel time and reducing the city's attractiveness to people. As the attractiveness of the city decreases, population growth slows, and the urban population falls relative to what it would have been if all conditions in the system had remained the same. This closes the “Commuting time” balancing loop (B3). As noted in the quote by policymakers in the 2005 urban plan above, high housing prices and rent can lead to longer distances between home and work and therefore longer commuting times (Department of Planning, 2005, p. 76). In 2018, policymakers wrote, “…an absence of affordable housing often results in workers having to commute for long distances” (Greater Sydney Commission, 2018, p. 68).
To reduce the impacts of population growth on housing affordability, policymakers implemented several different strategies and policies. One prominent strategy was to build more dwellings. This strategy aimed to balance the supply and demand for dwellings by encouraging more housing developments. Policymakers believed that building more dwellings would reduce the demand for new dwellings, leading to a decrease in the demand for land. If the demand for land decreases, the pressure on policymakers to invest more in new housing development diminishes, slowing the growth of dwellings across the city. These causal relationships close the “Housing pressure” balancing loop (B2) that was already discussed for the 1968 urban plan.
Given the demand for new dwellings at the time, policymakers also believed that an increase in housing development would reduce housing prices and improve housing affordability across the city. However, if housing prices decrease, the attractiveness of the city to residents and potential residents increases and therefore more people would move to the city. The increase in population increases the demand for new dwellings and the land for urban developments. These demands lead to an increase in public investment in new housing projects, increasing the number of dwellings across the city relative to what it would have been if all conditions in the system had remained the same. These causal relationships close the “Housing Development” reinforcing loop (R1) and highlight the importance of the attractiveness principle (Meadows, 2002) in understanding housing price dynamics. Building more housing cannot solve the fundamental problem, because the temporary housing price relief will only serve to attract more people to the city and this additional demand will drive house prices to rise further. Policymakers did not understand this issue in 2005 or 2018. For example, policymakers identified in 2005 the need for “…640,000 new homes” because “Sydney's population is anticipated to grow by 1.1 million people between 2004 and 2031” (Department of Planning, 2005, p. 6). In 2018, policymakers emphasized, “…maintaining adequate [housing] supply to meet demand can help to address housing price growth and is one measure to improve housing affordability” (Greater Sydney Commission, 2018, p. 48).
Allocating more land for urban development is another strategy to support housing development in an attempt to improve housing affordability. The “Land housing development” reinforcing loop, R2, captures policymakers' land strategy. As the population increases, the demand for dwellings increases, leading to rising demand for land (for dwellings). Higher demand for land increases the pressure on policymakers to make a commitment to invest in the public infrastructure required to support new urban development, and then to release more land for urban development. An increase in land released for urban development increases the area allocated for housing projects and leads to the construction of more houses—also increasing the urban sprawl. As the number of dwellings increases, housing prices fall (relative to what they would have been), attracting more people to move to the city relative to what it would have been if all conditions in the system had remained the same. In the 2005 urban report, this strategy of releasing land for housing development focused on “providing sites in new release areas [to] ensure a continuing supply of new detached housing with some medium density housing while preserving agricultural and resource lands and land for urban development after 2031 if needed” (Department of Planning, 2005, p. 119). In 2018, policymakers wrote that, “housing supply is also supported by the acceleration of council-led rezonings, faster housing approvals, delivery and renewal of social housing and using surplus government lands” (Greater Sydney Commission, 2018, p. 33).
Under a scenario of unlimited land, promoting more housing development may guarantee adequate housing affordability and high quality of life. However, cities have limited land, which limits urban development, as the “Using Land” balancing loop (B4) shows. This loop illustrates that as more houses are built, there is less land for new projects, including housing developments. In 2005, policymakers recognized that the existing urban development has increased “pressure on roads, on housing supply and on infrastructure and services” (Department of Planning, 2005, p. 3) because of the limited area for extending new projects. Similarly, in 2018, policymakers highlighted that “additional lands are required to meet long term population and employment growth” (Greater Sydney Commission, 2018, p. 135).
Due to the limited land available for urban development projects, policymakers changed their strategy to promote building strategic centers throughout the city, including the creation of a new metropolitan area in 2018. This strategy was intended to increase the housing supply, control urban sprawl, increase urban density, and reduce commuting times. The “Bringing Opportunities Closer” balancing loop (B5) shows that as public investment commitment increases, more land is released to support urban development, and more strategic centers are developed. As the number of metropolitan and strategic centers increases, more people can reside near job and service opportunities, reducing travel times. As commuting times decrease, more people are attracted to live in the city. This population growth increases the demand for dwellings and land, and increases the need for public investment commitment, leading to further increases in public investment relative to what it would have been if all conditions in the system had remained the same. These causal relationships close the “Bringing Opportunities Closer” balancing loop (B5). Policymakers stated in 2005 that strategic centers ensure “the city doesn't keep expanding with suburbs that are car-dependent” (Department of Planning, 2005, p. 156) and will “be attractive places to live, work and invest.” (Department of Planning, 2005, p. 80). In 2018, policymakers planned a three-city metropolis that “moves away from the historical radial focus on the Eastern Harbor City to a new focus requiring more interconnections within each city and between the three cities. This will facilitate greater opportunities for learning, labor participation, industry growth and development, and access to housing and services across Greater Sydney and create a 30-min city” (Greater Sydney Commission, 2018, p. 35). As hinted at above, the strategy did not work as intended, and we will return to this issue in the Discussion section.
Finally, the “Absorbing Heat” balancing loop (B6) shows that releasing land for urban development decreases green spaces. This “Absorbing heat” loop is only discussed in the 2018 urban report. As green spaces are replaced by concrete and buildings, the city's albedo capacity and urban ventilation diminish, and heat storage capacity in concrete and buildings increases, increasing heat absorption and exacerbating the urban heat island effect (Mohajerani et al., 2017). The resulting rise in urban temperature negatively impacts the city's comfort and attractiveness, decreasing the number of people willing to live there. With fewer residents (relative to what it would have been), the demand for dwellings and land declines, which eases the pressure on policymakers to allocate more land for urban development relative to what it would have been if all conditions had remained the same. These causal relationships close the “Absorbing Heat” balancing loop (B6). Policymakers in 2018 emphasized the role of tree canopy as a “form of green infrastructure providing shade, which reduces ambient temperatures and mitigates the heat island effect” (Greater Sydney Commission, 2018, p. 164). Policymakers also recognized the importance of a healthy natural environment “to improve liveability, create healthy places, and mitigate the effects of climate change” (Greater Sydney Commission, 2018, p. 142). They highlighted the need to protect the environment from urban development: “with the expansion of the urban footprint, and major transport infrastructure like the Outer Sydney Orbital and the Western Sydney Airport, there will be continuing demand for offset sites where biodiversity can be protected” (Greater Sydney Commission, 2018, p. 156) to “attract residents, workers, visitors, enterprise and investment.” (Greater Sydney Commission, 2018, p. 73).
5 Discussion and conclusion
In this paper, we used causal maps to make explicit policymakers' perceptions about causal relationships underpinning their strategies contained in urban planning reports. We focused on the causal relationships that help understand policymakers' perceptions about housing development and housing affordability in 1968, 2005, and 2018 in Greater Sydney. We find that policymakers' housing policies, such as promoting housing development, changing land use, and releasing land over recent decades, have overlooked important feedback loops that drive housing sector dynamics, leading to increasing stress on the urban system.
Policymakers' perceptions of housing development in 1968 show that population growth was considered an exogenous input to the city, and therefore, policymakers simply planned the city to cope with the expected growth. Policymakers aimed to reduce pressure on the housing sector by releasing land for urban development, promoting housing construction outside the city center, and allocating the necessary public investment to expand the public utility network capacity (i.e., water, electricity, and sewage) to existing and new areas under housing development. Housing affordability was not mentioned explicitly in the 1968 urban report but was addressed by encouraging more housing development to match housing demand. These urban developments drove the urban sprawl and reduced green areas (Li et al., 2021). Increasing housing density was central in the 1968 urban report, but Greater Sydney still has a low-density level in 2018 (Greater Sydney Commission, 2018). Although the causal map identified from the 1968 report included only balancing dynamics, it revealed policymakers' implicit continuous growth strategy to cope with the demand for new dwellings, land, services, and amenities to cope with the expected population growth. Instead of questioning the limits of land to be released and the limits of housing development, policymakers promoted urban development to accommodate more people in the city.
The causal map identified from the 2005 and 2018 urban reports shows that Greater Sydney's sustained population growth prompted policymakers to continue releasing land for urban development. However, policymakers did change their strategy by also promoting the development of multiple strategic centers to manage the growth and to foster economic activity and innovation. The strategic centers were also intended to mitigate negative social impacts like traffic congestion and pollution. However, these strategies unintentionally reinforce urban sprawl, reduce green spaces, exacerbate urban temperatures, attract more population, increase housing demand, and reduce housing affordability. The causal map also reveals that although strategic centers aim to bring opportunities closer to residents and reduce commute times, this strategy fosters more population growth and therefore higher demand for dwellings (Duranton and Puga, 2020). These unintended consequences impact the overall quality of life and the city's attractiveness to residents.
Policymakers have focused on improving housing affordability for decades by promoting supply-side strategies (i.e., housing development), aiming to make the city more livable and attractive. Although well-intentioned, these strategies have inadvertently exacerbated the problem by failing to control population growth (Meadows, 2002) and urban sprawl. The unchecked population growth worsens housing affordability, primarily affecting low- and medium-income households, and societal wellbeing. In the absence of an unlimited supply of land and of expanding housing supply ahead of population growth, our results indicate that high housing prices can contribute to slowing population growth by making the city less attractive to prospective residents. This balancing feedback can help limit housing demand, house and rent prices, and other urban pressures related to population growth compared to what they would have been otherwise (Ríos-Ocampo and Gary, 2025). However, this strategy must align with social policies to ensure that disadvantaged population groups can access housing opportunities without affecting their quality of life (Howden-Chapman et al., 2023).
In addition, urban sprawl affects cities' peri-urban areas and neighboring towns by pulling them into metropolitan areas (Lawton and Morrison, 2022). Although these areas may serve as bedroom communities and offer housing options for the larger city, they can adversely affect residents' quality of life by requiring longer commutes to access services and facilities, along with a shortage of job opportunities nearby (Lee and Ahn, 2005). This problem requires action from government institutions at the city and regional levels to align urban planning with regional planning concerning land use, housing development, and transport capacity, in order to prevent unintended consequences from housing development projects and urban sprawl (Dadashpoor et al., 2019; Paulsen, 2014).
Other researchers have suggested moratorium policies to reduce the development of new housing development (Malterre-Barthes, 2025; Marçal et al., 2023; Pagani et al., 2025), which would have the same effects of increasing house prices and reducing the attractiveness of the city to current and prospective residents. This balancing feedback also highlights the relevance and importance of the attractiveness principle (Meadows, 2002) to address contemporary urban planning problems and challenges. One fundamental solution involves local and regional governments and industry working together to establish and develop new areas, well outside of existing major cities, that require regional planning integration. This approach will attract residents and businesses and grow to become prosperous mid-sized urban areas (Lee and Ahn, 2005; Rodríguez-Pose and Griffiths, 2021; Trejo-Nieto, 2024). Such solutions are more likely to emerge from state government agencies rather than local city governments, due to the requirement to invest well beyond the existing urban areas.
Alternative strategies have been proposed, such as urban cointainment strategies that involve increasing housing density (Duranton and Puga, 2020; Karlen et al., 2022). As mentioned above, this strategy was proposed in the 1968 urban planning report (State Planning Authority of NSW, 1968), but it has been rarely implemented in Greater Sydney. While increasing density can enhance efficiencies in infrastructure and reduce motor vehicle dependence, with impacts on the economy and environment, this does not necessarily alleviate housing prices by providing a greater supply of housing for a given area in the city and higher density also does not solve the broader problems caused by a larger city population on other types of infrastructure (Alexander and Tomalty, 2002; Paulsen, 2014). This strategy may not ultimately prove to be the panacea for all urban problems over the long term of 50 to 100 years. Increasing the density of previously built-up areas involves long time delays, disruption from construction, may increase the amount of heat-absorbing building materials in a given area, and policymakers will eventually face limits to further increases in density (Duranton and Puga, 2020; Li et al., 2020; Vij et al., 2021). Increasing density may simply delay the arrival of an even more serious problem in the future: unaffordable high-density housing in megacities suffering from numerous social and environmental challenges (Aguilar et al., 2022).
In contrast to the many negative aspects of falling housing affordability, this paper highlights an important benefit of high housing prices: reducing city attractiveness lowers population growth and maintains house prices lower than they would otherwise be. More research attention should be directed toward strategies that proactively manage housing demand to improve societal wellbeing in Greater Sydney and other cities worldwide. For example, future research may empirically evaluate the short-term, medium-term, and long-term impact of high house prices on cities and societal wellbeing. More work may also focus on using simulation modeling to conduct computer experiments, test Sydney's policies, and compare them with other experiments, such as those conducted in Urban Dynamics (Forrester, 1969). Future research could also compare the structure described here with the structure presented in previous research, such as Eskinasi (2014) and Marçal et al. (2023). Future research may also implement existing concepts, such as urban metabolism (Kennedy et al., 2011), to understand urban growth and the limits to city growth beyond focusing on material and energy consumption. Finally, the analysis of urban planning processes in different cities may reveal common and unique strategies and policymakers' perceptions about causal relationships in the housing sector.
Data availability statement
Publicly available datasets were analyzed in this study. This data can be found at: https://zenodo.org/records/13750800.
Author contributions
JR-O: Conceptualization, Data curation, Formal analysis, Investigation, Methodology, Visualization, Writing – original draft, Writing – review & editing. MG: Conceptualization, Supervision, Writing – review & editing, Formal analysis.
Funding
The author(s) declare that no financial support was received for the research and/or publication of this article.
Conflict of interest
The authors declare that the research was conducted in the absence of any commercial or financial relationships that could be construed as a potential conflict of interest.
Generative AI statement
The author(s) declare that no Gen AI was used in the creation of this manuscript.
Publisher's note
All claims expressed in this article are solely those of the authors and do not necessarily represent those of their affiliated organizations, or those of the publisher, the editors and the reviewers. Any product that may be evaluated in this article, or claim that may be made by its manufacturer, is not guaranteed or endorsed by the publisher.
References
.idcommunity. (2025). Greater Sydney. Economic profile. Regional Development Australia. Available online at: https://economy.id.com.au/rda-sydney/gross-product (Accessed June 24, 2025).
ABS. (2019). Australian Historical Population Statistics. Australian Bureau of Statistics. Available online at: https://www.abs.gov.au/statistics/people/population/historical-population/latest-release (Accessed October 6, 2023).
ABS. (2023a). New Insights into the Rental Market. Australian Bureau of Statistics. Available online at: https://www.abs.gov.au/statistics/detailed-methodology-information/information-papers/new-insights-rental-market#cite-window1 (Accessed October 10, 2023).
ABS. (2023b). Population Projections, Australia. Australian Bureau of Statistics. Available online at: https://www.abs.gov.au/statistics/people/population/population-projections-australia/latest-release#capital-cities (Accessed January 30, 2023).
ABS. (2023c). Region Summary: Greater Sydney. Australian Bureau of Statistics. Available online at: https://dbr.abs.gov.au/region.html?lyr=gccsaandrgn=1GSYD (Accessed October 6, 2023).
ABS. (2024a). Population Projections by Region, 2022–2071. Australian Bureau of Statistics. Available online at: https://shorturl.at/639bF (Accessed January 30, 2023).
ABS. (2024b). Regional Population. Australian Bureau of Statistics. Available online at: https://dbr.abs.gov.au/region.html?lyr=gccsaandrgn=1GSYD (Accessed January 30, 2023).
ABS. (2024c). Total Value of Dwellings. Australian Bureau of Statistics. Available online at: https://www.abs.gov.au/statistics/economy/price-indexes-and-inflation/total-value-dwellings/latest-release#revisions-and-changes (Accessed February 17, 2025).
Aguilar, A. G., Flores, M. A., and Lara, L. F. (2022). Peri-urbanization and land use fragmentation in Mexico City. Informality, environmental deterioration, and ineffective urban policy [original research]. Front. Sustain. Cities 4:790474.
Alexander, D., and Tomalty, R. (2002). Smart growth and sustainable development: challenges, solutions and policy directions. Local Environ. 7, 397–409.
Alfeld, L. E., and Graham, A. K. (1976). Introduction to Urban Dynamics. Cambridge, MA: Wright-Allen Press.
Alves, S. (2022). Divergence in planning for affordable housing: a comparative analysis of England and Portugal. Prog. Plann. 156:100536.
Arcadis. (2022). The Arcadis Sustainable Cities Index 2022. Arcadis. Available online at: https://www.arcadis.com/ (Accessed June 24, 2025).
Bach, M., Tustanovski, E., Ip, A. W. H., Yung, K.-L., and Roblek, V. (2019). System dynamics models for the simulation of sustainable urban development. Kybernetes 49, 460–504.
Bangura, M., and Lee, C. L. (2019). The differential geography of housing affordability in Sydney: a disaggregated approach. Aust. Geogr. 50, 295–313.
Bassolas, A., Barbosa-Filho, H., Dickinson, B., Dotiwalla, X., Eastham, P., Gallotti, R., et al. (2019). Hierarchical organization of urban mobility and its connection with city livability. Nat. Commun. 10:4817.
Birrell, B., and McCloskey, D. (2016). Sydney and Melbourne's Housing Affordability Crisis Report Two: No End in Sight. Canberra: The Australian Population Research Institute.
BITRE. (2015). Traffic and Congestion Cost Trends for Australian Capital Cities. Department of infrastructure transport regional development communications and the arts. Available online at: https://www.bitre.gov.au/publications/2015/is_074 (Accessed June 24, 2025).
Bubathi, V., Leslie, L., Speer, M., Hartigan, J., Wang, J., and Gupta, A. (2023). Impact of accelerated climate change on maximum temperature differences between western and coastal Sydney. Climate 11:76.
Bunker, R., Freestone, R., and Randolph, B. (2017). “Sydney: growth, globalization and governance,” in Planning Metropolitan Australia (London: Routledge), 76–100.
Buzogany, R. F., Kopainsky, B., and Gonçalves, P. (2024). Developing theoretically grounded causal maps to examine and improve policy narratives about global challenges. Syst. Dyn. Rev. 40:e1788.
C40. (2022). The Power of C40 Cities. C40 Cities. Available online at: https://www.c40.org/cities (Accessed March 10, 2021).
Chaston, T. B., Broome, R. A., Cooper, N., Duck, G., Geromboux, C., Guo, Y., et al. (2022). Mortality burden of heatwaves in Sydney, Australia is exacerbated by the urban heat island and climate change: can tree cover help mitigate the health impacts? Atmosphere 13:714.
CHIA (2024). No Hope Without Housing. Pre-budget submission 2024-2025. Community Housing Industry Association NSW. Available online at: https://communityhousing.org.au/wp-content/uploads/2024/02/CHIA-NSW-PBS-2024-25-No-Hope-Without-Housing.pdf (Accessed June 24, 2025).
Chung, R. Y., Chung, G. K., Gordon, D., Mak, J. K., Zhang, L. F., Chan, D., et al. (2020). Housing affordability effects on physical and mental health: household survey in a population with the world's greatest housing affordability stress. J. Epidemiol. Community Health 74, 164–172.
Clark, G., and Moonen, T. (2016). Agglomeration, Centres, and District Plans for the Greater Sydney Commission. Lessons from International Experience. NSW Department of Planning and Environment and Greater Sydney Commission. Available online at: https://policycommons.net/artifacts/4774407/agglomeration-centres-and-district-plans-for-the-greater-sydney-commission/5610637/ (Accessed June 24, 2025).
Committee for Sydney and Ipsos. (2023). Life in Sydney 2023. Committee for Sydney. Available online at: https://www.ipsos.com/en-au/lifeinsydney (Accessed June 24, 2025).
Coupe, T. (2021). How global is the affordable housing crisis? Int. J. Hous. Mark. Anal. 14, 429–445.
Dadashpoor, H., Azizi, P., and Moghadasi, M. (2019). Land use change, urbanization, and change in landscape pattern in a metropolitan area. Sci. Total Environ. 655, 707–719.
Department of Planning. (2005). Metropolitan Strategy: City of Cities - A Plan for Sydney's Future. Sydney, NSW: Department of Planning.
Department of the Prime Minister and Cabinet. (2016). Smart Cities Plan. National Cities Performance Framework. Final Report. The Department of the Prime Minister and Cabinet. Available online at: https://www.infrastructure.gov.au/sites/default/files/migrated/cities/national-cities-performance-framework/files/National_Cities_Performance_Framework_Final_Report.pdf (Accessed June 24, 2025).
EIU. (2023). The Global Liveability Index 2023. Economist Intelligence. Available online at: https://www.eiu.com/n/campaigns/global-liveability-index-2023/ (Accessed June 23, 2023).
Eker, S., and Zimmermann, N. (2016). Using textual data in system dynamics model conceptualization. Systems 4:28.
Eskinasi, M. (2014). Towards Housing System Dynamics: Projects on Embedding System Dynamics in Housing Policy Research. Delft: Eburon Academic Publishers.
Eskinasi, M., Rouwette, E., and Vennix, J. (2009). Simulating urban transformation in Haaglanden, the Netherlands. Syst. Dyn. Rev. 25, 182–206.
Farid Uddin, K., Piracha, A., and Phibbs, P. (2022). A tale of two cities: contemporary urban planning policy and practice in Greater Sydney, NSW, Australia. Cities 123:103583.
Forrester, J. (1980). Information sources for modeling the national economy. J. Am. Stat. Assoc. 75, 555–566.
Ghaffarzadegan, N., Lyneis, J., and Richardson, G. P. (2011). How small system dynamics models can help the public policy process. Syst. Dyn. Rev. 27, 22–44.
Giles-Corti, B., Saghapour, T., Turrell, G., Gunn, L., Both, A., Lowe, M., et al. (2022). Spatial and socioeconomic inequities in liveability in Australia's 21 largest cities: does city size matter? Health Place 78:102899.
Greater Sydney Commission. (2018). Greater Sydney Regional Plan. A Metropolis of Three Cities - Connecting People. Greater Sydney Commission. Available online at: https://www.planning.nsw.gov.au/sites/default/files/2024-04/greater-sydney-region-plan.pdf (Accessed June 24, 2025).
Groesser, S. N., and Schaffernicht, M. (2012). Mental models of dynamic systems: taking stock and looking ahead. Syst. Dyn. Rev. 28, 46–68.
Gunn, L. D., Saghapour, T., Giles-Corti, B., and Turrell, G. (2022). Exploring inequities in housing affordability through an analysis of walkability and house prices by neighbourhood socioeconomic disadvantage. Cities Health 6, 616–634.
Haase, D., Kabisch, N., and Haase, A. (2013). Endless urban growth? On the mismatch of population, household and urban land area growth and its effects on the urban debate. PLoS ONE 8:e66531.
Han, H., Kim, S., Jin, M. Y., and Pettit, C. (2021). Providing affordable housing through urban renewal projects in Australia Expert opinions on barriers and opportunities. Int. Rev. Spat. Plan. Sustain. Dev. 9, 41–61. doi: 10.14246/irspsd.9.2_41
Howden-Chapman, P., Bennett, J., Edwards, R., Jacobs, D., Nathan, K., and Ormandy, D. (2023). Review of the impact of housing quality on inequalities in health and well-being. Annu. Rev. Public Health 44, 233–254.
Infranca, J. (2019). The New State Zoning: Land Use Preemption Amid a Housing Crisis. BCL Rev. 60:823.
Innovation Cities. (2021). Innovation Cities™ Index. Available online at: https://www.innovation-cities.com/innovation-cities-index-2021-global-500/25718/ (Accessed October 11, 2021).
Karlen, C., Pagani, A., and Binder, C. R. (2022). Obstacles and opportunities for reducing dwelling size to shrink the environmental footprint of housing: tenants' residential preferences and housing choice. J. Hous. Built Environ. 37, 1367–1408.
Kelly, J.-F., and Donegan, P. (2015). City Limits: Why Australia's Cities are Broken and How We Can Fix Them. Carlton, VIC: Melbourne University Publishing.
Kennedy, C., Pincetl, S., and Bunje, P. (2011). The study of urban metabolism and its applications to urban planning and design. Environ. Pollut. 159, 1965–1973.
Kim, H., and Andersen, D. F. (2012). Building confidence in causal maps generated from purposive text data: mapping transcripts of the federal reserve. Syst. Dyn. Rev. 28, 311–328.
Lane, D. C. (2000). Should system dynamics be described as a ‘hard'or ‘deterministic' systems approach? Syst. Res. Behav. Sci. 17, 3–22. doi: 10.1002/(SICI)1099-1743(200001/02)17:1<3::AID-SRES344>3.0.CO;2-7
Lauf, S., Haase, D., Seppelt, R., and Schwarz, N. (2012). Simulating demography and housing demand in an urban region under scenarios of growth and shrinkage. Environ. Plan. B 39, 229–246.
Lawton, A., and Morrison, N. (2022). The loss of peri-urban agricultural land and the state-local tensions in managing its demise: the case of Greater Western Sydney, Australia. Land Use Policy 120:106265.
Lee, C.-M., and Ahn, K.-H. (2005). Five new towns in the Seoul metropolitan area and their attractions in non-working trips: implications on self-containment of new towns. Habitat Int. 29, 647–666.
Leishman, C., Liang, W., and Sim, N. (2023). The impact of urban population on housing cost: the case of Australia. NPJ Urban Sustain. 3:57.
Li, X., Zhou, Y., Hejazi, M., Wise, M., Vernon, C., Iyer, G., et al. (2021). Global urban growth between 1870 and 2100 from integrated high resolution mapped data and urban dynamic modeling. Commun. Earth Environ. 2:201.
Li, Y., Schubert, S., Kropp, J. P., and Rybski, D. (2020). On the influence of density and morphology on the urban heat island intensity. Nat. Commun. 11:2647.
Lu, J., Li, B., Li, H., and Al-Barakani, A. (2021). Expansion of city scale, traffic modes, traffic congestion, and air pollution. Cities 108:102974.
Luna-Reyes, L. F., and Andersen, D. L. (2003). Collecting and analyzing qualitative data for system dynamics: methods and models. Syst. Dyn. Rev. 19, 271–296.
Mahtta, R., Fragkias, M., Güneralp, B., Mahendra, A., Reba, M., Wentz, E. A., et al. (2022). Urban land expansion: the role of population and economic growth for 300+ cities. NPJ Urban Sustain. 2:5.
Manolchev, C., Cherrington, R., and Crabolu, G. (2024). Untangling circularity: transitioning to a regional circular economy in the clothing and textile sector in England. J. Clean. Prod. 482:144188.
Marçal, K. E., Fowler, P. J., and Hovmand, P. S. (2023). Feedback dynamics of the low-income rental housing market: exploring policy responses to COVID-19. Syst. Dyn. Rev. 39, 371–403.
McPhearson, T., M. Raymond, C., Gulsrud, N., Albert, C., Coles, N., Fagerholm, N., et al. (2021). Radical changes are needed for transformations to a good Anthropocene. NPJ Urban Sustain. 1:5.
Meadows, D. H. (2002). Controlling growth by controlling attractiveness. Syst. Dyn. Rev. 18, 137–138.
Meehan, K., Jurjevich, J. R., Everitt, L., Chun, N. M. J. W., and Sherrill, J. (2025). Urban inequality, the housing crisis and deteriorating water access in US cities. Nat. Cities 2, 93–103.
Mohajerani, A., Bakaric, J., and Jeffrey-Bailey, T. (2017). The urban heat island effect, its causes, and mitigation, with reference to the thermal properties of asphalt concrete. J. Environ. Manag. 197, 522–538.
Morris, A. (2021). An impossible task? Neoliberalism, the financialisation of housing and the City of Sydney's endeavours to address its housing affordability crisis. Int. J. Hous. Policy 21, 23–47.
NSW Government. (2023). Greater Sydney Urban Development Program Dashboard. NSW Government. Available online at: https://app.powerbi.com/view?r=eyJrIjoiMjk5N2NiMmYtYTNhZC00N2EyLTgyNWYtOTU4YzIzYTA5OTY1IiwidCI6Ijk2ZWY4ODIxLTJhMzktNDcxYy1iODlhLTY3YjA4MzNkZDNiOSJ9 (Accessed June 24, 2025).
Pagani, A., Macmillan, A., Savini, F., Davies, M., and Zimmermann, N. (2025). What if there were a moratorium on new housebuilding? An exploratory study with London-based housing associations. Built Environ. 51, 73–94.
Palm, M., Raynor, K. E., and Warren-Myers, G. (2020). Examining building age, rental housing and price filtering for affordability in Melbourne, Australia. Urban Stud. 58, 809–825.
Paulsen, K. (2014). Geography, policy or market? New evidence on the measurement and causes of sprawl (and infill) in US metropolitan regions. Urban Stud. 51, 2629–2645.
Pawson, H., Milligan, V., and Yates, J. (2020). “Roles of land use planning policy in housing supply and affordable housing,” in Housing Policy in Australia: A Case for System Reform, eds. H. Pawson, V. Milligan, and J. Yates (Springer Nature: Singapore), 299–337.
Pineo, H., Zimmermann, N., and Davies, M. (2020). Integrating health into the complex urban planning policy and decision-making context: a systems thinking analysis. Palgrave Commun. 6:21.
Reia, S. M., Rao, P. S. C., Barthelemy, M., and Ukkusuri, S. V. (2024). Domestic migration and city rank dynamics. Nat. Cities 2, 38–46.
Ríos-Ocampo, J. P., and Gary, M. S. (2024). Urban Growth Strategy in Greater Sydney Leads to Unintended Social and Environmental Challenges - Supporting Data. Zenodo.
Ríos-Ocampo, J. P., and Gary, M. S. (2025). Urban growth strategy in greater sydney leads to unintended social and environmental challenges. Nat. Cities 2, 1–11. doi: 10.1038/s44284-024-00187-6
Rodríguez-Pose, A., and Griffiths, J. (2021). Developing intermediate cities. Reg. Sci. Policy Pract. 13, 441–457.
Sager, T. (2011). Neo-liberal urban planning policies: a literature survey 1990–2010. Prog. Plann. 76, 147–199. doi: 10.1016/j.progress.2011.09.001
Searle, G. (2020). Population growth and development: an outcome of Sydney's metropolitan governance. Aust. Plan. 56, 65–72.
Sharifi, E., and Lehmann, S. (2015). Comparative analysis of surface urban heat island effect of rooftops and streetscapes in Central Sydney. J. Urban Environ. Eng. 9, 3–11.
State Planning Authority of NSW. (1968). Sydney Region: Outline Plan, 1970–2000 A. D. A Strategy for Development. TSPAoNS Wales.
Stave, K. A., and Kopainsky, B. (2015). A system dynamics approach for examining mechanisms and pathways of food supply vulnerability. J. Environ. Stud. Sci. 5, 321–336.
Sterman, J. D. (2000). Business Dynamics: Systems Thinking and Modeling for a Complex World. Boston, MA: McGraw-Hill Education.
Stone, B., Hess, J. J., and Frumkin, H. (2010). Urban form and extreme heat events: are sprawling cities more vulnerable to climate change than compact cities? Environ. Health Perspect. 118, 1425–1428.
Tomoaia-Cotisel, A., Allen, S. D., Kim, H., Andersen, D., and Chalabi, Z. (2022). Rigorously interpreted quotation analysis for evaluating causal loop diagrams in late-stage conceptualization. Syst. Dyn. Rev. 38, 41–80.
Trejo-Nieto, A. (2024). Unveiling the intermediate role of Mexico's mid-sized metropolises. Reg. Stud. Reg. Sci. 11, 777–797.
UN-Habitat. (2020). World Cities Report 2020. The Value of Sustainable Urbanization. UNHSP (UN-Habitat).
Valencia, V. H., Levin, G., and Ketzel, M. (2023). Densification vs. urban sprawl. Modeling the impact of two urban growth scenarios on air quality. Atmos. Environ. 310:119963.
van den Nouwelant, R., Troy, L., and Soundararaj, B. (2022). Quantifying Australia's Unmet Housing Need. Available online at: https://apo.org.au/node/320820 (Accessed June 24, 2025).
Van Hear, N., Bakewell, O., and Long, K. (2018). Push-pull plus: reconsidering the drivers of migration. J. Ethn. Migr. Stud. 44, 927–944.
Vij, A., Connor, J. D., and Beer, A. (2021). The negative effects of urban agglomeration on housing affordability in Australia. Australas. J. Reg. Stud. 27, 26–46. doi: 10.3316/informit.017602490275317
Keywords: housing affordability, causal maps, system dynamics, urban planning, urban growth, city attractiveness, population growth, urban sustainability
Citation: Ríos-Ocampo JP and Gary MS (2025) How city attractiveness and population growth created unaffordable housing in Greater Sydney. Front. Sustain. 6:1621152. doi: 10.3389/frsus.2025.1621152
Received: 30 April 2025; Accepted: 16 June 2025;
Published: 11 July 2025.
Edited by:
Nici Zimmermann, University College London, United KingdomReviewed by:
Christoph Schünemann, Leibniz Institute of Ecological Urban and Regional Development (LG), GermanyMartijn Eskinasi, Ministerie van VRO - Directie Wonen, Netherlands
Copyright © 2025 Ríos-Ocampo and Gary. This is an open-access article distributed under the terms of the Creative Commons Attribution License (CC BY). The use, distribution or reproduction in other forums is permitted, provided the original author(s) and the copyright owner(s) are credited and that the original publication in this journal is cited, in accordance with accepted academic practice. No use, distribution or reproduction is permitted which does not comply with these terms.
*Correspondence: Juan Pablo Ríos-Ocampo, anVhbi5yaW9zQHN0cmF0aC5hYy51aw==