 César José Vergara Rodríguez
 Gean Pablo Mendoza-Ortega*
 Mayerlis Mármol Barriosnuevo
 Mayerly Díaz Sierra
- Engineering and Architecture, Department of Basic Sciences, Corporación Universitaria del Caribe CECAR, Sincelejo, Colombia
Yam agri-food chains in the department of Sucre experience logistical losses exceeding 30% in certain stages, compromising both economic performance and social sustainability. To address these inefficiencies, this study develops a multi-objective optimization model that supports strategic planning by integrating profit maximization and loss minimization criteria. The model was implemented in GAMS (version 49.6.1) using the CPLEX 12.8 solver and solved through the AUGMECON method. The resulting Pareto-efficient solutions were evaluated using slope analysis and the TOPSIS multi-criteria decision method. The results reveal a clear trade-off between economic benefit and loss reduction, identifying Solution 14 as the most balanced configuration, achieving approximately USD 4.241 million in profits and 683,818 kg in losses. These findings highlight the potential of combining multi-objective modeling and decision-support analysis to promote more sustainable planning in agri-food chains. The proposed strategies—focused on loss reduction, supplier diversification, and optimized sowing planning—offer practical guidance for improving territorial sustainability and decision-making in regional agricultural systems.
1 Introduction
According to FAO et al. (2024) in 2020 one in three people worldwide (2.37 billion) lacked adequate food, representing an increase of nearly 320 million in a single year. In addition, it is estimated that around 670 million people will suffer from hunger in 2030, equivalent to 8% of the world’s population (FAO et al., 2022). In Colombia, a 2022 humanitarian needs study revealed that approximately 7.3 million people are food insecure and malnourished (Global Panel, 2020; FAO et al., 2024). This situation persists due to low food security indicators.
In the Department of Sucre, Colombia, food insecurity has increased, reaching an alarming 73.4%, according to data from the director of the Department of Social Prosperity in Sucre (Sucre noticias, 2019). The deterioration of food security over time is the result of weak food systems, influenced by various factors.
In this context, strengthening Food Systems (FS) requires sustainable management of agri-food supply chains to improve food security indicators (FAO et al., 2024). Tapia (2016) emphasize that strengthening the agricultural sector is crucial for industrial development, food security, and sustainability.
Agricultural efficiency has been widely analyzed using productivity growth approaches such as the Malmquist index (Zuniga González, 2020). These studies provide a foundation for more advanced approaches by evaluating agricultural systems in terms of efficiency and productivity. Building on this perspective, the present study goes beyond descriptive analyses of productivity to propose a prescriptive, multi-objective optimization model that directly supports decision-making in crop planning and supply chain management.
Optimization techniques are widely applied to solve complex problems in resource allocation, transportation, logistics, project selection, and planning. These challenges, common in manufacturing and business, also occur in agricultural systems, for example in crop selection (Detlefsen and Jensen, 2004).
Weintraub and Romero (2006) highlight that a wide range of agricultural resource management problems have been formulated as mathematical programming models and solved with diverse optimization methods. The approaches presented in the study range from simple models to complex multi-objective configurations, covering both linear and non-linear formulations. The optimization techniques applied in these studies include conventional methods as well as computational intelligence-based approaches.
In scientific literature, several agricultural planning problems have been modelled as multi-objective problems (Francisco and Ali, 2006; Joubert et al., 2007). However, these problems are often solved using single-objective models by methods such as conventional goal programming or compromise programming approaches. While many critical decisions are based on these single-objective solutions, approaches that simultaneously optimize all objectives could provide more robust solutions and a more complete understanding of the problem. This would be critical to improve decision-making in the highly competitive environment of today’s markets.
Multi-objective optimization addresses problems with two or more conflicting objectives, generating a set of Pareto-efficient solutions instead of a single optimum. These approaches are particularly useful in agri-food contexts where economic, social, and environmental criteria coexist.
This paper presents a bi-objective linear model for yam crop planning in Sucre, Colombia, and proposes sustainable strategies for its agri-food supply chain. Our aim is to provide insight into solving multi-objective optimization problems and to demonstrate the usefulness of these tools in generating sustainable strategies for crop planning.
Recent research has underscored the relevance of designing innovative models for the bioeconomy, aimed at aligning agricultural planning with sustainability goals (Zuniga-Gonzalez et al., 2024). In line with this perspective, the present study develops a multi-objective optimization model applied to the yam supply chain in Sucre, Colombia, integrating both economic and social dimensions to support sustainable agricultural strategies.
To this end, we validate a multi-objective optimization model through an applied linear programming (LP) case study, focusing on the economic and social aspects that foster sustainability. In social terms, we seek to minimize losses in the chain, while in economic terms we seek to maximize profitability. After evaluating the performance of the proposed model, we will identify strategies to improve the sustainable management of yam cultivation in Sucre. Our aim is to promote a profitable and sustainable supply chain that also contributes positively to food security.
In addition, we explore solutions using the conventional method known as the augmented ε-constraints or AUGMECON method to solve a simple multi-objective problem. From this basis, we extend our analysis to the solutions found, focusing on determining different solution scenarios, which are conducive to strategy generation.
The article is structured as follows: Section 2 presents the crop planning problem and its mathematical formulation. Section 3 describes three multi-objective optimization methods, illustrated with a numerical example. Section 4 applies the AUGMECON method to solve the proposed model and complements it with a TOPSIS-based analysis to identify the most balanced solution. Section 5 discusses the results, and the final section summarizes conclusions and directions for future research.
2 Literature review
This section reviews research on the sustainable management of agri-food supply chains through mathematical modeling, focusing on strategies proposed for sustainability using optimization approaches. The following is a brief review of the literature related to the topic of study:
Gholian-Jouybari et al. (2023) propose a multi-objective model for agricultural supply chain management, applying marketing strategies. The main objective of this approach is to simultaneously improve the key aspects of sustainability: environmental, social and economic. This is achieved by optimizing total profit, customer satisfaction and efficient water management. Chandrasiri et al. (2022) developed a multi-decision simulation and optimization model to determine the ideal structure of the banana agri-food supply chain in Sri Lanka. For this study, aspects such as the reduction of the environmental impact of the chain were considered, considering the reduction of greenhouse gases and post-harvest losses.
Considering an altruistic consumer-oriented approach, Wei et al. (2022) build an optimization model for operational decision-making in a CSA engaged in agricultural production in a Chinese province, balancing the economic, social and environmental dimensions of sustainability. The model’s operational decisions include setting wholesale prices by producers and retail prices by retailers, as well as determining the rate at which producers reduce pollutant emissions. Xie et al. (2022) designed a sustainable network for the agri-food supply chain (ASC) of mushrooms under uncertainty. The sustainable approach is considered in the model from the environmental point of view by minimizing pollutants in the network, and from the economic point of view by minimizing the total costs of the network. In this work, a multi-objective optimization model is proposed, which considers uncertainty in demand. The uncertainty in the model is worked under a robust optimization approach.
In the work by Perdana et al. (2022), a mixed integer linear programming model is constructed for distribution management in a rice supply chain, which seeks to maximize demand fulfilment from the retailer’s point of view, in a province of Indonesia. This model also considers sustainability pillars such as the social pillar, as it seeks to reduce hunger and increase the welfare of farmers by maximizing the fulfilment of rice demand. Similarly, the tool aims to maximize profits for chain actors by minimizing costs, thereby reducing the network’s carbon footprint and supporting the environmental pillar of sustainability.
Krishnan et al. (2022) in their research, propose a robust and integrated multi-objective optimization model for the design of a Sustainable Agri-Food Supply Chain (ASSC) in an Indian mango pulp supply chain. This model incorporates the three dimensions of sustainability—social, environmental, and economic, while also accounting for product perishability, food waste valorization, and raw material supply uncertainty. This uncertainty is modelled using a robust optimization approach and the impact of uncertainty on sustainability dimensions and business decisions is assessed. Moreover, the sustainable economic dimension is addressed in the model by minimizing the costs associated with the chain, the sustainable environmental dimension is focused by decreasing the total emissions in the chain, and the sustainable social dimension is incorporated by maximizing the total number of job opportunities created.
2.1 Multi-objective optimization methods
Different approaches have been developed to solve multi-objective problems, commonly classified as a priori, a posteriori, and interactive methods (Mavrotas, 2009). These categories differ in the stage at which decision-maker preferences are incorporated.
In the priori approach, the decision-maker specifies preferences, such as the weighting of objectives, before the optimization process. In contrast, the posteriori approach selects a set of solutions after the optimization results are obtained. A third category includes interactive methods, in which the decision-maker analyzes partial information during the optimization process and provides feedback in real time. Next, 2 methods of a priori solutions are proposed; the weighted sum method and the epsilon method, where according to a review of the literature carried out for the year 2013, 696 and 399 articles had been written, respectively, (Aranda and Orjuela, 2015).
2.1.1 Weighted summation method
This method transforms a multi-objective model into a single-objective model by assigning coefficients (weights) to each objective, where each weight reflects the relative importance of that objective compared to the others. These weights are parametrically adjusted to generate a set of solutions, from which the researcher or decision-maker can analyze and select the optimal solution to the problem in his/her judgement (Marler and Arora, 2010). According to Mendoza (2010) this method can be expressed mathematically as shown in Equation 1, where represents the set of objective functions and is the weight assigned to each function. Where represents the set of objective functions and is the weighted weight assigned to each function. The decision on the solution obtained by this method can be made either priori or posterior (Torres, 2016).
2.1.2 Methodology of ε -restriction or epsilon
The ε-constraint method, proposed by Ehrgott and Ruzika (2008), transforms a multi-objective problem into a single-objective one. The most important objective function is optimized, while the others are incorporated as constraints with specific ε-thresholds (Cruz et al., 2009). Both the prioritized objective function and the set constraints reflect the subjective preferences of the decision maker. In this way, the multi-objective problem becomes a single-objective problem. However, this approach does not always guarantee Pareto-efficient solutions, unless the problem has a single optimum (Soler, 2013). The resulting solution corresponds to the objective defined as a priority, as shown in Table 1.
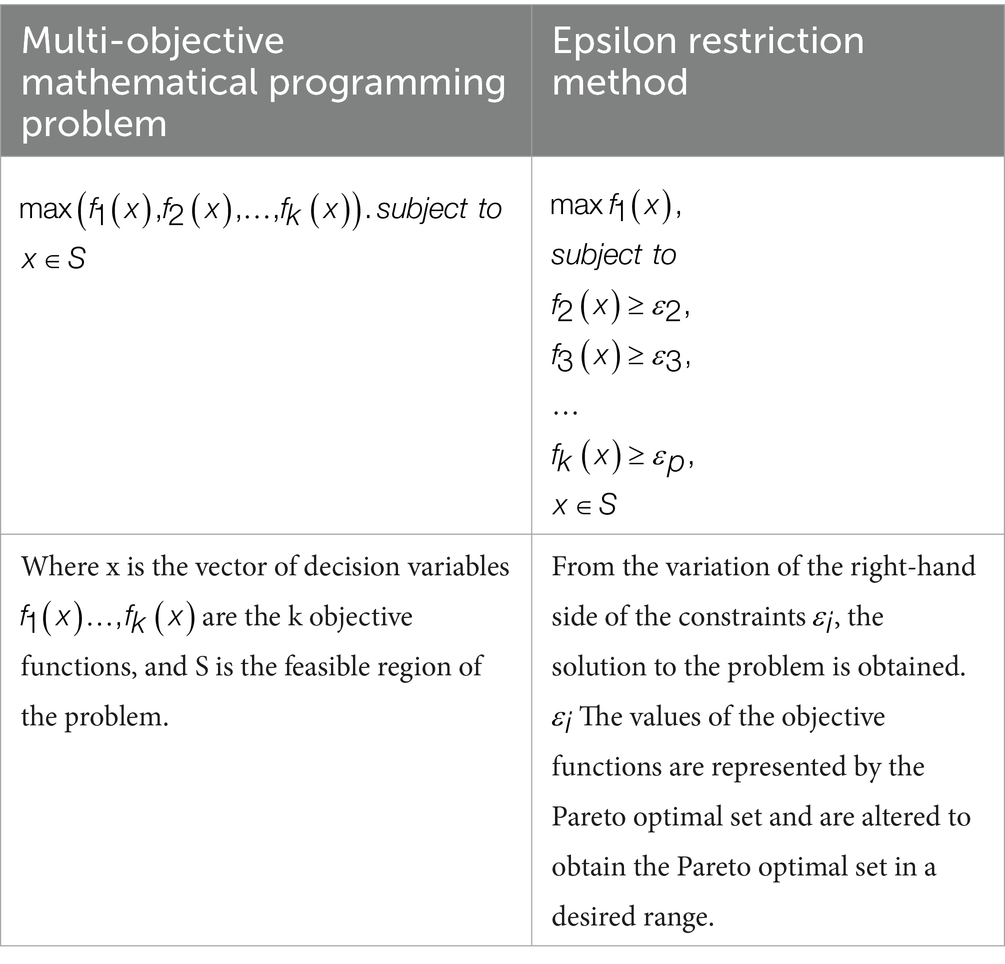
Table 1. Formulation of the epsilon constraint method.
The ε-constraint method offers significant advantages over the previously described weighted sum approach. Several studies have documented its effectiveness in solving bi-objective problems, as evidenced in Osorio et al. (2014). Likewise, an improved variant of the method is presented by Mavrotas (2009), where the author develops an algorithm in General Algebraic Modeling System (GAMS) to address multi-objective optimization problems, validated by multiple test instances. However, its implementation requires specific considerations, as warned by (Mavrotas, 2009). These include: the need to determine the range of the objective functions, the evaluation of the efficiency of the obtained solutions and the possible extension in computational resolution times.
2.1.3 Lexicographical method
The lexicographic method optimizes objective functions in hierarchical order: first the highest-priority function, then the second within the set of optimal solutions, and so forth. This approach ensures that the objective functions are considered according to their relative relevance within the problem. As indicated by Mavrotas (2009), the method operates as follows in Table 2.
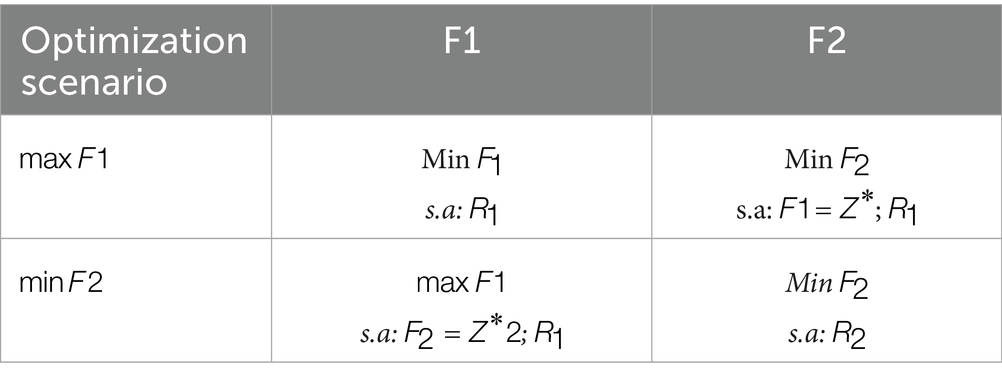
Table 2. Approach to the lexicographical method.
The lexicographic method is particularly useful when the decision-maker’s preferences can be clearly ranked. However, its implementation can become computationally complex, especially when multiple objective functions are involved or when the set of optimal solutions is very large. This complexity arises because the method requires solving a sequence of optimization problems, each conditioned by the optimal solutions of higher-priority objectives, which can significantly increase computational time and difficulty (Ehrgott and Wiecek, 2005).
2.1.4 Augmented ε-constraints method or AUGMECON method
The augmented ε-constraint method (AUGMECON) extends the classical ε-constraint approach in multi-objective optimization. Proposed by Mavrotas (2009) it improves the generation of efficient solutions in mathematical programming problems with multiple objectives subject to equality and inequality constraints.
AUGMECON introduces an additional variable ε, which acts as a penalty parameter in the constraints of non-prioritized objectives. This variable gradually relaxes the constraints, facilitating exploration of feasible space and the identification of solutions closer to the global optimum. The method is based on linear programming techniques and iterative search algorithms, adjusting the value of ε to generate different feasible solutions along the Pareto front.
One of the main advantages of this approach is that it allows finding efficient solutions without the need for all (p − 1) constraints of the objective-secondary functions to be strictly active, thus overcoming one of the limitations of the classical ε-constraint method. Thanks to this penalty mechanism, AUGMECON improves the representation of the efficient frontier and reduces the probability of generating dominated solutions, as shown in Equation 2.
To ensure that the solutions obtained are efficient, the model can be reformulated by transforming the constraints corresponding to the objective functions into equalities, by explicitly introducing slack variables . These variables represent the allowed deviation from the set values ( ) and are incorporated as a second term in the objective function, weighted by a small positive coefficient EPS, which reflects a secondary priority under a lexicographic scheme. This formulation forces the model to minimize deviations, generating only efficient solutions. The reformulated problem is expressed in Equation 3.
The application of the model formulated using the AUGMECON method guarantees the generation of only Pareto optimal or non-dominated solutions, avoiding weakly efficient solutions. This is because the method incorporates, at a second level of priority, the maximization of the slack variables within the objective function, which acts as a corrective mechanism. Thus, even if dominated solutions appear in the initial results table, the AUGMECON-adjusted model ensures that valid solutions representative of the efficient frontier are obtained (Mavrotas and Florios, 2013).
Although the preceding literature review is comprehensive, Table 3 summarizes key multi-objective optimization approaches applied to agri-food and supply chain contexts. The comparison shows that, while previous studies addressed perishability, fairness, closed-loop sustainability, or resilience, none combined agricultural planning cycles, explicit loss minimization, and a compromise solution approach (AUGMECON with TOPSIS) for yam production in Sucre, Colombia. This underscores the novelty and applicability of the proposed model for producer associations.

Table 3. Comparison of relevant studies on multi-objective models applied to agri-food chains.
3 A crop management problem
This section addresses a crop planning problem, which requires considering multiple factors such as soil type, yield rate, climatic conditions, product demand, and production costs. While many of these factors are measurable, others—such as rainfall, floods, or extreme weather events—are highly uncertain and difficult to predict. However, even with the exclusion of these non-quantifiable factors, the appropriate use of available information can generate valuable recommendations for decision-making.
In the department of Sucre, a wide variety of agricultural products are grown on land with different capacities, including single, double and triple cropped land. The allocation of crops to each soil type depends on factors such as fertility, geographic location, farming practices (e.g., irrigation), and expected profitability. For each soil type there are multiple possible combinations of annual sowings, the selection of which directly influences productive and economic efficiency. In this sense, optimal crop planning seeks to maximize the use of available land through decision-support tools, especially in strategic agro-food chains for the region.
A notable example is the yam (Dioscorea spp.) value chain in Montes de María, prioritized for its role in regional food security and its importance in the local diet (Gobernación de Sucre, 2013). This chain involves actors such as producers, collection centers, transporters, traders and intermediaries at different levels (local, municipal and national). However, producer organizations face structural barriers to international markets, mainly due to strict export protocols and high shipping costs that require investments beyond their reach (Arroyo, 2017).
The proposed multi-objective model for the management of the yam agri-food supply chain aims to optimize strategic and operational decisions related to the cultivation and distribution of the product for a specific case of an association in the department of Sucre. It seeks to determine the best times for planting and harvesting, as well as the optimal quantities of yam to transport from production sites to storage centers and then to demand points. The overall objective is twofold: to maximize producers’ profits and minimize losses along the supply chain, contributing to a more efficient and sustainable logistics process. Figure 1 shows a schematic representation of the main components and flows of this chain.
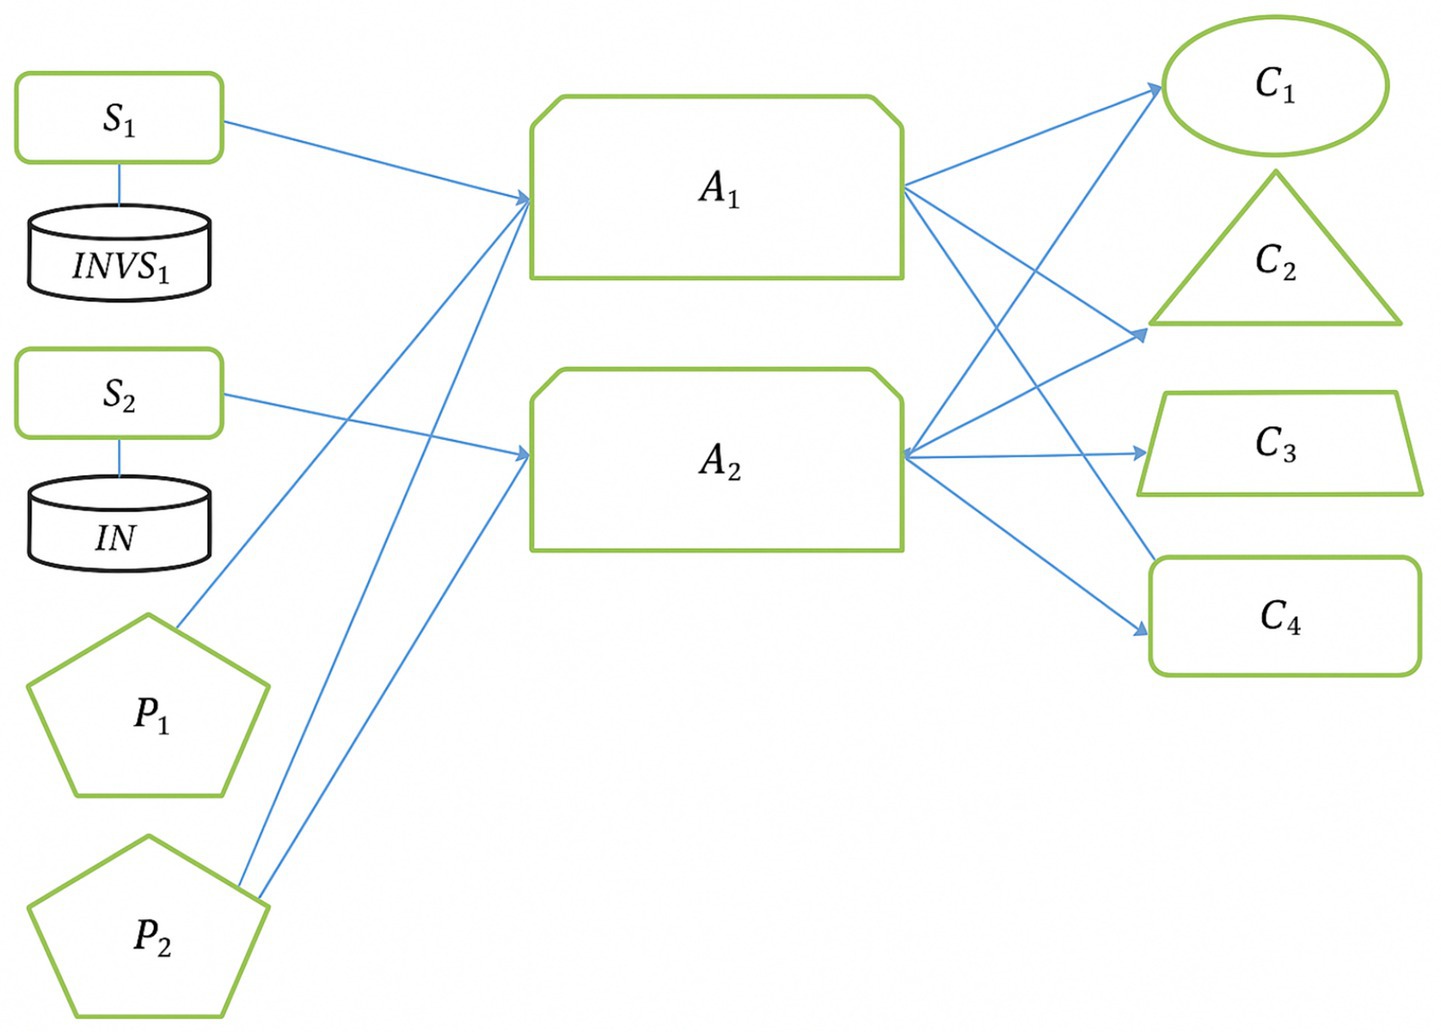
Figure 1. Schematic representation of the yam agri-food supply chain in Sucre (Colombia), showing sowing sites, producers, warehouses, and customer types. This diagram illustrates the flows and nodes considered in the optimization model.
Figure 1 illustrates the general structure of the multi-objective model designed to efficiently manage the yam supply chain in a producer association in the department of Sucre. The system considers two varieties of the product: spiny yam and diamond yam, as well as two storage warehouses represented in the center of the figure as and . These warehouses have defined capacities and are key intermediate nodes between production and demand. On the left, nodes and represent planting sites associated with initial inventories ( ). Below, nodes and represent producer units or groups of farmers growing the two yam varieties. These units are directly connected to the warehouses, where the entire harvested produce is sent for further distribution.
On the right, the nodes to represent the different types of customers: exporters, chain stores, wholesalers and retailers. The model sets specific quality constraints on the allocation of the product to these customers. Exporters and chain stores only accept quality 2 yams, while wholesalers and retailers do not receive quality 1 yams, thus meeting market requirements.
The system contemplates a planning horizon of 52 weeks (1 year) and a total of 40 planting sites (not all graphically represented), with known and deterministic production and transport costs. In addition, losses associated with transport and a fixed commission paid by farmers to the association are considered, which affects allocation decisions. Finally, yields per hectare depend on the variety of yam grown and are also considered as deterministic values. This schematic representation facilitates the understanding of the product flows and the interaction between the different actors in the chain, forming the basis for the development of the optimization model.
Table 4 summarizes the main input parameters considered in the model, including their values, units, and data sources. These parameters provide the quantitative foundation for the optimization problem and ensure transparency in the description of the case study.
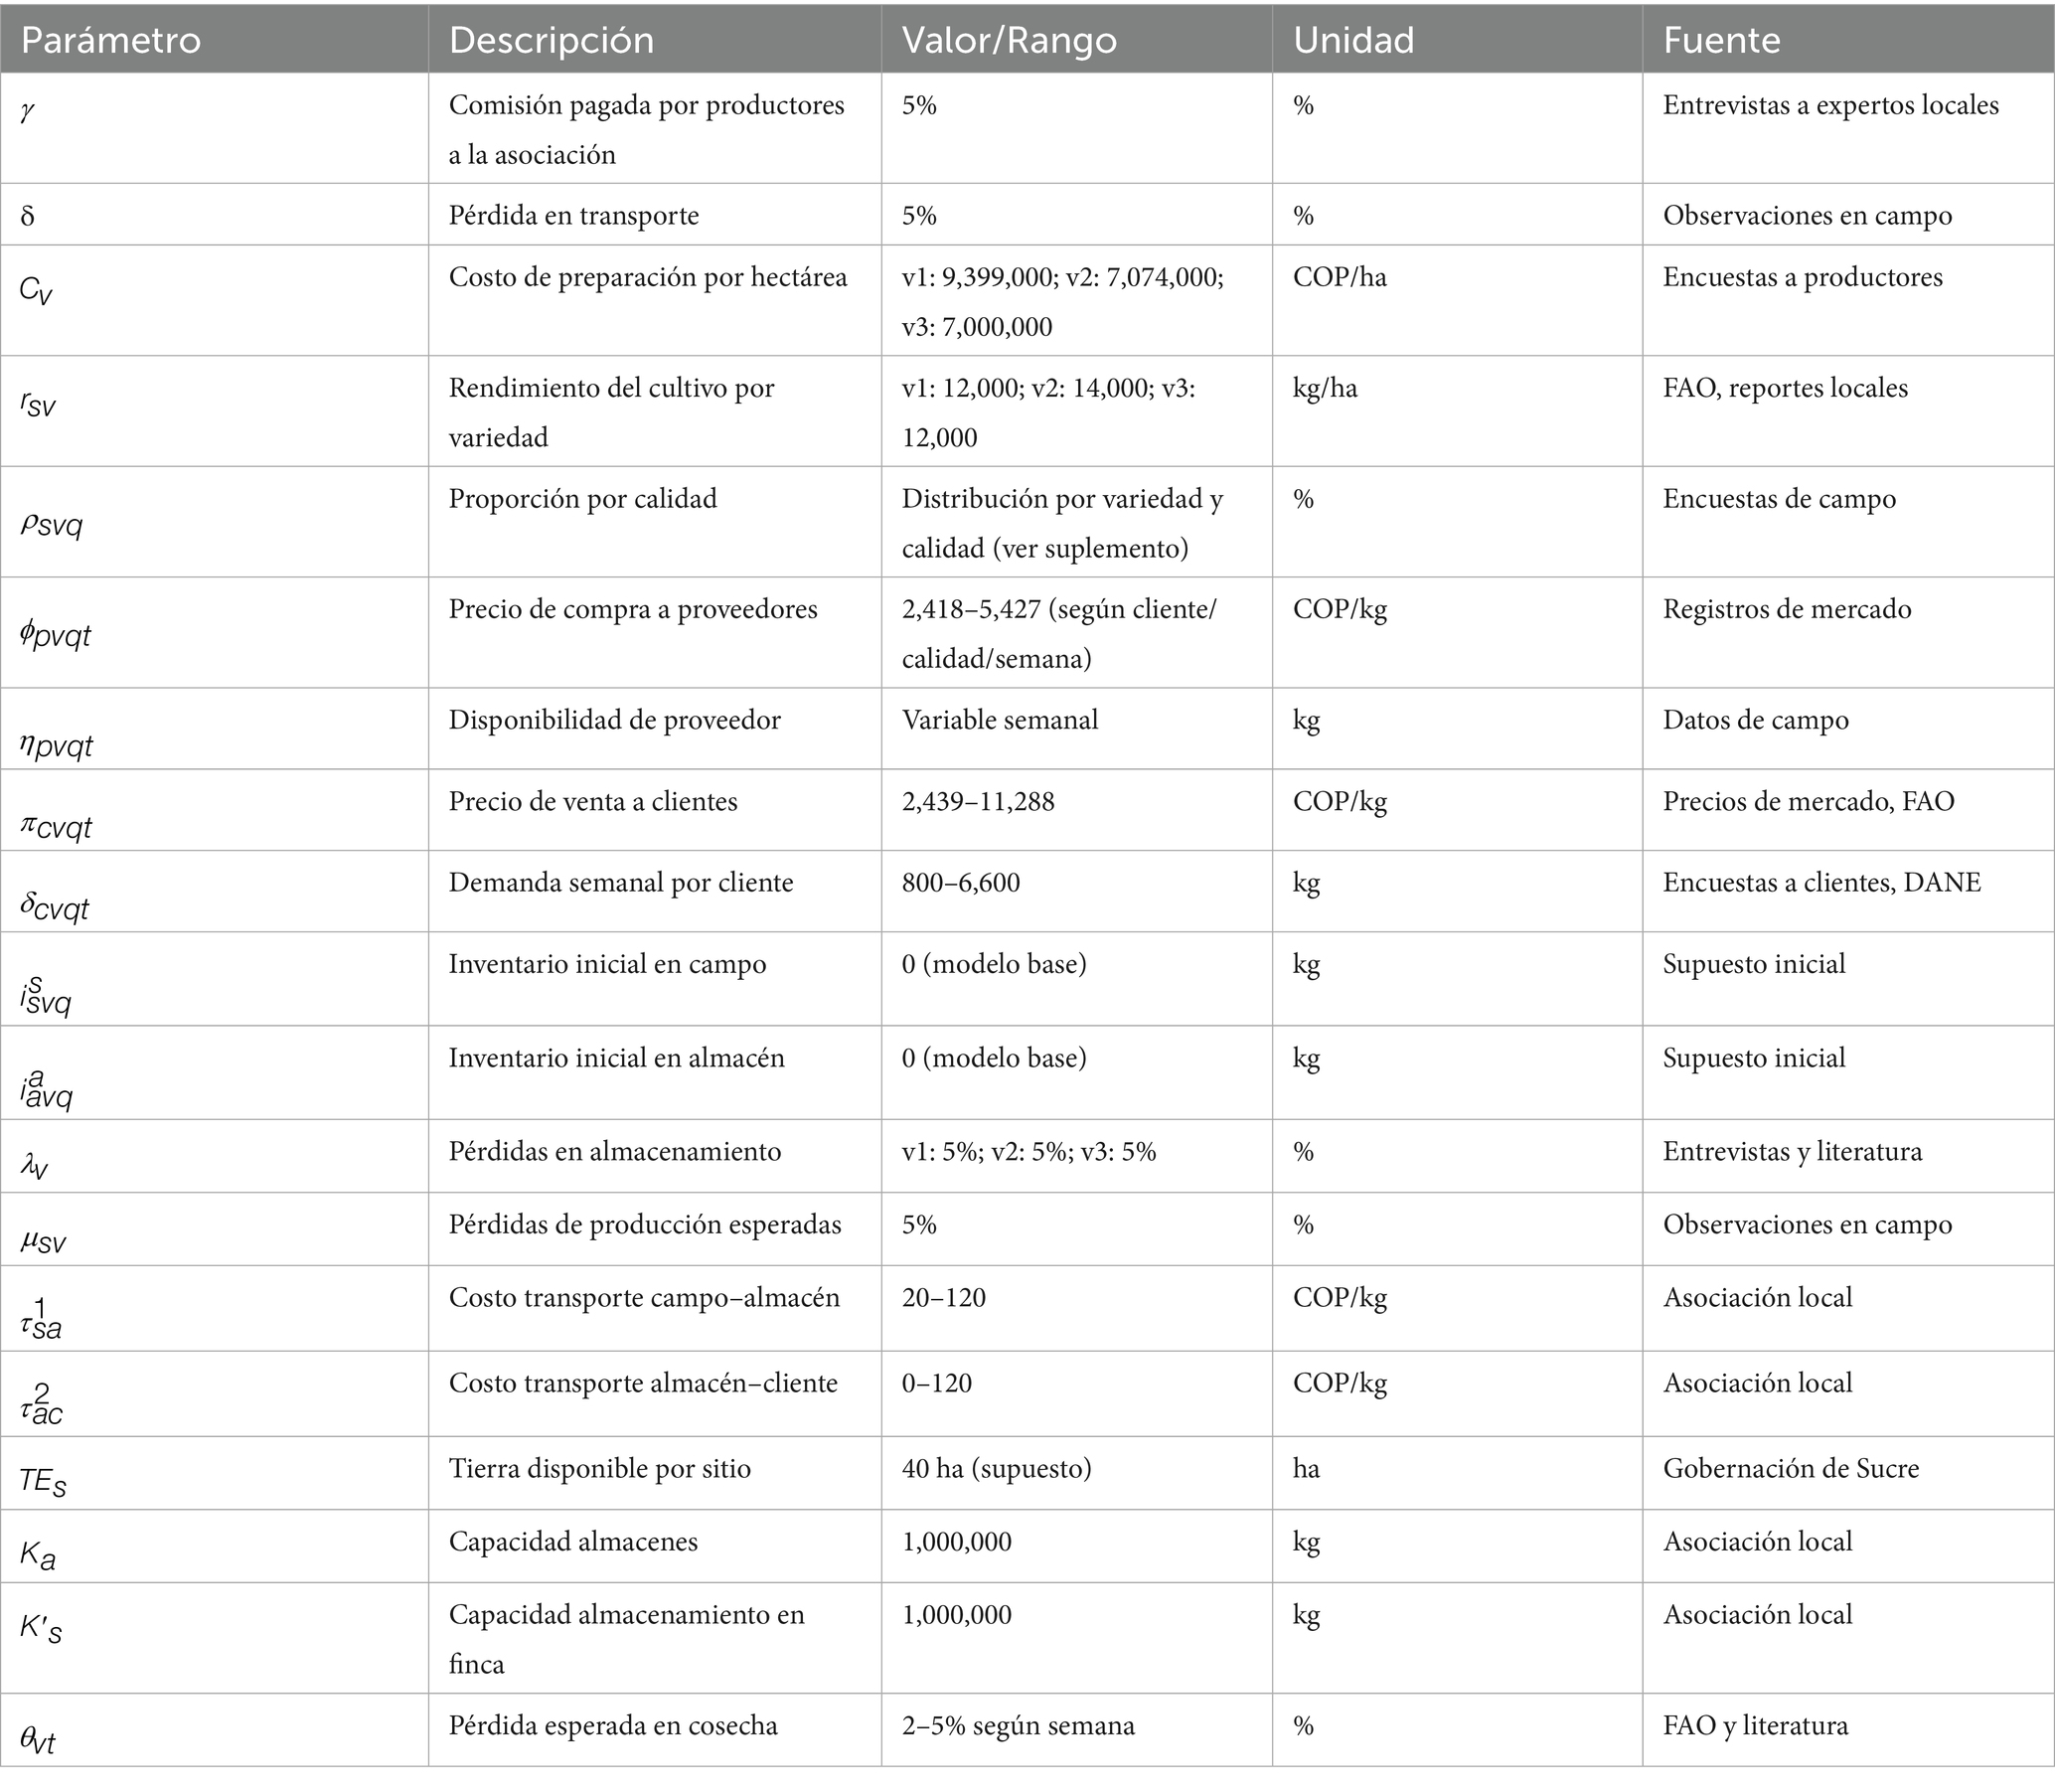
Table 4. Input parameters of the yam supply chain optimization model.
4 Multi-objective model formulation
This section presents the formulation of a linear programming optimization model for production and distribution planning in the yam agri-food supply chain, developed as a case study. The model includes two objective functions designed to promote economic and social sustainability, considering the specific features of the case study such as yam varieties, planting sites, storage locations, and product qualities. A detailed description of the linear programming model is provided below.
4.1 Indexes and sets
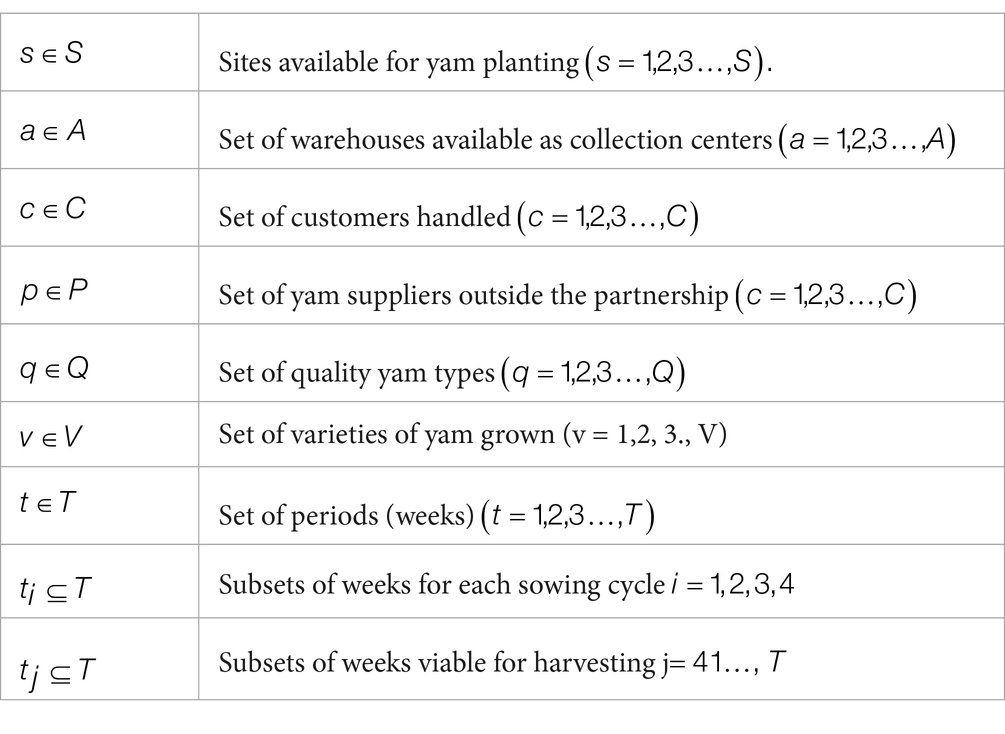
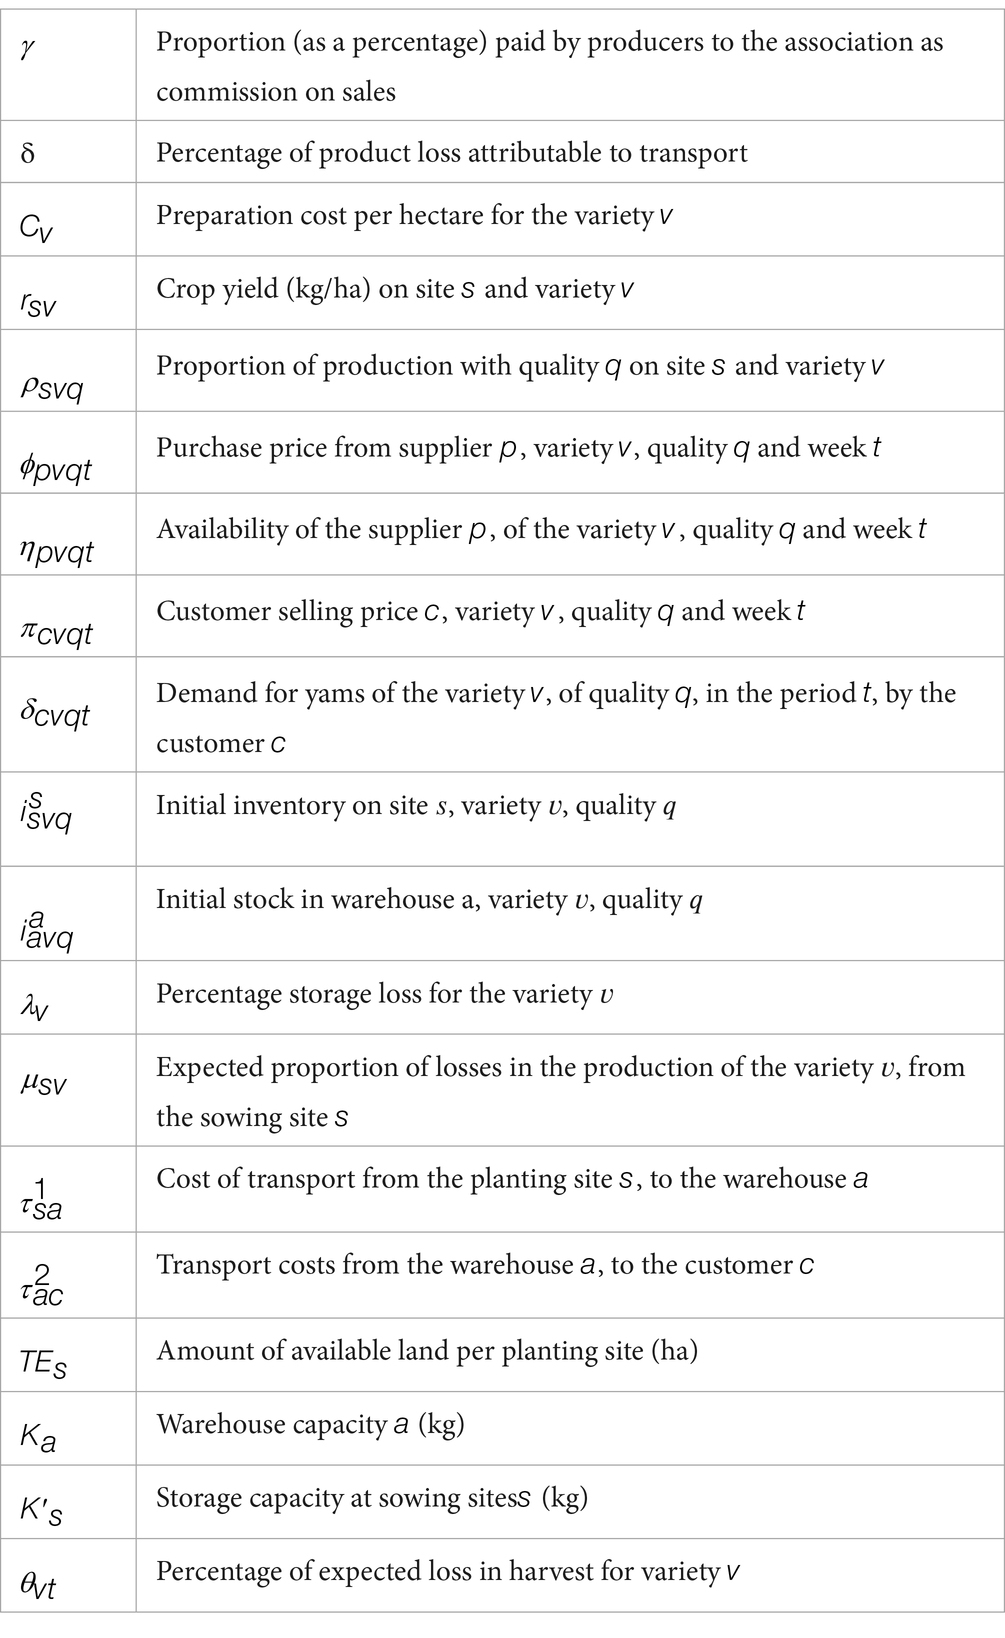
4.2 Parameters
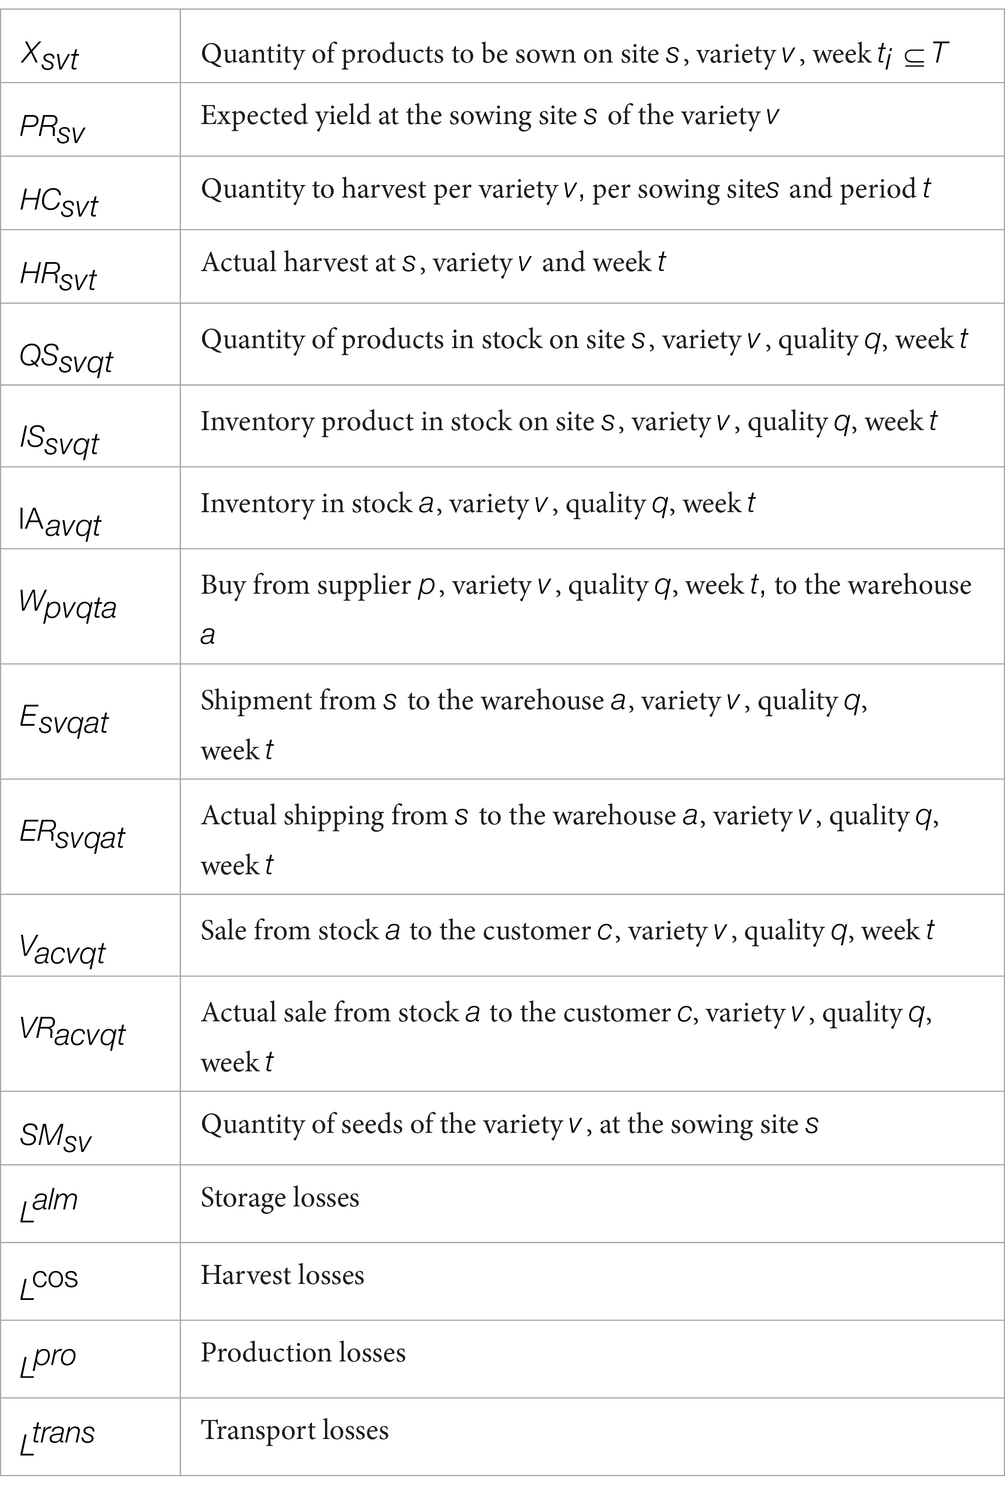
4.3 Variables
4.4 Functions objective
The model considers two sustainability-oriented objectives: (i) maximizing profits to ensure the economic viability of the supply chain, and (ii) minimizing total yam losses to improve efficiency and social impact.
4.4.1 Profit maximization
The economic objective, represented by the objective function described in Equation 4, focuses on maximizing the net profit generated along the yam supply chain. This profit is calculated as the difference between the revenue obtained from sales of the product and the costs associated with its production andmarketing.
Total income comes from the sale of yams to different types of customers, considering the variety, quality and the period in which the transaction takes place Costs, on the other hand, include:
• The cost of land preparation and sowing per hectare according to the variety grown
• Transport logistics costs, both from planting sites to warehouses and from warehouses to customers.
• Cost of purchasing yam from external suppliers, when this option is used to meet demand.
By maximizing this objective, the model identifies the optimal combination of planting, harvesting, transport, storage, and sales decisions that yield the highest returns over the planning horizon
4.4.2 Minimization of losses
The social objective, represented by the variable (Equation 5), seeks to minimize the total losses generated along the agri-food supply chain, which have been identified and quantified in direct collaboration with farmers. These losses are specifically classified into four main categories: losses associated with storage (Equation 27), losses occurring during harvesting (Equation 28), losses recorded at the production stage (Equation 29) and losses related to transport (Equation 30). Reducing these losses not only improves the operational and economic efficiency of the production system but also generates positive impacts on the local community.
4.5 Restrictions
The sales and inventory constraints (Equations 6–11) ensure consistency between planned and actual sales, incorporating transportation losses and warehouse availability. They also limit sales to physically available stock and restrict external purchases to suppliers’ real availability, guaranteeing that demand fulfillment is always supported by effective inventories. The transportation and storage constraints (Equations 12–16) regulate flows from sowing sites to warehouses, preventing them from exceeding available inventory and adjusting them by transportation loss factors. These equations also update inventories at sowing sites, consider maximum storage capacity, and differentiate yam availability by quality levels.
The planting and harvesting constraints (Equations 17–26) link expected production, actual harvest, and cultivated land. They ensure consistency between harvest and expected production, balanced planting across the four cycles, alignment of seed availability with final inventory, and compliance with yam growth cycles. The loss constraints (Equations 27–30) quantify losses in storage, harvesting, production, and transportation, associated with climatic factors, handling practices, and logistical inefficiencies, and are key to capturing the social dimension of the model.
Finally, the quality constraints (Equations 31–32) set classification rules for product allocation, excluding seed (quality 3) from external purchases and warehouse shipments, since it is preserved in the field for future planting cycles.
4.6 Method of solution model for yam Agri-food supply chain management
The proposed model is solved using a hybrid multi-objective optimization approach based on the augmented ε-constraint method. This technique combines the principles of the lexicographic method and the epsilon constraint method, with the purpose of generating a representative set of Pareto-efficient solutions. Unlike other methods, this approach does not require assigning strict priorities among objectives but instead considers their relative importance when constructing compromise solutions.
Compared to traditional techniques such as the weighted sum method, the ε-constraint approach offers clear advantages. Weighted summation tends to concentrate solutions at the extremes of the feasible region, whereas the ε-constraint method explores intermediate areas of the Pareto frontier. This exploration capability contributes to a more complete representation of the efficient solution set. In addition, while weighted summation can produce redundant solutions due to different combinations of weights, the epsilon constraint method generates distinct solutions at each iteration. Another advantage is that this method does not require scaling objective functions, avoiding distortions that may compromise solution quality (Mavrotas, 2009).
Finally, the incorporation of lexicographic optimization allows for hierarchical prioritization of objectives and a better understanding of the behavior of conflicting objectives, facilitating the identification of Pareto-optimal solutions before a final decision is made.
The problem was solved using the General Algebraic Modeling System (GAMS, version 49.6.1) with the CPLEX 12.8 solver, running on a personal computer with an Intel® Core™ i5-10300H 4.2 GHz processor. GAMS has also proven useful for modeling and solving various combinatorial optimization problems (Cardoso et al., 2013).
5 Results and discussions
The augmented ε-constraint method was used to solve the multi-objective optimization model. In the first phase, the lexicographic method was applied to construct the payoff table, ensuring that the solutions obtained from the individual optimization of each objective function were Pareto solutions. Initially, the problem was solved with profit maximization as the objective. Then, loss minimization was addressed by incorporating the previously obtained optimal value as a constraint. This procedure was replicated by inverting the order of the objectives, as shown in Table 5.
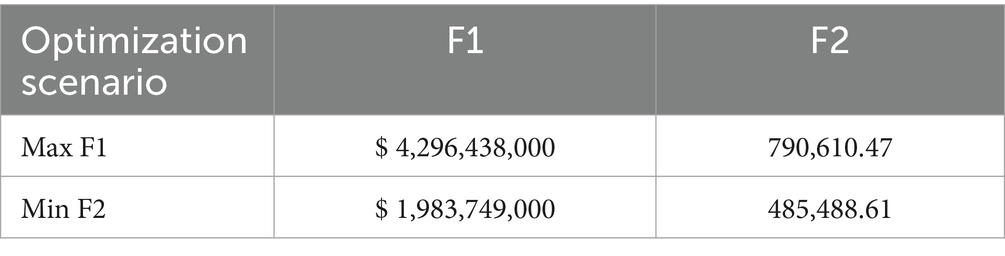
Table 5. Payoff table showing extreme values of profit (F1, COP) and losses (F2, kg) from single-objective optimization.
Based on this methodology, the optimization process was implemented, the results of which are summarized in Table 6. In the first row, the results of the first optimization scenario are presented. The result corresponding to the optimization of the objective (profit maximisation) is highlighted, while the next cell shows the result of (loss minimization), considering the previous optimal value as a constraint.
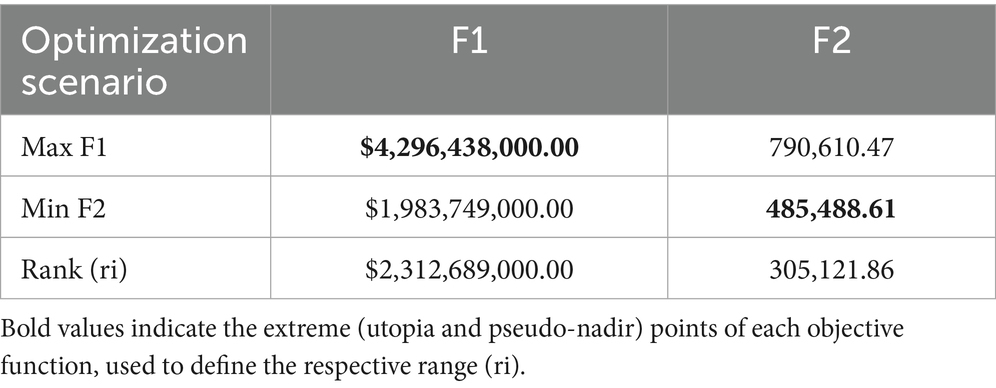
Table 6. Ranges established for both objective functions, including utopia and pseudo-nadir points.
In the second row, the process is repeated with the objectives in reverse order: the second cell reflects the individual optimization of , and the first cell shows the outcome of , conditional on the constraint imposed by the previous optimal value. This structure not only identifies Pareto-efficient solutions but also provides a systematic view of model behavior under different hierarchies of objectives.
The individual optimization of each objective reveals a clear conflict between the economic and social dimensions of the supply chain. As shown in Table 5, maximizing profits ( ) increases logistic losses ( ), while minimising these losses significantly reduces profits. This result is consistent with what has been observed by (Mavrotas, 2009), who points out that in multi-objective problems it is frequent that the improvement of one criterion implies the deterioration of another, particularly when the objectives represent conflicting interests.
Based on these results, it is reaffirmed that the problem presents a conflicting nature typical of sustainability models in agri-food chains, where profitability is not always compatible with social or environmental efficiency. Govindan et al. (2015) highlight a similar pattern when analyzing sustainable chains, indicating that the maximization of economic profit can increase negative impacts on other dimensions, such as waste or emissions, if the objectives are not adequately balanced.
Consistent with Marler and Arora (2004), these results highlight the need for approaches that explicitly represent trade-offs between objectives, such as Pareto frontier methods. These methods offer the decision-maker a more complete and balanced view of the alternatives, allowing trade-offs to be chosen that are more aligned with the overall interests of the system.
Finally, the identified pattern is also in line with Ehrgott and Wiecek (2005), who argue that the identification of extreme points—such as those derived from individual optimization—is only the first step in understanding the space of efficient solutions. From there, it becomes essential to apply methods such as augmented ε-constraints (AUGMECON), capable of generating a diverse and representative set of trade-off solutions, especially useful when is required to make decisions under multiple criteria and in contexts of high social sensitivity, as is the case of agri-food chains in vulnerable regions.
After determining the individual optimization results for each objective function, the ranges of the objective functions to be used as additional constraints for the optimization must be calculated. This is based on the results in Table 6, which presents the maximum and minimum values of each objective function. In this case, the ranges are calculated using the extremes within the Pareto front, i.e., the utopia and pseudo-nadir points, which represent the maximum and minimum value of the range for each function.
For profit maximization ( ), the maximum value obtained is $4,296,438,000 and the minimum value is $1,983,749,000, giving a range of $2,312,689,000. For loss minimisation ( ), the maximum and minimum values are 790,610.47 kg and 485,488.61 kg, respectively, resulting in a range of 305,121.86 kg. In this context, the utopian point is defined as the ideal vector ($4,296,438,000; 485,488.61), while the pseudo-nadir (or anti-ideal) point corresponds to ($1,983,749,000; 790,610.47).
This approach is consistent with that proposed by Chan et al. (2025), who stress the importance of correctly defining the ranges of the objective functions before applying the augmented ε-constraint method. According to these authors, the proper identification of the ranges not only allows a complete exploration of the feasible space, but also improves the accuracy of the solutions obtained, ensuring that the objective functions become constraints that guide the search for efficient Pareto solutions.
The use of ranges and the implementation of constraints is a key aspect in multi-objective optimization. In this sense, Maneengam (2023) also underlines the relevance of using extreme points as a reference for the generation of balanced solutions. In his work, he emphasizes that extreme values, such as those obtained in Table 5, serve as the starting points for calculating the rank of each function and, in turn, help to structure the Pareto frontier more precisely. The use of the ε-constraint method allows not only to obtain efficient solutions, but also to explore different regions of the solution space and to better understand the trade-offs between economic and social objectives.
The choice of gains as the main function and losses as the constraint is justified by the asymmetry of the ranges observed in Table 6. The rank of is considerably larger in monetary terms, reflecting its larger economic impact, while has a tighter rank, indicating that losses are relevant, but with a smaller relative impact compared to gains. This choice is in line with Zhang et al. (2024) who argues that, in problems with unequal ranges of objectives, it is critical to select the main function that guides the optimization process, while the other functions should be incorporated as constraints.
Finally, the range of is divided into intervals, which allows finer control over the density of the generated Pareto frontier. This approach is consistent with the proposal of Maneengam (2023), who explains that a larger number of intervals improves the accuracy in the representation of trade-off solutions. However, it should also be considered that a high value of increases the computational time needed to solve the model, which implies a trade-off between the accuracy of the solutions and the computational efficiency. In this study, was chosen, resulting in the generation of 21 subproblems to solve the Pareto solution set.
To tackle these problems in a single computational run in GAMS, the code used by Mavrotas (2009) in the related study of augmented ε-constraints was employed. From the resolution of each subproblem, the set of Pareto solutions is generated, which is presented in Table 7. These non-dominated points are crucial in the Pareto analysis, as they represent the best possible solutions given the objectives considered, with none being superior in all aspects.
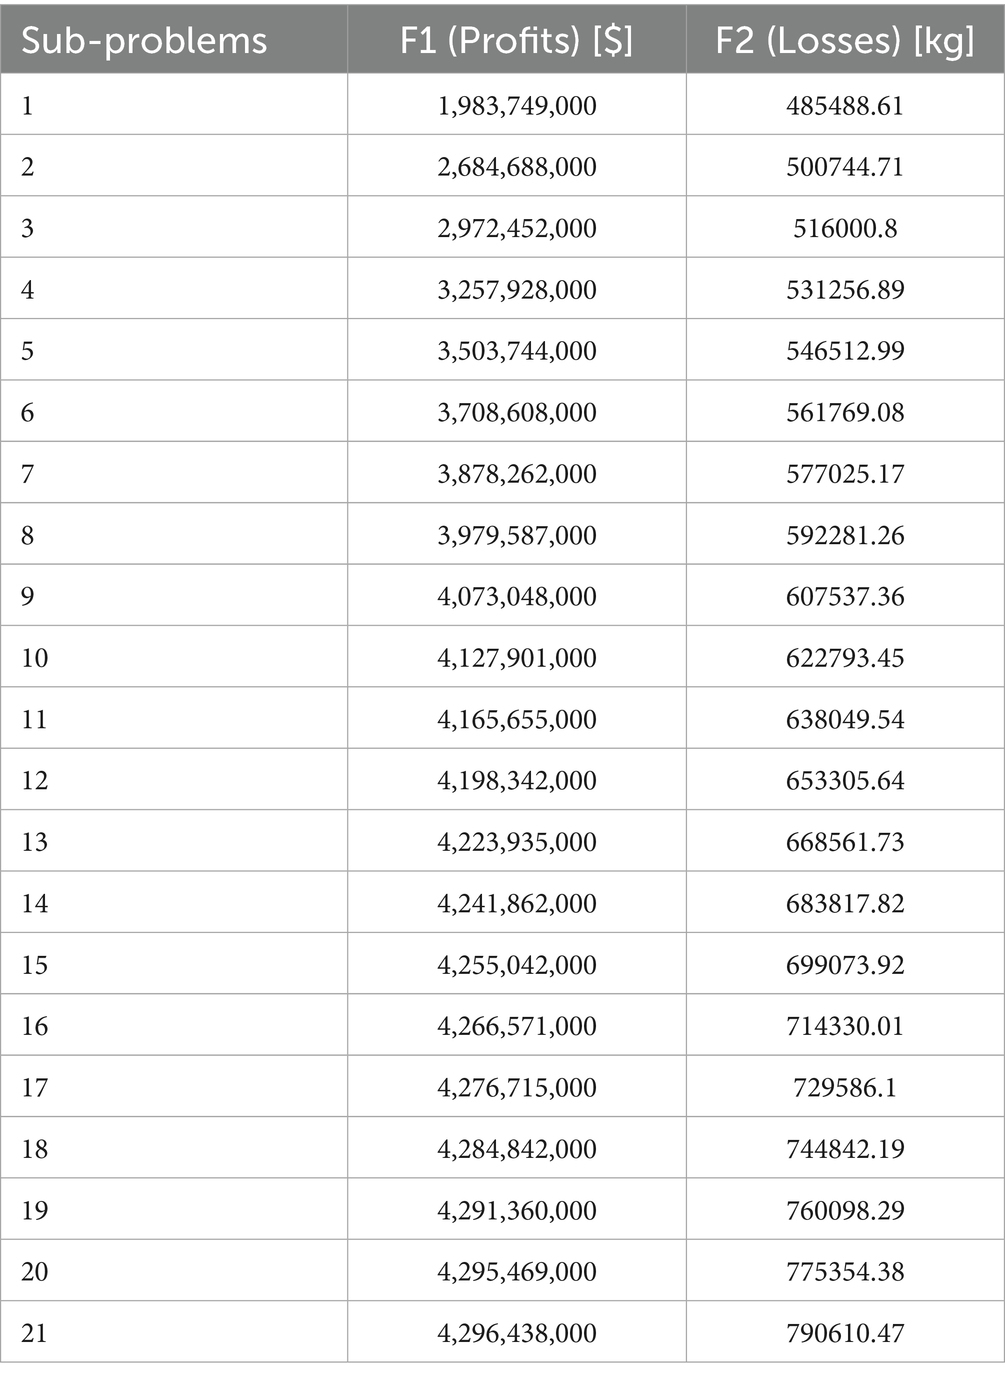
Table 7. Non-dominated points obtained through the AUGMECON method, representing the Pareto frontier.
Each row of the table represents a solved subproblem, with its corresponding combination of values for the objective functions. These points form the Pareto front, which provides valuable information for decision making by identifying the possible optimal choices and the degree of trade-off needed between conflicting objectives. The variation of values in Table 7 shows how the gains and losses are balanced in each subproblem, providing a diverse set of solutions with different trade-offs between the two objectives.
These non-dominated points are key to the interpretation of the model, as they provide a visual and quantitative representation of the trade-offs between economic gains and logistical losses. In a real decision-making context, these points allow exploring possible alternatives that balance the two objectives, giving decision-makers the flexibility to choose the most appropriate solution based on the specific priorities of the situation.
The observed variation in the values of and clearly reflects the trade-offs between objectives: as gains increase, losses also increase, which underlines the conflicting nature of the objectives in the model. This dynamic is typically observed in multi-objective optimization problems, as documented by Mavrotas (2009) who points out that the Pareto representation of solutions not only helps to understand the behavior of the objectives, but also to identify the range of possible solutions based on the decision-makers’ preferences.
Figure 2 shows a clear conflict between the objectives: as gains increase, losses also rise, and vice versa. This pattern reflects the conflicting nature of the problem, where improvements in one dimension necessarily imply detriment in the other.
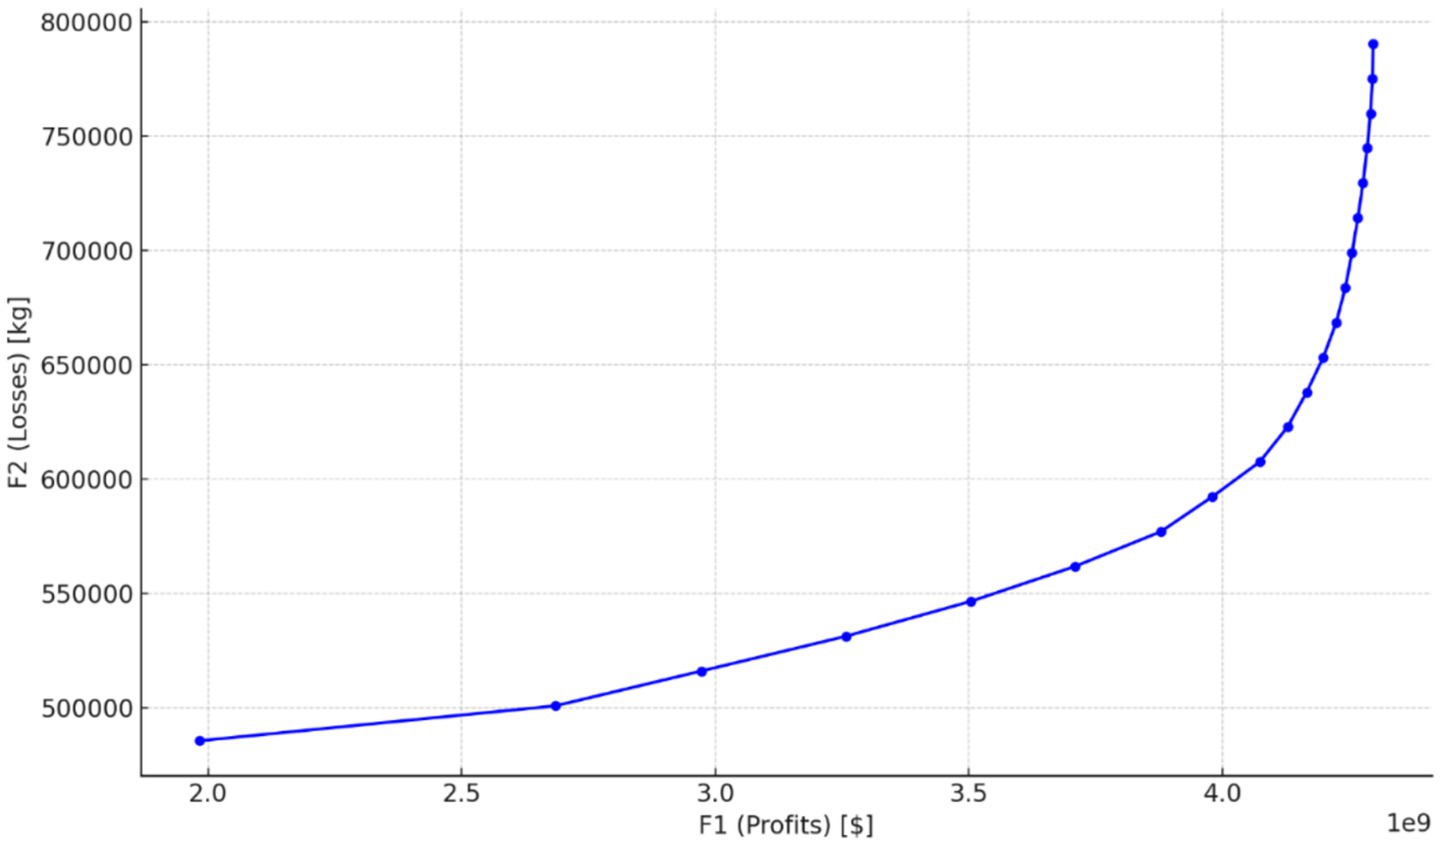
Figure 2. Pareto frontier showing the trade-off between net profit (F1, COP millions) and losses (F2, kg) obtained with the AUGMECON method.
With the Pareto curve defined, which represents the non-dominated solutions to the problem, the next step is to select the most appropriate solution for the chain, based on two key criteria: one economic (profits) and the other social (losses). The graph shows that when acts as the independent variable and as the dependent variable, changes are observed in the slope of each segment that makes up the curve. At the beginning of the curve, the slope is relatively gentle, but there comes a point where the slope becomes steeper, implying that, from that point onwards, losses will increase much faster than gains. This abrupt change in the slope signals a major social impact, as losses skyrocket compared to gains, reflecting a progressive deterioration in the social efficiency of the system.
To identify the optimal solution, an analysis of three possible scenarios is carried out to assess the impact of the trade-offs between the two objectives:
1. Scenario 1: Lower losses with reduced profits, representing a conservative solution with limited economic benefits but lower social impact.
2. Scenario 2: Higher profits, but also a proportional increase in losses, reflecting a solution aimed at maximizing economic benefits at the expense of higher social costs.
3. Scenario 3: Intermediate scenario, where the slope of the curve starts to change abruptly, indicating the inflection point where losses start to increase faster than gains.
This intermediate scenario is determined by analyzing the slope of the line segments joining each point on the Pareto curve. The slope of each segment is calculated using the Equation 33.
Where is the slope between the points ( ) and corresponding to the values of and of the consecutive subproblems. The calculated slopes are presented in Table 8.
Table 8 shows that from subproblem 9 onward, the slope is 0.000163235, indicating that gains increase at a moderate rate relative to losses. However, as we move to subproblem 10, the slope shows a significant increase, reaching 0.000278127, implying that, from that point onwards, an increase in gains leads to a much faster increase in losses. This abrupt change highlights the need to carefully weigh social impacts (losses) against economic gains. In Figure 3, the difference in the change from the three scenarios can be seen.
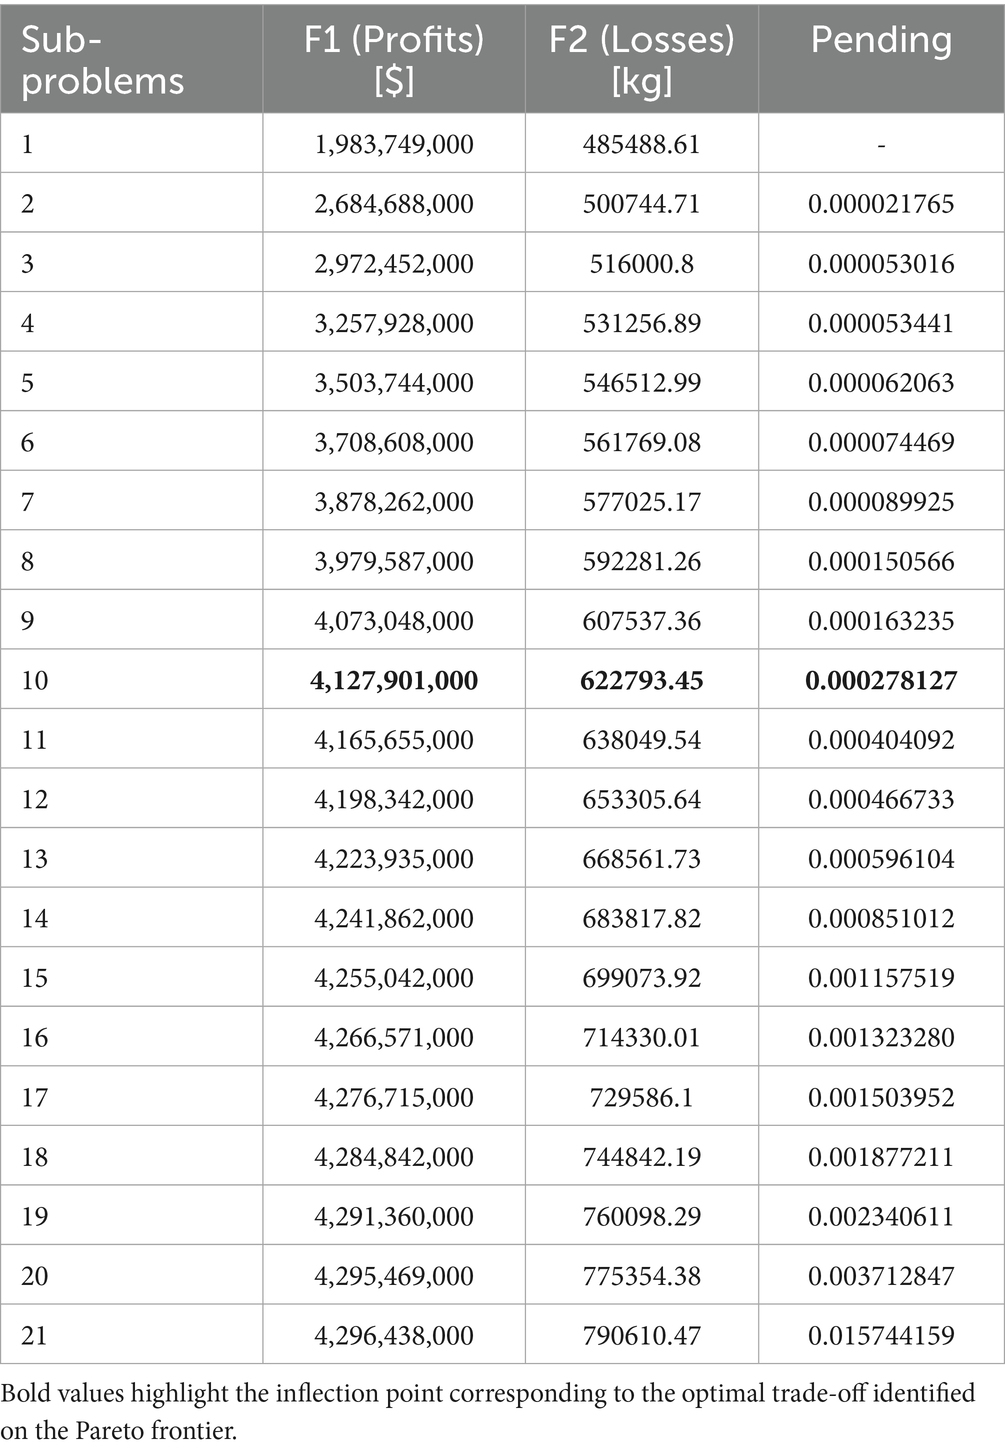
Table 8. Values of the slopes of the segments joining the non-dominated points of the problem.
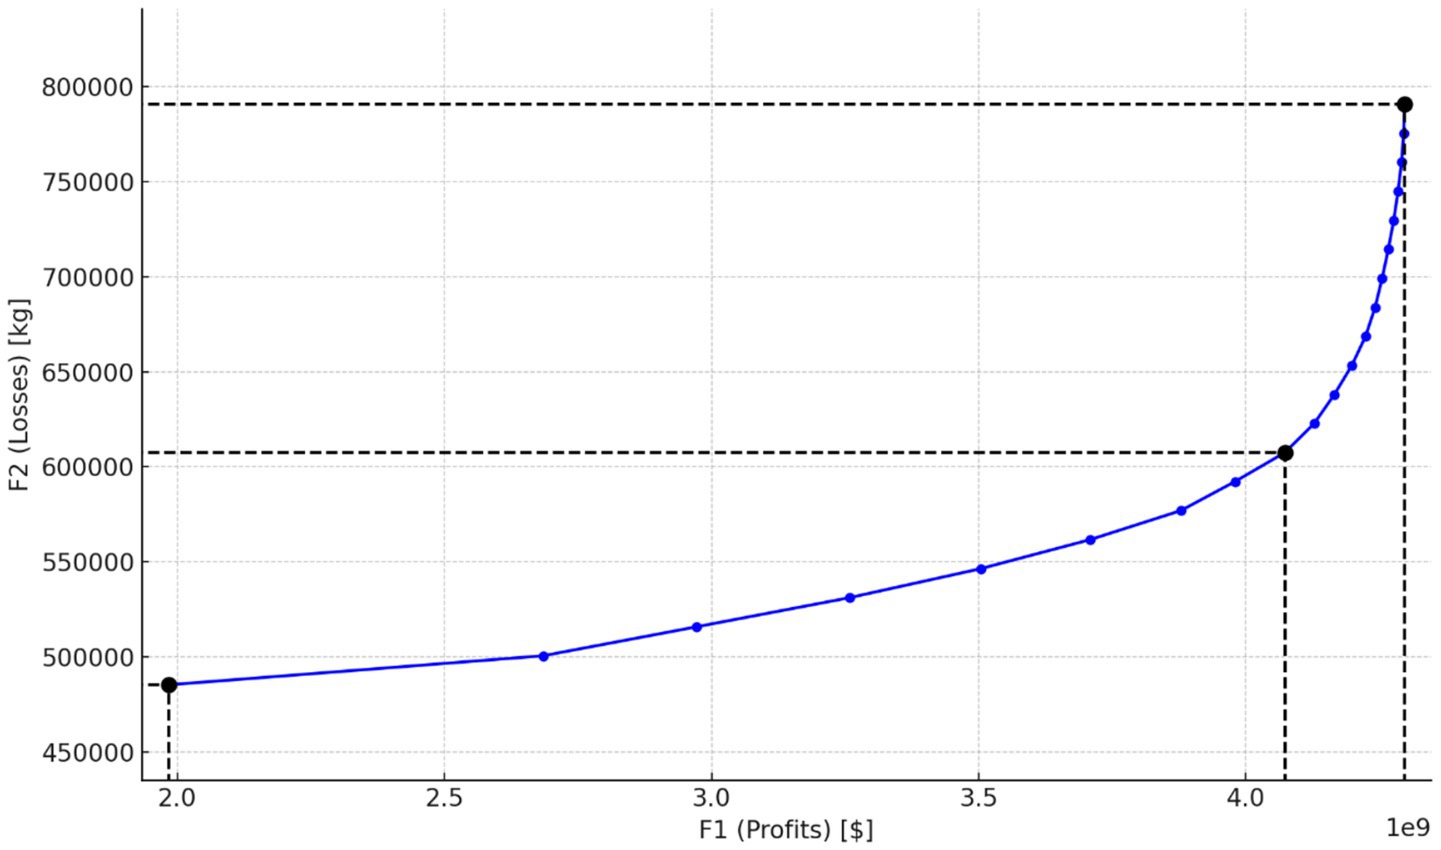
Figure 3. Slopes of the segments between consecutive Pareto solutions, used to identify critical inflection points.
Calculating the slopes between consecutive points on the Pareto curve allows us to identify subproblem 10 as a critical point on the curve. This point suggests a balance between profit maximization and loss minimization. By looking at the graph, the three scenarios analyzed can be located, which are fundamental for making informed decisions.
The intermediate point on the curve, corresponding to the coordinates ($4,127,901,000; 622,793.45), serves as a reference to compare the extremes of the curve. In the first scenario, which corresponds to subproblem 1 ($1,983,749,000; 485,488.61), the range of gains is considerably more significant than at the end point of the curve ($4,296,438,000; 790,610.47). Although an increase in profits is observed at the last point, this increase is not significant relative to the losses, which have increased much more rapidly.
Based on these results, the best option would be for the association to set a profit limit of $4,127,901,000 and losses of 622,793.45 kg. This is because, by setting this limit, the loss range would remain at 137.30 tons, a considerably lower value compared to the loss range of 305.12 tons associated with higher profits. In this way, the social impacts of increased losses are minimized.
It is crucial to understand the social implications of opting for higher profits. While the economic gains may increase by opting for the extreme end of the curve, the social impact would be amplified, especially in terms of food security and sustainable development. Losses in the yam supply chain directly reduce food availability, wasting resources that could help mitigate malnutrition in vulnerable communities. In addition, increased losses directly affect farmers’ incomes and the local economy, which in turn can increase poverty in rural communities, especially those dependent on yam production for their livelihoods.
The negative impact of losses extends beyond the economic, directly affecting the most vulnerable sectors of society. While increased profits may be an attractive option in the short term, the long-term social repercussions should not be underestimated.
Choosing among points on the Pareto curve requires balancing economic and social impacts. The intermediate scenario, with profits of $4,127,901,000 and losses of 622,793.45 kg, offers the most balanced option. This solution not only maximizes profits in a controlled manner, but also limits social impacts, which can benefit both farmers and the wider community.
On the other hand, opting for higher profits may be tempting in terms of immediate economic results, but the social impacts could be detrimental in the long term, particularly in relation to food security and sustainable development. Additional losses in the supply chain would aggravate existing social and economic problems, which could compromise the sustainable benefits of the yam supply chain.
Against this background, the best solution would be to select a compromise point, as in the intermediate scenario, that allows a balance to be struck between economic performance and social.
5.1 Multi-criteria evaluation using TOPSIS
As a complement to the slope analysis, the TOPSIS (Technique for Order of Preference by Similarity to Ideal Solution) multi-criteria method was applied to rank the efficient solutions of the Pareto front from a global perspective, simultaneously considering the economic and social objectives of the model. This technique, introduced by (Hwang and Yoon, 1981), has been widely used in the field of supply chain optimization, given its ability to select solutions close to a theoretical ideal of maximum benefits and minimum costs.
The TOPSIS approach evaluates each alternative by its individual criterion values and its relative position to an ideal point (maximum gain, minimum loss) and an anti-ideal point (minimum gain, maximum loss), weighted by the criteria’s relative importance. In this study, a weight of 0.6 was assigned to the economic objective (net gain) and 0.4 to the social objective (minimization of losses), reflecting a balanced priority with emphasis on the financial sustainability of the system.
This method has been validated in recent research. For their part, Lu et al. (2022) used it to select agricultural mechanization strategies under multiple criteria, while Abdel-Basset and Mohamed (2020) applied it to risk analysis in sustainable supply chains. Both papers highlight the versatility of TOPSIS to integrate quantitative variables and decision-maker preferences in complex logistics contexts.
In this study, the alternatives corresponded to the 21 non-dominated solutions obtained through the AUGMECON method. Each alternative was evaluated under two criteria: net profit ( ) and logistical losses ( ). To ensure comparability between both metrics, vector normalization was applied, transforming values into a dimensionless scale between 0 and 1. Subsequently, relative weights of 0.6 for profits and 0.4 for losses were assigned, according to the priority defined for the analysis. Based on these values, the weighted decision matrix was built, from which the distances of each alternative to the positive ideal point (maximum profit and minimum loss) and the negative ideal point (minimum profit and maximum loss) were calculated. Finally, the relative closeness index was determined, defined as the ratio between the distance to the anti-ideal and the sum of distances to the ideal and anti-ideal. The final ranking was obtained by ordering from highest to lowest, where values closer to 1 represent alternatives closest to the ideal solution. Solution 14 emerged as the most balanced option. Although it does not maximize profits nor minimize losses individually, it achieves the best overall performance by significantly reducing losses while maintaining competitive profit levels, thus representing the most desirable compromise solution.
From a policy perspective, this finding suggests that intermediate solutions such as Solution 14 can be particularly useful for local governments and cooperatives. By prioritizing both profitability and loss reduction, the model can guide agricultural planning programs, support investment decisions in storage and transport infrastructure, and design cooperative strategies that enhance the role of smallholder farmers in regional and export markets.
Figure 4 shows the evolution of the TOPSIS index for the different solutions evaluated. As can be seen, the intermediate solutions at the front tend to concentrate on the highest values, while the solutions located at the extremes (oriented exclusively to the maximization of one of the objectives) present lower levels of overall performance.
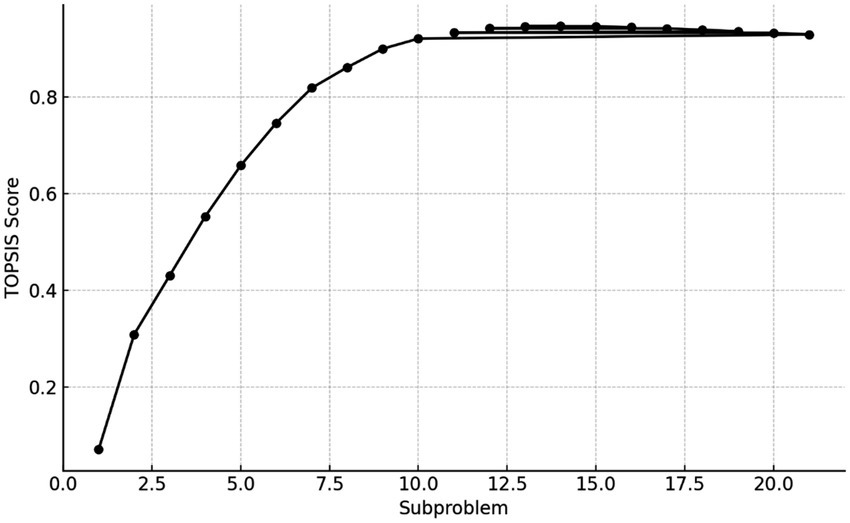
Figure 4. TOPSIS performance index (Ci) for the efficient solutions, ranking alternatives by closeness to the ideal solution.
It is relevant to note that the solution prioritized by TOPSIS does not coincide with the one suggested by slope analysis. This difference is due to the nature of each approach: while slope analysis examines the marginal efficiency between adjacent solutions on the front end, TOPSIS evaluates each alternative with respect to a global ideal, explicitly integrating the decision-maker’s preferences. The complementarity of the two methods enriches decision-making by enabling comparison between marginal performance and overall performance across alternatives.
5.2 Spatial distribution and stability of harvest along the Pareto frontier
Figure 5 presents the spatial distribution of the variable by planting site, considering all iterations generated using the epsilon constraint method (Pareto frontier). Each bar represents the total harvested at a specific site for a given iteration.
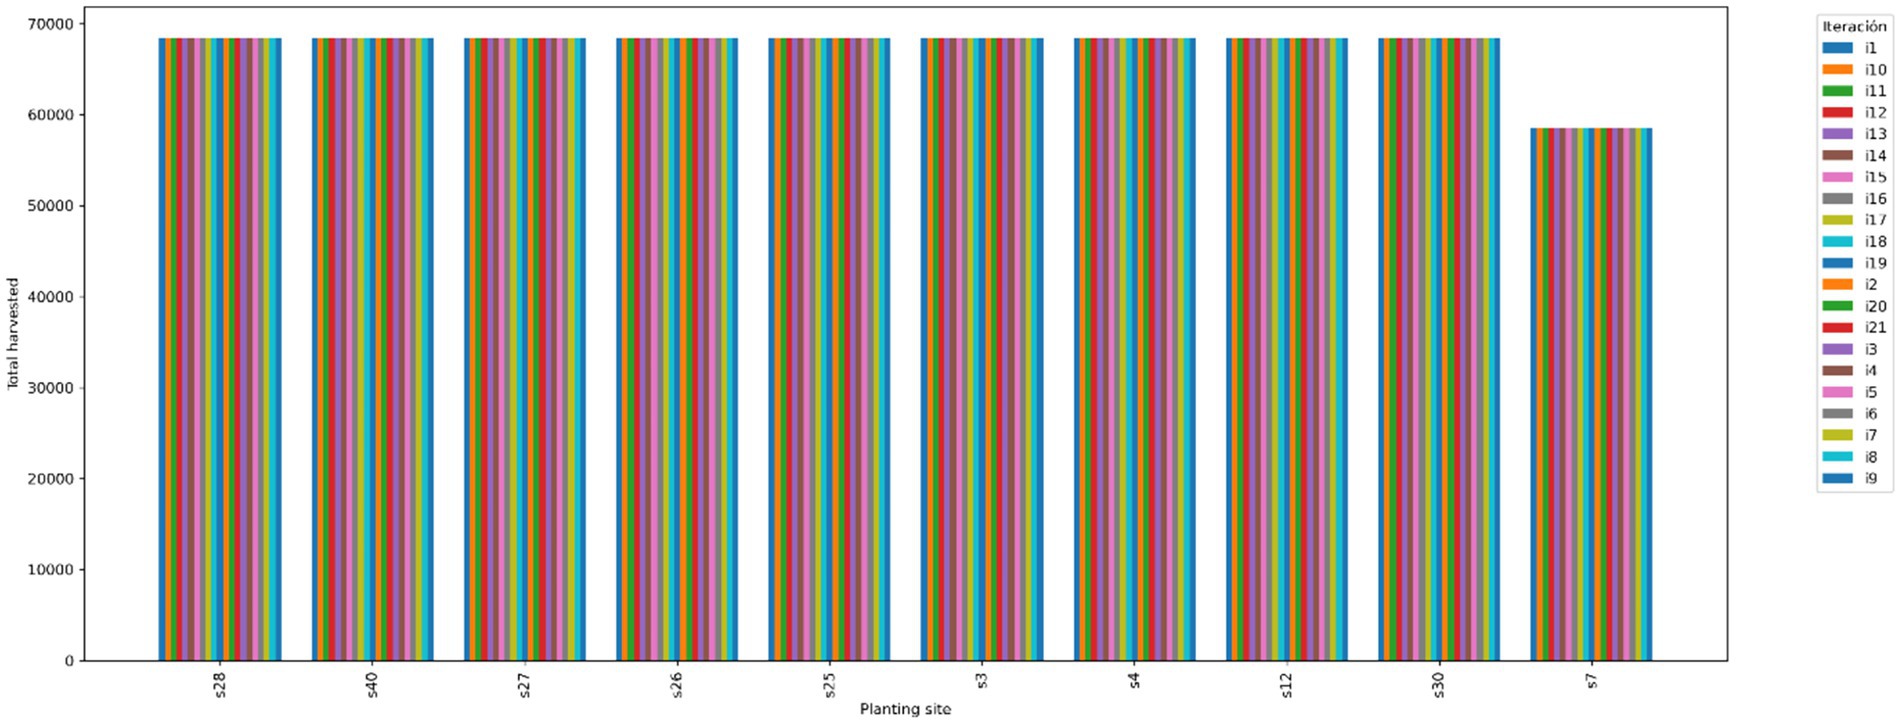
Figure 5. Spatial distribution of harvested yam by sowing site across Pareto iterations, showing stable patterns among key locations.
The analysis shows that total harvest at each site remains nearly constant across all iterations, indicating that site selection is highly robust to different optimization scenarios. Sites 3, 4, 7, 12, 25, 26, 27, 28, 30 and 40 stand out for their importance, because significantly higher amounts are harvested than the average of the rest of the sites. They remain active in all iterations, regardless of the trade-off between economic and social objectives. They also concentrate most of the total production, making them strategic for the sustainability and efficiency of the chain.
These findings allow us to recommend prioritization of investments and logistical resources in these key sites, thereby maximizing the resilience and efficiency of the modelled agri-food system. The low spatial variability also indicates that the system is stable and predictable, facilitating informed long-term decision-making.
6 Conclusion
Farmers involved in the cultivation of agri-food crops, such as yams, face multiple challenges in planning and managing their production processes. These include deciding on the amount of land to plant, choosing the right time for farming, as well as defining storage and marketing strategies that maximize income and minimize losses. These decisions are even more complex in agri-food supply chains (ASCs), which require a holistic strategic approach to ensure sustainability and efficiency.
This study presented a multi-objective mathematical model aimed at the sustainable management of the yam supply chain in the department of Sucre. The formulation addressed critical aspects such as planting and harvesting seasons, optimal planting location, distribution systems, demand estimation, production and transport costs, as well as losses during the production process. The model adequately represented the complexity of the agri-food logistics problem by integrating economic and social objectives in a structured way.
The application of the augmented ε-constraint method allowed multiple scenarios to be explored under a multi-objective approach, facilitating the comparison of solutions that maximize gains while minimizing losses. One advantage of this approach is its ability to handle objectives expressed in different units without requiring prior normalization. This simplified the analysis process and provided a flexible tool to address sustainability from a quantitative perspective.
In this context, two complementary methods were applied to analyze the efficient front of solutions: slope analysis and the TOPSIS method. The former allowed identifying inflection points on the Pareto front and assessing the marginal trade-offs between objectives, suggesting that an intermediate solution—with profits of $4,127 million and losses of 622,793 kg—offered a reasonable balance between profitability and operational efficiency.
The TOPSIS method provided a comprehensive assessment of the solutions, ranking them according to their closeness to a theoretical ideal solution. This technique simultaneously weighed economic and social criteria and determined that subproblem 14 had the highest overall performance, with a preference index of 0.947. This result reaffirms the relevance of considering weighted multi-criteria methods for final decision making in complex logistics contexts.
From the analysis of the solutions generated, critical variables were identified that guided the formulation of sustainable strategies in three key areas: loss reduction, demand satisfaction and planting management. Losses in storage, production and transport were consolidated as determining factors, suggesting the need for technological, operational and organizational interventions. The importance of diversifying external suppliers, particularly in terms of the observed preference for supplier P1, and of adjusting the varietal distribution of yam crops to optimize the overall performance of the system was also evident.
Implementing these strategies requires coordinated commitment from chain actors, stronger technical capacities in the region, and continuous monitoring systems to support decision-making. Beyond the economic impact, these actions have the potential to contribute to social welfare by improving farmers’ working conditions and promoting sustainable practices that benefit local communities and the environment.
In sum, the results of this study provide concrete evidence on the value of integrating optimization models, multi-criteria analysis and scenario evaluation in strategic decision-making in SWC. Their application in the case of yams in Sucre demonstrates the feasibility of designing sustainable, efficient and socially responsible supply chains.
The proposed model represents a solid tool for sustainable yam supply chain planning by integrating economic and social criteria under a multi-objective approach. However, like any mathematical formulation, it relies on certain assumptions that limit its scope. Among them is the deterministic consideration of variables such as demand, prices and losses, which offers clarity in decision-making, but limits the analysis in contexts of high uncertainty. Future work should incorporate environmental metrics—such as carbon footprint or water efficiency—to complement the economic and social analysis and provide a more comprehensive sustainability assessment.” It is also suggested to advance in (i) the development of models under robust or stochastic optimization approaches, (ii) the extension of the model to larger territorial scales or complementary crops, and (iii) the linkage with participatory simulation platforms or decision support tools to incorporate the knowledge of local actors and improve the practical applicability of the model.
Data availability statement
The original contributions presented in the study are included in the article/supplementary material, further inquiries can be directed to the corresponding author.
Author contributions
CV: Project administration, Writing – original draft, Writing – review & editing. GM-O: Writing – original draft, Writing – review & editing, Formal analysis. MM: Writing – review & editing, Writing – original draft, Conceptualization, Investigation. MD: Investigation, Writing – review & editing, Methodology, Writing – original draft.
Funding
The author(s) declare that financial support was received for the research and/or publication of this article. The study was supported by Corporación Universitaria del Caribe – CECAR.
Conflict of interest
The authors declare that the research was conducted in the absence of any commercial or financial relationships that could be construed as a potential conflict of interest.
Generative AI statement
The author(s) declare that no Gen AI was used in the creation of this manuscript.
Any alternative text (alt text) provided alongside figures in this article has been generated by Frontiers with the support of artificial intelligence and reasonable efforts have been made to ensure accuracy, including review by the authors wherever possible. If you identify any issues, please contact us.
Publisher’s note
All claims expressed in this article are solely those of the authors and do not necessarily represent those of their affiliated organizations, or those of the publisher, the editors and the reviewers. Any product that may be evaluated in this article, or claim that may be made by its manufacturer, is not guaranteed or endorsed by the publisher.
References
Abdel-Basset, M., and Mohamed, R. (2020). A novel plithogenic TOPSIS- CRITIC model for sustainable supply chain risk management. J. Clean. Prod. 247:119586. doi: 10.1016/j.jclepro.2019.119586
Ammirato, S., Felicetti, A. M., Ferrara, M., Raso, C., and Violi, A. (2021). Collaborative organization models for sustainable development in the Agri-food sector. Sustainability 13:2301. doi: 10.3390/su13042301
Aranda, J., and Orjuela, J. (2015). Optimización multiobjetivo en la gestión de cadenas de suministro de biocombustibles. Una revisión de la literatura. Ingeniería 20:9–20. doi: 10.14483/udistrital.jour.reving.2015.1.a03
Arroyo, E. (2017). Propuesta de una estrategia de negocios inclusivos para la exportación de ñame de la Subregión Montes de María. Universidad Tecnológica de Bolíivar. Available online at: http://repositorio.utb.edu.co/bitstream/handle/20.500.12585/273/0070430.pdf?sequence=1&isAllowed=y (Accessed January 7, 2025).
Cardoso, S. R., Barbosa-Póvoa, A. P. F. D., and Relvas, S. (2013). Design and planning of supply chains with integration of reverse logistics activities under demand uncertainty. Eur. J. Oper. Res. 226, 436–451. doi: 10.1016/j.ejor.2012.11.035
Chan, K. Y., Yiu, K. F. C., and Kim, D. (2025). An epsilon constraint-based evolutionary algorithm and multi-objective quality metrics for combined economic emission dispatch problem. Neural Comput. & Applic. 37, 17963–17992. doi: 10.1007/s00521-025-11330-2
Chandrasiri, C., Dharmapriya, S., Jayawardana, J., Kulatunga, A. K., Weerasinghe, A. N., Aluwihare, C. P., et al. (2022). Mitigating environmental impact of perishable food supply chain by a novel configuration: simulating banana supply chain in Sri Lanka. Sustainability 14:2060. doi: 10.3390/su141912060
Cruz, M., Díaz, O., Zavala, C., Barreto, E., Martínez, M. G., and Quevedo, M. G. (2009). Un Mecanismo de Vecindad con Búsqueda Local y Algoritmo Genético para el Problema de Transporte con Ventanas de Tiempo. Programación Matemática y Software. Available online at: https://riaa.uaem.mx/xmlui/bitstream/handle/20.500.12055/63/progmat112009UnMecanismo.pdf?sequence=1&isAllowed=y (Accessed June 18, 2025).
Detlefsen, N. K., and Jensen, A. L. (2004). A stochastic model for crop variety selection. Agric. Syst. 81, 55–72. doi: 10.1016/j.agsy.2003.08.004
Ehrgott, M., and Ruzika, S. (2008). Improved ε-constraint method for multiobjective programming. J. Optim. Theory Appl. 138, 375–396. doi: 10.1007/s10957-008-9394-2
Ehrgott, M., and Wiecek, M. M. (2005). “Mutiobjective programming” in Multiple criteria decision analysis: State of the art surveys. eds. J. Figueira, S. Greco, and M. Ehrogott (New York, NY: Springer New York), 667–708.
FAO, FIDA, OMS, PMA, and UNICEF (2022). Versión resumida de El estado de la seguridad alimentaria y la nutrición en el mundo 2022. FAO: IFAD; WHO; WFP; UNICEF.
FAO, FIDA, OMS, PMA, and UNICEF (2024). El estado de la seguridad alimentaria y la nutrición en el mundo 2024. Roma, Italia: FAO; IFAD; WHO; WFP; UNICEF.
Francisco, S. R., and Ali, M. (2006). Resource allocation tradeoffs in Manila’s peri-urban vegetable production systems: an application of multiple objective programming. Agric. Syst. 87, 147–168. doi: 10.1016/j.agsy.2005.01.002
Gholian-Jouybari, F., Hashemi-Amiri, O., Mosallanezhad, B., and Hajiaghaei-Keshteli, M. (2023). Metaheuristic algorithms for a sustainable Agri-food supply chain considering marketing practices under uncertainty. Expert Syst. Appl. 213:118880. doi: 10.1016/j.eswa.2022.118880
Global Panel (2020). Future food systems: for people, our planet, and prosperity. Available online at: https://www.glopan.org/wp-content/uploads/2020/09/Foresight-2.0_Future-Food-Systems_For-people-our-planet-and-prosperity.pdf (Accessed June 18, 2025).
Gobernación de Sucre (2013). PLAN ESTRATÉGICO DEPARTAMENTAL De CIENCIA, TECNOLOGÍA E INNOVACIÓN DE SUCRE - PEDCTI. 431.
Govindan, K., Rajendran, S., Sarkis, J., and Murugesan, P. (2015). Multi criteria decision making approaches for green supplier evaluation and selection: a literature review. J. Clean. Prod. 98, 66–83. doi: 10.1016/j.jclepro.2013.06.046
Hwang, C.-L., and Yoon, K. (1981). “Methods for multiple attribute decision making” in Multiple attribute decision making: Methods and applications a state-of-the-art survey. eds. C.-L. Hwang and K. Yoon (Berlin, Heidelberg: Springer Berlin Heidelberg), 58–191.
Jabarzadeh, Y., Reyhani Yamchi, H., Kumar, V., and Ghaffarinasab, N. (2020). A multi-objective mixed-integer linear model for sustainable fruit closed-loop supply chain network. Manag. Environ. Qual. 31, 1351–1373. doi: 10.1108/MEQ-12-2019-0276
Joubert, J. W., Luhandjula, M. K., Ncube, O., le Roux, G., and de Wet, F. (2007). An optimization model for the management of a south African game ranch. Agric. Syst. 92, 223–239. doi: 10.1016/j.agsy.2006.03.006
Krishnan, R., Arshinder, K., and Agarwal, R. (2022). Robust optimization of sustainable food supply chain network considering food waste valorization and supply uncertainty. Comput. Ind. Eng. 171:108499. doi: 10.1016/j.cie.2022.108499
Lu, H., Zhao, Y., Zhou, X., and Wei, Z. (2022). Selection of agricultural machinery based on improved CRITIC-entropy weight and GRA-TOPSIS method. PRO 10:266. doi: 10.3390/pr10020266
Maneengam, A. (2023). Multi-objective optimization of the multimodal routing problem using the adaptive ε-constraint method and modified TOPSIS with the D-CRITIC method. Sustainability 15:2066. doi: 10.3390/su151512066
Marler, R. T., and Arora, J. S. (2004). Survey of multi-objective optimization methods for engineering. Struct. Multidiscip. Optim. 26, 369–395. doi: 10.1007/s00158-003-0368-6
Marler, R. T., and Arora, J. S. (2010). The weighted sum method for multi-objective optimization: new insights. Struct. Multidiscip. Optim. 41, 853–862. doi: 10.1007/s00158-009-0460-7
Mavrotas, G. (2009). Effective implementation of the ε-constraint method in multi-objective mathematical programming problems. Appl. Math. Comput. 213, 455–465. doi: 10.1016/j.amc.2009.03.037
Mavrotas, G., and Florios, K. (2013). An improved version of the augmented ε-constraint method (AUGMECON2) for finding the exact pareto set in multi-objective integer programming problems. Appl. Math. Comput. 219, 9652–9669. doi: 10.1016/j.amc.2013.03.002
Mendoza, F. (2010). Diseño multiobjetivo y multietapa de sistemas de distribución de energía eléctrica aplicando algoritmos evolutivos. Bogotá, Colombia: Universidad Nacional de Colombia.
Mirzapour Al-e-hashem, S. M. J., Malekly, H., and Aryanezhad, M. B. (2011). A multi-objective robust optimization model for multi-product multi-site aggregate production planning in a supply chain under uncertainty. Int. J. Prod. Econ. 134, 28–42. doi: 10.1016/j.ijpe.2011.01.027
Osorio, A., Brailsford, S., and Smith, H. (2014). Un modelo de optimización bi-objetivo para la selección de tecnología y asignación de donantes en la cadena de suministro de sangre. Sistemas Telemática 12, 9–24.
Peng, Y., Zhang, Y., Yu, D. Z., and Luo, Y. (2024). Multiobjective route optimization for multimodal cold chain networks considering carbon emissions and food waste. Mathematics 12:3559. doi: 10.3390/math12223559
Perdana, T., Chaerani, D., Hermiatin, F. R., Achmad, A. L. H., and Fridayana, A. (2022). Does an alternative local food network contribute to improving sustainable food security? Sustainability 14:1533. doi: 10.3390/su141811533
Soler, S. (2013). Programación Multiobjetivo: Caso práctico aplicado a una compañía aérea. Available online at: https://digitum.um.es/digitum/bitstream/10201/40606/1/TrabajoRC5.pdf (Accessed June 18, 2025).
Sucre noticias (2019). Sucre está grave en seguridad alimentaria. Available online at: https://sucrenoticias.com/sucre-esta-grave-en-seguridad-alimentaria/ (Accessed June 18, 2025).
Tapia, L. (2016). Diseño de la cadena de suministro agroalimentaria de la berenjena en Córdoba-Colombia mediante la integración del modelo SCOR y el enfoque de optimización. Cartagena: Universidad Tecnólogica de Bolívar. Available online at: https://repositorio.utb.edu.co/server/api/core/bitstreams/740c7eb2-7bde-40b0-bcb5-b346318b6680/content (Accessed September 7, 2025).
Torres, C. (2016). Optimización heurística multiobjetivo para la gestión de activos de infraestructuras de transporte terrestre. Santiago, Chile: Universidad Católica de Chile.
Trisna, T., Marimin, M., Arkeman, Y., and Sunarti, T. C. (2016). Multi-objective optimization for supply chain management problem: a literature review. Decision Sci. Lett. 283–316, 283–316. doi: 10.5267/j.dsl.2015.10.003
Wei, G., Zhou, L., and Bary, B. (2022). Operational decision and sustainability of green agricultural supply chain with consumer-oriented altruism. Sustainability 14:2210. doi: 10.3390/su141912210
Weintraub, A., and Romero, C. (2006). Operations research models and the management of agricultural and forestry resources: a review and comparison. Interfaces 36, 446–457. doi: 10.1287/inte.1060.0222
Xie, S., Formonov, A., Thapit, A. A., Alshalal, M. H., Obeis, M. K. S., Sivaraman, R., et al. (2022). Mushroom supply chain network design using robust optimization approach under uncertainty. Ind. Eng. Manag. Syst. 21, 516–525. doi: 10.7232/iems.2022.21.3.516
Yang, Z., and Liu, S. (2025). Fairness-oriented multi-objective optimization of supply chain planning under uncertainties. Socio Econ. Plan. Sci. 99:102198. doi: 10.1016/j.seps.2025.102198
Zhang, J., Cao, J., Zhao, F., and Chen, Z. (2024). Two cooperative constraint handling techniques with an external archive for constrained multi-objective optimization. Memet. Comput. 16, 115–137. doi: 10.1007/s12293-024-00409-3
Zuniga González, C. A. (2020). Crecimiento de la productividad total de los factores en la agricultura: análisis del índice de Malmquist de 14 países, 1979-2008. REICE Rev. Elect. Investigación en Ciencias Econ. 8, 68–97. doi: 10.5377/reice.v8i16.10661
Keywords: multi-objective, optimization, agri-food, sustainability, supply chain, yam, AUGMECON
Citation: Vergara Rodríguez CJ, Mendoza-Ortega GP, Mármol Barriosnuevo M and Díaz Sierra M (2025) Multi-objective optimization for the sustainable planning of yam cultivation and distribution in the Colombian Caribbean. Front. Sustain. 6:1653365. doi: 10.3389/frsus.2025.1653365
Edited by:
Amalendu Singha Mahapatra, Techno India Group, IndiaReviewed by:
Tomas Gabriel Bas, Catholic University of the North, Coquimbo, ChileCarlos Alberto Zúniga-González, National Autonomous University of Nicaragua, León, Nicaragua
Copyright © 2025 Vergara Rodríguez, Mendoza-Ortega, Mármol Barriosnuevo and Díaz Sierra. This is an open-access article distributed under the terms of the Creative Commons Attribution License (CC BY). The use, distribution or reproduction in other forums is permitted, provided the original author(s) and the copyright owner(s) are credited and that the original publication in this journal is cited, in accordance with accepted academic practice. No use, distribution or reproduction is permitted which does not comply with these terms.
*Correspondence: Gean Pablo Mendoza-Ortega, Z2Vhbi5tZW5kb3phQGNlY2FyLmVkdS5jbw==