 Burak Keskin
- Department of Business Administration, Faculty of Economics and Administrative Sciences, Cankiri Karatekin University, Cankiri, Türkiye
The Sustainable Development Goals (SDGs), announced by the United Nations (UN) in 2015, consist of 17 goals. Today, the rapid increase in population and industrialization necessitates the efficient and effective use of resources. Furthermore, climate change and global warming highlight the importance of a sustainable world. From this perspective, the performance of OPEC (Organization of the Petroleum Exporting Countries) member countries—which hold over two-thirds of the world's oil reserves—in achieving the SDGs is of significant interest. This study uses Gray Relational Analysis (GRA) to examine the performance of 13 OPEC countries using social, environmental, and economic indicators. The results indicate that the countries with the best performance are the United Arab Emirates (UAE), Saudi Arabia, and Kuwait, while those with the lowest performance are Nigeria, Equatorial Guinea, and Angola, respectively. The primary factors contributing to the low performance of certain countries include shortcomings in gender inequality, education, and mortality rate indicators.
1 Introduction
Global warming, rapidly increasing population and consumption rate force us to take both economic, social, and environmental measures. The International Energy Agency (IEA) predicts that global population and energy consumption will keep rising over the next 20 to 25 years. In this process, it is expected that the world population will be 8.9 billion, the total Gross Domestic Product (GDP) will be double that of today, and as a result, the global energy consumption will be at the level of 1.6 billion tons (Hsieh, 2022). Estimates indicate that both population and economic growth in the next 30 years should take rapid measures against the social, economic, and environmental problems that will be brought. The swift growth of the global economy, fueled by excessive and unmindful use of natural resources alongside unsustainable development initiatives, has recently resulted in significant socio-economic and environmental challenges (Guo et al., 2022). Supporting economic growth, regardless of the consequences, has become the top priority for governments to avoid falling behind in international competition and to meet local demands. In this process, the damage caused by the excessive use of natural resources has been overlooked.
Sustainability, sustainable development, and the UN's 2015 SDGs have become increasingly important topics in recent years and are now areas of frequent focus as we have seen in the literature review stage. The main reason for the rising popularity of sustainability is our inefficiently use of the world's natural resources. The concept of sustainability emerged in our lives especially after World War II, alongside rapidly developing economies spurred by Keynesian economic policies, industrialization, development, and a growing population. As a result of population growth and industrialization, the rapid and unregulated consumption of resources has led to environmental problems, prompting countries to hold summits focused on environmental and climate change issues such as 1972 Stockholm Conference, the 1987 Brundtland Report, the 1992 Rio Conference, the 1997 Kyoto Protocol, the 2000 Millennium Declaration, and the 2015 Paris Agreement under the 2030 Agenda for Sustainable Development.
In 2015, the UN announced the SDGs under the 2030 Agenda, aiming to reduce and eliminate global challenges across a variety of areas—from hunger and poverty to underwater life and economic prosperity. It is expected that these goals and targets will be achieved with the highest possible performance by 2030. Therefore, this study aims to examine the performance of OPEC member countries in relation to the SDGs and to identify the areas where they should place greater emphasis when compared to one another. Based on the results obtained from this performance analysis, recommendations will be made to policymakers and governments for OPEC member countries to achieve the SDGs with high performance by 2030. Because with its population of approximately 500 million, OPEC is an important organization whose performance in achieving the SDGs should be closely monitored, and, if necessary, urgent measures should be proposed to achieve better results in the process.
The world is trying to create a more sustainable way and various goals are set to solve some serious economic, social, and environmental global problems like climate change, poverty, and inequality. To cope with such problems first, the Millennium Development Goals (MDGs) were announced in September 2000. However, due to the failure to achieve the desired results with the MDGs, the Sustainable Development Goals (SDGs) were introduced as a continuation, prioritizing environmental sustainability, economic development, and social inclusion without completely eliminating the MDGs. Since that time, sustainable development has been a central theme in global agendas. While the MDGs primarily aimed to enhance wellbeing in less developed nations, the 17 SDGs take a broader approach, targeting all countries and striving to balance economic, social, and environmental objectives. Since 2015, the SDGs have played a pivotal role in international sustainability efforts and developmental plans, influencing numerous studies across various disciplines. It is important to understand that the SDGs were not created to replace the MDGs but rather to validate and build upon them. While some targets within the SDGs are a continuation of those in the MDGs, new targets have also been added. Compared to the MDGs, the SDGs can be seen as a more comprehensive, complex, and motivating agenda (Mishra et al., 2024). The SDGs differ from MDGs in some ways not only in the goal and target number but also in terms of purpose and conception. MDGs were established solely to end poverty in developing countries. However, SDGs encompass goals such as hunger, poverty, economy, environment, health, education, and many more, and they concern all countries around the world (Fukuda-Parr, 2016; Halkos and Gkampoura, 2021). The SDGs are structured around a timeline and emphasize five key themes, known as the 5Ps: Prosperity, People, Peace, Planet, and Partnership (Sachs et al., 2019).
Comprising 17 goals and 169 targets the SDGs cover a range of social, environmental, and economic issues as shown on the Figure 1. Achieving these goals requires addressing poverty, hunger, inequalities, human rights and democracy as well as promoting resource sustainability and awareness of climate change.
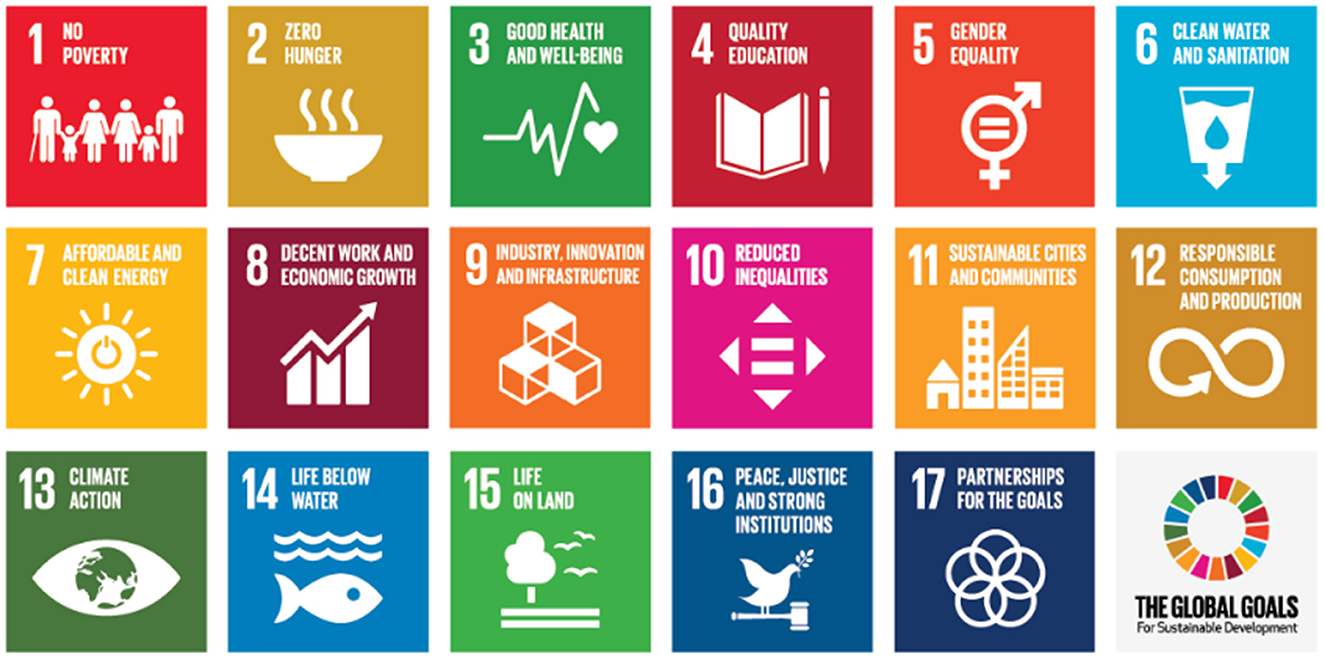
Figure 1. Sustainable development goals. Source: United Nations.
In contrast to earlier development agendas that only focused on economic growth, the SDGs are a universal framework that incorporates many seemingly different policy objectives in the economic, social, and environmental domains, with certain objectives deemed mutually reinforcing (Kroll et al., 2019). The 17 SDGs set forth by the UN which seeks to direct nations toward a more sustainable future and an inclusive and peaceful society. Only by reducing poverty, hunger, gender inequality, and other inequalities, as well as by promoting resource sustainability and climate change awareness, are these goals achievable (Cottafava et al., 2022). All or as much as possible of the objectives of the SDG system should be taken into account when preparing to respond to environmental, economic and social problems. Country-by-country assessments are needed to assess the achievements of the SDGs. In addition, the rate at which the goals are achieved over the years should be taken into account when making current assessments. The agenda encompasses 17 SDGs aimed at tracking advancements in human wellbeing, environmental preservation, and collaborative partnerships (Royo et al., 2022).
Since their announcement in 2015, even before the pandemic, the SDGs had fallen behind the targeted progress, and they suffered significant setbacks due to COVID-19 (Coronavirus Disease). Crises such as COVID-19, climate change, and geopolitical challenges have significantly hindered progress toward achieving the 2030 Agenda. According to the UNs' Sustainable Development Report, 2022 was the second consecutive year with no advancement. With nations grappling with uncertainties around new COVID-19 variants, rising inflation, supply chain disruptions, and escalating debts in developing countries, maintaining focus on the SDGs has become increasingly difficult (Azmat et al., 2023). While the SDGs are universal goals, member states have the flexibility to prioritize specific targets based on their resources, socio-economic priorities, and agreed implementation timelines. Consequently, it is essential to regularly review and evaluate the progress, opportunities, and challenges associated with the SDGs (Mishra et al., 2024).
Since 1950, crude oil has been the world's primary strategic resource, contributing to more than 30% of global energy consumption, surpassing coal, natural gas, and renewable energy sources. As production increased and new oil fields were developed, global market prices dropped significantly. This created an urgent need to regulate supply volumes, reduce production, and stabilize prices. To address and manage this issue, the OPEC was established by Iraq, Kuwait, Iran, Saudi Arabia, and Venezuela at the Baghdad conference in 1960. Later, the founding states were joined by the United Arab Emirates, Nigeria, Qatar, Angola, Congo, Indonesia, Algeria, Libya, Ecuador, Equatorial Guinea, and Gabon. The OPEC is an organization enabling the cooperation of leading oil-producing and oil-dependent countries in order to collectively influence the global oil market and maximize profit.
However, for various political and economic reasons, Qatar, Indonesia, Ecuador, and Angola ended their memberships, and as of the end of 2024, OPEC continues its operations with 12 members. The primary goal of establishing the OPEC was bringing together the world's leading oil producers, who hold roughly 80% of global oil reserves (Vasiljeva et al., 2022). As of the end of 2023, the total population of OPEC member countries is 496 million, and their total GDP has reached approximately 3.3 trillion dollars. Information about the member countries, whose economies significantly rely on the export of oil and oil-based products, is provided in Figure 2.
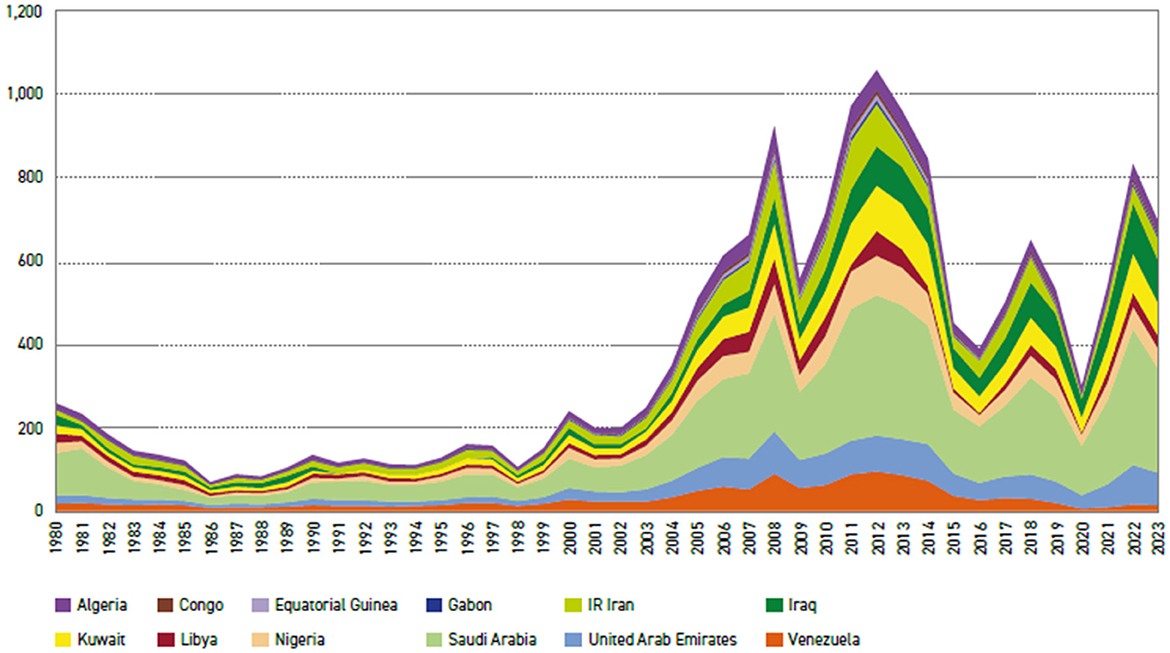
Figure 2. OPEC members' values of petroleum exports (bn $). Source: OPEC website.
Given the importance of such a community in terms of energy, it is crucial to closely monitor their performance, particularly in terms of indicators related to environmental and other SDGs, and to propose appropriate policy recommendations for these low-performing countries. As of 2023, 45% of the crude oil exported worldwide is exported by OPEC member countries.
Alongside the ongoing challenge of stabilizing crude oil prices, OPEC countries are also contending with a gradual decline in oil demand as the world shifts toward a green development path, which in turn requires reductions in oil production. Increasing recognition of the harmful effects of the existing economic system has led numerous countries to adopt a socio-economic development strategy that seeks to balance social, environmental, and economic goals, commonly known as the green economy model. In 2015, numerous countries committed to advancing clean energy technologies, significantly reducing oil, and gas investments to keep global warming below 2 °C (Fekete et al., 2021).
As concerns about climate and environmental issues increase daily around the world, OPEC member countries need to reduce their energy intensity, which has been growing on average 14% more than their GDP growth each year since the beginning of the twenty-first century (Samargandi, 2019). Among the most important goals of the SDGs announced in 2015 are reducing poverty and protecting the environment. In particular, for environmental protection and the implementation of preventive measures, the performance of OPEC member countries—whose economies largely depend on revenue from oil and petroleum product exports—needs to be carefully measured and monitored. Therefore, the sustainability performance of OPEC member countries, whose revenues largely come from the export of oil and oil-based products, is important for the sustainable world.
However, based on the available literature on sustainability, sustainable development, and the SDGs, it appears that the performance of OPEC member countries has not been sufficiently assessed in this context. Based on this, there is a need to evaluate the performance of OPEC member countries using the social, environmental and economic indicators of the SDGs. Therefore, the primary aim of this study is to measure the performance of OPEC member countries using the social, environmental and economic indicators of SDGs with the GRA in MCDM methods. When we look at the existing studies in the literature, no study has been found that examines the SDG performances of OPEC member countries in terms of social, environmental, and economic dimensions using GRA method. Since there is a complex and gray relationship among the indicators defined under the SDGs, the GRA method has been preferred in analyzing the quantitative data obtained in this study. For instance, indicators like the unemployment rate and internet users have both economic and social impacts. Therefore, the use of the GRA method has been considered appropriate.
This study is expected to make two main contributions to the literature. First, using the most up-to-date data from the OECD, World Bank, and UN databases, the performance of OPEC member countries in achieving the SDGs has been revealed. This will provide these countries with insights into the stage they are at in reaching their 2030 targets. Another significant contribution is the first-time analysis of SDG indicators, which exhibit complex interrelations, for OPEC member countries using the GRA method.
The remainder of this study is as follows. Section 2 gives information about the literature, while Section 3 outlines the variables, data, and methodology employed. Section 4 presents the results and findings, and Section 5 offers policy recommendations. The concluding remarks and suggestions for future research are discussed in the final section.
2 Review of literature
As of 2023, OPEC member countries hold 80% of the world's proven oil reserves and 36% of its proven natural gas reserves. Due to these extensive fossil fuel reserves, the economies of these countries are highly dependent on natural resources such as oil and natural gas (Keskin, 2021). For instance, in countries such as Congo, Iraq, Kuwait, and Libya, revenue from oil-based exports constitutes nearly 50% of their GDP. It is also necessary to investigate the social and environmental performance of countries whose economies are so dependent on oil and oil product exports. However, in the literature, performance analyses on SDGs are more frequently conducted for countries in the OECD, Europe, and other regions compared to OPEC member countries. A review of these analyses shows that MCDM methods are commonly employed in such studies. Some examples are provided below.
Brodny and Tutak (2023) utilized an MCDM-based approach to evaluate the energy and climate sustainability of European Union member states. Adali et al. (2022) assessed the smartness of European cities through an integrated gray MCDM methodology. Hu and Tzeng (2017) introduced a hybrid fuzzy MCDM method to support strategic planning for enhanced life development using OECD wellbeing indicators. Balkan and Akyüz (2023) assessed the technological maturity of OECD countries with PROMETHEE MCDM method. AHP-TOPSIS methods for selecting supplier in construction supply chain by using social sustainability approach (Marzouk and Sabbah, 2021), TOPSIS method for assessing the sustainability of government bond funds (Bilbao-Terol et al., 2014). GRA method in sustainability for prioritizing energy production systems (Ebrahimi and Rahmani, 2019), GRA and fuzzy-AHP methods for ranking overall energy sustainability performances (Altintas et al., 2020), COPRAS method for sustainability performance evaluation in faculties (Güleryüz, 2024), GRA and optimized support vector regression machine approach for wind power forecasting (Liu et al., 2024), GRA for the evaluation of oily sludge treatment technology (Li et al., 2024). Wu et al. (2024) used an integrated MCDM method for site selection. Büyüközkan and Güleryüz (2017) evaluated renewable energy resources with DEMATEL, ANP, and TOPSIS. Bai et al. (2023) investigated sustainable energy transition Southern Asia with fuzz MCDM methods.
The number of studies focused on sustainability has recently increased, especially due to the United Nations announcing the 2030 Agenda in 2015 and the importance of achieving the goals it set for the world. For example, Ecer et al. (2019) carried out a sustainable development performance assessment for OPEC countries. Dadgar and Nazari (2022) conducted a comparative sustainable development analysis study for OPEC and OECD countries. Rusydiana et al. (2021) investigated energy efficiency in OIC countries under SDG 7 output. Khaled et al. (2021) measured corporate sustainability, Lo-Iacono-Ferreira et al. (2022) urban sustainability, Lamichhane et al. (2021) sustainable development performance for OECD countries, Lafortune et al. (2020) compared different approaches for sustainable development goals performance of EU countries. Vasiljeva et al. (2022) investigated the sustainable development performance of OPEC++-participating countries. Candan and Cengiz Toklu (2022) conducted a study to evaluate European Union's sustainability performance using integrated spherical fuzzy analytic hierarchy process and GRA method. Khan et al. (2024) carried out a research on public energy R&D spending and green energy for sustainable development. Shi et al. (2021) proposed a novel GRA and set pair analysis methods to build an sustainability assessment for autonomous regions in China. GRA and TOPSIS methods were employed to select sustainable building materials supplier by Chen (2019).
When reviewing studies conducted in previous years in the literature, it is observed that various researchers have conducted studies on OPEC and sustainable development using one or more MCDM methods. However, it is also noteworthy that there are not enough studies examining the SDG performance of OPEC countries. This shows us that there is a gap in the literature regarding studies investigating OPEC and sustainable development issues together. In this study, the performance of OPEC member countries regarding the SDGs was examined using the GRA method and policy recommendations for member countries were proposed.
3 Data and methodology
Following a comprehensive literature review conducted in Web of Science database, 21 SDG indicators were initially identified. However, due to data limitations for certain countries, such as Congo, Equatorial Guinea, and Angola, 12 indicators were included in the analysis only for the year 2022. Data for these indicators were obtained from the World Bank, the official OPEC website, the UN Development Program, and the Human Development Reports (HDR). The selected indicators were grouped according to the three main dimensions of the SDGs: Social, environmental, and economic. Detailed information on indicators is provided in Table 1. The SDGs encompass numerous indicators across a broad range of areas. Obtaining quantitative data on these indicators for all countries is challenging. As a result, many studies focus on specific indicators and particular years such as Ecer et al. (2019). Table 1 provides descriptive information on all indicators used in this study. As previously stated, the SDGs consist of three main dimensions: social, environmental, and economic. In this study, a performance analysis was conducted using 12 indicators, with six indicators from the social dimension, three from the environmental dimension, and three from the economic dimension.
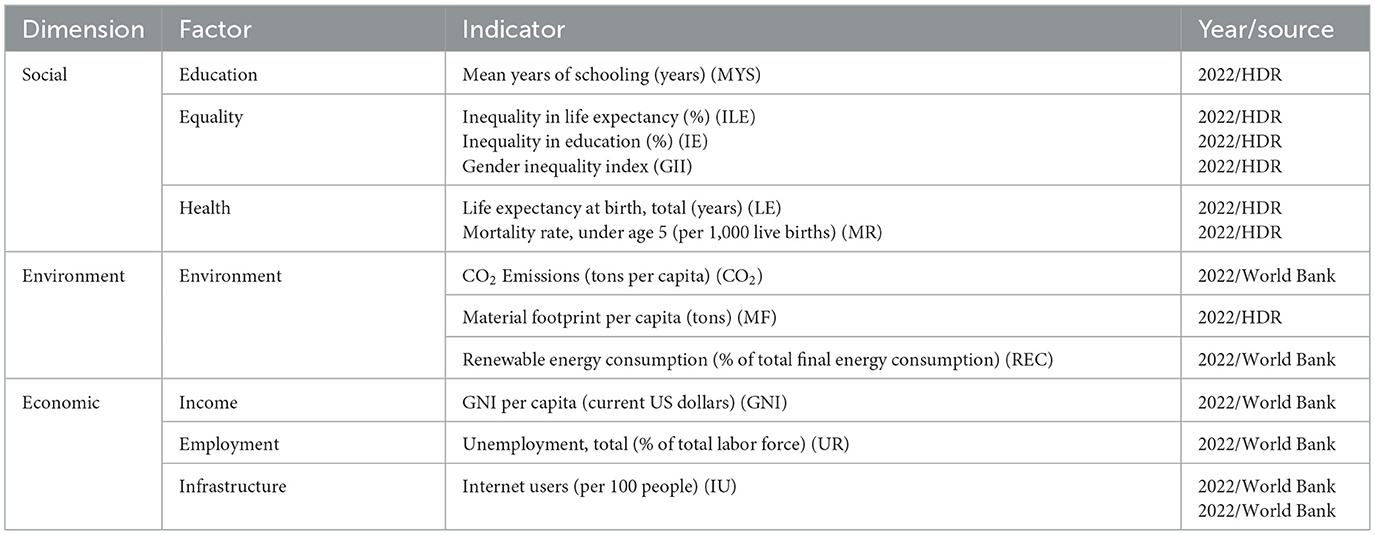
Table 1. Factors and indicators used in the study.
When selecting the indicators to be included in the study, years with available and accessible data for each country were prioritized. Due to the absence of much 2023 data in both the World Bank and United Nations databases, 2022 data was used in the study. To conduct a multi-year analysis, data from the post-COVID period was intended, but since many countries' data was unavailable, the study was conducted for 2022, the year with the most recent and complete data. The most recent data for the indicators specified in Table 1 were obtained from the official websites of the World Bank and the UN.
The current study conducts a performance analysis of the 13 OPEC member countries, which hold a significant share in global fossil fuel production, by evaluating them based on criteria aligned with the three main dimensions of the SDGs. A literature review reveals that although there has been a substantial increase in studies on sustainability in recent years, there are very few studies examining the sustainability performance of an organization like OPEC, which influences global oil prices and holds 80% of the world's oil reserves. Based on this gap, this study aims to assess the performance of OPEC member countries regarding the SDGs using the GRA technique, a MCDM method. Detailed information about the GRA method and the data used in the study is given below.
3.1 Gray relational analysis (GRA)
Gray System Theory (GST) developed by Ju-Long (1982), offers an alternative way to handle uncertainty numerically. The core concept behind GST is to forecast the behavior of uncertain systems that cannot be addressed using stochastic or fuzzy methods, especially when data is limited. GST was designed to manage cases where information is either partially known or partially unknown. In this framework, a “white system” refers to a system with complete information, a “black system” to one with no information, and a “gray system” to a system with partial information (Özbek and Aydın, 2025).
Utilizing quantitative analysis to assess the relative significance of various complex factors, GRA method has become a widely used mathematical method in various fields (Meng et al., 2024). Gray relational analysis is a method for evaluating multi-factor data. It effectively addresses the complex relationships between different performance characteristics by optimizing the gray relational level, reducing the impact of subjective biases to some extent, and making the evaluation results more objective and reasonable (Li et al., 2024). In this analysis, the similarities or differences between systems or decision units are represented as “gray relations.” GRA assesses the degree of relationship between two factors by comparing them geometrically, with the strength of their relationship increasing as their geometric proximity grows (Tekin and Keskin, 2021).
GRA operates by assessing the distance from an optimal value to find the ideal solution. The process starts by converting the performance values of all alternatives into a standardized sequence, known as gray relational generating. From these sequences, a reference sequence is established. Relational coefficients between each sequence and the reference are then calculated. Finally, gray relational grades are determined based on these coefficients, comparing each alternative sequence to the reference sequence. The alternative with the highest gray relational grade is considered the best option (Kuo et al., 2008). The GRA method enables the evaluation of various performance attributes by transforming them into a single metric known as the Gray Relational Grade (GRG). This GRG is essential in GRA as it represents the relationship between different sequences. When two sequences are identical, the GRG value reaches one. Additionally, the GRG reflects how much the comparison sequence affects the reference sequence. Therefore, if a particular comparison sequence has a stronger influence on the reference sequence than others do, its GRG with the reference sequence will be higher than the GRGs of the other sequences (Rajesh et al., 2024). The GRA process includes three main steps as follows:
Step 1: Creating of Comparison Matrix and Reference Sequence
Consider a decision process involving m alternatives and n criteria. The factor sequence, comparison or decision matrix, and reference sequence are constructed as illustrated in Equations 1, 2:
Once the comparison matrix is established, a reference sequence is generated using the best values for each factor, as outlined in Equation 3. The best value is defined as the highest value for beneficial factors and the lowest value is determined for non-beneficial factors. The term x0(j) represents the optimal value for each factor.
Step 2: Normalization and Producing Absolute Value Matrix Values
Since the factors involved in calculating gray relational coefficients may have different units of measurement, it is necessary to standardize the data. This procedure is known as normalization. The normalization process differs depending on whether the factor is a beneficial attribute (where higher values are better), a non-beneficial attribute (where lower values are better), or an optimum attribute. The formulas for these three types of attributes are provided in Equations 4–6, respectively.
The x0b in Equation 6 means that the optimum and target value of the factor j and ranges between maxj xi(j) and minj xi(j). The normalization matrix is created, as shown in Equation 7.
The final step of this process involves calculating the absolute value matrix. The formula for calculating the absolute value matrix is provided in Equation 8.
Equation 9 shows the matrix of absolute values used to calculate the gray relational coefficients.
Step 3: Calculation Gray Relational Coefficients and Gray Relational Grades
To assess the similarity between Xij and X0j, the gray relational coefficient is used to quantify the difference. A higher gray relational coefficient indicates that Xij is closer to X0j. The gray relational coefficients between Xij and X0j are calculated using Equation 10.
The distinguishing coefficient (ζ) is employed to adjust the range of the gray relational coefficient, either expanding or compressing it. In this study, the distinguishing coefficient is set to 0.5 (Cheng et al., 2022). Once the gray relational coefficients are determined, the gray relational grades are calculated using either Equations 11 or 12. These grades reflect the degree of similarity between the series being compared and the reference sequence. The choice of equation depends on whether the factors are considered equally important. Equation 11 is applied when the factors have equal importance, while Equation 12 is used when the factors differ in importance.
The gray relational grade measures the geometric similarity between a comparative sequence and a reference sequence , enabling their comparison. A higher value indicates a stronger relationship between the two sequences. The decision unit with the highest gray relational grade is considered the best-performing unit (Tekin and Keskin, 2021).
4 Results and findings
After the selection process for both the indicators and the data was completed, the performance of OPEC member countries in achieving the SDGs in 2022 was analyzed using the GRA method. GRA method effectively addresses the complex interconnections between various performance characteristics by optimizing the gray relational level, which helps reduce the influence of subjective biases to some degree, resulting in more objective and reasonable evaluation outcomes.
The first row in Table 2 shows the criteria for beneficial (max) or non-beneficial (min). The second row shows the abbreviations of the indicators used in this study and explained in Table 1. The third row represents the best values held by the countries included in the study for each indicator. Here, if a high value of an indicator is positive, the highest value in that column is taken as the reference value; if a high value of an indicator is negative, the lowest value in that column is taken as the reference value. For example, a high value in the MYS indicator is positive for a country. Therefore, the highest value in the MYS column, 12.8, is taken as the reference value. A high value in the CO2 indicator is negative for that country. Therefore, the lowest value in the CO2 column, 0.55, is taken as the reference value.
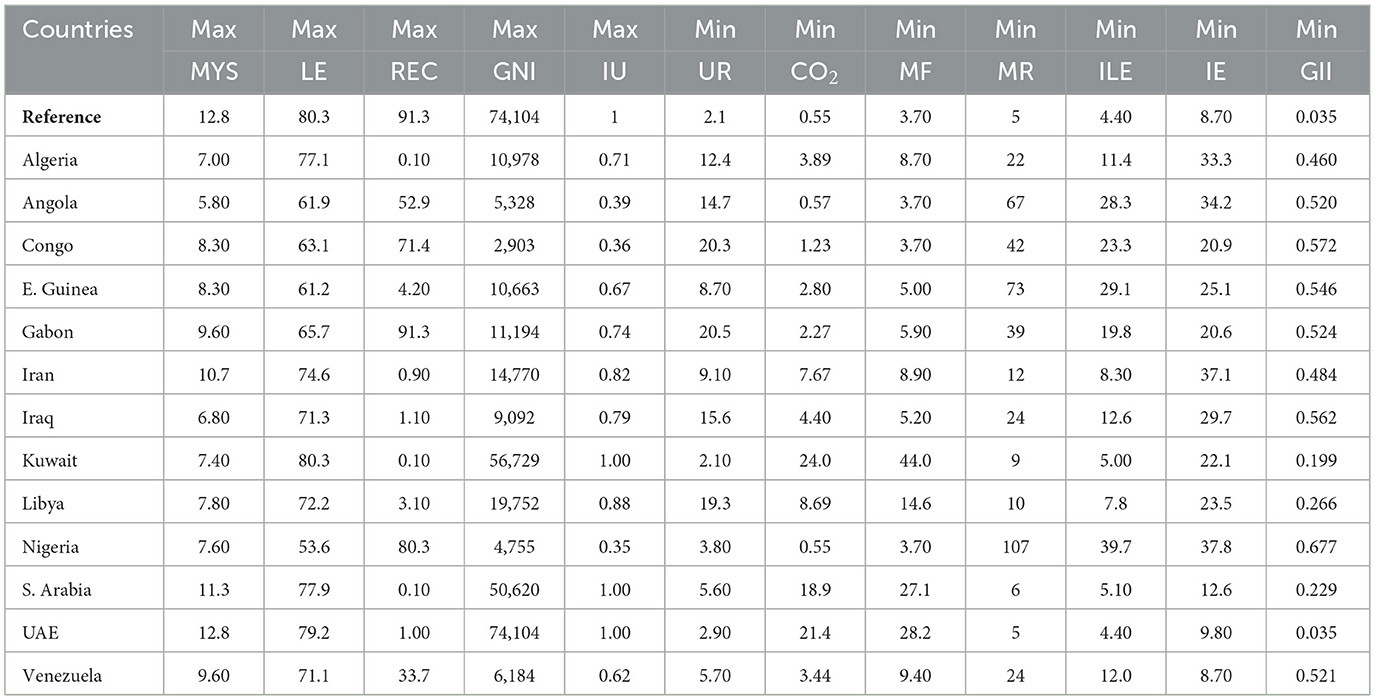
Table 2. GRA reference sequence and comparison matrix.
The next step involves normalizing the data using Equations 4, 5. This normalization is necessary due to the different units of the indicators. The results of this calculation are presented in Table 3. In the subsequent step, an absolute value matrix is generated using Equation 8, as shown in Table 4.
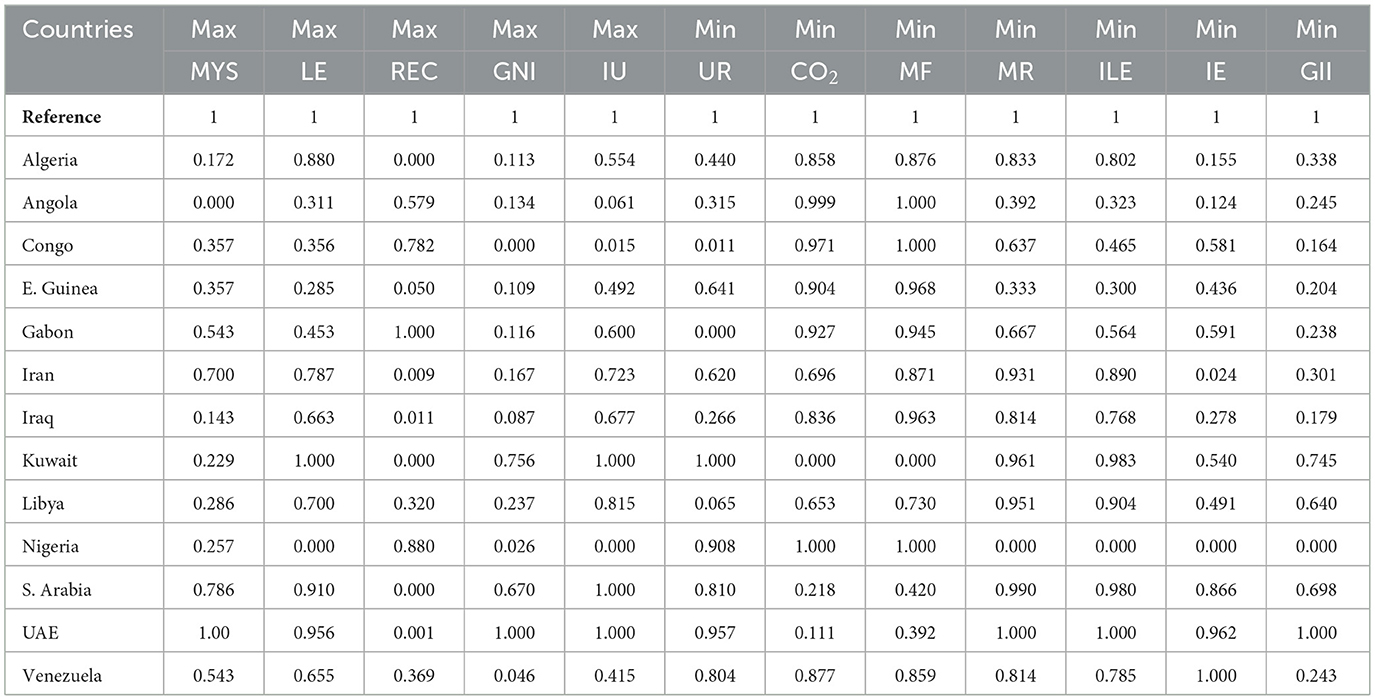
Table 3. GRA normalized decision matrix.
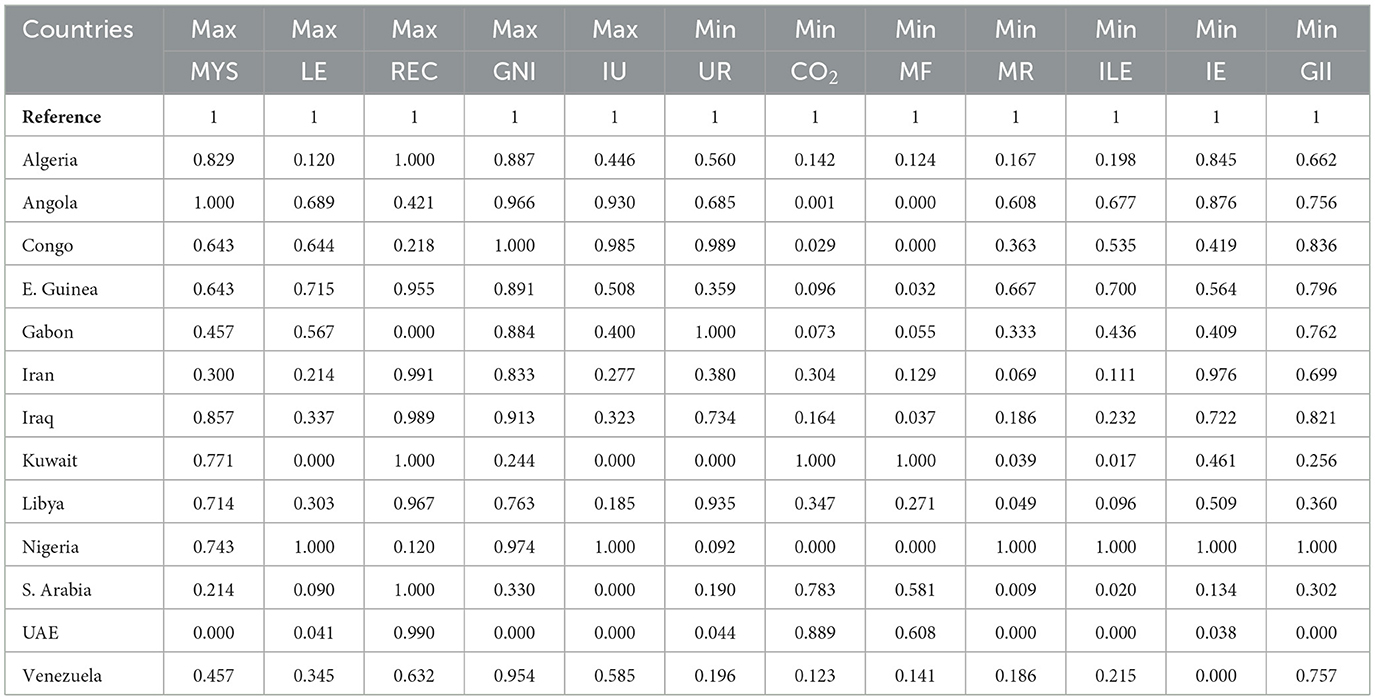
Table 4. GRA absolute value matrix.
In Table 4, the reference sequence comprises the highest value from each column. In the final step, the matrix of gray relational coefficients and the gray relational grades must be calculated to rank the decision units.
The gray relational coefficients are determined using Equation 10, while the gray relational grades are obtained through Equation 11, as shown in Tables 5, 6, respectively. After applying all the necessary steps of the GRA method, the results in Table 6 were obtained.
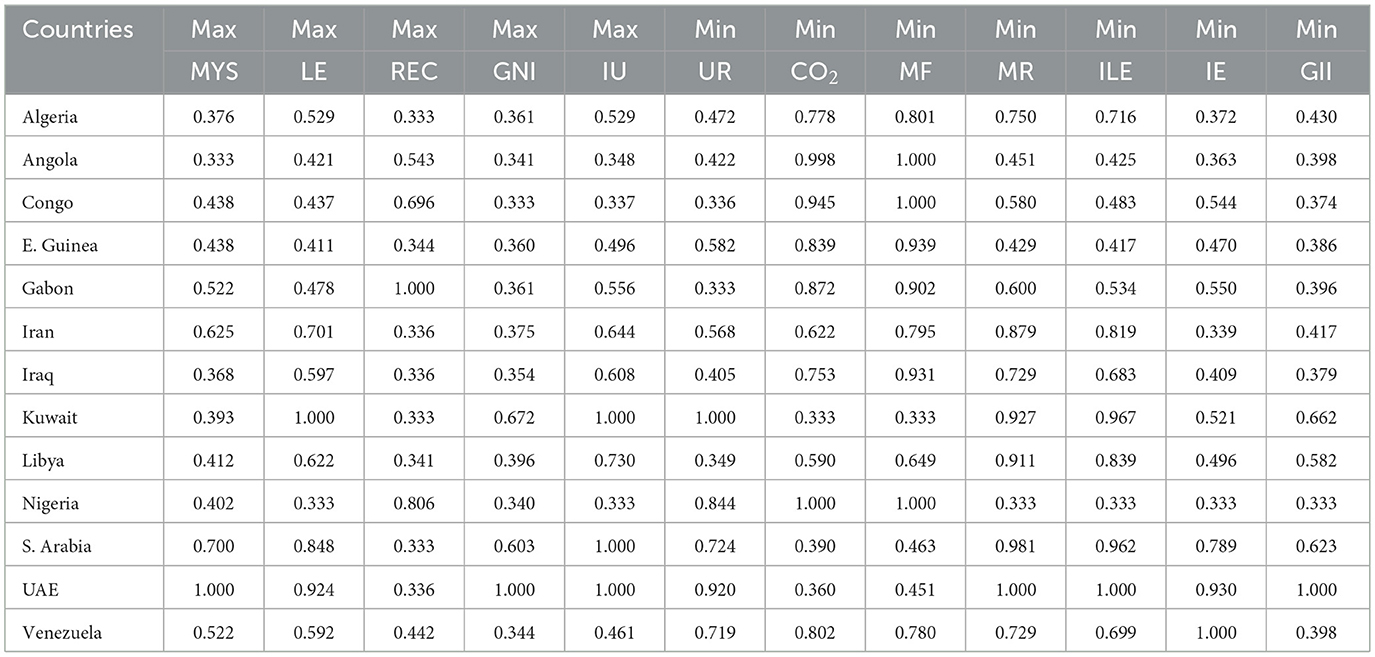
Table 5. Gray relational coefficients matrix.
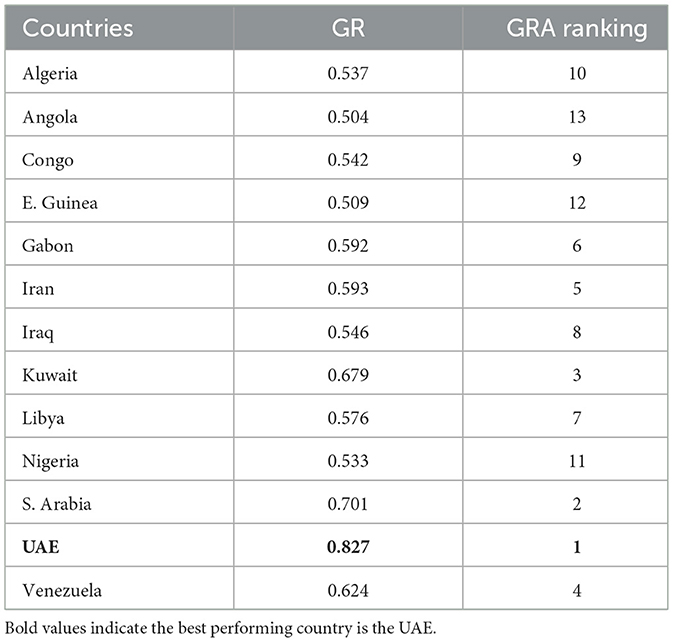
Table 6. Gray relations grades and rankings.
Looking at these results, it is seen that the countries with the best values are, respectively, the UAE, Saudi Arabia, and Kuwait. The countries ranked at the bottom and showing low performance are Nigeria, Equatorial Guinea, and Angola. After applying the GRA method to the available data, the obtained results were compared with similar studies in the literature. For example, in a study by Ecer et al. (2019) on a topic close to the content of this research, the sustainability performances of OPEC countries were evaluated, and the most successful countries were found to be the UAE, Qatar, and Kuwait. They found Iraq, Nigeria and Angola to be the worst performed countries. In another study conducted by Vasiljeva et al. (2022) on OPEC++ participating countries, the USA, Canada, UAE, and Kuwait were found to be the most successful countries in terms of sustainable development performance. When reviewing the results obtained from similar studies in the literature, it can be said that the findings are consistent with this study.
5 Policy implications
The SDGs, announced by the UN in 2015 with goals for improvements across many areas by 2030, represent a complex process that requires ongoing monitoring to ensure sustainable implementation and success. Achieving the SDGs at the targeted level is of great importance, both for current needs and for future generations. Therefore, scientific studies and the results obtained from these studies are of vital importance for countries. Based on the results obtained from these scientific studies, countries need to develop suitable policies for both their current citizens and future generations and carefully implement these policies within a plan. In this context, this study was conducted to evaluate the performance of OPEC member countries in implementing and achieving the SDGs and to provide suitable policy recommendations to the policy makers, governments, and researchers. Below, various policy recommendations are provided for the countries included in the study in the social, environmental, and economic fields.
Looking at the results in Table 6, despite Nigeria's low carbon emissions and unemployment rate, it shows a very poor performance in education, GNI, and internet users indicators. Therefore, Nigeria needs to focus specifically on these three sectors within the SDG framework. Another striking result to be stated here is that Nigeria, in addition to its low school enrollment rate, is the country with the highest inequality in education. The government must take measures to ensure equal opportunities in education and ensure equality of education between male and female students. To increase the enrollment rate, efforts should be made to raise awareness among families. The government should build modern schools with adequate infrastructure and technological resources to replace old and neglected schools. Initiatives should be taken to encourage families and hire qualified teachers. Similar to Nigeria, both Equatorial Guinea and Angola have very low performance in education and education equality. Unlike these indicators, the high mortality rate values in Angola and Equatorial Guinea are among the main reasons for their low rankings in overall performance. Building modern healthcare facilities, minimizing the distance between residential areas and hospitals, and ensuring an adequate number of pediatric intensive care units are measures that could help improve the values in this indicator.
Aside from Nigeria, Equatorial Guinea, and Angola, another poorly performing OPEC member is Algeria. Findings from the performance analysis indicate that the main reasons for Algeria's poor performance are its low renewable energy usage rate, high CO2 emissions, and inequality in education. Based on these findings, it can be said that Algeria needs to take measures, particularly regarding environmental issues, by transitioning to and investing in renewable and clean energy sources.
It can be seen that the UAE, Saudi Arabia, and Kuwait, which are ranked in the top three in the overall performance ranking, do not perform particularly well in the indicators under the environmental dimension. Looking at the CO2 and material footprint values of these countries, it is easy to see that they have much higher values compared to other OPEC member countries. Similarly, the share of renewable energy consumption within the total energy consumption of the UAE, Saudi Arabia, and Kuwait has remained quite low compared to other OPEC member countries. While these countries need to implement environmentally focused policies to reduce CO2 emissions, they also need to promote investment in and the use of renewable energy sources. Despite their good performance in other indicators, these countries need to take action regarding environmental issues much more.
6 Conclusion and future directions
The UN Sustainable Development Goals emphasize two key challenges: reducing poverty and advancing clean energy. A combination of resources, technology, and legislation can help in achieving these goals. In recent years, many countries and organizations have been making efforts for a greener, more livable world with people having a better economy, in short, a more sustainable world. If we express these efforts especially in a regional sense, the fact that significant improvements should be made in terms of education and health, especially in the African region, is an important conclusion that can be drawn from both the results of this study and many similar studies in the literature. However, many reasons such as regional conflicts, political crises, etc. make it difficult to achieve the goal of a sustainable world to be built for future generations. For example, it can be said that the performance of member countries in achieving the SDGs has been affected due to reasons such as Qatar, one of the OPEC member countries, leaving OPEC as a result of the political crisis it has with Saudi Arabia, Venezuela's economic and political crisis that it has been going through for years, the sanctions imposed on Iran by the USA, and the problems in Libya and Iraq. It can be clearly said that such political and economic problems affect the measures that OPEC member countries will take regarding social, economic, environmental and even sustainability issues.
No matter how many political and economic crises occur, OPEC member countries need to make significant improvements in areas such as gender inequality, income inequality, and mean years of schooling. In this study, due to missing data for some countries, the income inequality indicator could not be used. However, in the coming years, when all data is available for these countries, it may be possible to conduct a more comprehensive study that includes the income inequality indicator. For a more sustainable world, it is necessary to assess the current status of countries in terms of their ability to achieve the 2030 sustainability goals using the available data. To this end, the SDG performance of 13 OPEC member countries in 2022 was analyzed using 12 indicators through the GRA method. The analysis results show that the UAE, Saudi Arabia, and Kuwait are the best-performing countries, while Nigeria, Equatorial Guinea, and Angola are the lowest-performing countries.
If the OPEC organization were a single country, with an average Human Development Index value of 0.7213 for 2022, it would fall below the global average of 0.739 and rank 113th among 193 countries in the Human Development Index report published by the United Nations. Therefore, it can be said that OPEC member countries need significant advancements in education, health, environment, and economic fields to achieve the SDGs declared by the UN. To achieve the SDGs, each country needs to review its current situation and identify its priority areas. As mentioned earlier, the SDGs are not an obligation imposed on countries but an agenda where improvements are expected in critical areas. As a result of these improvements and achievements, it can be said that OPEC member countries are likely to rank higher in the HDI rankings.
Well, what should we do to achieve or make significant progress on the SDGs by 2030? Educating people about sustainability, fostering innovation, and conducting research stand out as essential keys to reaching the 2030 targets. Since the announcement of the SDGs in 2015, the topic has gained significant attention in research over the years. The existing body of knowledge on the SDGs provides researchers with valuable insights based on previous studies. This is particularly important as it helps researchers approach the SDGs from various perspectives. In this way, studies can be conducted on the SDGs in different contexts and categories, while also providing policymakers and governments with recommendations on where countries currently stand and what they need to do to achieve the SDGs.
One of the limitations of this study is the inability to access more indicators and additional annual data for all OPEC member countries. When the data from databases such as the World Bank, UN, and Human Development Reports are updated, more comprehensive studies can be conducted with additional indicators and annual data, and the progress of countries regarding the SDGs can be observed through comparison of the results. Researchers who want to work in this area in the future can make more comprehensive and qualified inferences by comparing the results of this study with the results of studies they will conduct by including more years when data on more indicators are available.
Data availability statement
The original contributions presented in the study are included in the article/supplementary material, further inquiries can be directed to the corresponding author.
Author contributions
BK: Writing – original draft, Formal analysis, Visualization, Methodology, Data curation, Project administration, Resources, Validation, Supervision, Investigation, Software, Writing – review & editing, Conceptualization, Funding acquisition.
Funding
The author(s) declare that no financial support was received for the research and/or publication of this article.
Conflict of interest
The author declares that the research was conducted in the absence of any commercial or financial relationships that could be construed as a potential conflict of interest.
Generative AI statement
The author(s) declare that no Gen AI was used in the creation of this manuscript.
Any alternative text (alt text) provided alongside figures in this article has been generated by Frontiers with the support of artificial intelligence and reasonable efforts have been made to ensure accuracy, including review by the authors wherever possible. If you identify any issues, please contact us.
Publisher's note
All claims expressed in this article are solely those of the authors and do not necessarily represent those of their affiliated organizations, or those of the publisher, the editors and the reviewers. Any product that may be evaluated in this article, or claim that may be made by its manufacturer, is not guaranteed or endorsed by the publisher.
References
Adali, E. A., Öztaş, G. Z., Öztaş, T., and Tuş, A. (2022). Assessment of European cities from a smartness perspective: an integrated gray MCDM approach. Sustain. Cities Soc. 84:104021. doi: 10.1016/j.scs.2022.104021
Altintas, K., Vayvay, O., Apak, S., and Cobanoglu, E. (2020). An extended GRA method integrated with fuzzy AHP to construct a multidimensional index for ranking overall energy sustainability performances. Sustainability 12:1602. doi: 10.3390/su12041602
Azmat, F., Lim, W. M., Moyeen, A., Voola, R., and Gupta, G. (2023). Convergence of business, innovation, and sustainability at the tipping point of the sustainable development goals. J. Bus. Res. 167:114170. doi: 10.1016/j.jbusres.2023.114170
Bai, W., Zhang, L., Lu, S., Ren, J., and Zhou, Z. (2023). Sustainable energy transition in Southeast Asia: energy status analysis, comprehensive evaluation and influential factor identification. Energy 284:128670. doi: 10.1016/j.energy.2023.128670
Balkan, D., and Akyüz, G. A. (2023). Technological maturity of the OECD countries: a multi-criteria decision-making approach using PROMETHEE. Cogent Eng. 10:2219097. doi: 10.1080/23311916.2023.2219097
Bilbao-Terol, A., Arenas-Parra, M., Cañal-Fernández, V., and Antomil-Ibias, J. (2014). Using TOPSIS for assessing the sustainability of government bond funds. Omega 49, 1–17. doi: 10.1016/j.omega.2014.04.005
Brodny, J., and Tutak, M. (2023). Assessing the energy and climate sustainability of European Union member states: an MCDM-based approach. Smart Cities 6, 339–367. doi: 10.3390/smartcities6010017
Büyüközkan, G., and Güleryüz, S. (2017). Evaluation of Renewable Energy Resources in Turkey using an integrated MCDM approach with linguistic interval fuzzy preference relations. Energy 123, 149–163. doi: 10.1016/j.energy.2017.01.137
Candan, G., and Cengiz Toklu, M. (2022). Sustainable industrialization performance evaluation of European Union countries: an integrated spherical fuzzy analytic hierarchy process and grey relational analysis approach. Int. J. Sustain. Dev. World Ecol. 29, 387–400. doi: 10.1080/13504509.2022.2027293
Chen, C. H. (2019). A new multi-criteria assessment model combining GRA techniques with intuitionistic fuzzy entropy-based TOPSIS method for sustainable building materials supplier selection. Sustainability 11:2265. doi: 10.3390/su11082265
Cheng, Y. C., Yeh, H. C., and Lee, C. K. (2022). Multi-objective optimization of the honeycomb core in a honeycomb structure using uniform design and grey relational analysis. Eng. Optimiz. 54, 286–304. doi: 10.1080/0305215X.2020.1862825
Cottafava, D., Ascione, G. S., Corazza, L., and Dhir, A. (2022). Sustainable development goals research in higher education institutions: an interdisciplinarity assessment through an entropy-based indicator. J. Bus. Res. 151, 138–155. doi: 10.1016/j.jbusres.2022.06.050
Dadgar, Y., and Nazari, R. (2022). Analyzing sustainable development in OPEC countries vs OECD countries: comparative study by TOPSIS methodology. OIDA Int. J. Sustain. Dev. 15, 25–34.
Ebrahimi, M., and Rahmani, D. (2019). A five-dimensional approach to sustainability for prioritizing energy production systems using a revised GRA method: a case study. Renew. Energy 135, 345–354. doi: 10.1016/j.renene.2018.12.008
Ecer, F., Pamucar, D., Zolfani, S. H., and Eshkalag, M. K. (2019). Sustainability assessment of OPEC countries: Application of a multiple attribute decision making tool. J. Clean. Prod. 241:118324. doi: 10.1016/j.jclepro.2019.118324
Fekete, H., Kuramochi, T., Roelfsema, M., den Elzen, M., Forsell, N., Höhne, N., et al. (2021). A review of successful climate change mitigation policies in major emitting economies and the potential of global replication. Renew. Sustain. Energy Rev. 137:110602. doi: 10.1016/j.rser.2020.110602
Fukuda-Parr, S. (2016). From the Millennium Development Goals to the sustainable development goals: shifts in purpose, concept, and politics of global goal setting for development. Gender Dev. 24, 43–52. doi: 10.1080/13552074.2016.1145895
Güleryüz, S. (2024). “Sustainability performance evaluation in faculties: a COPRAS-based assessment,” in International Conference on Intelligent and Fuzzy Systems (Cham: Springer Nature Switzerland), 137–146. doi: 10.1007/978-3-031-70018-7_16
Guo, H., Liang, D., Sun, Z., Chen, F., Wang, X., Li, J., et al. (2022). Measuring and evaluating SDG indicators with Big Earth Data. Sci. Bull. 67, 1792–1801. doi: 10.1016/j.scib.2022.07.015
Halkos, G., and Gkampoura, E. C. (2021). Where do we stand on the 17 sustainable development goals? An overview on progress. Econ. Anal. Policy 70, 94–122. doi: 10.1016/j.eap.2021.02.001
Hsieh, J. C. (2022). Study of energy strategy by evaluating energy–environmental efficiency. Energy Rep. 8, 1397–1409. doi: 10.1016/j.egyr.2021.12.061
Hu, S. K., and Tzeng, G. H. (2017). Strategizing for better life development using OECD well-being indicators in a hybrid fuzzy MCDM model. Int. J. Fuzzy Syst. 19, 1683–1702. doi: 10.1007/s40815-017-0328-8
Ju-Long, D. (1982). Control problems of grey systems. Syst. Control Lett. 1, 288–294. doi: 10.1016/S0167-6911(82)80025-X
Keskin, B. (2021). An efficiency analysis on social prosperity: OPEC case under network DEA slack-based measure approach. Energy 231:120832. doi: 10.1016/j.energy.2021.120832
Khaled, R., Ali, H., and Mohamed, E. K. (2021). The sustainable development goals and corporate sustainability performance: mapping, extent and determinants. J. Clean. Prod. 311:127599. doi: 10.1016/j.jclepro.2021.127599
Khan, Z., Chatti, W., and Xufeng, Z. (2024). Public energy R&D spending and green energy for Sustainable Development: COP28 perspective of G7 economies. Energy 313:133754. doi: 10.1016/j.energy.2024.133754
Kroll, C., Warchold, A., and Pradhan, P. (2019). Sustainable development goals (SDGs): are we successful in turning trade-offs into synergies? Palgrave Commun. 5:140. doi: 10.1057/s41599-019-0335-5
Kuo, Y., Yang, T., and Huang, G. W. (2008). The use of grey relational analysis in solving multiple attribute decision-making problems. Comput. Indus. Eng. 55, 80–93. doi: 10.1016/j.cie.2007.12.002
Lafortune, G., Fuller, G., Schmidt-Traub, G., and Kroll, C. (2020). How is progress towards the sustainable development goals measured? Comparing four approaches for the EU. Sustainability 12:7675. doi: 10.3390/su12187675
Lamichhane, S., Egilmez, G., Gedik, R., Bhutta, M. K. S., and Erenay, B. (2021). Benchmarking OECD countries' sustainable development performance: a goal-specific principal component analysis approach. J. Clean. Prod. 287:125040. doi: 10.1016/j.jclepro.2020.125040
Li, Z., Li, Y., Li, Q., Liu, Z., and Li, R. (2024). Use analytic hierarchy and gray relational analysis for the evaluation of oily sludge treatment technology. Energy Sources A Recov. Utiliz. Environ. Effects 46, 789–803. doi: 10.1080/15567036.2023.2287092
Liu, Y., Li, L., and Liu, J. (2024). Enhancing short-term wind power forecasting accuracy for reliable and safe integration into power systems: a gray relational analysis and optimized support vector regression machine approach. J. Renew. Sustain. Energy 16:013311. doi: 10.1063/5.0181395
Lo-Iacono-Ferreira, V. G., Garcia-Bernabeu, A., Hilario-Caballero, A., and Torregrosa-López, J. (2022). Measuring urban sustainability performance through composite indicators for Spanish cities. J. Clean. Prod. 359:131982. doi: 10.1016/j.jclepro.2022.131982
Marzouk, M., and Sabbah, M. (2021). AHP-TOPSIS social sustainability approach for selecting supplier in construction supply chain. Cleaner Environ. Syst. 2:100034. doi: 10.1016/j.cesys.2021.100034
Meng, Y., Tang, D., Xu, H., Gan, Q., and Yan, T. (2024). Identifying the key factor of medium-rank coalbed methane productivity with gray relational analysis: a case study in Liulin area, Ordos basin, China. Energy Sources A Recov. Utiliz. Environ. Effects 46, 7160–7173. doi: 10.1080/15567036.2020.1750510
Mishra, M., Desul, S., Santos, C. A. G., Mishra, S. K., Kamal, A. H. M., Goswami, S., et al. (2024). A bibliometric analysis of sustainable development goals (SDGs): a review of progress, challenges, and opportunities. Environ. Dev. Sustain. 26, 11101–11143. doi: 10.1007/s10668-023-03225-w
Özbek, A., and Aydın, S. N. (2025). Çok kriterli karar verme yöntemleri ve excel ile problem çözümü. Ankara: Seçkin Yayincilik.
Rajesh, M., Sri, M. N. S., Jeyakrishnan, S., Anusha, P., Manikanta, J. E., Sateesh, N., et al. (2024). Optimization parameters for electro discharge machining on Nimonic 80A alloy using grey relational analysis. Int. J. Interactive Design Manuf. 18, 1429–1442. doi: 10.1007/s12008-023-01616-x
Royo, M. G., Diep, L., Mulligan, J., Mukanga, P., and Parikh, P. (2022). Linking the UN sustainable development goals and African Agenda 2063: understanding overlaps and gaps between the global goals and continental priorities for Africa. World Dev. Sustain. 1:100010. doi: 10.1016/j.wds.2022.100010
Rusydiana, A. S., Laila, N., Tubastuvi, N., Ibrahim, M. A., and Marlina, L. (2021). Energy efficiency in OIC countries: SDG 7 output. Int. J. Energy Econ. Policy 11, 74–81. doi: 10.32479/ijeep.10499
Sachs, J. D., Schmidt-Traub, G., Mazzucato, M., Messner, D., Nakicenovic, N., and Rockström, J. (2019). Six transformations to achieve the sustainable development goals. Nat. Sustain. 2, 805–814. doi: 10.1038/s41893-019-0352-9
Samargandi, N. (2019). Energy intensity and its determinants in OPEC countries. Energy 186:115803. doi: 10.1016/j.energy.2019.07.133
Shi, R., Yi, P., Li, W., and Wang, L. (2021). Sustainability assessment of autonomous regions in China using GRA-SPA method. Sustainability 13:11008. doi: 10.3390/su131911008
Tekin, B., and Keskin, B. (2021). Evaluation the performances of portfolios created with TOPSIS and Grey Relational Analysis methods during covid-19 pandemic. Çankiri Karatekin Üniversitesi Iktisadi ve Idari Bilimler Fakültesi Dergisi 11, 377–407. doi: 10.18074/ckuiibfd.889178
Vasiljeva, M. V., Ponkratov, V. V., Vatutina, L. A., Volkova, M. V., Ivleva, M. I., Romanenko, E. V., et al. (2022). Crude oil market functioning and sustainable development goals: case of OPEC++-participating countries. Sustainability 14:4742. doi: 10.3390/su14084742
Keywords: sustainability, sustainable development goals, OPEC, performance measurement, gray relational analysis (GRA)
Citation: Keskin B (2025) Sustainable development goals performance measurement for OPEC member countries using gray relational analysis method. Front. Sustain. 6:1682731. doi: 10.3389/frsus.2025.1682731
Received: 09 August 2025; Accepted: 23 September 2025;
Published: 03 November 2025.
Edited by:
Lei Huang, California Department of Toxic Substances Control, United StatesReviewed by:
Nuray Tezcan, Halic Universitesi, TürkiyeAli A. Aldhalemi, Al-Furat Al-Awsat Technical University, Iraq
Copyright © 2025 Keskin. This is an open-access article distributed under the terms of the Creative Commons Attribution License (CC BY). The use, distribution or reproduction in other forums is permitted, provided the original author(s) and the copyright owner(s) are credited and that the original publication in this journal is cited, in accordance with accepted academic practice. No use, distribution or reproduction is permitted which does not comply with these terms.
*Correspondence: Burak Keskin, YnVyYWtrZXNraWluQGdtYWlsLmNvbQ==