 Ranjith R.
 Sekar S. K.
- Department of Structural and Geotechnical Engineering, School of Civil Engineering, Vellore Institute of Technology, Vellore, Tamil Nadu, India
A green environment will result from the use of sustainable industrial waste in eco-friendly concrete making. This study summarizes the outcomes of mechanical properties, microstructure characterization, and Environmental–Energy–Economic (3E) analysis of four different M50 grade structural concrete using industry-dumped-out ceramic electrical insulator waste as a substitute for conventional cement and granite aggregates. The optimum quantity of insulator powder in concrete making is found to be 30%. The concrete with 30% insulator powder and 100% insulator aggregates (M4 mix) performs better by achieving significantly higher mechanical properties such as compressive strength, split tensile strength, flexural strength, dynamic and static modulus at 9.29%, 17.50%, 14.42%, 8.31%, and 11.65%, respectively, compared to reference concrete (M1 mix; with 100% cement and 100% granite aggregates). Regression and statistical analysis predictions of R2 > 98% and coefficient of Variation (CV) >5% had a substantial influence on the mechanical properties of insulator concrete. The hydration mechanism of insulator concrete mix M4 increases the chemically bound water (Wb) to 3.24% as found by thermo-gravimetric analysis. Similarly, a 2.20% higher Si-O-Si bond wavenumber enhances the concrete strength as evaluated by Fourier Transform Infrared (FTIR) analysis. Based on the eco-friendly analysis, the maximum specific energy consumption, CO2 emission reduction, and Sustainability Index (SI) were achieved by the M4 mix at 33.58%, 31.28%, and 3.15% respectively. In light of these findings, insulator waste can be used as a cement and aggregate substitute in concrete with 36% of economic benefit.
1 Introduction
The green environment will result from the use of hazardous industrial wastes in the production of concrete (Senthamarai and Devadas Manoharan, 2005; Senthamarai et al., 2011). Solid waste dumps are expected to continue accumulating substantial amounts of waste due to worldwide population growth and the increasing need to fulfill consumer demands. Large volumes of solid waste can be converted into alternative resources that will maintain energy requirements, reduce the use of non-renewable resources for materials, and assist in addressing issues related to the environment and depleted landfills. Several studies have focused on the use of solid waste in concrete, particularly those that can substitute cement, which is a significant source of greenhouse gas emissions worldwide (El-Dieb and Kanaan, 2018). The primary barriers to constructing green structures are enhancing construction efficiency while reducing the impact of buildings on the environment. Since concrete technology has advanced, the utilization of recycled waste has been crucial in lowering the building industry's environmental effect (Gharibi et al., 2022). Cement produces a significant quantity of greenhouse gas emissions. For this reason, there is a need to search for substitute materials for cement (Marvila et al., 2019), and the building sector needs substitutes for cement, which contributes 8% of Carbon Dioxide (CO2) emissions (Ebrahimi et al., 2023). To achieve sustainable development by 2050, we must reduce CO2 emissions from the building sector (Rangel et al., 2020).
The compressive strength of the ceramic powder used in concrete after 7 days of curing did not significantly improve, according to the study by Kumar Metha and Monterio (2006). It may be due to a lack of initial reactivity in the ceramic powder. Additionally, the primary factor influencing its early strength was its capacity for microfilling, whereby the size of the ceramic powder particles varied between 5 and 10 μm. This behavior was consistent with materials that are primarily pozzolanic and have a delayed strength development at young ages. The split tensile strength of concrete was 34.25% greater when sanitary ceramic waste coarse aggregate was used instead of natural aggregate, according to a study by (Zegardło et al. 2016). This resulted from the stronger binding between coarse aggregate made from sanitary ceramic waste and the geopolymer paste than the conventional aggregate and cement paste (Awoyera et al., 2017). The flexural strength of standard-strength concrete is typically between 10 and 15% of its compressive strength. The test result is in accordance with a prior study (Keshavarz and Mostofinejad, 2019), which found that adding red ceramic and 100% porcelain tile to the concrete as aggregates might increase its flexural strength. The modulus of elasticity of the ceramic waste aggregate used in concrete increased when the deformation reduced under load in the research (Higashiyama et al., 2012).
Based on the scanning electron microscopy analysis, it was found that a high rate of ceramic powder replacement in concrete can negatively impact the composition of the C-S-H phase and increase the production of non-reactive particles, such as quartz and partially reacted gel, like Mullite (Huseien et al., 2018). The increase in the concentration of ceramic powder from 10 to 50% has resulted in an increase in the non-refractory quartz with a suboptimal shape and form, producing a pronounced porosity, additionally observed by other investigators (Huseien et al., 2020). The use of ceramic powder, due to its pozzolanic activity, causes C-H consumption and formation of C-S-H gel after subsequent hydration (Li et al., 2020). Similarly, the outcomes are largely attributed to the substitution of ceramic powder with cement, resulting in a decrease in C-H production during hydration (Chen et al., 2022). It is widely accepted that the amount of portlandite consumed in concrete using pozzolanic material is related to the degree of the pozzolanic response (El-Dieb and Kanaan, 2018). In concrete, ceramic waste may successfully substitute 10%−15% of conventional materials, providing benefits for the environment and the economy (Ahmad et al., 2025). Important insights have been obtained from the study regarding the impact of the amount of ceramic powder in concrete and the influence of the curing period on its strength. There is a complicated link between concrete's strength and the use of ceramic powder. At 5% ceramic content, a notable improvement in strength is noted (Alotaibi et al., 2024). According to the study by Hashim et al. (2025), comparison to the reference concrete, recycled ceramic tile waste aggregate concrete with extremely fine cerium dioxide showed lower percentages of permeable pores and overall water absorption. The addition of 0.5% ultrafine cerium oxide resulted in a decrease in water absorption at 28 and 90 days; it was 26 and 28% lower than that of the control combination at 28 days, and 42 and 45% lower than that of the primary specimen at 90 days.
2 Research significance, methodology, and objectives of the study
The Indian ceramic industry report 2022 (Status Quo and Outlook 2022: Indian Ceramics Industry, 2022) states that, next to China, India is the world's second-largest producer of ceramic materials. The ceramic industries produced 60,000 tons of ceramic materials annually, and out of that, 18,000 tons come out as waste. According to the study by Senthamarai and Devadas Manoharan (2005), an average of 30% of insulator production ends up as waste, that are not yet efficiently recycled, even though insulator waste stands out for its strength and resistance to chemical deterioration. The findings reported here are an integral part of a research project of the first author that aims to create structural concrete using ceramic electrical insulator waste as a conventional binder and filler replacement to achieve the Sustainable Development Goal (SDG-2030) – Agenda-IX (build resilient infrastructure), and Agenda-XI (sustainable cities and communities). This research builds upon the previous research study by Senthamarai and Devadas Manoharan (2005), which served as the basis for the current study. The research methodology is summarized as a flowchart, as shown in Figure 1.
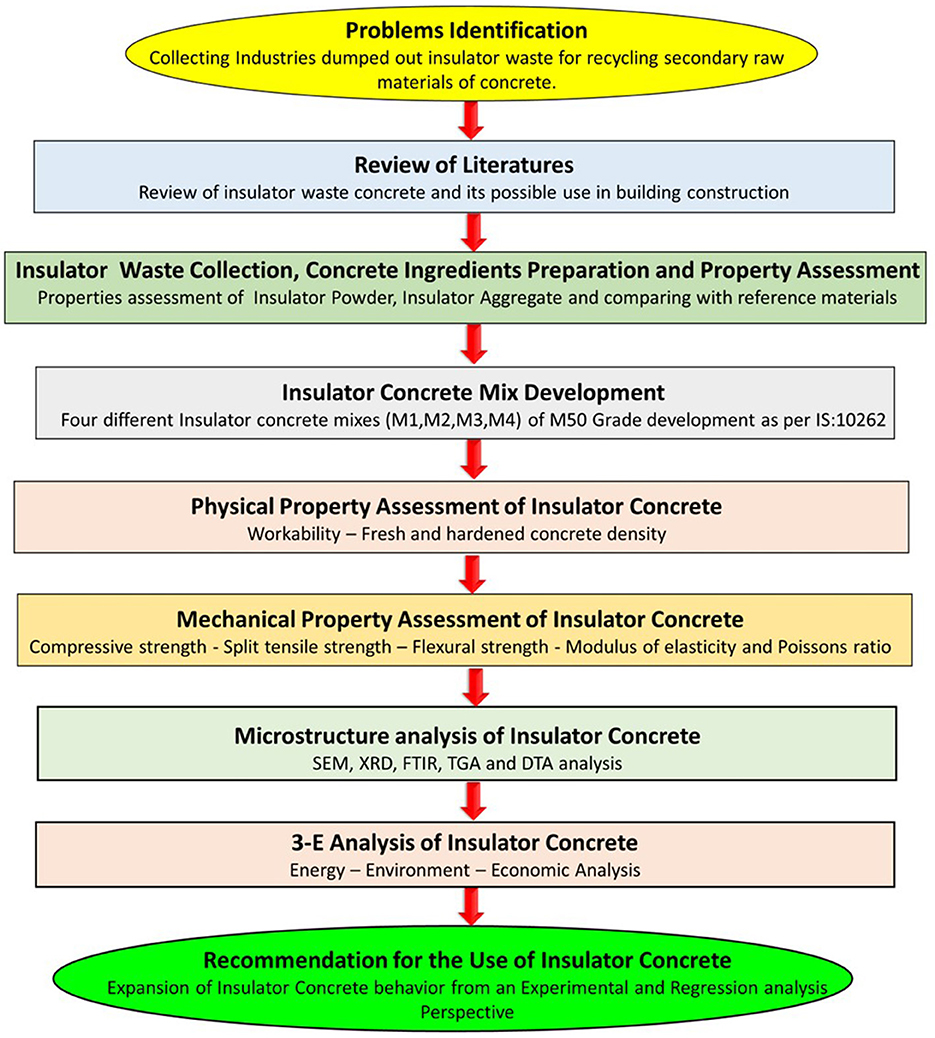
Figure 1. Study methodology.
To enhance the existing research on insulator concrete, the following objectives were investigated in this study.
i. In the first phase, insulator concrete properties were assessed in both their fresh and hardened states to find a suitable insulator mix combination. Regression and statistical analysis were performed to establish quantitative correlations among the mechanical properties of insulator concrete.
ii. In the second phase, microstructure analysis was conducted and correlated with the mechanical properties of insulator concrete.
iii. In the third phase, the Energy–Environment–Economic (3E) analysis was performed.
3 Materials and mix proportions
3.1 Materials used
The insulator waste was collected at no cost from the local electrical insulator manufacturing industry (Saravana Global Energy Limited) located at Peddunaicken Kuppam, Cuddalore, Tamil Nadu, India. The details of the insulator waste collection and concrete ingredient preparation are shown in Figure 2. The electrical insulators are normally too large. These wastes were collected and crushed using a crusher machine available at the government industrial estate for ceramics in Virudhachalam, Tamil Nadu, India. The crushed fragments are fed into electrical sieve shakers to obtain 20 and 4.75 mm maximum sizes of coarse and fine aggregates, respectively. The polished surface of the crushed insulator coarse aggregate was removed manually. The fine particles that come out from the jaw crusher were ground using a ball mill to get fine powder, which is used for the partial replacement of cement. The insulator aggregates were used for the full replacement of granite aggregates. Prepared insulator—coarse aggregate, fine aggregate, and powder—is shown in Figure 3. Ordinary Portland cement and crushed granite aggregates were used as reference materials in accordance with IS 12269:2013, Specification for 53 Grade Ordinary Portland cement (2013) and IS 383:2016, Specification for coarse and fine aggregates from natural sources for Concrete (2016), respectively. Sulfonated naphthalene formaldehyde (SNF) type of superplasticizer (SP) with a specific gravity of 1.18 was added, conforming to BS 5075:1985 (Part-3), Concrete admixtures: Specification for superplasticizing admixtures (1985).
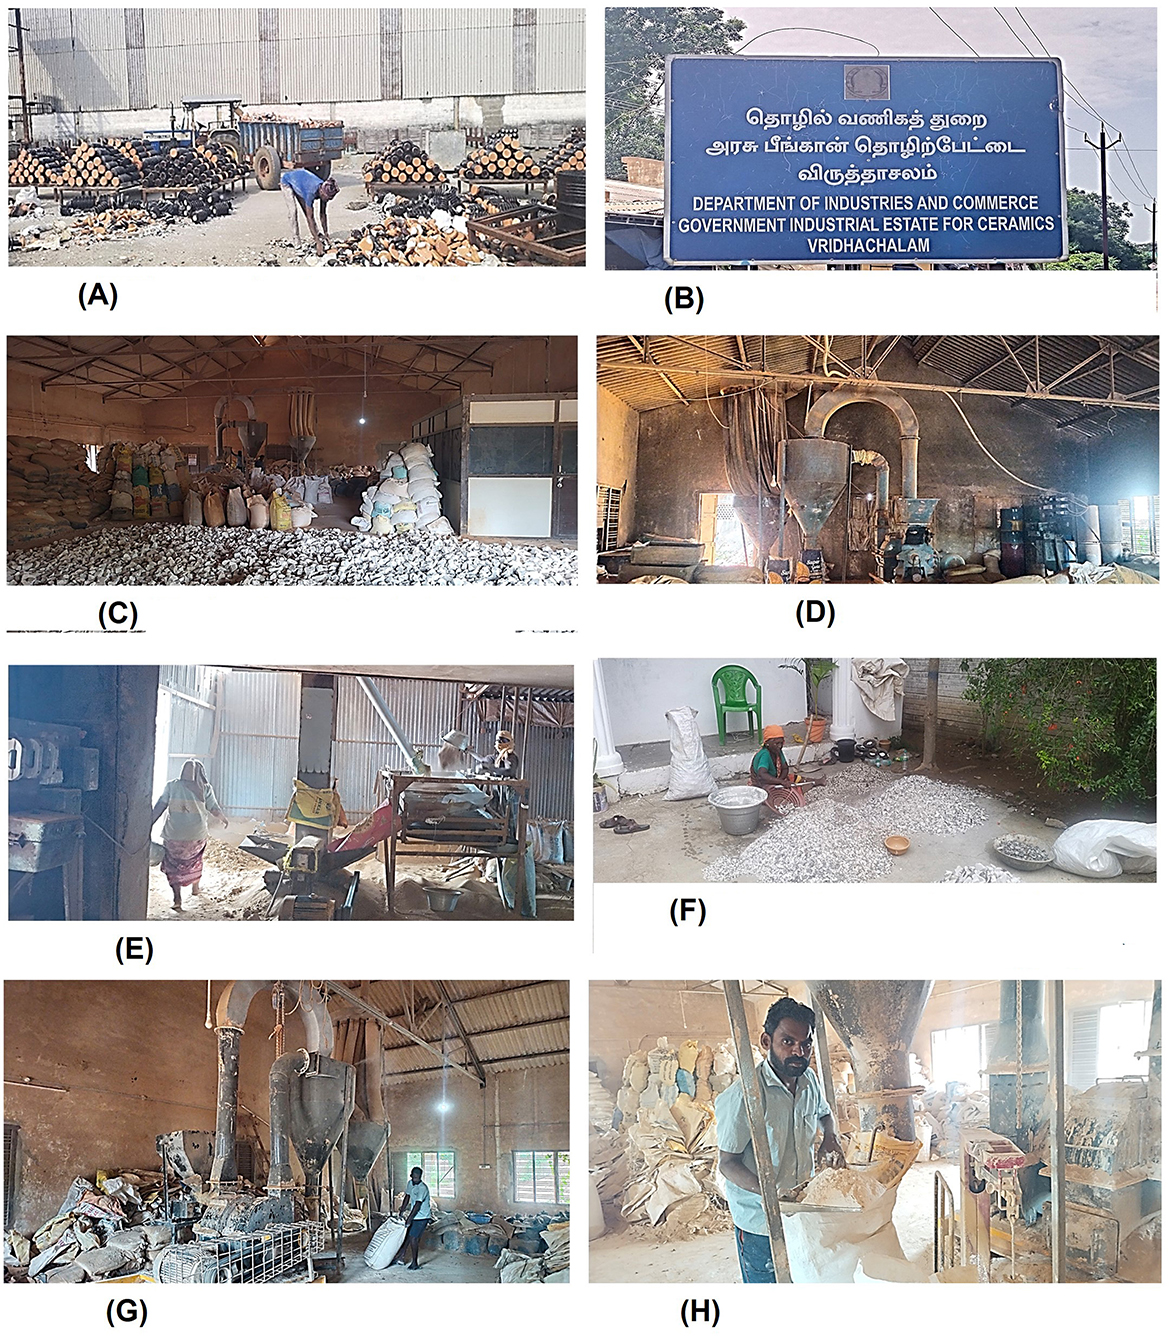
Figure 2. Insulator waste collection and concrete ingredients preparation. (A) Waste collection from industry. (B) Industrial estate for crushing. (C) Waste at crushing industry. (D) Crushing. (E) Sieving by sieve shaker. (F) Manually removing polished surfaces of insulator coarse aggregate. (G) Grinding insulator waste. (H) Prepared insulator powder.
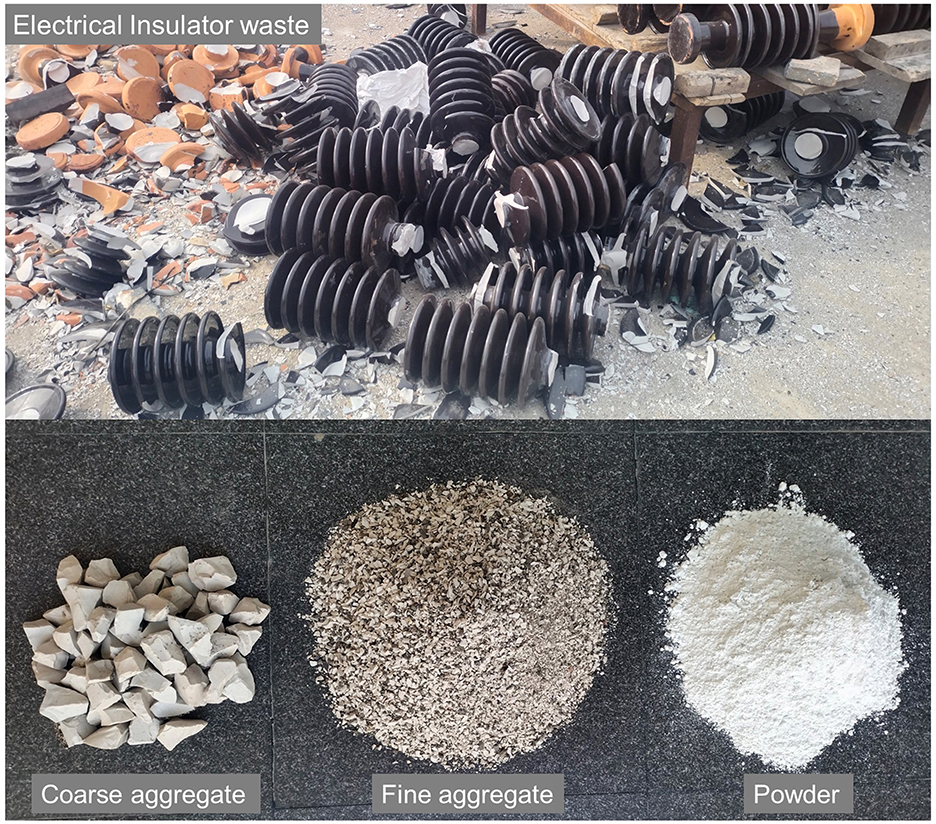
Figure 3. Insulator waste as a raw material for concrete.
3.2 Properties of insulator powder
The particle size of insulator powder and cement was analyzed using the Litesizer-500 instrument, Anton Paar GmbH, Graz, Austria. As illustrated in Figure 4A, the particle size in terms of hydrodynamic diameter of insulator powder is 52.72% smaller than cement, which fills the voids and offers a denser concrete by strengthening the Interfacial Transition Zone (ITZ).
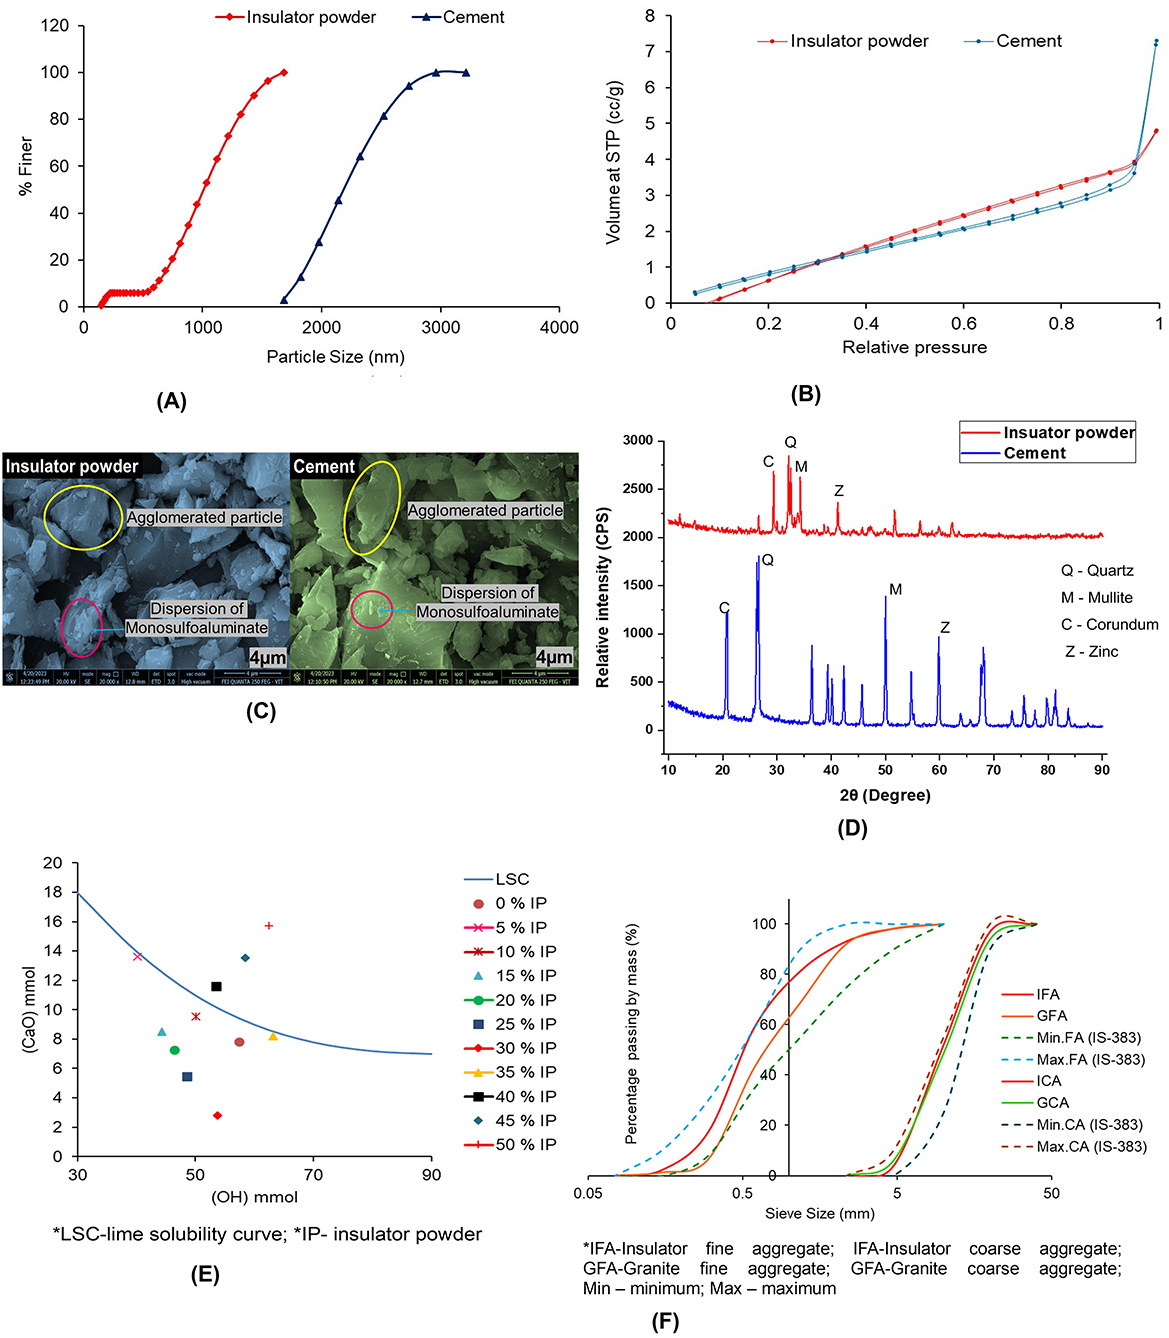
Figure 4. Material property images of insulator waste. (A) Particle size distribution. (B) Specific surface area. (C) SEM image. (D) XRD graph. (E) Frattini test graph. (F) Particle size distribution of aggregates.
The Specific surface area, Pore volume, and Pore diameter were analyzed using Brunauer–Emmett–Teller (BET) analysis. Figure 4B shows the relative pressure vs. volume of insulator powder and cement. The specific surface area of insulator powder and cement is 4.49 and 4.79 m2/g, respectively. Similarly, Jang and So (2015) found the specific surface area of insulator powder as 2.0118 m2/g; the variation in surface area depends on particle sizes obtained by grinding. The pore diameter of insulator powder and cement is 1.68 and 1.43 nm, respectively, which is 14.93% smaller than the cement. The pore volumes of insulator powder and cement are 0.011 and 0.013 cc/g, respectively. Similarly, Higashiyama et al. (2012) found that the pore volume of insulator powder ranged from 0.03 to 1.0 μm.
The specific gravity and density of the insulator powder were measured using a Le-Chatelier flask, with values of 2.70 and 2.64 g/cm3, respectively. The initial and final setting times of cement were measured with Vicat apparatus, Aimil Ltd., New Delhi, India as 55 and 325 min, respectively. A comparison between the properties of insulator powder and cement is presented in Table 1.
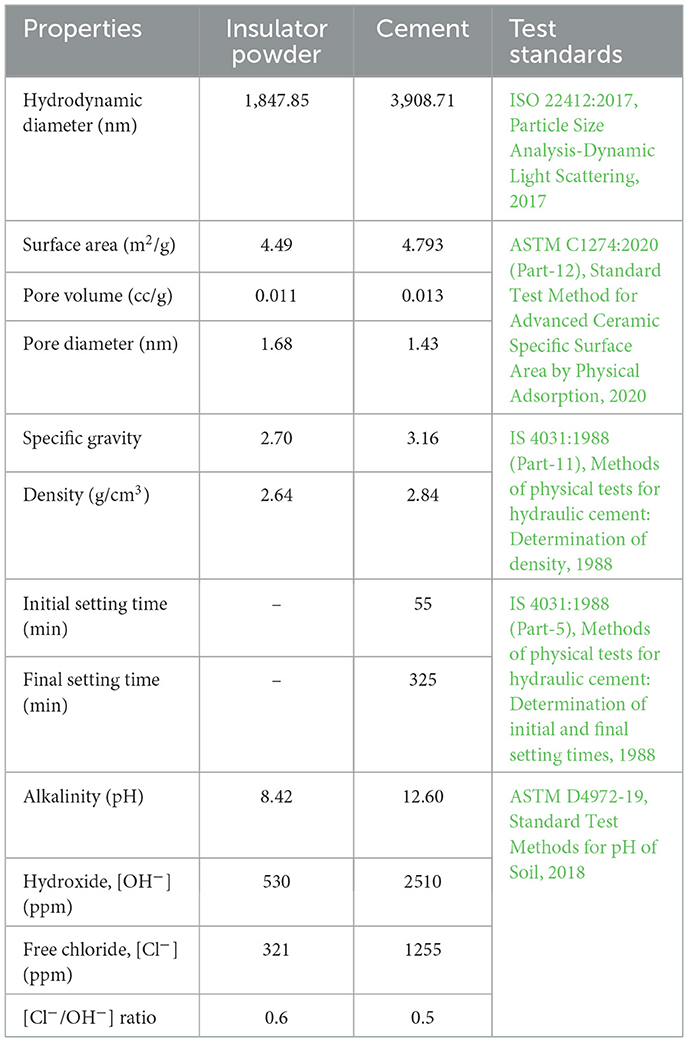
Table 1. Properties of insulator powder and cement.
3.2.1 Mineral composition
The crystal structure and mineral composition were found using X-ray diffraction (XRD) analysis in accordance with ASTM E3294 (Part-22), Standard Guide for Forensic Analysis of Geological Materials by Powder X-Ray Diffraction (2022). The XRD plot of the insulator powder and cement is shown in Figure 4D. The XRD files were analyzed using Xpert High Score Plus software to predict the International Center for Diffraction Data (ICDD) database. This is presented in Table 2. The primary mineral phases found in the insulator powder were highlighted in the XRD plot corresponding to 2θ position and maximum relative intensity of i = 100 counts per second (CPS). These identified crystalline peaks in insulator powder are responsible for pozzolanic reactions.
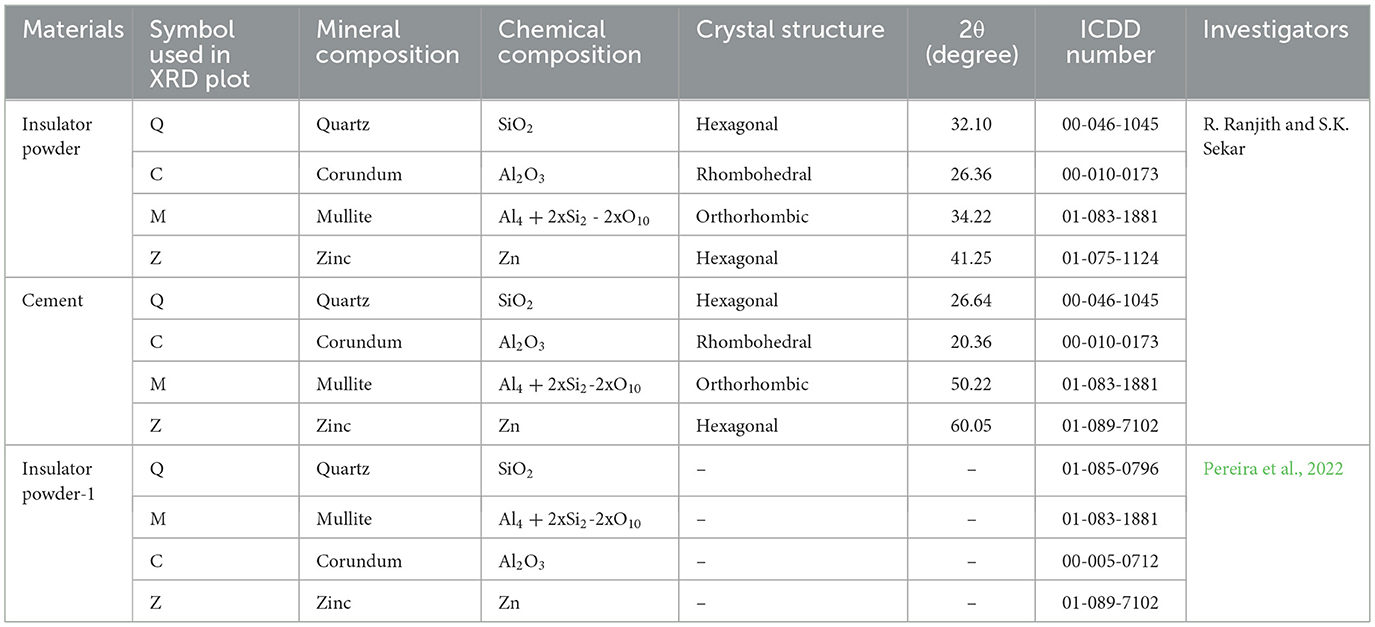
Table 2. Mineral compositions of insulator powder compared with earlier investigation.
3.2.2 Chemical composition
The chemical composition was found by X-ray fluorescence (XRF) analysis in accordance with ASTM E1621-(Part-22), Standard Guide for Elemental Analysis by Wavelength Dispersive X-Ray Fluorescence Spectrometry (2022). This is listed in Table 3. In accordance with ASTM C618 (Part-3), Standard Specification for Coal Fly Ash and Raw or Calcined Natural Pozzolan for Use in Concrete (2003), the sum of pozzolanic oxides [ΣP = (SiO2+ Al2O3 + Fe2O3)] of any powder material needs to be greater than 70% to use as cement replacement materials. In the current study, the presence of SiO2 (75.10%), Al2O3 (18.44%), Fe2O3 (1.92%), and ΣP (95.46%) conforms to the pozzolanic property of the insulator powder.
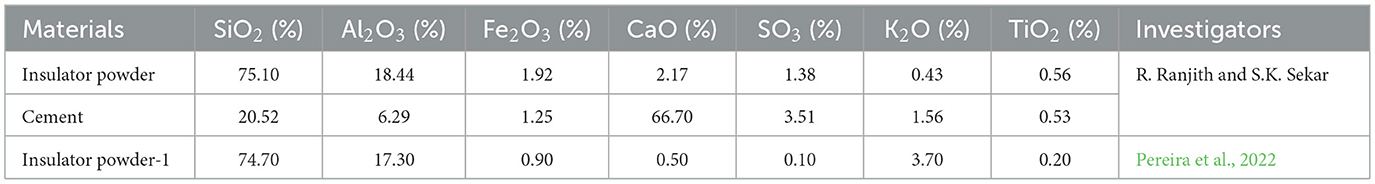
Table 3. Chemical compositions of insulator powder compared with earlier investigations.
3.2.3 Microstructure
Scanning Electron Microscope (SEM) analysis was used to study the microstructure in accordance with ISO 21383:2021, Qualification of the Scanning Electron Microscope for Quantitative Measurements (2021). The captured SEM images of insulator powder and cement are shown in Figure 4C. Both insulator powder and cement contain coarse angular, irregular particles that are intact with the aggregate surface and offer better bonds. The SEM findings demonstrate the existence of nano-particles (agglomerated and mono-sulfoaluminate phases) in insulator powder and cement at 4 μm magnification. Agglomerated particles and mono-sulfoaluminate phases, which are found in insulator powder, are similar to cement. Agglomerated particles in insulator powder are shown as accumulations of fine fragments that were sintered. Micropores of concrete are filled with fine agglomerates. Mono-sulfoaluminate is an alumino-ferrite monosulfate phase that can react during cement hydration. With reference to the relevant literature (Özkiliç et al., 2024; Tawfik et al., 2024; Ikotun et al., 2025), the microstructure morphology of ceramic waste powder shows angular and flaky particles, similar to the present study's SEM morphology. According to the study by Hashim et al. (2025), adding leftover ceramic tile to the cement matrix improves the microstructure of the concrete and facilitates the production of C-S-H gel. The mechanical characteristics of concrete are improved by this main hydration product.
3.2.4 Pozzolanic reaction
The pozzolanic reaction of insulator powder was found using the Frattini test in accordance with EN 196-(Part-5), Methods of testing cement: Pozzolanicity test for pozzolanic cement (2011). In accordance with the methodology employed in a study by Donatello et al. (2010), the test estimated for the hydroxyl ion [OH−], calcium oxide [CaO], and the removal of calcium oxide Δ[CaO]. The theoretical Max [CaO] and Δ[CaO] value was calculated using Equations 1, 2:
As shown in Figure 4E, 30% of cement replaced by insulator powder consumes more C-H to form a strong C-S-H gel, as evidenced by the maximum Δ[CaO] of 68.80%. Hence, 30% of insulator powder is considered the most appropriate ratio to replace the cement for the subsequent testing in the study. Similarly, Xu et al. (2021) used 20% ceramic tile powder to determine the Δ[CaO] to be 76.64%, while Kannan et al. (2017) found that pozzolanic reactions were obtained even with up to 40% replacement of ceramic tile powder in cement.
3.2.5 Alkalinity and soluble chloride content
The ratio of chloride to hydroxide (Cl−/OH−) of insulator powder is an essential measure of the corrosion rate of concrete. Since chlorides have the ability to disturb the alkaline insulating properties of concrete. The alkalinity and soluble chloride content were determined in accordance with ASTM D4972-19, Standard Test Methods for pH of Soil (2018). In accordance with the methodology employed in a study by Thangavel and Rengaswamy (1998), the test estimated and compared the alkalinity and free chloride contents of the insulator powder. Using Equation 3, the alkalinity measured as a measure of pH was translated into the equivalent, H+. Following that, OH− was computed in molarity using Equation 4 and subsequently converted to ppm. To get the Cl−/OH− ratio, the free chloride (Cl−) levels calculated by XRF analysis in terms of ppm were then divided by the corresponding OH−. The pH of the insulator powder and the Cl−/OH− ratio are presented in Table 1. The calculated Cl−/OH− ratio of insulator powder and cement was 0.6 and 0.5, respectively.
3.3 Properties of insulator aggregates
Table 4 lists the properties of aggregates. The particle size distribution of aggregates seen in Figure 4F resembles the graph drawn by using the maximum and minimum percentage passing for graded aggregates of nominal size. The sieve analysis of both insulator and granite fine aggregate conforms to grading zone-II in accordance with IS 383:2016, Specification for coarse and fine aggregates from natural sources for Concrete (2016), the percentage passing for the sieve designation ranges from 10 to 150 μm. At saturated surface dry conditions, the water absorption of insulator coarse and fine aggregates was 42 and 46% lower than that of granite coarse and fine aggregates, respectively. In a similar vein, it was found that the lowest water absorption of insulator coarse aggregate was 0.74 and 0.5%, according to a study by Senthamarai and Devadas Manoharan (2005). From the evaluated material properties, the findings revealed that the properties of insulator powder and aggregate were comparable to the properties of cement and granite aggregates, respectively. As a result, insulator waste is employed in concrete to determine the mechanical and microstructure properties of concrete.
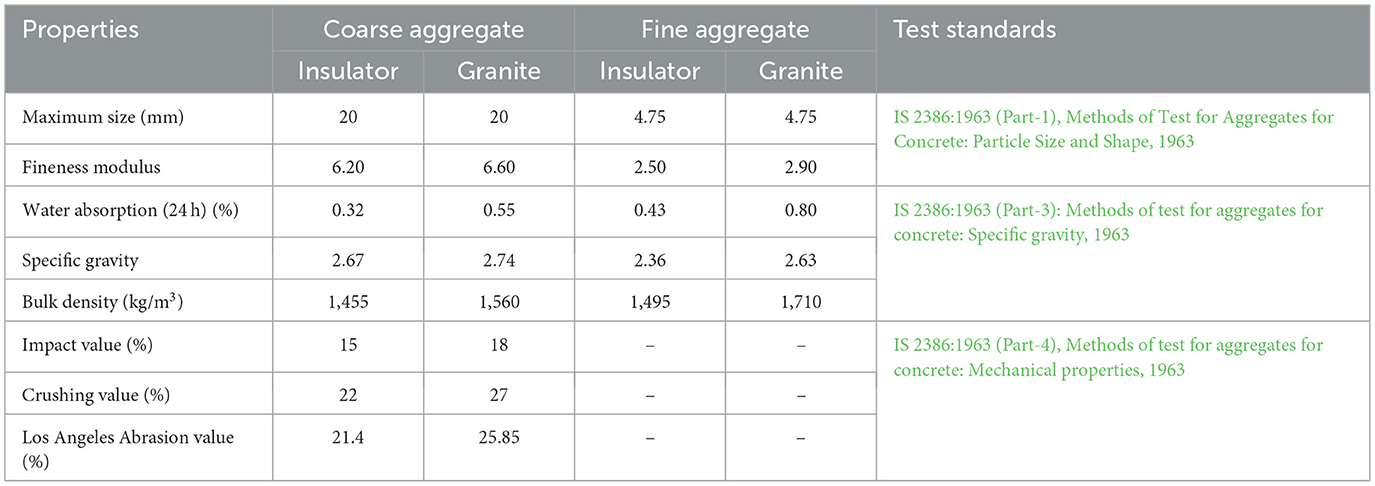
Table 4. Properties of insulator aggregate and granite aggregates.
3.4 Mix proportion
The mix proportion for the M50 grade of structural concrete was designed in accordance with IS 10262:2019, Concrete Mix Proportioning-Guidelines (Second Revision) (2019). Four different concrete mixes (M1, M2, M3, and M4) with different material combinations were prepared such as:
• M1 mix—made using cement and granite aggregates treated as the reference mix.
• M2 mix—cement alone is replaced by insulator powder.
• M3 mix—granite aggregates alone replaced by insulator aggregates.
• M4 mix—both cement and granite aggregates are replaced by insulator powder and insulator aggregates, respectively.
The quantity of materials used for mix proportions is given in Table 5, and the volume of concrete ingredients with a six-phase system of concrete matrix is shown in Figure 5. The study replaced 30% of the cement with insulator powder and 100% of the granite aggregates with insulator aggregates. Both insulator aggregates and granite aggregates were added to the concrete mix at a saturated surface dry condition. During the preliminary trials, it was found that a minimum of 162 l/m3 of operating water is needed for a 20 mm maximum size of insulator coarse aggregate in the presence of 2.92 l/m3 of SP. The optimum quantity of SP was found by trial at 0.65% of total binder to enhance the workability, with a constant water to binder (w/b) ratio of 0.36 maintained in each mix. In accordance with IS 10262:2019, Concrete Mix Proportioning-Guidelines (Second Revision) (2019), for the 20 mm nominal maximum size of insulator coarse aggregate and grading zone-II of insulator fine aggregate, the volume of coarse aggregate was chosen as 0.62. Therefore, the quantity of water, fine aggregate, and coarse aggregate was kept constant at 162 l/m3, 592 kg/m3, and 1,213 kg/m3, respectively, for all mixes, which is in accordance with the research study by Senthamarai and Devadas Manoharan (2005).
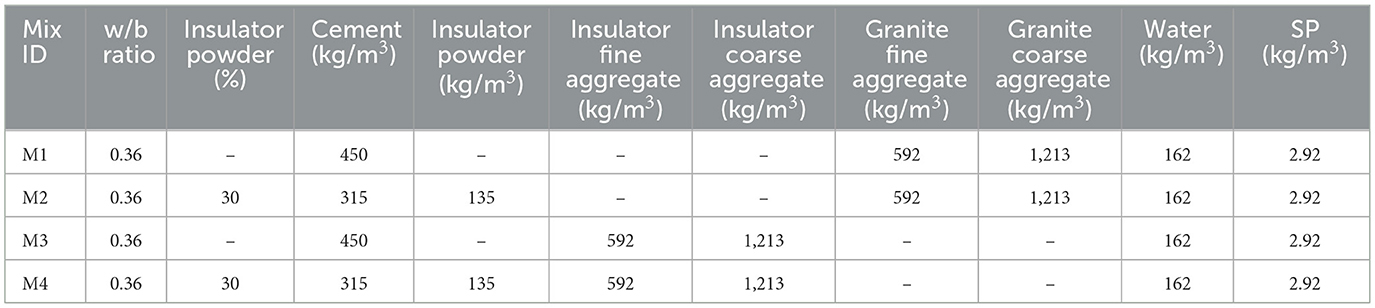
Table 5. Mix proportioning of insulator concrete.
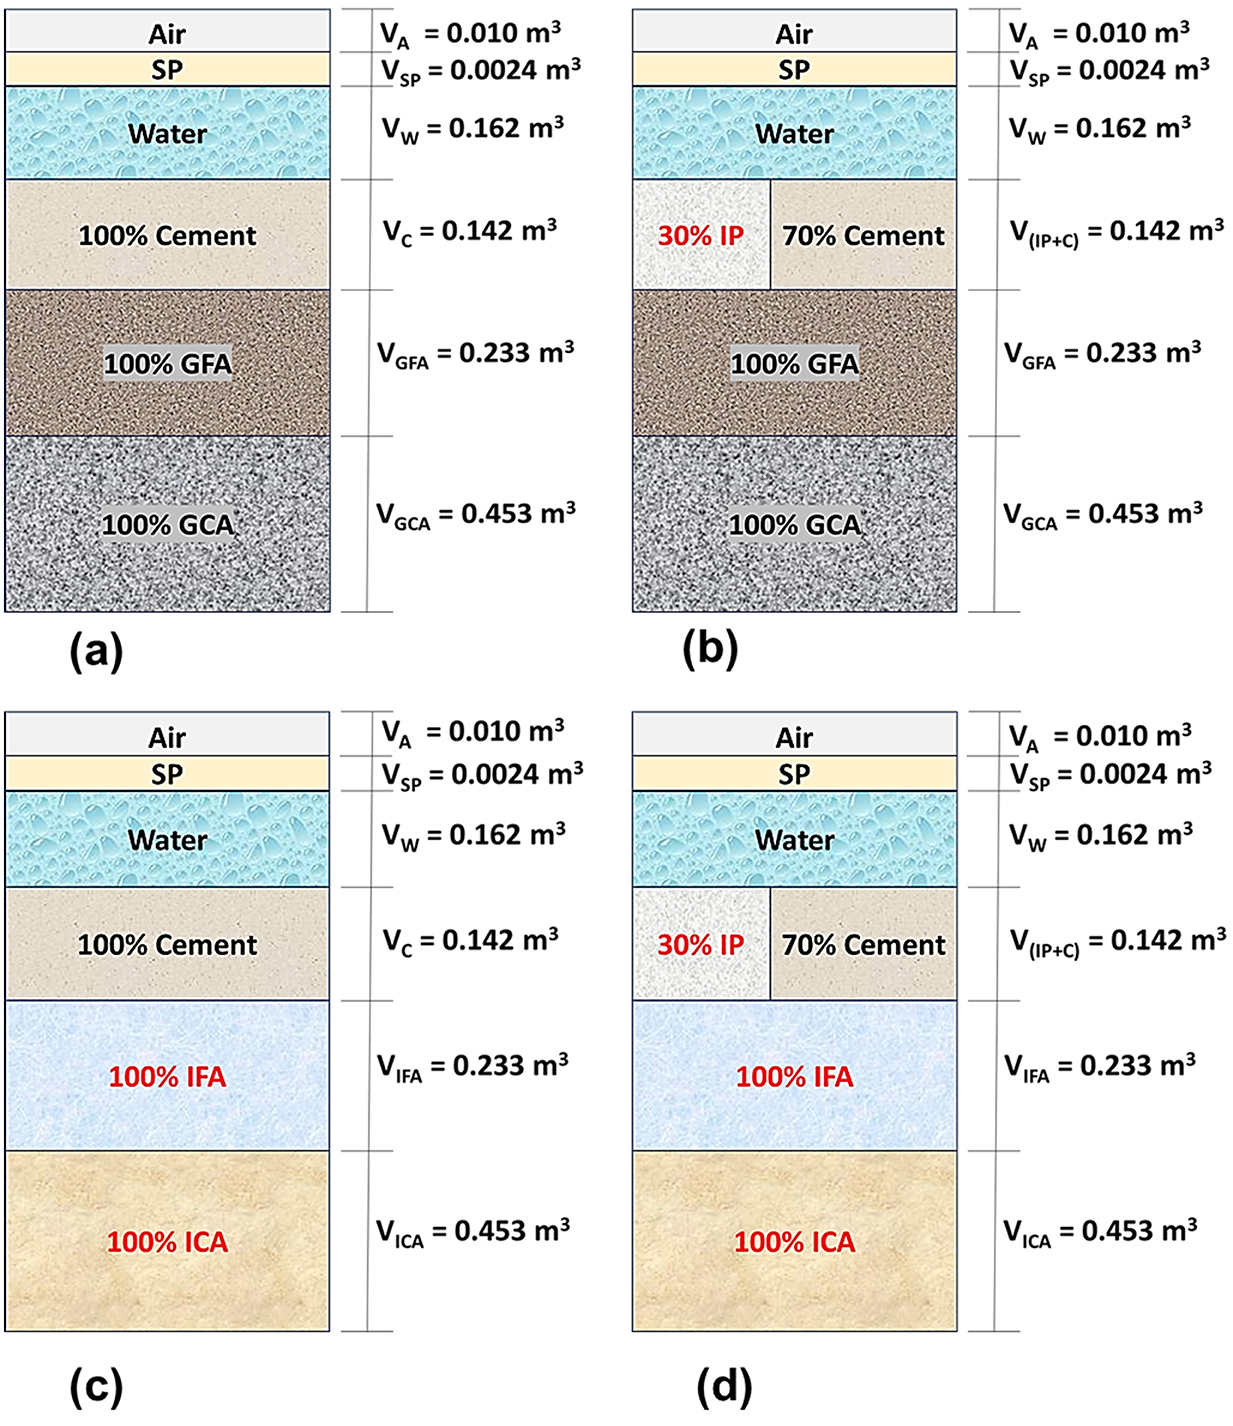
Figure 5. Six-phase system of insulator concrete mix. (a) Mix 1. (b) Mix 2. (c) Mix 3. (d) Mix 4. VA, volume of air; VSP, volume of superplasticizer; VW, volume of water; VC, volume of cement; VGFA, volume of granite fine aggregate; VGCA, volume of granite coarse aggregate; VIP, volume of insulator powder; VIFA, volume of insulator fine aggregate; VICA, volume of insulator coarse aggregate.
4 Experimental methodology
4.1 Physical properties of insulator concrete
4.1.1 Workability
Workability of concrete was assessed with the slump cone test in accordance with IS 7320:1974 (Reaffirmed 2008): Specification for concrete slump test apparatus (1974), using frustum cone. The settling of fresh concrete that occurred after the cone mold was removed has been noted as an indicator of concrete workability, as illustrated in Figure 6.
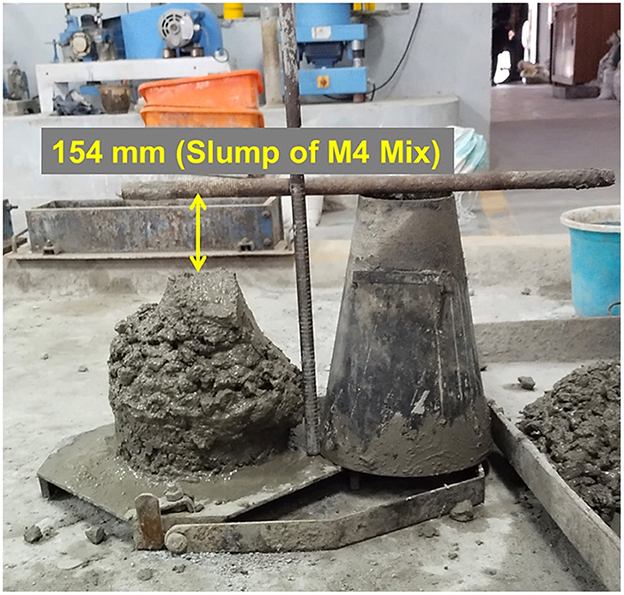
Figure 6. Slump test setup.
4.1.2 Fresh and hardened density
In accordance with IS 1199:2018 (Part-3): Methods of sampling testing analysis of concrete (2018), concrete density was measured in the plastic stage using Equation 5.
where WP is the density of concrete in plastic stage in (kg/m3); m1 is the mass of empty cylinder in (kg); m2 is the mass of cylinder with concrete in (kg); V is the volume of cylinder in (m3). Hardened density of concrete was calculated for cube specimens in accordance with IS 516:2004, Methods of Tests for Strength of Concrete (2004).
4.1.3 Alkalinity and soluble chloride content
The alkalinity and soluble chloride content of insulator concrete were determined using the same principle as described in Section 3.2.5.
4.2 Mechanical properties of insulator concrete
4.2.1 Compressive strength test
The test specimens from 28 days of water curing were taken out, and surface water was wiped from the specimens in accordance with IS 516:2004, Methods of Tests for Strength of Concrete (2004). A digital compression testing machine with a maximum capacity of 2,000 kN was used to test the compressive strength of cubes measuring 100 mm × 100 mm × 100 mm at a loading rate of 2.3 kN/s in accordance with IS 516:2004, Methods of Tests for Strength of Concrete (2004). The size of the cube specimen was chosen with reference to the nominal maximum size of coarse aggregate (20 mm) used in the present study, based on the reference of Senthamarai and Devadas Manoharan (2005). In accordance with Clause 2.8 of IS 516:2004, Methods of Tests for Strength of Concrete (2004), the size of the cube specimen shall be 100 mm × 100 mm × 100 mm if the largest nominal size of coarse aggregates used in the concrete is up to 20 mm. In accordance with IS 10262:2019, Concrete Mix Proportioning-Guidelines (Second Revision) (2019), the characteristic compressive strength of concrete (fck) was calculated from the experimental mean compressive strength.
4.2.2 Split tensile strength test
In accordance with IS 5816:1999, Method of Test for Splitting Tensile Strength of Concrete (1999) guidelines, a split tensile strength test was conducted with cylinder specimens of a size of 100 mm diameter and 200 mm length at a loading rate of 0.03 kN/s. The size of the cylinder specimen was chosen with reference to those in the study by (Senthamarai and Devadas Manoharan 2005). The split tensile strength was obtained by using
where ft is the split tensile strength in (MPa); P is the failure load in (N); l is the span of the cylinder in (mm); and d is the diameter of the cylinder in (mm). Using ACI 318 (Part-2), Building-Code-for-Structural-Concrete (2002), the split tensile strength is derived theoretically from the characteristic compressive strength of concrete to compare with experimental results.
4.2.3 Flexural strength test
The two-point loading test method was adopted for the flexural strength of a prism with a size of 100 mm × 100 mm × 500 mm. The test was conducted at a loading rate of 2.3 kN/s in accordance with IS 516:2004, Methods of Tests for Strength of Concrete (2004) and flexural strength is computed using
where fb is the flexural strength in (MPa); P is the failure load in (N); l is the span of the prism in (mm); b is the width of the prism in (mm); and d is the depth of the prism in (mm). The theoretical flexural strength is found in accordance with IS 456:2000, Plain and Reinforced Concrete – Code of Practice (2000) and ACI 318 (Part-2), Building-Code-for-Structural-Concrete (2002), and compared with experimental results.
4.2.4 Modulus of elasticity and Poisson's ratio
The modulus of elasticity and Poisson's ratio were evaluated with a cylinder of 150 mm diameter and 300 mm length using a compressometer and an extensometer by measuring linear and lateral strain, respectively. The experimental setup for the modulus of elasticity test is shown in Figure 7. Initial tangent modulus (dynamic modulus) was found from the slope of the stress–strain graph in accordance with IS 516:2004, Methods of Tests for Strength of Concrete (2004) and c.0 hord modulus (static modulus), as well as Poisson's ratio, calculated in accordance with ASTM C469 (Part-2), Standard Test Method for Static Modulus of Elasticity and Poisson's Ratio of Concrete in Compression (2009).
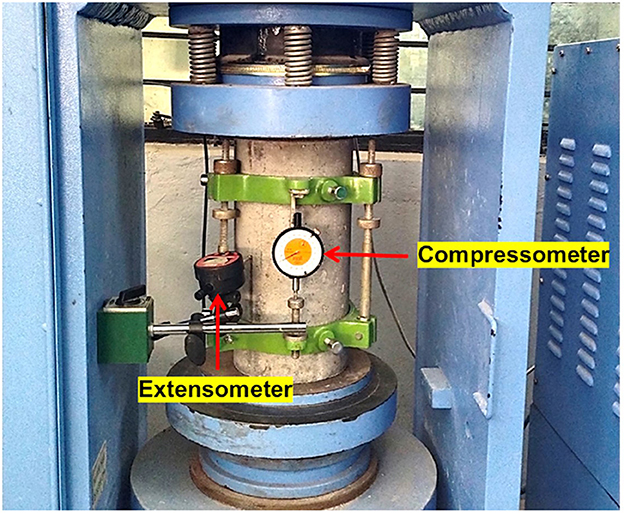
Figure 7. Modulus of elasticity test setup.
Using the relation dynamic modulus was found as
where Ed is the dynamic modulus in (GPa); dy is the vertical intercept of the initial tangent slope of stress–linear strain curve; and dx is the horizontal intercept of the initial tangent slope of stress–linear strain curve. The static modulus was found as
where Es is the static modulus in (GPa); S2 is the stress corresponding to 40% of ultimate load in MPa; S1 is the stress corresponding to linear strain (ε1) of 50 × 10−6; and ε2 is the linear strain corresponding to S2. The Poisson's ratio was measured as
where μ is the Poisson's ratio; εt2 and εt1 are the lateral strain corresponding to stress S2 and S1, respectively. The theoretical modulus of elasticity was derived in accordance with IS 456:2000, Plain and Reinforced Concrete – Code of Practice (2000) as well as ACI 318 (Part-2), Building-Code-for-Structural-Concrete (2002) standards and compared with experimental results.
4.2.5 Regression and statistical analysis of mechanical properties
A linear regression model was used to establish the relationship among the mechanical properties of concrete. Since variable parameters are included in Equation 11, it is recommended to use it as a regression model (Surendran and Akhas, 2024).
where X is the strength properties; αx is the coefficient of parameters; αo is the constant term; and ix parameter.
The uniformity of mechanical properties is better understood with the use of statistical analysis—coefficient of variation according to the study by Senthamarai and Devadas Manoharan (2005). Coefficient of variance was found as
where CV is the coefficient of variance; xi is the individual specimen strength; is the mean strength; n is the number of specimens. The number of test specimens used for each mix was (n = 6), and the average test results of six specimens were considered.
4.3 Microstructure analysis of insulator concrete
After assessing the mechanical properties of the insulator concrete, the tested samples were ground into a powder (passing a 90 μm sieve) for the subsequent microstructure analysis.
4.3.1 Scanning Electron Microscope (SEM) analysis
In accordance with ISO 21383:2021, Qualification of the Scanning Electron Microscope for Quantitative Measurements (2021), the microstructure and morphology of the hydrated insulator concrete sample were examined using the SEM (JSM-6510LV analyzer), JEOL Ltd., Tokyo, Japan.
4.3.2 X-ray diffraction (XRD) analysis
Crystal phases analyzed using a Philips Xpert-Pro PANalytical diffractometer, PANalytical B.V. (now Malvern PANalytical), Almelo, Netherlands in accordance with ASTM E3294 (Part-22), Standard Guide for Forensic Analysis of Geological Materials by Powder X-Ray Diffraction (2022).
4.3.3 Fourier Transform Infrared (FTIR) analysis
Chemical bond and its molecular group were identified using PerkinElmer spectroscopy in accordance with ASTM E1252:2021 (Part-98)Practice for General Techniques for Obtaining Infrared Spectra for Qualitative Analysis (2021).
4.3.4 Thermo-gravimetric analysis (TGA) and differential thermal analysis (DTA)
Existing chemically bound water and mineralogical phases of insulator concrete were analyzed using a PerkinElmer thermal analyzer, PerkinElmer Inc., Waltham, Massachusetts, USA in accordance with ASTM-C1872 (Part-24), Test Method for Thermogravimetric Analysis of Hydraulic Cement (2024). The hydration degree of insulator concrete can be found approximately using traditional cement chemistry
where Wb is the chemically bound water measured in terms of weight loss (%) from the thermo-gravimetric analysis (TGA) graph, and the number 23 denotes the chemically bound water content per 100 g of cement for the full hydration (Li et al., 2020).
4.4 3E analysis of insulator concrete
4.4.1 Embodied energy conservation (EEc), embodied CO2 emission (ECO2e) reduction, and economic benefit (Eb)
Each concrete mix was compared in terms of embodied energy (EEc), embodied CO2 emission (ECO2e), and economic benefit (Eb). Data for EEc and ECO2e analyses were taken from the literature of the study by Siddique et al. (2019). The insulator waste from the manufacturing industries was freely accessible in India. For this study, however, the cost of insulator waste processing was estimated to be the equivalent of ₹2 per kg. Based on the current market price at the local project location (cement ₹350 per bag, coarse and fine aggregates ₹3 per kg), the cost analysis is accomplished.
4.4.2 Sustainability index (SI)
The electrical energy consumption of the insulator powder blended cement is calculated from Equation 14 (Madlool et al., 2011), as expressed in the following, when n% of the cement is substituted with the insulator waste:
where Et is the total energy consumption of the blend cement; Egri, c is the grinding energy consumption of cement clinkers; and Egri, ip is the grinding energy consumption of insulator powder. To forecast how much energy solid grinding will require, a power equation was used (Tokyay, 1999) as follows:
In India, in 2050, the specific electrical energy consumption of cement production will be Ec = 70 kWh/t (Energy Benchmarking for the Indian Cement Industry, 2021). The energy-saving efficiency function (ψ) can be calculated by
The Sustainability Index (SI) can be calculated by
5 Results and discussion
5.1 Hydration mechanism of insulator concrete
As the schematic diagram in Figure 8 illustrates, the early hydration process of insulator powder with cement in concrete leads to the formation of Calcium Silicate Hydrate (C-S-H) gel, Calcium Aluminate Silicate Hydrate (C-A-S-H) gel, Calcium Hydroxide (C-H), and Calcium Metasilicate (CaSiO3) in the final stage with reduced porosity. The greater Silica (SiO2) and Alumina (Al2O3) content of insulator powder enhanced early age strength. To maintain a low water-to-cement ratio, SNF was used to increase the hydration component of CaSiO3, which in turn boosted the strength of the concrete during the hardened stage through a subsequent pozzolanic reaction. In accordance with BS 5075:1985 (Part-3), Concrete admixtures: Specification for superplasticizing admixtures (1985), SNF acts as a dispersing agent without directly reacting with cement in a stoichiometric manner to produce new hydration products, but accelerates the workability.
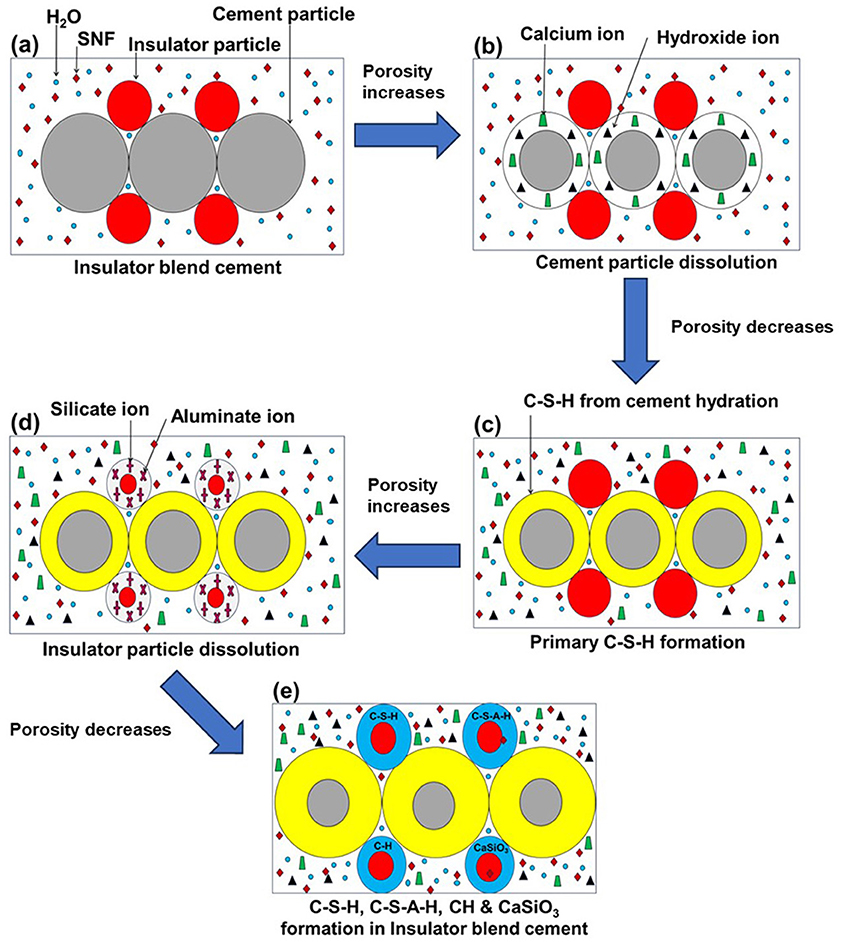
Figure 8. Hydration process of insulator concrete. (a) Insulator blended cement. (b) Cement particle dissolution. (c) Primary C-S-H formation. (d) Insulator particle dissolution. (e) C-S-H, C-S-A-H, C-H, & CaSiO3 formation in insulator blended cement.
5.2 Reaction chemistry of insulator concrete
The presence of silica (SiO2) and alumina (Al2O3) in the ceramic powder enhances the hydration process of concrete by the consumption of C-H and additionally produces hydration products like calcium metasilicate (CaSiO3) (Li et al., 2019). When C3S and C2S interact with water (H2O), tricalcium silicate dissolves in the first few seconds, but the rate of dissolution rapidly drops before saturation (Bullard et al., 2011). Calcium Hydroxide (C-H) and Calcium Silicate Hydrate (C-S-H) gel are produced in the hydration of C3S (Hewlett, 1935) as indicated in Equation 18. Similar to C3S, dicalcium silicate has a slower rate of hydration as given in Equation 19. Ettringite (3CaO·Al2O3·3CaSO4·32H2O) is formed when tricalcium aluminate (C3A) is hydrated in the presence of gypsum (calcium sulfate) and water, as shown by Equation 20. Gypsum and tetra calcium aluminoferrite (C4AF) react to consume calcium hydroxide, which is produced when C3S and C2S are hydrated (Papadakis et al., 1991) as given in Equation 21. The chemical reaction for the replacement of cement with insulator powder is as follows:
5.3 Physical properties of insulator concrete
5.3.1 Workability
The slump value of insulator concrete is given in Table 6. The slump value of insulator concrete mixes M2, M3, and M4 was 2.47%, 1.35%, and 4%, higher than reference concrete mix M1, respectively, which is due to the minimum water absorption of insulator fine (0.32%) and coarse aggregates (0.43%) compared to granite aggregates. The smaller particle size of insulator powder (52.72%) compared to cement increases the consistency of fresh concrete.
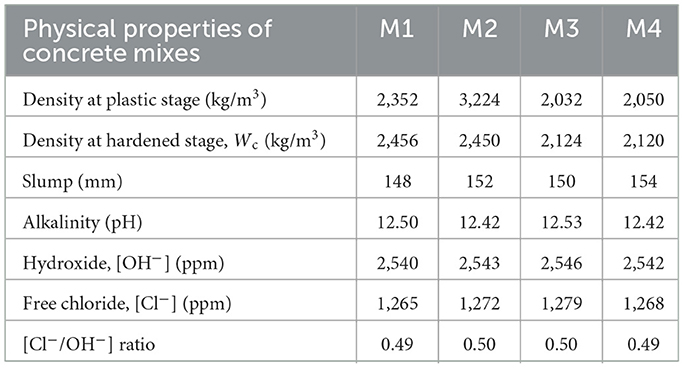
Table 6. Physical properties of insulator concrete.
5.3.2 Fresh and hardened density
The density of insulator concrete is given in Table 6. The density of insulator aggregates is around 13% less than that of granite aggregates, which is directly reflected in the density of concrete, as the plastic and hardened density of insulator aggregate concrete (M2 and M4 mixes) decreased by about 13% compared to granite aggregate concrete (M1 and M3 mixes). Similarly, the fresh density of insulator aggregate concrete is reduced to 12% according to the study by Gharibi et al. (2022).
5.3.3 Alkalinity and soluble chloride content
The pH value and Cl−/OH− ratio of insulator concrete were given in Table 6. The calculated Cl−/OH− ratio of insulator concrete mixes was less than the value of 0.6, which defines the corrosion resistance of insulator concrete. The Cl−/OH− ratio of about 0.9 to 2.89 represents a critical level where corrosion is likely to begin, despite variations in the exact threshold (Thangavel and Rengaswamy, 1998).
5.4 Mechanical properties of insulator concrete
5.4.1 Compressive strength
The compressive strength results of insulator concrete mixes are given in Table 7, and comparing the M4 mix with the other remaining mixes, a significant improvement in compressive strength has been observed. The maximum compressive strength of 65.45 MPa was achieved for the M4 mix. It shows that the bond between insulator binder and filler materials is better compared to cement binder and granite fillers in the presence of SP because of CaSiO3 formation in addition to the volatilization of SiO2 with Al2O3 as demonstrated in Section 5.1. The average increase in cube compressive strength of M2 mix and M4 mix, was 9.13 and 9.92%, respectively, when compared to M1 mix, and there is no considerable strength difference between M3 mix (insulator aggregate concrete) and M1 mix (granite aggregate concrete). This shows that due to similar strength properties of insulator aggregate and granite aggregate, the corresponding mechanical properties of concrete were also similar. The insulator powder present in the M2 and M4 mixes improves their strength by reducing the amount of ettringite (Aft) while increasing the density of the C-S-H gel through a subsequent reaction as evidenced from XRD plot. The hardened insulator matrix concrete (M2, M3, and M4 mixes) were inhibited in-depth core concrete damage at higher stress level due to enhanced confinement effect compared to reference concrete (M1 mix) as displayed in the failure pattern of cubes in Figure 9.
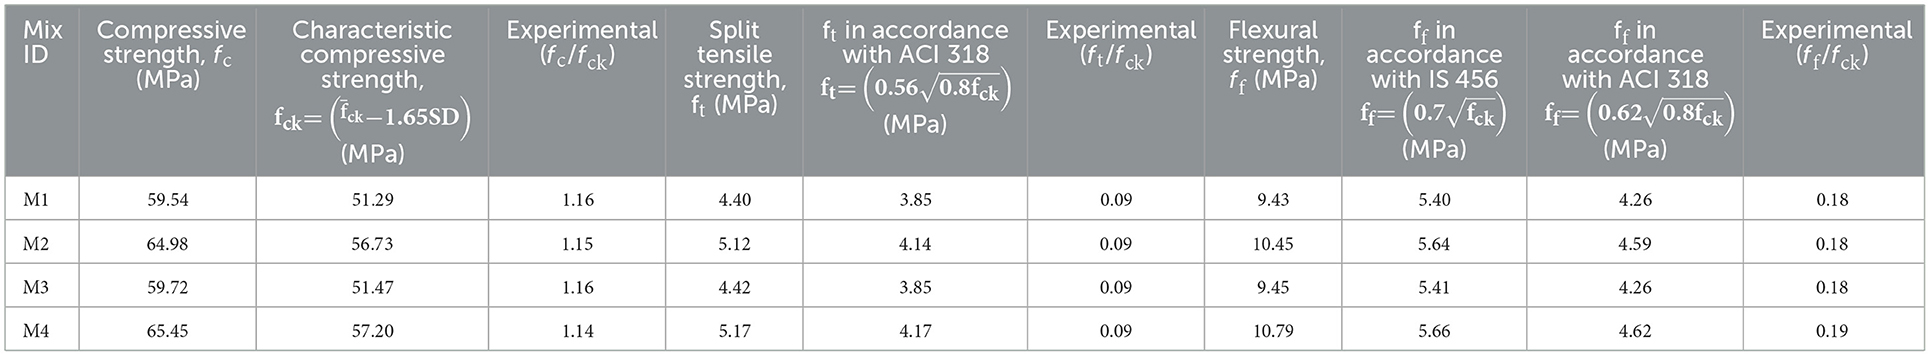
Table 7. Compressive strength, split tensile strength, and flexural strength of insulator concrete.
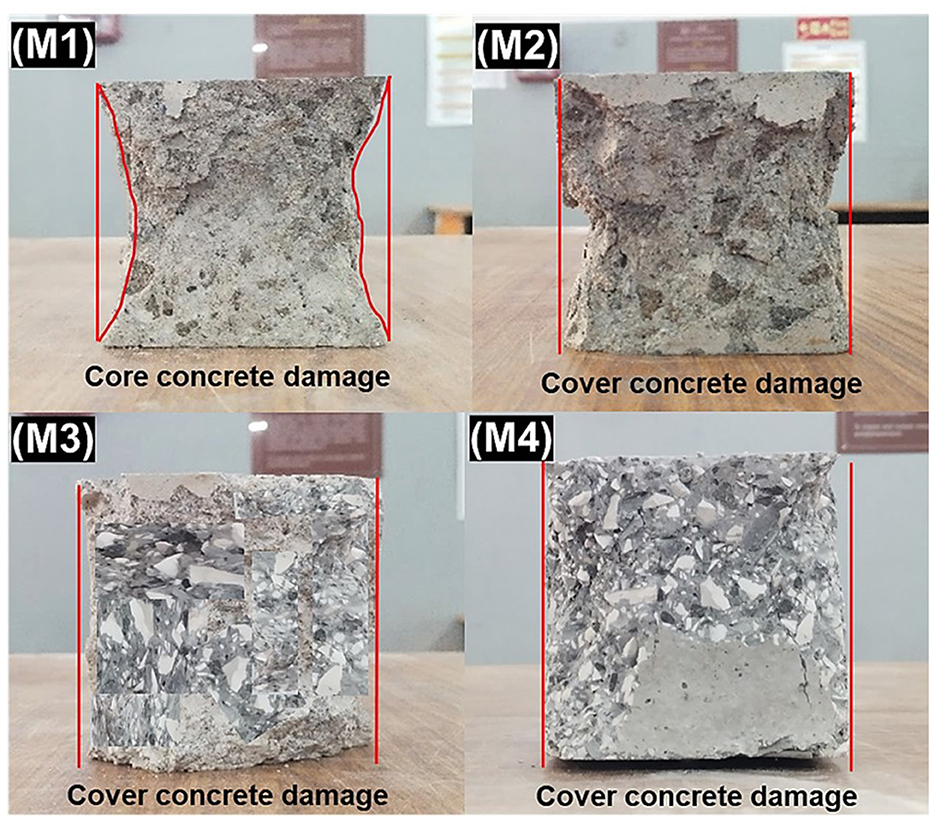
Figure 9. Failure pattern of insulator concrete cubes.
5.4.2 Split tensile strength
The split tensile strength results of insulator concrete mixes are given in Table 7. The average increase in split tensile strength of M2 and M4 mixes was 16.36 and 17.50%, respectively, when compared to the M1 mix. The ratio in accordance with ACI 318 (Part-2), Building-Code-for-Structural-Concrete (2002) suggested a theoretical split tensile strength to experimental split tensile strength of insulator concrete ranged from 0.8 to 0.87. The SEM images depict that the inclusion of insulator powder improved the cementitious matrix's bonding effect by patching pores and reducing microcracks in the concrete's ITZ structure with C-S-H gel, which improved the concrete core structurally. Senthamarai and Devadas Manoharan (2005) found the split tensile strength range of insulator coarse aggregate concrete was 3.2M−4.3 MPa, and the present study's split tensile strength was 12.95% more than this result.
5.4.3 Flexural strength
The flexural strength results of insulator concrete mixes are given in Table 7. The maximum flexural strength of 10.79 MPa was attained by the M4 mix. The average increase in flexural strength of M2 and M4 mixes was 10.81 and 14.42%, respectively, when compared to the M1 mix at 28 days. Similarly, Xu et al. (2021) studied that the flexural strength of 14.77–18.68 MPa was attained by ceramic tile waste powder using ultra-high-performance concrete at 28 days of curing. As the pozzolanic reaction develops, the pore size of the insulator powder decreases, forming stronger C-S-H, which may be the reason for the rise in flexural strength. Cracking at insulator aggregate and cement matrix surfaces was shown to be the failure system rather than insulator aggregate fracture. According to the study by Xu et al. (2021), the ratios of flexural strength to compressive strength of concrete ranged from 0.096 to 0.141. This indicates that, as compared to the reference concrete (M1 mix), a significant flexural strength was attained by insulator concrete.
5.4.4 Modulus of elasticity and Poisson's ratio
The compressive stress vs. lateral and linear strain behavior of insulator concrete under uniaxial compression is shown in Figure 10. Lateral and linear strain calculated at 40% of ultimate load for the calculation of static modulus and Poisson's ratio in accordance with ASTM C469 (Part-2), Standard Test Method for Static Modulus of Elasticity and Poisson's Ratio of Concrete in Compression (2009). The modulus of elasticity and Poisson's ratio of insulator concrete are given in Table 8. The dynamic modulus of insulator concrete is higher than that of reference concrete because the linear strain is higher at failure, as shown in Figure 10. The average increase in dynamic modulus of M2, M3, and M4 mixes was 3.75, 2.24, and 8.31%, respectively, when compared to M1 mix, which is better than insulator aggregate concrete's modulus of elasticity (Senthamarai and Devadas Manoharan, 2005). The modulus found by performing the experiment is higher than the value found as suggested in IS 456:2000, Plain and Reinforced Concrete – Code of Practice (2000) and ACI 318 (Part-2), Building-Code-for-Structural-Concrete (2002). Similarly, the modulus of elasticity of concrete increases by 26.9% when tile waste is used (Anderson et al., 2016). These results suggest that the insulator waste effectively supports stresses equivalent to those of reference materials. The difference in static modulus of insulator concrete mixes was 11% when compared to the M1 mix. The dynamic modulus of insulator concrete mixes M1, M2, M3, and M4 was 39.29%, 29.72%, 43.30%, and 35.13% higher than the static modulus, respectively. Similarly, the dynamic modulus of basaltic aggregate concrete was 28% higher than the static modulus (Thomaz et al., 2021).
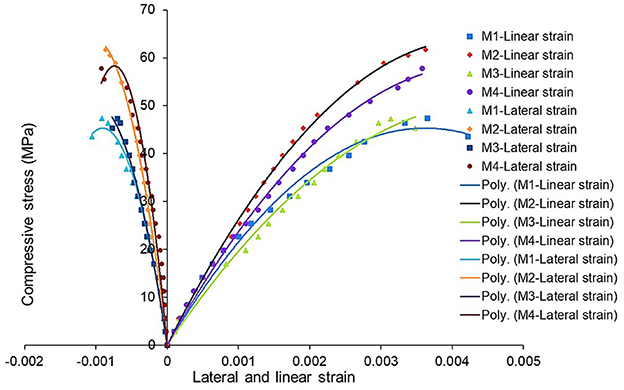
Figure 10. Stress and strain graph of insulator concrete.
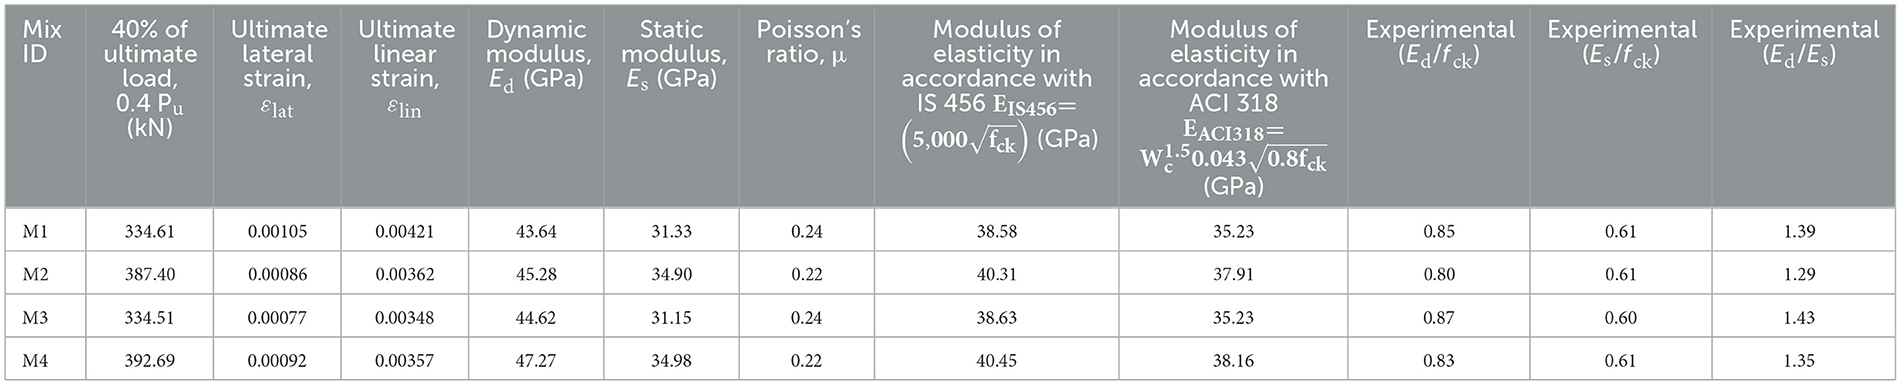
Table 8. Modulus of elasticity and Poisson's ratio of insulator concrete.
Compared to reference concrete, insulator concrete has better stress–strain performance. The maximum linear and corresponding lateral strain at failure were found as 0.00362 and 0.00086, respectively, for M2 mix under uniaxial compression, which is 14% less than the reference mix M1. Experimentally measured lateral strain is 44.75% is higher than the maximum permissible compressive strain of 0.002 as suggested in IS 456:2000, Plain and Reinforced Concrete – Code of Practice (2000). The Poisson's ratios of M1, M2, M3, and M4 mixes were found to be 0.24, 0.22, 0.24, and 0.22, respectively. Similarly, the Poisson's ratio of insulator aggregate geopolymer concrete ranged from 0.23 to 0.27 (Naenudon et al., 2023).
5.4.5 Regression coefficient (R2) and coefficient of variance (CV) of mechanical properties
The correlation among the mechanical properties of M50 grade insulator concrete was evaluated using the regression analysis shown in Figure 11. Based on the results of the linear regression study, the correlation Equations 22–25 were developed among the mechanical properties of insulator concrete with respect to compressive strength of concrete.
Correlation graphs demonstrate a regression coefficient (R2) between compressive strength and split tensile strength, flexural strength, dynamic modulus, and static modulus were 0.99, 0.98, 0.99, and 0.99, respectively. The calculated statistical analysis report is given in Table 9. The predicted CV is less than 5% and R2 is more than 0.98, showing that the results are more acceptable. The present study mechanical properties of insulator concrete mixes were compared (Naenudon et al., 2023) as given in Table 10. Based on the comparison, the results of the present study were consistent. A more precise determination of the mean concrete strength was obtained when the sample size is significantly considerable (n = 6), which reduces the standard error. More consistent and stable concrete mechanical properties are indicated by a smaller coefficient of variation (less than 5%), as seen in Table 9. Concrete strength attained by a greater sample size to obtain a comparable limit of variability and confidence level (more than 95%) has a standard deviation of less than 1, as shown in Table 9.
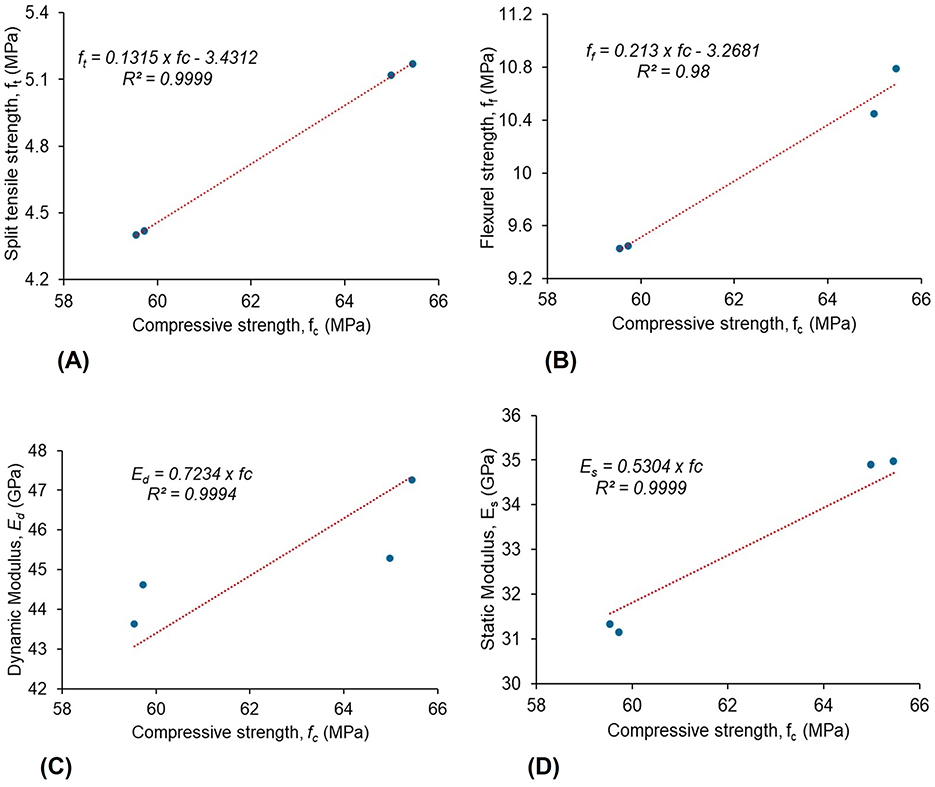
Figure 11. Correlation of mechanical properties of insulator concrete. (A) Correlation between fc and ft. (B) Correlation between fc and ff. (C) Correlation between fc and Ed. (D) Correlation between fc and Es.
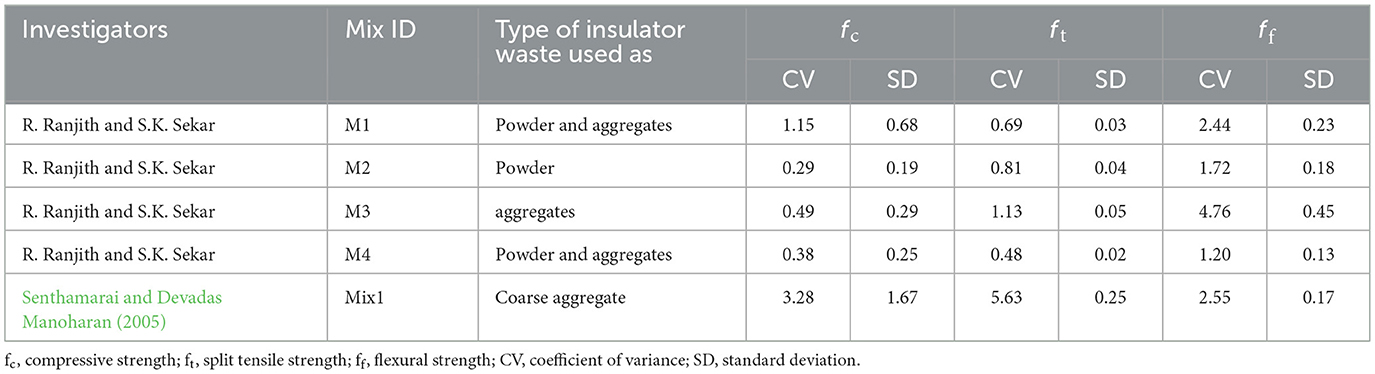
Table 9. Statistical analysis report on the mechanical properties of insulator concrete.
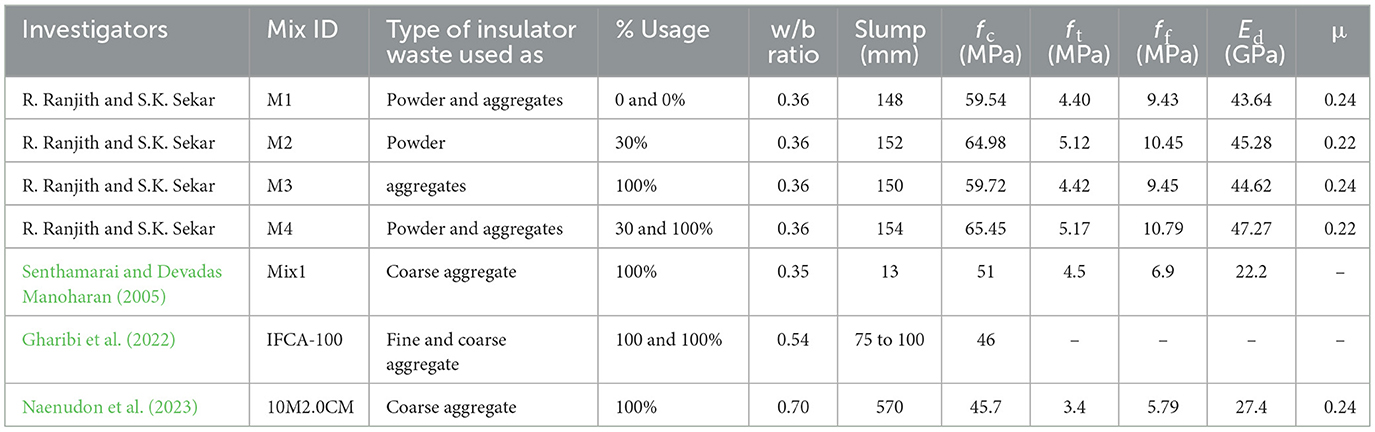
Table 10. Comparison of mechanical properties of insulator concrete with earlier investigations.
As far as mechanical properties are concerned, the basic trend in strength enhancement of insulator concrete mixes lies in the order of (M4 > M2 > M3 > M1). The mechanism for the strength attainment of insulator concrete is given in Table 11.
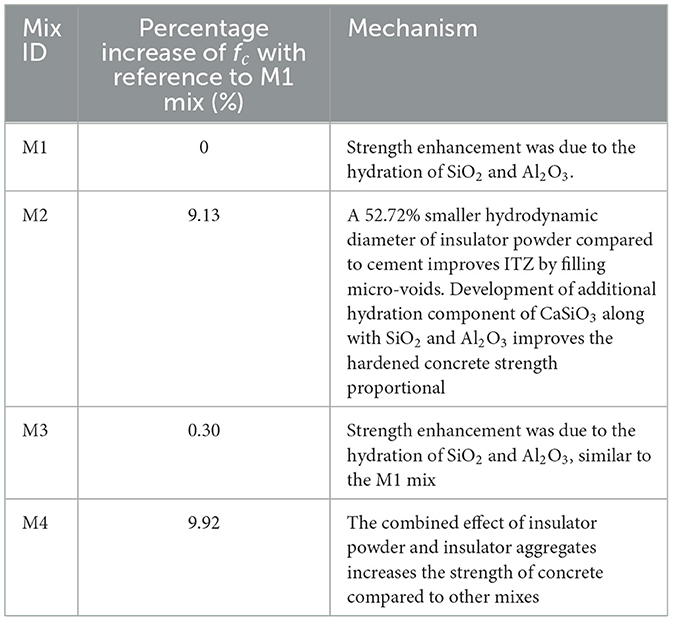
Table 11. Mechanism for the strength attainment of insulator concrete.
Concrete mix with insulator powder (M2 and M4 mixes) is significantly increased from the reference concrete (M1 mix). However, there is no considerable variation between insulator aggregate concrete mix (M3) and reference concrete mix (M1), which shows that insulator aggregate concrete behaves on par with granite aggregate concrete by the similar strength properties of aggregate as given in Table 4. The strength of concrete is unaffected by the slipping action generated by the smooth surface of insulator aggregate particles. This suggests that when cracks occur in the ITZ when the applied stress exceeds resistance, crack initiation prevents the aggregates separating from the paste, resulting in the insulator aggregate in concrete failing at loads similar to M1 mix.
5.5 Microstructure of insulator concrete
5.5.1 Micromorphology phases
SEM images show the existence of ITZ and portlandite crystal phases in Figure 12. The microstructure of the insulator concrete mix (M2 and M4) is similar to the granite aggregate concrete mixes (M1 and M2). In the ITZ between the aggregate and cement paste interface, portlandite crystals were found. These crystals are larger than 10 μm, as found in many types of concrete SEM images (Huseien et al., 2020). Portlandite crystal depicts the accumulations of small fragments that were sintered with molecular compounds in all the mixes, as shown in Figure 12. The molecular compounds of C-A-S-H, C-S-H, C-H, and Aft were identified from XRD images using X'pert High Score Plus software at corresponding 2θ ranges, where the maximum peak of relative intensity was observed. The C-S-H and C-H gel sintering in the insulator concrete SEM images were similar to the SEM images of ceramic aggregate concrete studied (Juan-Valdés et al., 2018). Micropores of concrete are filled with fine agglomerates that react during cement hydration. Substitution of 30% insulator powder in concrete has increased strength by minimizing the porosity and increasing the molecular bond. Similarly, porosity of concrete is minimized with 10%−50% ceramic powder substitution for cement according to the study by Huseien et al. (2020). The high rate of ceramic powder use in concrete leads to an increase in gel formation and influences the strength of the C-S-H phase (Patankar et al., 2014). The insulator powder produces C-S-H gels, which improve the matrix binding of ITZ by using CH.
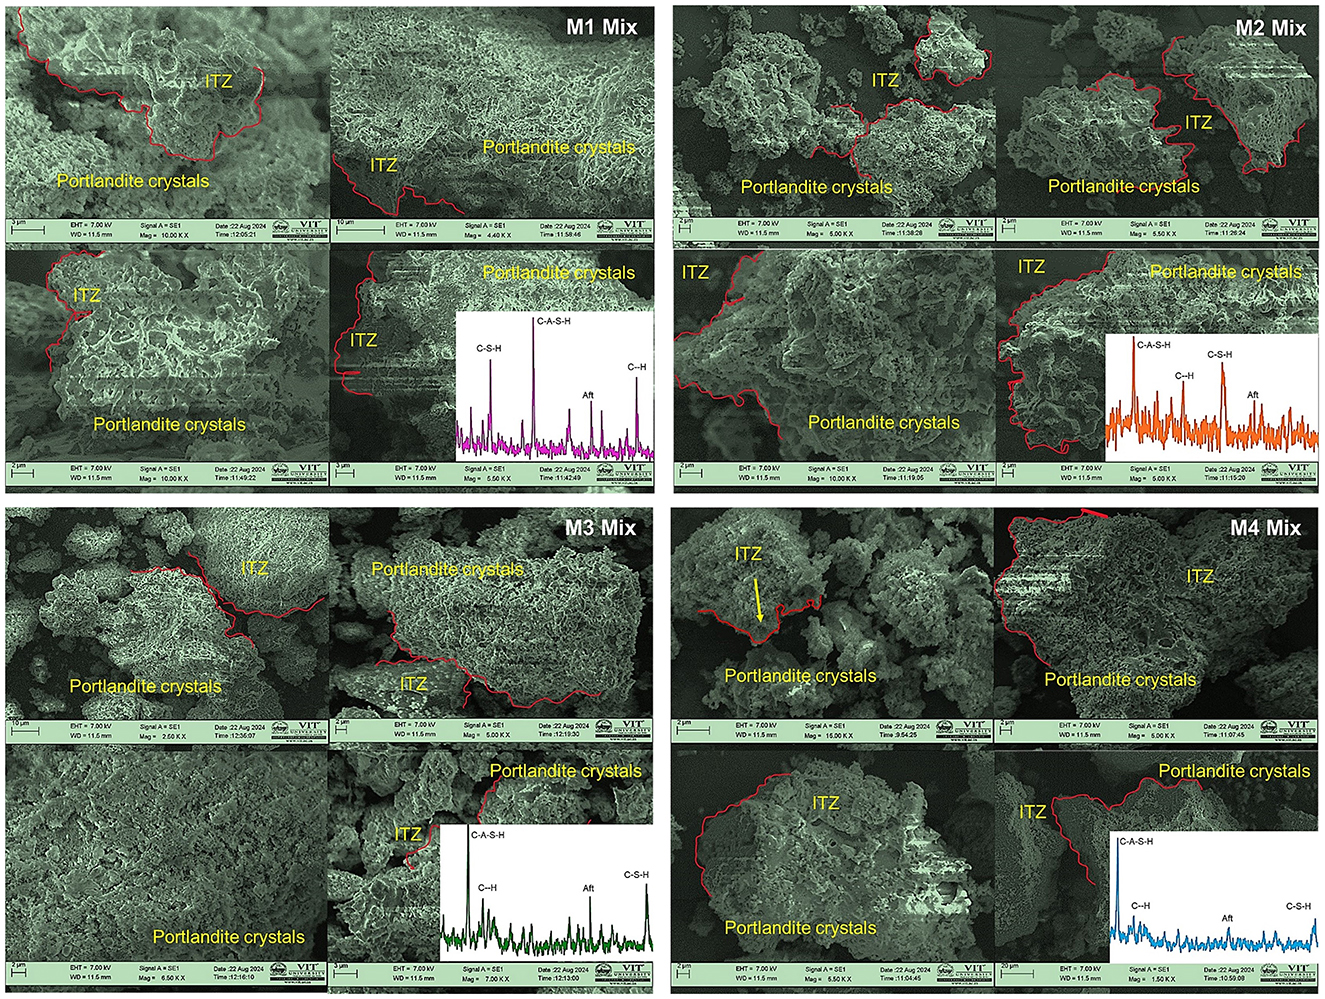
Figure 12. Micromorphology of insulator concrete mixes.
5.5.2 Crystal phases
Figure 13 shows the XRD graph of insulator concrete mixes after 28 days of hydration with the 2θ range from 20° to 40°, where the maximum peak of relative intensity was observed. The identified molecular group of hydrated insulator concrete mixes is given in Table 12. The identified mineral phases were as follows: Calcium Aluminate Silicate Hydrate (C-A-S-H) gel, Calcium Silicate Hydrate (C-S-H) gel, Calcium Hydroxide (portlandite) C-H, Calcium Aluminate Sulfate Hydrate (ettringite) AFt. The rise in intensity, which is seen at smaller angles (i.e., as the amorphous condition disappears), clearly indicates that the crystalline size has grown in the M2 and M3 mixes compared to the M1 mix. As seen in Figure 13, it was found that the intensity peak of C-H for all of the mixes was reduced compared to the M4 mix.
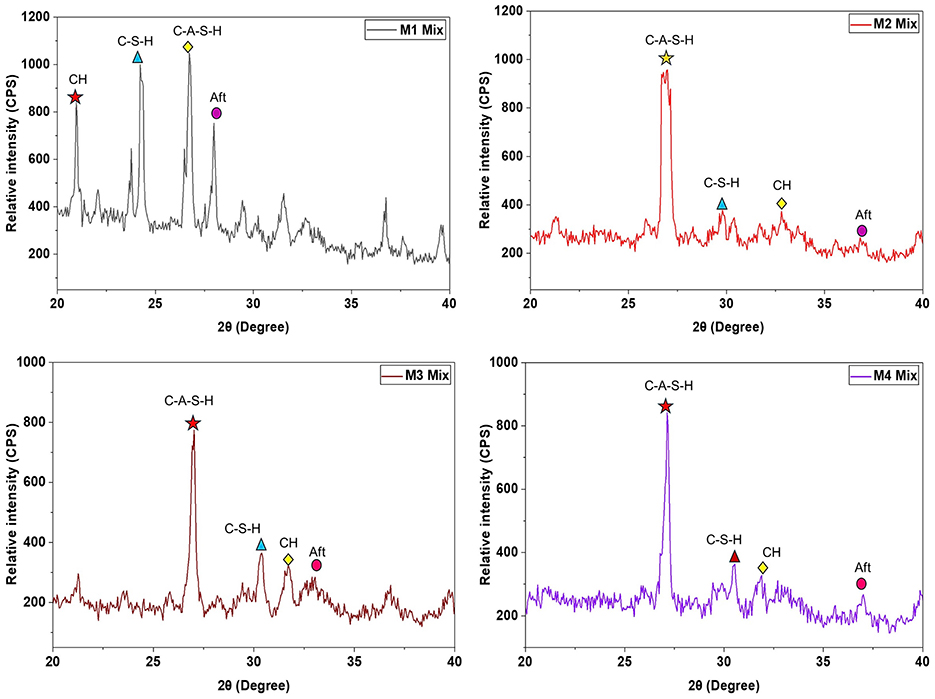
Figure 13. Hydration components of insulator concrete mixes.
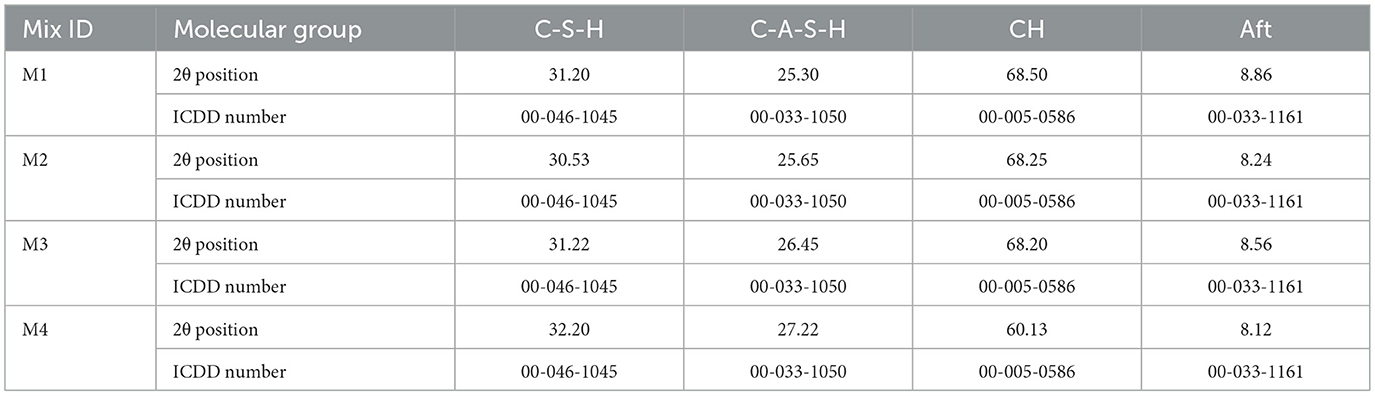
Table 12. XRD analysis findings of insulator concrete mixes.
The XRD study revealed that the interaction between crystalline SiO2 and tricalcium aluminate (C3A) enhances both early AFt production and C3S hydration. Further, the mixed compounds such as C-S-H and C-A-S-H have boosted the mechanical properties of insulator concrete, even if the surface of insulator coarse aggregate was smoother. Comparing the M4 mix, which contained aggregates and insulator powder, to the reference mix M1, the C-A-S-H gel intensity peaks were greater, suggesting superior resistance for higher grade concrete mixes based on insulator waste. In insulator concrete mixes, the strength retention may be due to the comparatively greater intensity peaks of C-A-S-H gel and lower intensity peaks of Aft compared to the M1 mix. Similarly, the mixed compounds variation was observed in the concrete made with micro ceramic powder (Li et al., 2020).
5.5.3 Absorption phases
Figure 14 compares the infrared absorption bands for insulator concrete for the spectral phases range and the magnification is kept as (500–4,500 cm−1) and (0.5–16 cm−1), respectively. Figure 14 indicates that the rise and fall of wavenumbers have a significant impact on the variation in compressive strength of insulator concrete mixtures. Calcium hydroxide (portlandite)-(Ca(OH)2) was changed into C-S-H when the insulator powder replacement in the mixes (M2 and M4) reached 30%. The development of a dense matrix contributed to the improved strength properties. Strengthening is a result of the carbonation of Ca(OH)2, which is formed as calcium carbonate (CaCO3). Table 13 depicts the bond wavenumbers of insulator concrete mixes and the substantial changes in the molecular combinations. More or less similar variation in the bond wavelength was observed for insulator concrete in the C-S-H and C-A-S-H stretching band, ranging from 925–984 cm−1. The C-H and Aft band is seen at the range of 3,556–3,568 cm−1 and 1,125–1,148 cm−1, respectively. The Si-O-Si stretching band for insulator concrete, which confirms the C-S-H vibrations, is seen at 875–894 cm−1. Stretch at 1,248 and 1,256 cm−1 is indicative of the polymerization of the orthosilicate subunits () brought on by insulator powder in conjunction with cement in concrete. The stretching modes of the framework are dependent on the Aluminum-silicon composition and frequencies, as the tetrahedral number of aluminum atoms increases (Zhou et al., 2016; Tufan et al., 2025). Similarly, the Si-O-Al stretching band for insulator concrete confirms the C-S-H vibrations, which were seen at 1,104–1,115 cm−1. The variation in frequency was attributed to the increase in aluminum (Al) levels in the insulator concrete matrix and, consequently, the significant improvement in strength properties. Fourier Transform Infrared (FTIR) analysis offers a comprehensive understanding of the chemical bonding vibrations of components, allowing for a more detailed structural analysis. The transformation of ceramic waste powders from anisotropic to isotropic state has been studied using the respective FTIR spectra (Huseien et al., 2020). Similarly, the wavelength of C-S-H, C-A-S-H, C-H, and Aft, molecular components were approximately 940–1,000 cm−1 (Siddique et al., 2021), 961–1,006 cm−1 (Siddique et al., 2021), 3,556–3,645 cm−1 (Guo et al., 2019), and 1,121–1,164 cm−1 (Bisht and Ramana, 2019), respectively.
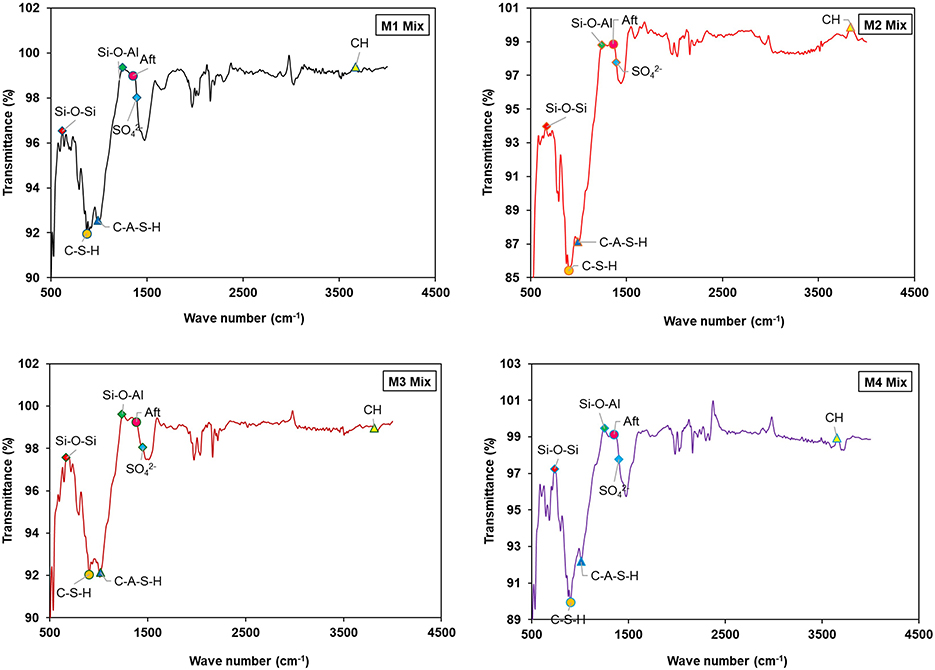
Figure 14. Infrared absorption bands of insulator concrete mixes.
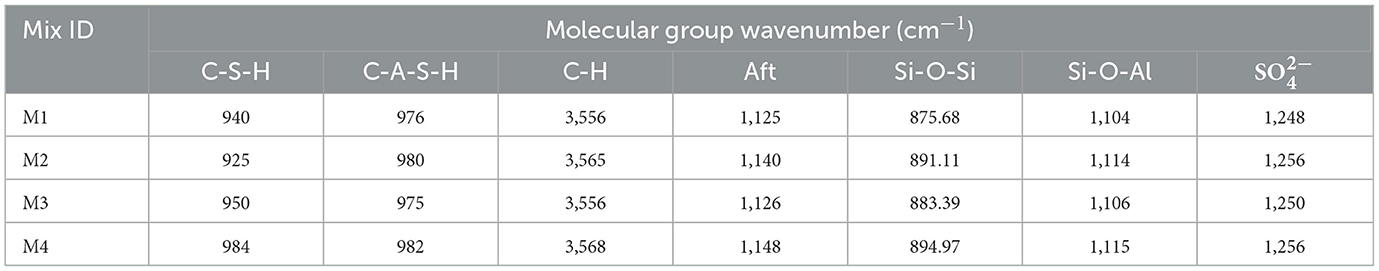
Table 13. FTIR wavenumber (cm−1) of insulator concrete mixes.
According to certain reports, the decreasing bond length of various chemical groups was indicated by the wavenumber moving to the lower side (Guo et al., 2019). The C-A-S-H gel was created when crystalline SiO2 came into contact with Tricalcium Silicate (C3S) and Tetra-Calcium Aluminoferrite (C4AF). The determined Si-O-Si bond wavenumber of M1, M2, M3, and M4 mixes were 875.68, 891.11, 883.39 and 894.97 cm−1, respectively. When combined with insulator powder, the results indicated a slight alteration in the molecular groups. This slight alteration in the molecular groups and wavenumber fluctuations is typical experimental changes and often indicates the mild structural irregularities in the carbonate phases rather than a substantial shift in hydration activity. As a result, their direct influence on strength is minimal. The intensity patterns and phase transition, indeed, show strength enhancement of concrete. Similarly, according to the study by Chindaprasirt et al. (2009), the peaks were situated between 400 and 500 cm−1 and extended from 900 to 1,200 cm−1, demonstrating Si-O-Si bonding. When combined with insulator powder, the results indicated a slight alteration in the molecular groups.
5.5.4 Chemically bound water (Wb) and mineralogical phases
The relative weight losses and temperature difference of the insulator concrete, as investigated by TGA and differential thermal analysis (DTA), are displayed in Figure 15, which is almost similar to the study (Li et al., 2024). The following are the four apparent stages of mass loss that were identified in the insulator concrete powder sample:
• Stage I: The chemically bound water desorption or dehydration of mineral compounds (such as C-S-H, C-A-S-H, and Aft) indicates the beginning of weight loss from 70 to 200 °C.
• Stage II: The weight loss from 200 to 400 °C indicates the breakdown of CH.
• Stage III: The weight loss from 400 to 600 °C shows the breakdown of CaCO3.
• Stage IV: The weight loss from 600 to 800 °C shows the breakdown of CaSiO3.
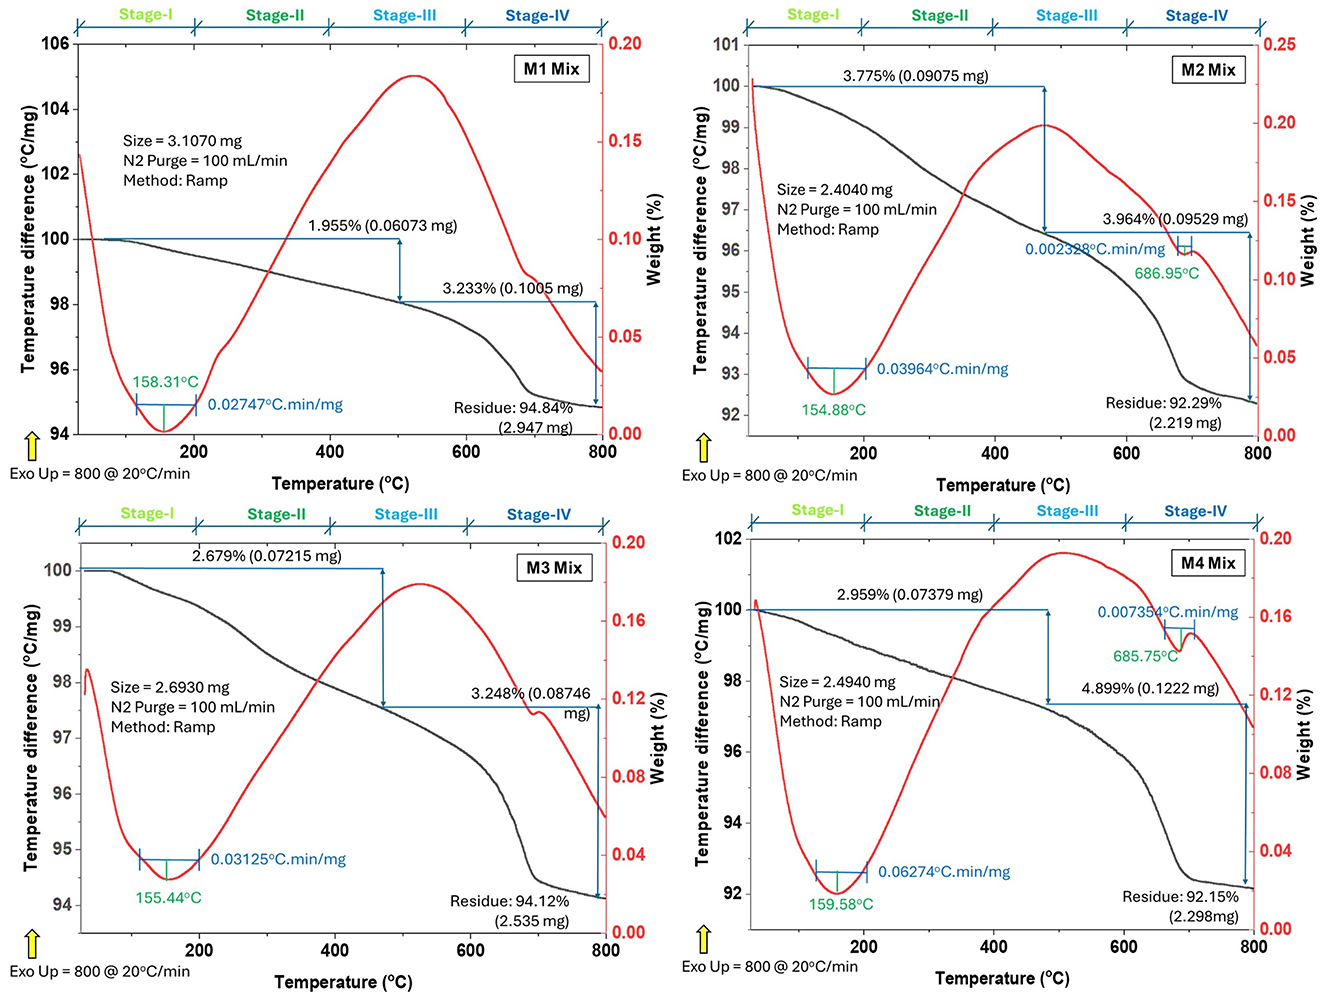
Figure 15. Temperature difference—weight loss of insulator concrete mixes.
Despite the extensive drying of the samples by acetone exchange, the greatest weight loss occurs at stage I. It is evident from the data that the drying plan would not be able to remove all the water that has been physically coated. The gap between C-S-H chains, for instance, can tightly retain water to prevent extreme drying (Zhou et al., 2018). The restricted CaCO3 concentrations in all the mixes are shown by the little weight loss that occurs at stage IV, according to the XRD data (Figure 13). Table 14 depicts the percentage of weight loss of insulator concrete mixes at different temperatures. At the temperature range from 600 to 800 °C, the maximum hydration degree of insulator concrete mixes M2, M3, and M4 was increased to 2.47%, 0.72%, and 3.24% in comparison to the M1 mix. As seen in Figure 15, chemically bound water (Wb) increased for insulator concrete (M2 and M4 mixes) because insulator powder enhances pozzolanic reactions by creating new hydration products and consuming CH; at the same time, Wb is increased by the strong pozzolanic reactions of insulator powder. Similarly, TGA-DTA graphs of concrete made with crumb rubber (Bisht and Ramana, 2019), nano-materials (silica, alumina, and glass waste) (Ali et al., 2024) and ceramic tile waste powder (Ahmed et al., 2025) as a supplementary cementitious material with the same temperature difference, similar to the present study, were studied. The obtained results in terms of weight loss and TGA-DTA graph were similar to the present study results.
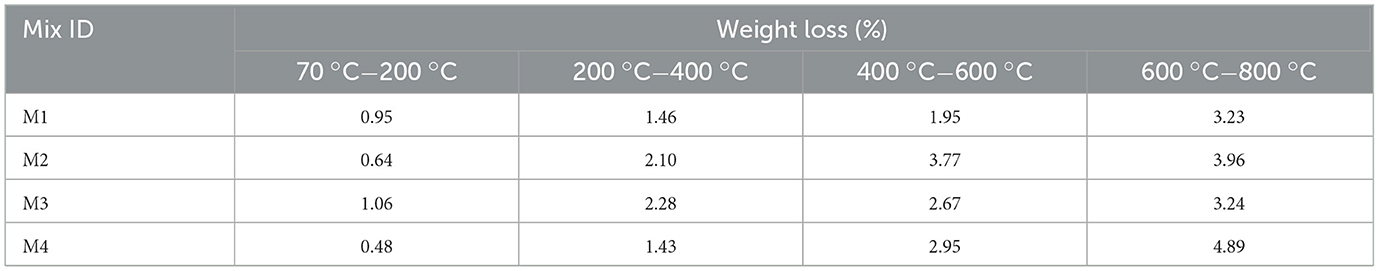
Table 14. TGA weight loss (%) of insulator concrete mixes at different temperatures.
5.6 3E analysis of insulator concrete
5.6.1 EEc, ECO2e, and Eb
The EEc and ECO2e analysis is derived from the literature of the study by Siddique et al. (2019) and compared with insulator concrete mixes in Table 15. The effective EEC and ECO2e have been achieved by insulator concrete mix M4, with values of 1,577.98 MJ/m3 and 294.82 kg/m3, respectively. For instance, the estimated cost of M50 grade concrete of four different mixes is presented in Table 15. The maximum cost savings of 2,435 rupees (36%) are implied for 1 m3 of M4 mix, and the corresponding cost-to-compressive-strength ratio was 102.70. Similarly, Siddique et al. (2019) studied the cost–benefit analysis of concrete using fine bone China ceramic waste as 100% fine aggregate replacement, and it was found that 814.47 rupees (14.86%) cost saving, which is 21% less than the present study M4 mix.
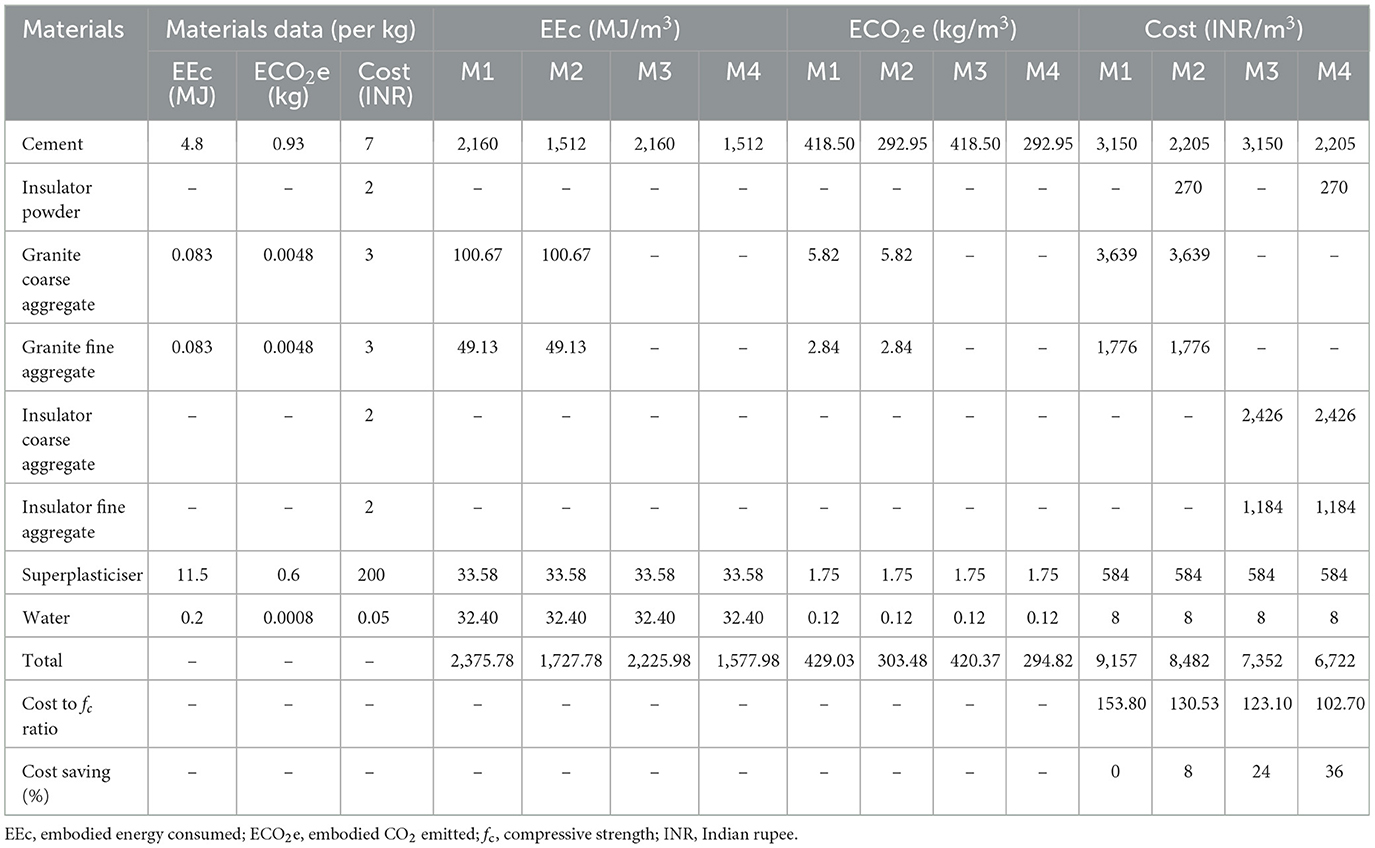
Table 15. Comparison of 3E analysis of insulator concrete mixes.
If concrete was indeed made without SNF, achieving workability, hydration, and strength development for M50 grade concrete would be a complicated task. In the present study, the design grade of concrete was fixed as M50. According to the mix design, the water content (162 l/m3) and W/b ratio (0.36) were kept as constat in all the four concrete mixes. However, in accordance with IS:10262-2019 (Clause 5.3) as listed in Table 4, the water content per cubic meter of concrete is 186 l/m3 for a 20 mm nominal maximum size of aggregate. To improve workability and hydration without affecting the strength development of concrete (M50 Grade) with the lower water content, the SNF-based superplasticizer (2.92 l/m3) is found to be used based on trial. SNF acts as a dispersing agent without directly reacting with cement in a stoichiometric manner to produce new hydration products toward strength development, but accelerates the workability as evidenced during the casting time of concrete in the lab. Also, it is suggested in accordance with BS 5075:1985 (Part-3). The trade-off by omitting SNF could reduce costs but may compromise the workability and hydration performance, which directly influence the strength of concrete.
5.6.2 SI
The SI is used to determine the energy-saving efficiency function (ψ), which is calculated from the consumption of the energy system. The Specific Surface Area (SSA) of the insulator powder determines how much energy it uses, and it is solely determined by the grinding process. Substitution of the SSA values of the insulator powder (SSA = 4.49 m2/g) and cement (SSA = 4.79 m2/g) in the power Equation 15, one obtains Egri, ip = 8.315 kWh/t and Egri, c = 8.327 kWh/t. By substituting the obtained grinding energy of insulator powder and cement in Equation 14, with 30% cement replaced by insulator powder, the total electrical energy consumption arrived as Et = 8%. Similarly, 15% waste marble and 20% ceramic powder replacement of cement had total energy consumption of 1.05 and 6.62% from the reference Singh et al. (2017) and Li et al. (2020), respectively, which is lower than the one obtained in the present study. For both cement and insulator powder, the specific electrical energy grinding energy ratio is 12%. This is consistent with the data presented (Madlool et al., 2011).
By substituting Egri, ip = 8.315 kWh/t and Ec = 70 kWh/t in Equation 15, ψ = 0.88xn% is obtained. For insulator concrete, with 30% insulator powder, ψ = 26.40%. Substituting ψ = 26.40% in Equation 17, the SI was found as 1.35 for insulator concrete, with 30% insulator powder. Additionally, this approach provides a chance to enhance the system by figuring out the component's energy analysis (Caglayan and Caliskan, 2018).
6 Conclusion
The main conclusions were drawn from the investigation of the material properties of insulator waste, the mechanical properties of insulator concrete, microstructure characterization, and 3E analysis of eco-friendly insulator concrete. The summary of conclusions is given as follows:
(1) Concerning the material properties of insulator waste:
The hydrodynamic diameter of insulator powder is 52.72% smaller than cement, which offers a higher binding property by covering more volume of voids (particle packing) in the concrete matrix. Higher concentrations of SiO2 and Al2O3 in insulator powder improved the early age strength of concrete. Similarly, the increased hydration component CaSiO3 enhanced the strength of the hardened concrete through a subsequent pozzolanic reaction.
(2) Regarding the mechanical properties of insulator concrete:
Significantly higher mechanical properties were achieved by the insulator concrete mix (M4) compared to the remaining mixes. The compressive strength of M4 mix is 14.14% higher than the characteristic compressive strength (fck), and the maximum split tensile strength is 23.98% higher than the value found by using ACI318. The flexural strength and modulus of elasticity of insulator concrete found by experimental study are higher than the values found by using both IS456 and ACI318 provisions. The dynamic modulus of insulator concrete was 43.30% higher than the static modulus. Similarly, the lateral strain of insulator concrete is 44.75% higher than the maximum permissible concrete strain suggested by IS456. The Poisons ratio of insulator concrete varied from 0.22 to 0.24. Regression and statistical analysis demonstrated that the mechanical properties of insulator concrete were significantly impacted, with R2 > 98% and CV > 5%.
(3) Pertaining to the microstructural characterization of insulator concrete:
As evidenced by SEM images, the matrix binding by ITZ of insulator powder substituted concrete (M2 and M4) mixes is enhanced by the acceleration of C-S-H gel. The XRD study revealed that the mixed compounds, such as C-S-H and C-A-S-H, have boosted the mechanical properties of insulator concrete. The rise and fall of Si-O-Si bond wavenumbers have a significant impact on the variation in compressive strength according to the FTIR result. The restricted CaCO3 concentrations in all the mixes were shown by the minimum weight loss that occurs at Stage-IV in accordance with TGA and DTA results.
(4) In relation to the 3E analysis of insulator concrete:
The effective eco-friendly emphasis of insulator concrete (M4 mix) finds a way to balance the environmental protection (ECO2e = 294.82 kg/m3) and energy conservation (EEC = 1,577.98 MJ/m3) to optimize the sustainability of insulator concrete (SI = 3.15). The cost analysis shows that the M4 mix can benefit the economy, lowering the overall cost of concrete making by 36%.
6.1 Significance/practical implications
The results of material properties showed that the insulator aggregate and insulator powder properties were comparable to those of granite aggregates and cement, respectively. The results of mechanical properties, microstructural characterization, sustainability factors, and cost analysis of insulator concrete were significantly superior to those of reference concrete. These findings hold good for the range of insulator waste properties and materials combination of concrete utilized in this investigation. Therefore, insulator waste can be used to make sustainable and eco-friendly building structures with a cost benefit rather than disposing of it as industrial waste.
6.2 Limitations/recommendations
The performance of concrete made with insulator waste from different sources may vary from the findings obtained, which depend on the location and source of the insulator waste collected. This study is the basis for further experiments on the structural behavior of reinforced concrete.
Data availability statement
The original contributions presented in the study are included in the article/supplementary material, further inquiries can be directed to the corresponding author.
Ethics statement
Written informed consent was obtained from the individuals for the publication of any identifiable images or data included in this article.
Author contributions
RR: Conceptualization, Data curation, Formal analysis, Investigation, Methodology, Resources, Visualization, Writing – original draft. SS: Funding acquisition, Project administration, Supervision, Validation, Visualization, Writing – review & editing.
Funding
The author(s) declare that no financial support was received for the research and/or publication of this article.
Acknowledgments
The authors wish to thank the Vellore Institute of Technology, Vellore, Tamil Nadu, India, for providing all testing facilities to complete this study and publication of articles in the referred journals.
Conflict of interest
The authors declare that the research was conducted in the absence of any commercial or financial relationships that could be construed as a potential conflict of interest.
Generative AI statement
The author(s) declare that no Gen AI was used in the creation of this manuscript.
Any alternative text (alt text) provided alongside figures in this article has been generated by Frontiers with the support of artificial intelligence and reasonable efforts have been made to ensure accuracy, including review by the authors wherever possible. If you identify any issues, please contact us.
Publisher's note
All claims expressed in this article are solely those of the authors and do not necessarily represent those of their affiliated organizations, or those of the publisher, the editors and the reviewers. Any product that may be evaluated in this article, or claim that may be made by its manufacturer, is not guaranteed or endorsed by the publisher.
References
ACI 318 (Part-2), Building-Code-for-Structural-Concrete. (2002). Farmington Hills, MI: ACI Committee.
Ahmad, J., Sabri, M. M., Majdi, A., Alattyih, W., Khan, I., and Alam, M. (2025). Durability and microstructure aspects of sustainable concrete made with ceramic waste: a review. Front. Mater. 11:1508989. doi: 10.3389/fmats.2024.1508989
Ahmed, T. I., El-Mehasseb, I. M., El-Shafai, N. M., Salama, R. S., and Tobbala, D. E. (2025). Investigation the mechanical, durability, heating Investigation the mechanical, durability, heating struggle, thermal gravimetric examination, and microstructure of geopolymer ceramic concrete incorporating nano-silica and nano-Soda-Cans. Constr. Build. Mater. 467:140325. doi: 10.1016/j.conbuildmat.2025.140325
Ali, A. E., Faried, A. S., and Osman, K. M. (2024). Effect of elevated temperature on properties of concrete containing different types of nano-materials. Constr. Build. Mater. 438:136988. doi: 10.1016/j.conbuildmat.2024.136988
Alotaibi, J. G., Alajmi, A. E., Alsaeed, T., Khalaf, J. A., and Yousif, B. F. (2024). On the incorporation of waste ceramic powder into concrete. Front. Mech. Eng. 10:1469727. doi: 10.3389/fmech.2024.1469727
Anderson, D. J., Smith, S. T., and Au, F. T. K. (2016). Mechanical properties of concrete utilising waste ceramic as coarse aggregate. Constr. Build. Mater. 117, 20–28. doi: 10.1016/j.conbuildmat.2016.04.153
ASTM C1274:2020 (Part-12), Standard Test Method for Advanced Ceramic Specific Surface Area by Physical Adsorption. (2020). West Conshohocken, PA: ASTM.
ASTM C469 (Part-2) Standard Test Method for Static Modulus of Elasticity and Poisson's Ratio of Concrete in Compression. (2009). United States: ASTM International. Available online at: https://www.astm.org (Accessed July 11, 2023)
ASTM C618 (Part-3) Standard Specification for Coal Fly Ash and Raw or Calcined Natural Pozzolan for Use in Concrete. (2003). Available online at: https://www.astm.org (Accessed March 9, 2024)
ASTM D4972-19 Standard Test Methods for pH of Soil . (2018). Available online at: https://store.astm.org/d4972-19.html.in.10-01-2023
ASTM E1252:2021 (Part-98), Practice for General Techniques for Obtaining Infrared Spectra for Qualitative Analysis. (2021). West Conshohocken, PA: ASTM International.
ASTM E1621-(Part-22), Standard Guide for Elemental Analysis by Wavelength Dispersive X-Ray Fluorescence Spectrometry. (2022). West Conshohocken, PA: ASTM.
ASTM E3294 (Part-22) Standard Guide for Forensic Analysis of Geological Materials by Powder X-Ray Diffraction. (2022). West Conshohocken, PA: ASTM.
ASTM-C1872 (Part-24) Test Method for Thermogravimetric Analysis of Hydraulic Cement. (2024). West Conshohocken, PA: ASTM International.
Awoyera, P. O., Dawson, A. R., Thom, N. H., and Akinmusuru, J. O. (2017). Suitability of mortars produced using laterite and ceramic wastes: mechanical and microscale analysis. Constr. Build. Mater. 148, 195–203. doi: 10.1016/j.conbuildmat.2017.05.031
Bisht, K., and Ramana, P. V. (2019). Waste to resource conversion of crumb rubber for production of sulphuric acid resistant concrete. Constr. Build. Mater. 194, 276–286. doi: 10.1016/j.conbuildmat.2018.11.040
BS 5075:1985 (Part-3), Concrete admixtures: Specification for superplasticizing admixtures. (1985). London: British Standards Institution.
Bullard, J. W., Jennings, H. M., Livingston, R. A., Nonat, A., Scherer, G. W., Schweitzer, J. S., et al. (2011). Mechanisms of cement hydration. Cem. Concr. Res. 41, 1208–1223. doi: 10.1016/j.cemconres.2010.09.011
Caglayan, H., and Caliskan, H. (2018). Energy, exergy and sustainability assessments of a cogeneration system for ceramic industry. Appl. Therm. Eng. 136, 504–515. doi: 10.1016/j.applthermaleng.2018.02.064
Chen, X., Zhang, D., Cheng, S., Xu, X., Zhao, C., Wang, X., et al. (2022). Sustainable reuse of ceramic waste powder as a supplementary cementitious material in recycled aggregate concrete: mechanical properties, durability and microstructure assessment. J. Build. Eng. 52:104418. doi: 10.1016/j.jobe.2022.104418
Chindaprasirt, P., Jaturapitakkul, C., Chalee, W., and Rattanasak, U. (2009). Comparative study on the characteristics of fly ash and bottom ash geopolymers. Waste Manag. 29, 539–543. doi: 10.1016/j.wasman.2008.06.023
Donatello, S., Tyrer, M., and Cheeseman, C. R. (2010). Comparison of test methods to assess pozzolanic activity. Cem. Concr. Compos. 32, 121–127. doi: 10.1016/j.cemconcomp.2009.10.008
Ebrahimi, M., Eslami, A., Hajirasouliha, I., Ramezanpour, M., and Pilakoutas, K. (2023). Effect of ceramic waste powder as a binder replacement on the properties of cement- and lime-based mortars. Constr. Build. Mater. 379:131146. doi: 10.1016/j.conbuildmat.2023.131146
El-Dieb, A. S., and Kanaan, D. M. (2018). Ceramic waste powder an alternative cement replacement – characterization and evaluation. Sustain. Mater. Technol. 17:e00063. doi: 10.1016/j.susmat.2018.e00063
EN 196-(Part-5) Methods of testing cement: Pozzolanicity test for pozzolanic cement. (2011). Available at: https://standards.iteh.ai/catalog/standards/sist/b9a572d8-c681-492c-b42f- (Accessed January 10, 2023)
Gharibi, H., Mostofinejad, D., Bahmani, H., and Hadadzadeh, H. (2022). Improving thermal and mechanical properties of concrete by using ceramic electrical insulator waste as aggregates. Constr. Build. Mater. 338:127647. doi: 10.1016/j.conbuildmat.2022.127647
Guo, Y., Zhang, T., Tian, W., Wei, J., and Yu, Q. (2019). Physically and chemically bound chlorides in hydrated cement pastes: a comparison study of the effects of silica fume and metakaolin. J. Mater. Sci. 54, 2152–2169. doi: 10.1007/s10853-018-2953-5
Hashim, A. A., Anaee, R., Nasr, M. S., Shubbar, A., and Alahmari, T. S. (2025). Mechanical properties, corrosion resistance and microstructural analysis of recycled aggregate concrete made with ceramic wall waste and ultrafine ceria. J. Mater. Res. Technol. 36, 627–640. doi: 10.1016/j.jmrt.2025.03.154
Higashiyama, H., Yagishita, F., Sano, M., and Takahashi, O. (2012). Compressive strength and resistance to chloride penetration of mortars using ceramic waste as fine aggregate. Constr. Build. Mater. 26, 96–101. doi: 10.1016/j.conbuildmat.2011.05.008
Huseien, G. F., Ismail, M., Tahir, M., Mirza, J., Hussein, A., Khalid, N. H., et al. (2018). Effect of binder to fine aggregate content on performance of sustainable alkali activated mortars incorporating solid waste materials. Chem. Eng. Trans. 63, 667–672. doi: 10.3303/CET1863112
Huseien, G. F., Sam, A. R. M., Shah, K. W., and Mirza, J. (2020). Effects of ceramic tile powder waste on properties of self-compacted alkali-activated concrete. Constr. Build. Mater. 236:117574. doi: 10.1016/j.conbuildmat.2019.117574
Ikotun, J. O., Adedeji, P. O., and Babafemi, A. J. (2025). A Comprehensive review on the performance of low-carbon ceramic waste powder as cement replacement material in concrete. Appl. Sci. 15:6037. doi: 10.3390/app15116037
IS 10262:2019, Concrete Mix Proportioning-Guidelines (Second Revision). (2019). New Delhi: Bureau of Indian Standards. Available online at: https://www.standardsbis.in (Accessed August 1, 2024)
IS 12269:2013, Specification for 53 Grade Ordinary Portland cement. (2013). New Delhi: Bureau of Indian Standards.
IS 2386:1963 (Part-1) Methods of Test for Aggregates for Concrete: Particle Size and Shape. (1963). New Delhi.
IS 2386:1963 (Part-3): Methods of test for aggregates for concrete: Specific gravity density, voids, absorption and bulking. (1963). New Delhi.
IS 2386:1963 (Part-4) Methods of test for aggregates for concrete: Mechanical properties. (1963). New Delhi.
IS 383:2016 Specification for coarse and fine aggregates from natural sources for Concrete. (2016). New Delhi: Bureau of Indian Standards.
IS 4031:1988 (Part-11) Methods of physical tests for hydraulic cement: Determination of density. (1988). New Delhi: Bureau of Indian Standards.
IS 4031:1988 (Part-5) Methods of physical tests for hydraulic cement: Determination of initial and final setting times. (1988). New Delhi.
IS 456:2000 Plain and Reinforced Concrete – Code of Practice. (2000). New Delhi: Bureau of Indian Standards.
IS 516:2004 Methods of Tests for Strength of Concrete. (2004). New Delhi: Bureau of Indian Standards.
IS 5816:1999 Method of Test for Splitting Tensile Strength of Concrete. (1999). New Delhi: Bureau of Indian Standards.
IS 7320:1974 (Reaffirmed 2008): Specification for concrete slump test apparatus (1974). New Delhi: Bureau of Indian Standards.
ISO 21383:2021 Qualification of the Scanning Electron Microscope for Quantitative Measurements. (2021). Switzerland: ISO.
ISO 22412:2017, Particle Size Analysis-Dynamic Light Scattering. (2017). Geneva: ISO. Available online at: https://www.iso.orgiTehSTANDARDPREVIEW
Jang, H. S., and So, S. Y. (2015). The properties of cement-based mortar using different particle size of grinding waste insulator powder. J. Build. Eng. 3, 48–57. doi: 10.1016/j.jobe.2015.06.007
Juan-Valdés, A., Rodríguez-Robles, D., García-González, J., Guerra-Romero, M. I., and Morán-del Pozo, J. M. (2018). Mechanical and microstructural characterization of non-structural precast concrete made with recycled mixed ceramic aggregates from construction and demolition wastes. J. Clean . Prod. 180, 482–493. doi: 10.1016/j.jclepro.2018.01.191
Kannan, D. M., Aboubakr, S. H., EL-Dieb, A. S., and Reda Taha, M. M. (2017). High performance concrete incorporating ceramic waste powder as large partial replacement of Portland cement. Constr. Build. Mater. 144, 35–41. doi: 10.1016/j.conbuildmat.2017.03.115
Keshavarz, Z., and Mostofinejad, D. (2019). Porcelain and red ceramic wastes used as replacements for coarse aggregate in concrete. Constr. Build. Mater. 195, 218–230. doi: 10.1016/j.conbuildmat.2018.11.033
Kumar Metha, P., and Monterio, P. J. M. (2006). Concrete: Microstructure, Properties and Materials, 3rd Edn. Chicago, IL: McGraw Hill.
Li, L., Joseph, P., Zhang, X., and Zhang, L. (2024). A study of some relevant properties of concrete incorporating waste ceramic powder as a cement replacement agent. J. Build. Eng. 87:109106. doi: 10.1016/j.jobe.2024.109106
Li, L., Liu, W., You, Q., Chen, M., and Zeng, Q. (2020). Waste ceramic powder as a pozzolanic supplementary filler of cement for developing sustainable building materials. J. Clean. Prod. 259:120853. doi: 10.1016/j.jclepro.2020.120853
Li, L. G., Zhuo, Z. Y., Zhu, J., Chen, J. J., and Kwan, A. K. H. (2019). Reutilizing ceramic polishing waste as powder filler in mortar to reduce cement content by 33% and increase strength by 85%. Powder Technol. 355, 119–126. doi: 10.1016/j.powtec.2019.07.043
Madlool, N. A., Saidur, R., Hossain, M. S., and Rahim, N. A. (2011). A critical review on energy use and savings in the cement industries. Renew. Sustain. Energy Rev. 15, 2042–2060. doi: 10.1016/j.rser.2011.01.005
Marvila, M. T., Alexandre, J., de Azevedo, A. R. G., and Zanelato, E. B. (2019). Evaluation of the use of marble waste in hydrated lime cement mortar based. J. Mater. Cycles Waste Manag. 21, 1250–1261. doi: 10.1007/s10163-019-00878-6
Naenudon, S., Wongsa, A., Ekprasert, J., Sata, V., and Chindaprasirt, P. (2023). Enhancing the properties of fly ash-based geopolymer concrete using recycled aggregate from waste ceramic electrical insulator. J. Build. Eng. 68:106132. doi: 10.1016/j.jobe.2023.106132
Özkiliç, Y. O., Bahrami, A., Güzel, Y., Soganci, A. S., Karalar, M., Althaqafi, E., et al. (2024). Waste ceramic powder for sustainable concrete production as supplementary cementitious material. Front. Mater. 11:1450824. doi: 10.3389/fmats.2024.1450824
Papadakis, V. G., Vayenas', C. G., and Fardis, M. N. (1991). Experimental investigation and mathematical modeling of the concrete carbonation problem. Chem. Eng. Sci. 46, 1333–1338. doi: 10.1016/0009-2509(91)85060-B
Patankar, S. V., Ghugal, Y. M., and Jamkar, S. S. (2014). Effect of concentration of sodium hydroxide and degree of heat curing on fly ash-based geopolymer mortar. Indian J. Mater. Sci. 2014, 1–6. doi: 10.1155/2014/938789
Pereira, V. M., Geraldo, R. H., Baldusco, R., and Camarini, G. (2022). Porcelain waste from electrical insulators in self-leveling mortar: materials characterization and properties. J. Build. Eng. 61:105297. doi: 10.1016/j.jobe.2022.105297
Rangel, C. S., Amario, M., Pepe, M., Martinelli, E., and Filho, R. D. T. (2020). Influence of wetting and drying cycles on physical and mechanical behavior of recycled aggregate concrete. Materials 13, 1–20. doi: 10.3390/ma13245675
Senthamarai, R. M., and Devadas Manoharan, P. (2005). Concrete with ceramic waste aggregate. Cem. Concr. Compos. 27, 910–913. doi: 10.1016/j.cemconcomp.2005.04.003
Senthamarai, R. M., Devadas Manoharan, P., and Gobinath, D. (2011). Concrete made from ceramic industry waste: durability properties. Constr. Build. Mater. 25, 2413–2419. doi: 10.1016/j.conbuildmat.2010.11.049
Siddique, S., Chaudhary, S., Shrivastava, S., and Gupta, T. (2019). Sustainable utilisation of ceramic waste in concrete: exposure to adverse conditions. J. Clean. Prod. 210, 246–255. doi: 10.1016/j.jclepro.2018.10.231
Siddique, S., Gupta, T., Thakare, A. A., Gupta, V., and Chaudhary, S. (2021). Acid resistance of fine bone china ceramic aggregate concrete. Eur. J. Environ. Civ. Eng. 25, 1219–1232. doi: 10.1080/19648189.2019.1572543
Singh, M., Choudhary, K., Srivastava, A., Singh Sangwan, K., and Bhunia, D. (2017). A study on environmental and economic impacts of using waste marble powder in concrete. J. Build. Eng. 13, 87–95. doi: 10.1016/j.jobe.2017.07.009
Surendran, H., and Akhas, P. K. (2024). Properties of high-performance concrete incorporating toughened glass waste coarse aggregate: an experimental study. Structures 60:105897. doi: 10.1016/j.istruc.2024.105897
Tawfik, T. A., Sičáková, A., Kuzielová, E., Kušnír, Š., Eštoková, A., Bálintová, M., et al. (2024). Sustainable reuse of waste ceramic tiles powder and waste brick powder as a replacement for cement on green high strength concrete properties. Innov. Infrastruct. Solut. 9, 1–22.. doi: 10.1007/s41062-024-01498-2
Thangavel, K., and Rengaswamy, N. S. (1998). Relationship between chloride/hydroxide ratio and corrosion rate of steel in concrete. Cem. Concr. Compos. 20, 283–292. doi: 10.1016/S0958-9465(98)00006-7
Thomaz, W. A., Miyaji, D. Y., and Possan, E. (2021). Comparative study of dynamic and static Young's modulus of concrete containing basaltic aggregates. Case Stud. Constr. Mater. 15:e00645. doi: 10.1016/j.cscm.2021.e00645
Tokyay, M. (1999). Effect of chemical composition of clinker on grinding energy requirement. Cem. Concr. Res. 29, 531–535. doi: 10.1016/S0008-8846(98)00219-1
Tufan, M. Z., Kaplan, A. N., and Özel, C. (2025). Enhancing concrete microstructure with carboxymethyl cellulose (CMC) and microcrystalline cellulose (MCC): a comprehensive characterization using FTIR, TGA, and XRD. J. Build. Eng. 106:112611. doi: 10.1016/j.jobe.2025.112611
Xu, K., Huang, W., Zhang, L., Fu, S., Chen, M., Ding, S., et al. (2021). Mechanical properties of low-carbon ultrahigh-performance concrete with ceramic tile waste powder. Constr. Build. Mater. 287:123036. doi: 10.1016/j.conbuildmat.2021.123036
Zegardło, B., Szelag, M., and Ogrodnik, P. (2016). Ultra-high strength concrete made with recycled aggregate from sanitary ceramic wastes – the method of production and the interfacial transition zone. Constr. Build. Mater. 122, 736–742. doi: 10.1016/j.conbuildmat.2016.06.112
Zhou, C., Ren, F., Zeng, Q., Xiao, L., and Wang, W. (2018). Pore-size resolved water vapor adsorption kinetics of white cement mortars as viewed from proton NMR relaxation. Cem. Concr. Res. 105, 31–43. doi: 10.1016/j.cemconres.2017.12.002
Keywords: insulator waste, eco-friendly concrete, mechanical properties, regression analysis, microstructure characterization, 3E analysis
Citation: R. R and S. K. S (2025) Sustainable electrical insulator waste management: an eco-friendly concrete development and property assessment using 3E analysis. Front. Sustain. 6:1695766. doi: 10.3389/frsus.2025.1695766
Received: 30 August 2025; Accepted: 07 October 2025;
Published: 03 November 2025.
Edited by:
Runxiao Zhang, University of Toronto, CanadaReviewed by:
Salmabanu Luhar, University of Bradford, United KingdomS. K. M. Pothinathan, Kalasalingam Academy of Research and Education, India
Copyright © 2025 R. and S.K. This is an open-access article distributed under the terms of the Creative Commons Attribution License (CC BY). The use, distribution or reproduction in other forums is permitted, provided the original author(s) and the copyright owner(s) are credited and that the original publication in this journal is cited, in accordance with accepted academic practice. No use, distribution or reproduction is permitted which does not comply with these terms.
*Correspondence: Sekar S. K., c2tzZWthckB2aXQuYWMuaW4=