 Jyoti Kumari Upadhyaya
 Nihar Biswas
 Edwin K. L. Tam
- 1Ministry of Municipal Affairs and Housing, Victoria, BC, Canada
- 2Department of Civil and Environmental Engineering, University of Windsor, Windsor, ON, Canada
This paper presents the implementation of decision criteria template to incorporate qualitative indicators in functionality, resiliency and sustainability assessments of stormwater infrastructure using the Functionality–Resiliency–Sustainability Framework. Qualitative attributes, even though deemed important, are usually not included, or adequately considered because of their inherent subjectivity associated with assessing them. Whenever qualitative indicators are used in practice, an ordinal scale such as poor, fair, good, very good is frequently applied. However, depending on the understanding and priorities of the evaluator, the meaning of poor, fair, good and very good score can differ significantly. Such indicators were generally not intended to facilitate engineering solutions but rather management related concerns. However, understanding the issues behind using qualitative measures is critical for stormwater infrastructure because many non-conventional indicators—which are frequently non-technical measures—can be used to assess the resiliency and sustainability of stormwater system. Moreover, there are few resources to adapt specific qualitative factors to quantitative equivalents. To address this gap, a decision criteria template is developed to score qualitative indicators within a multi-criteria assessment approach so that consistency, transparency, and subjectivity in the assessment can be addressed. The indicator scoring template is illustrated in an example stormwater system in city of Windsor, Ontario, Canada. Based on the analysis done using the decision criteria matrix, it was found that city of Windsor's stormwater infrastructure resiliency is relatively better than its assessed functionality and sustainability.
Introduction
Infrastructure resiliency is now center stage in the overall planning, design, and management of infrastructure. Assessing how resilient an infrastructure system is now more crucial than ever, and many decision frameworks has been developed recently to assist decision makers and operators manage infrastructure (Upadhyaya et al., 2018; Rehak et al., 2019; Argyroudis et al., 2020). The Report Card of American Society of Civil Engineering. (2021) includes resiliency as one of the key parameters in assessing infrastructure. Assessing infrastructure in general—and particularly stormwater infrastructure—is complex because it involves multiple environmental, social and economic issues, and further requires thorough consideration of technical, financial, social and long-term aspects to be resilient and sustainable. For this reason, making decisions about whether a system is resilient and sustainable is increasingly challenging. However, qualitative attributes, despite being important, are generally not included in the assessment of infrastructure. To address this gap, a decision criteria template is developed to score qualitative indicators within a multi-criteria assessment approach so that consistency, transparency and subjectivity in the assessment can be addressed. The indicator scoring template is illustrated in an example stormwater system in city of Windsor, Ontario, Canada, to demonstrate how such qualitative indicators can be interpreted and assessed.
Context and Literature
Using Multi-Criteria Assessment
The overall approach of the scoring template uses multi-criteria assessment (MCA). When making decisions, MCA is popular for assessing infrastructure for sustainability (Hajkowicz and Collins, 2007; Lai et al., 2008; Upadhyaya and Moore, 2012; Suresh et al., 2016); risk and resiliency (Martin et al., 2007; Galarza-Molina et al., 2015; Kangas, 2016; Lounis and McAllister, 2016); asset management (Rasa, 2009); and performance assessment (Kabir et al., 2014), among many others. Although this research does not focus on MCA, it is discussed to provide the context for how indicators are incorporated. MCA is useful for a range of scenarios because of its capacity to include qualitative and quantitative indicators within the evaluation, but MCA also has shortcomings (Lai et al., 2008).
One of the main issues when applying MCA is the uncertainty associated with the scoring of the attributes (Hajkowicz and Collins, 2007; Lai et al., 2008; Steele et al., 2008; Alvarez-Guerra et al., 2009; Rasa, 2009; Yilmaz and Harmancioglu, 2010; Kabir et al., 2014; Brito and Evers, 2016; Kangas, 2016). Usually, a linear interpolation scheme is applied during scoring between the worst to best values (Martin et al., 2007; Jia et al., 2013). While many attributes may not truly exhibit a linear relationship, this straightforward approach to indicators provides an acceptable, understandable, and workable format for decision makers, even though it is imperfect, and thus is useful and adequate approach for the proposed template.
Using Qualitative Indicators
Current assessment trends for infrastructure focus heavily on quantitative indicator summaries, such as seen in Infrastructure Report Cards or Benchmarking initiatives are useful for communicating broad themes that describe the state of infrastructure. However, these have not proven to be very effective (Upadhyaya et al., 2014, 2018) in addressing in-depth core issues related to resiliency and sustainability. Moreover, the Canada Infrastructure Report Card (The Association of Consulting Engineering Companies Canada, 2019) indicates that condition of stormwater assets is not largely known because in the past collecting data on the status of these systems was not a priority. This presents a significant challenge: how to act on such issues with limited data, or even no data.
For indicators that are qualitative, an ordinal scale is typically applied, with descriptors such as poor, fair, good, very good, and so on. As a result, such scoring is inherently subjective (Yilmaz and Harmancioglu, 2010; Kangas, 2016). Depending on the characteristics of the system, the understanding and priorities of the evaluator, the meaning of poor, fair, good and very good score can differ significantly. There is also the concern that decision methods, in complex situations, can lose transparency: even decision makers might be uncertain of how their decisions are ultimately reached. This notion of a “black box” approach to scoring and the potential over or under estimation of some indicators (Lai et al., 2008; Kangas, 2016) often discourages the use of qualitative indicators.
Some type of uncertainty analysis has often been advocated to address such issues in the scoring process by using a probabilistic approach (Cinneli et al., 2014), fuzzy logic, or indicator approach (Rasa, 2009; Brito and Evers, 2016). However, using probabilistic and fuzzy logic can be complex, may need increased levels of resources, time and expertise, and do not necessarily produce improved results compared to long-standing methods such as MCA (Brito and Evers, 2016). There is also no specific evidence that a given method for addressing uncertainty can handle subjectivity more effectively than others in any specific scenario (Lai et al., 2008). The choice may also depend on the availability of data and information, timeline and resources (Lai et al., 2008). A review of papers by Huang et al. (2011) suggests that the recommendations were similar even if different methods of MCA were implemented for the same problem.
The challenge then is to not only develop decision frameworks, but a means to capably incorporate a variety of disparate qualitative indicators that may signal other issues not captured by quantitative indicators to better assess how an infrastructure system is faring in terms of resiliency and sustainability and day-to-day functionality. Qualitative attributes, despite being important, are generally not included in the assessment of infrastructure.
Summary
To address this gap in practically using qualitative indicators, a decision criteria template is developed to score qualitative indicators within a multi-criteria assessment approach for upholding consistency and transparency. The indicator scoring template is illustrated later in an example stormwater system in the City of Windsor, Ontario, Canada that uses a mix of both qualitative and quantitative indicators.
The Functionality–Resiliency–Sustainability Framework
The Functionality–Resiliency–Sustainability (FRS) Framework [previously referred to as the Functionality–Survivability–Sustainability (FSS) Framework] clearly identified these issues and incorporated both qualitative and quantitative indicators to reflect the performance of stormwater system (Upadhyaya, 2013; Upadhyaya et al., 2018). Upadhyaya et al. (2018) demonstrated how the FRS Framework could evaluate the City of Toronto's stormwater system utilizing a multi-criteria, weighted sum model to incorporate and assess indicators that describe functionality, resiliency, and sustainability.
Prior to developing the FRS framework to assess the functionality, resiliency (formerly called survivability), and sustainability of a stormwater system in a comprehensive manner, most conventional evaluations assessed operational performance, sustainability assessment, and risk assessment separately. A lack of connectivity among these issues was identified. The FRS Framework fulfills that gap by having three levels of assessment within a single framework. Assessing functionality, resiliency and sustainability is done hierarchically. The FRS Framework also addresses the complexity and interconnectedness of impacts on infrastructure while assessing the system.
In general, much infrastructure is often assessed using the triple bottom line (TBL) approach or similar variant where environmental, economic and social aspects form the main criteria for assessment. However, within these categories the range of factors considered is often relatively conventional. Instead, the FRS framework considers rapidly changing external impact factors, indirect and direct effects on public health and safety, and the increasing demand for resources to manage infrastructure: many of these are not explicitly considered in decisions that can affect infrastructure resiliency (Upadhyaya et al., 2014). To reflect these important but often overlooked factors, the issues of resource, public health, and change management (RPC) were proposed as the main determinants for assessing infrastructure (Upadhyaya et al., 2018). The FRS Framework assumes that unless a system is functioning well, it can ultimately not be resilient enough to survive climatic or other stressors, nor will it be sustainable in the long term. Details about the FRS Framework concept and implementation can be found in Upadhyaya et al. (2018).
In assessing the resiliency and sustainability of stormwater infrastructure, employing more straightforward methods for including both quantitative and qualitative indicators within the greater framework of functionality–resiliency–sustainability (FRS Framework) is useful and insightful (Upadhyaya et al., 2018). Such a straightforward approach is even more beneficial considering that evaluating stormwater resiliency is not common. As a result, within the FRS framework, a series of qualitative and quantitative indicators are selected, interpreted, and assessed using a weighted sum MCA model.
Decision Criteria Template
A color coded decision criteria template, as shown in Table 1 is developed for circumstances where the assessor may not be initially familiar with the system being evaluated, and furthermore, the template can help score the indicators without any prior knowledge of decision theory. The user essentially matches their system circumstances against the criteria provided in the table for the various, selected indicators. The framework demonstrates in a straightforward and unambiguous manner how important qualitative data can be interpreted and then incorporated. This can reduce the hesitancy of decision makers to include them in infrastructure assessment and not omit them because they are perceived as difficult to understand or assess. More critically, Table 1 was developed by assessing multiple literature and in-practice references to provide available points of reference (see Upadhyaya et al., 2014, 2018). The table can be used by the decision maker help assess their circumstances against a credible starting set of default criteria. This is particularly effective when staff responsible for managing infrastructure leave the organization, and new employees may not have prior in-depth, institutional knowledge, but must still make preliminary decisions. It should be noted that for efficiency, Table 1 shows the decision criteria template generically, but also that the colors shown in specific cells are for the example discussed later in Using the Decision Criteria Template section.
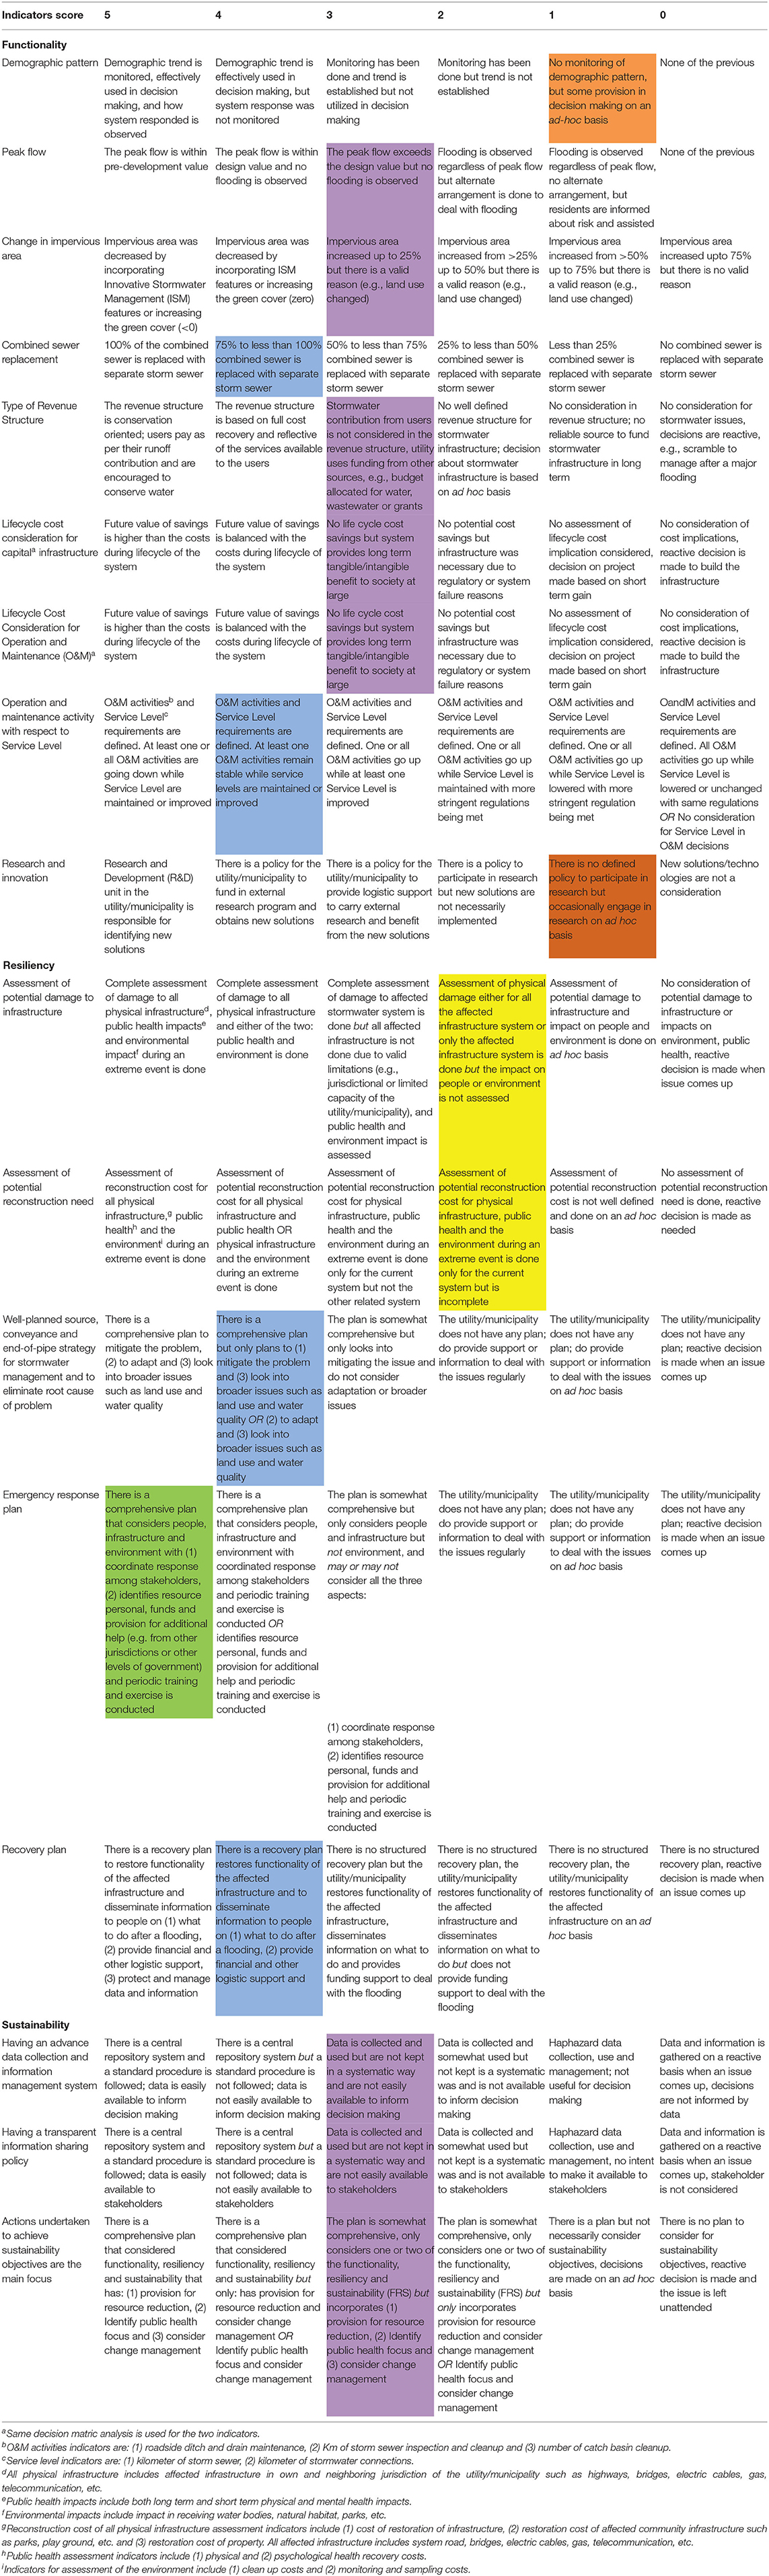
Table 1. Decision matrix analysis for qualitative indicators.
A color coding scheme is adopted for scores ranging from zero to 5: 0 = red, 1 = orange, 2 = yellow, 3 = purple, 4 = blue, 5 = green. Alternate color schemes can of course be used provided they are used consistently. The color coding allows the assessor to visually analyze the information across all indicators; for example, if the majority of the indicators are represented by green or blue criteria, then that indicates the system being assessed is likely at an improved state as opposed to a state of disrepair or non-functionality. Overall, this provides a visual snapshot of how each indicator compares against each other without relying on the numerical score and before all items are aggregated. In this way, all the details are still available for the assessor to review even if the descriptions are all translated into proxy measures and then into one overall value that no longer possesses the original detail. The color coding provides a descriptive interpretation of how the system is performing on average using this table format but losing the individual data because the assessor can still view them.
Stormwater Infrastructure Case Study
A subsection of the stormwater infrastructure in Windsor, Canada is assessed using the FRS Framework to demonstrate how the decision matrix addresses subjectivity, transparency and “black box” issues in scoring, particularly with qualitative indicators, but also quantitative indicators. For clarity, the FRS Framework is briefly explained. Additional details about the FRS framework are available in other publications (Upadhyaya, 2013; Upadhyaya et al., 2018). This section outlines the decision criteria template for qualitative indicators and quantitative indicators, as well as the implementation of the FRS Framework in an example stormwater system in Windsor, Canada. Conclusions and recommendations are presented in the Using the Decision Criteria Template section.
The South Windsor (SW) area of the city is 633 ha and has a population of 22,996 serviced by a separate stormwater system built in 1960s. The 123 km separate storm sewer system was designed for a 1-in-5 years storm event. The network drains into Grand Marias drain, part of the Turkey creek, and was lined in concrete during the 1960s to rapidly remove stormwater from the area. Part of the storm sewer also drains into the adjacent areas through 21 outlets. Figure 1 shows the area. The system was assessed using FRS Framework. The 15 qualitative and 15 quantitative indicators are listed in Tables 1, 2.
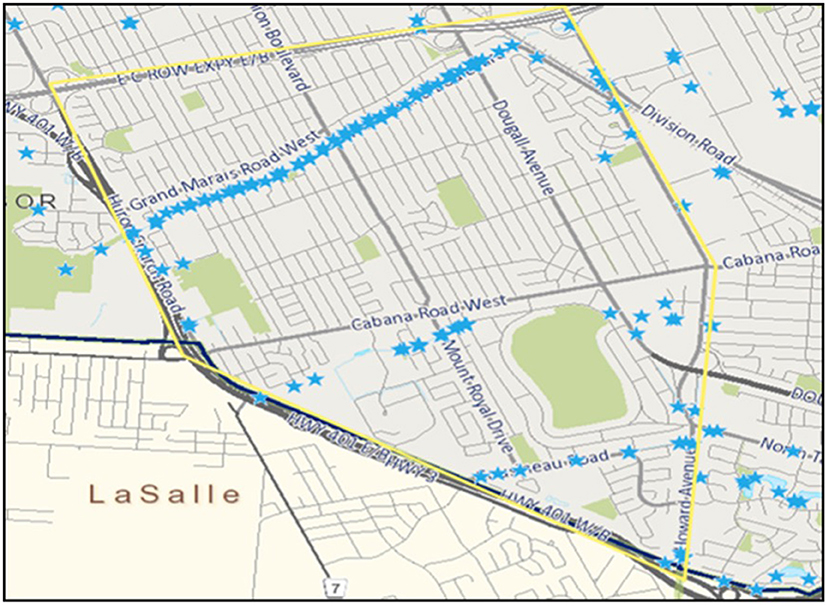
Figure 1. South windsor area.
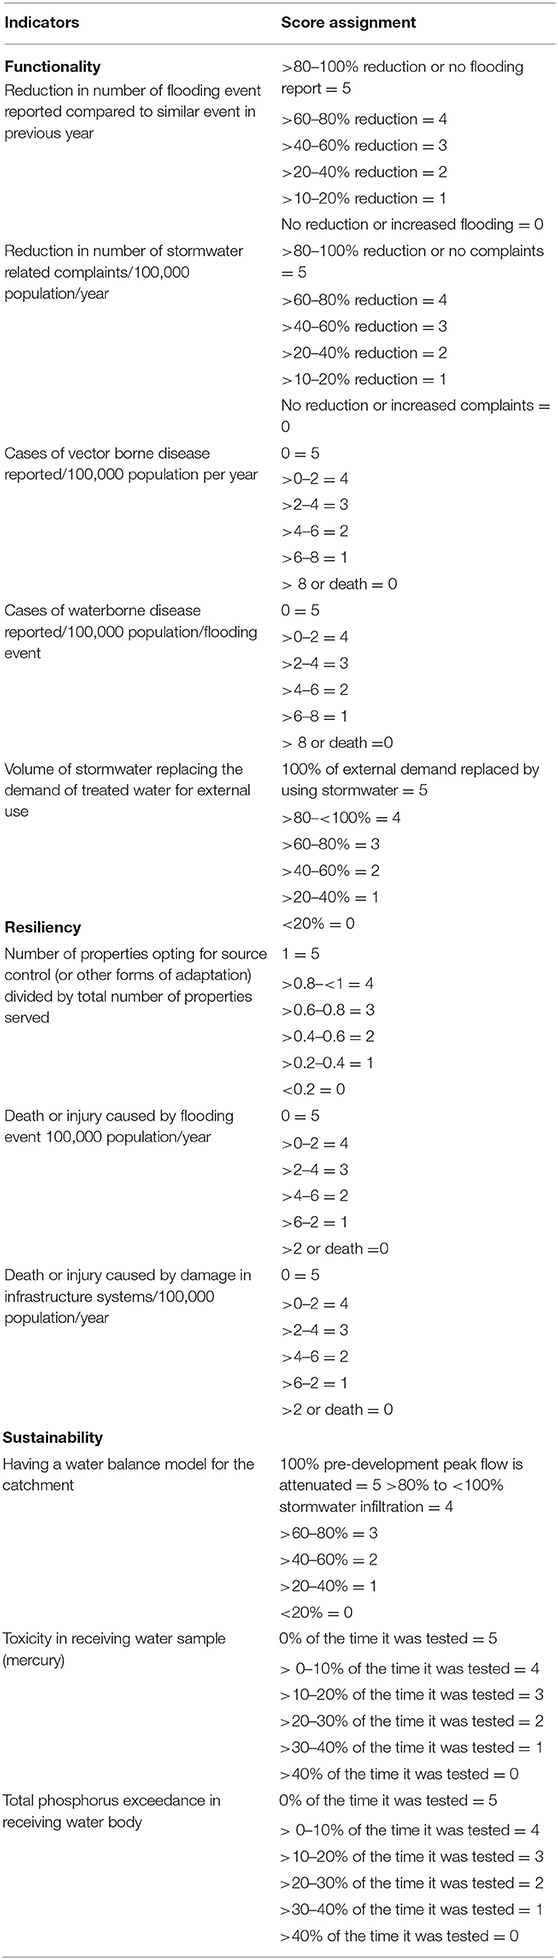
Table 2. Scoring guide for quantitative indicators.
The weights for each criterion indicated the relative importance, and the scores indicated how the individual indicators within the criteria performed. The respective indicator scoring templates for qualitative indicators and selected composite indicators are provided within Tables 1, 2 as explained previously.
Using The Decision Criteria Template
The criteria weights for resource (R), people's health and well-being (P) and change management (C) were derived by conducting a survey among professionals involved in municipal water management. On average, resources were weighted the highest, closely followed by change management and then public health. Normalizing the weights against the minimum of P resulted in the normalized weight values of 1.22, 1 and 1.04 for R, P and C respectively. The normalized weights were subdivided among the indicators. Scores were assigned according to the indicator scoring templates described earlier. The indicator weights and scores were then combined to produce individual indicator scores.
Indicator Decision Matrix Analysis for Qualitative Indicators
An interval scale ranging from 0 to 5—with 0 being worst and 5 being the best performance—and a detailed step-by-step decision process was developed as outlined in Table 1 for the following 17 indicators: 9 for functionality, 5 for resiliency, and 3 for sustainability. These include:
• Functionality: Monitoring of the demographic pattern; peak flow; change in impervious area; combined sewer replacement; type of revenue structure; lifecycle cost consideration for capital cost; lifecycle cost consideration for operation and maintenance (O&M); O&M activity with respect to level of service and research and innovation activity.
• Resiliency: Assessment of potential damage; assessment of reconstruction need; well-planned source control, conveyance and end-of-pipe measures for adaptation and mitigation, emergency response plan, and recovery plan.
• Sustainability: Continuously updated data and information system; transparent data and information sharing policy and actions undertaken to achieve sustainability goal are the main focus under sustainability. The indicator scoring analysis adopted for two of the indicators—having an advance data collection and information system, and transparent data and information sharing policy—are similar because it is assumed that the likelihood of sharing data with other parties is high only when there are well-recorded and managed data to assess.
Most of the scoring decision step is self-explanatory as shown in the table. Three of the indicators are composite indicators comprised of several factors and are intended to capture the cascading impacts on other infrastructure, for the environment and people's health: operation and maintenance (O&M) activity with respect to service level, assessment of potential damage and assessment of reconstruction need indicators.
For the operation and maintenance (O&M) activity with respect to service level—roadside ditch and drain maintenance, storm sewer clean-up and catch basin clean-up are considered as the three maintenance activities whereas the storm sewer length and number of storm sewer connections indicate the two underlying, actual level of service provided by the infrastructure. The detail scoring analysis provided in Table 1 was followed to assign a score for this indicator. The scores are based on what activities resulted in the improvement in any one or more of the service levels. Depending on the types of system, these indicators could be slightly different, and the user can include their chosen representative indicators in their assessment. For example, for a stormwater system having Integrated Stormwater Management (ISM) features such as rain garden or bioswales, the number of cleanups of these features can be another indicator for O&M activities in the O&M activity with respect to service level indicator. Similarly, for the assessment of potential damage indicator, physical damage to infrastructure, health impacts (both physical and psychological) on people, and environmental impacts are considered and analysis is based on how these indicators are considered in combination. How flooding subsequently affects other infrastructure systems such as roads, water supply and wastewater systems, gas, electricity, and so on is considered as physical damage. In addition to assessing the physical damage, environmental impacts and long-term health impacts on people are also crucial.
For the indicator assessment of reconstruction need three factors are considered for scoring: (1) assessing the physical infrastructure restoration and repair need; (2) public health need; and (3) environmental restoration need. For physical infrastructure, the restoration cost of the affected system, public spaces such as parks, playgrounds, and properties are considered. For public health need, the costs of health recovery (e.g., estimated medical costs) are considered. Similarly, the cost associated with debris clean up, garbage pickup, sampling, and monitoring of water quality after the event are considered for the environmental restoration. Depending on the combination of these three aspects, a score is assigned as shown in the table.
Obtaining the future costs may need employing future cost forecasting. Typically, municipalities or utilities managing the infrastructure have this information available from infrastructure lifecycle costing. It is important to understand that this framework and the indicators are forward-looking in nature, and all the data need identified here may not be conventionally monitored or considered. For example, the Federal Emergency Management Agency (FEMA) of the USA has conducted studies on the comprehensive costs of a flood event, and interested readers are directed to FEMA's website for further information.
While the peak flow, combined sewer replacement, change in impervious area, and lifecycle cost savings indicators are often quantifiable indicators, a scoring decision matrix analysis is still provided to capture the complexity from various scenarios. They are therefore grouped with qualitative indicators to better illustrate the process because of the comprehensive nature of such indicators.
Scoring for Quantitative Indicators
For quantitative indicators, scores were generally assigned in linear increments of 20% for performance except for the water quality related indicator. Divisions every 20% were considered appropriate given how common scales for interpretation are constructed along similar interval bands. For the toxicity and phosphorus indicators, because the water quality guidelines suggest a minimum of 40% of the samples comply with the respective guidelines/objectives (MOECC 2010), the number of samples exceeding the standard value more than 40% of the time was assigned a score of zero, and the remaining scores were linearly divided. Overall, there are 11 quantitative indicators: 5 for functionality, 3 for resiliency, and 3 for sustainability are adopted as listed with the scoring guide provided in Table 2. These include:
• Functionality: reduction in number of flooding event reported; reduction in number of complaints; cases of vector borne disease reported; cases of water borne disease reported; and volume of stormwater replacing the demand of treated water.
• Resiliency: number of properties opting for source control (or other forms of adaptation); death or injury caused by flooding event; and death and injury caused by damage in infrastructure.
• Sustainability: having a water balance model for the catchment; heavy metal toxicity in receiving water sample; and total phosphorus exceedance in receiving water body.
Assessment
Table 3 shows the calculations to determine how functional the stormwater system in South Windsor is using the three main criteria of resources (R), public health (P), and change management (C). Similarly, resiliency and sustainability of the South Windsor area were also evaluated.
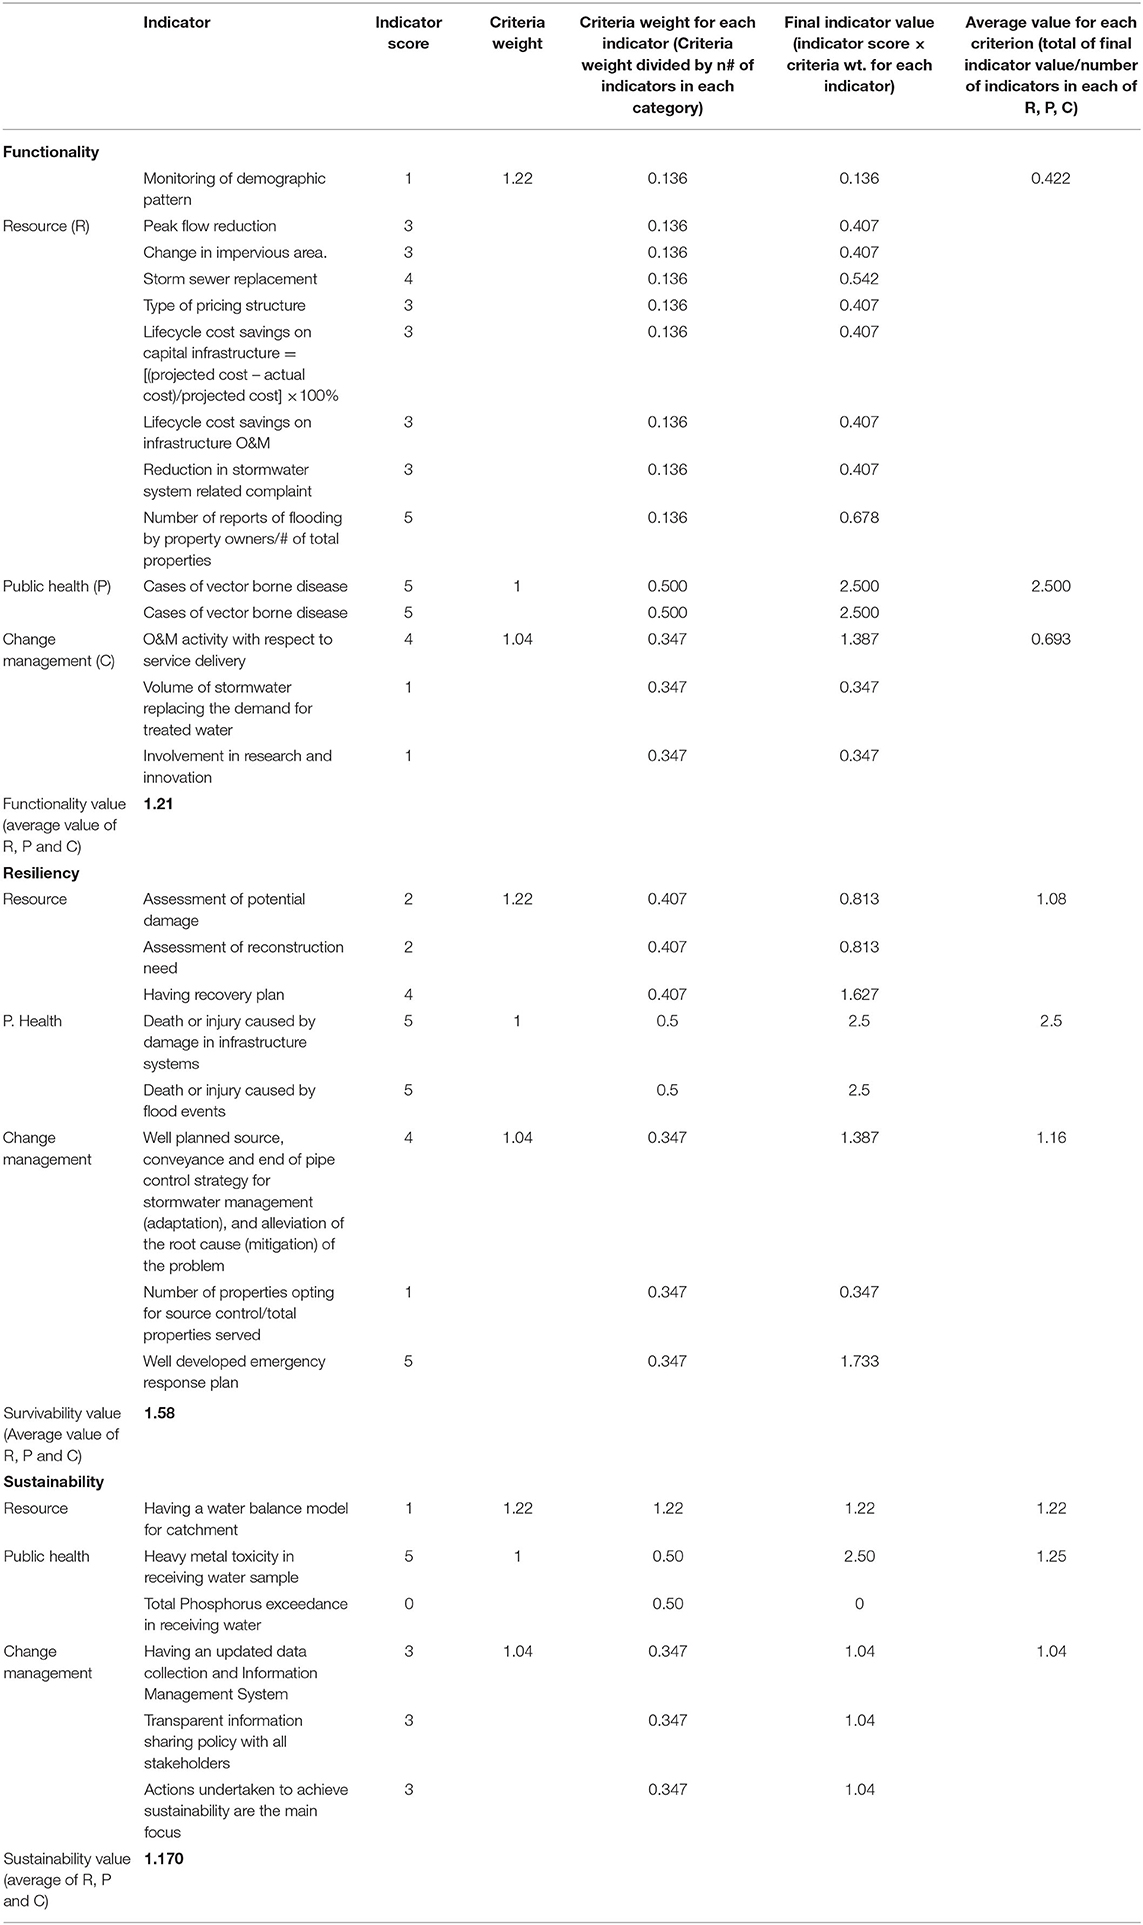
Table 3. FRS assessment of the South Windsor Stormwater System.
Specifically, the indicator value is calculated by multiplying the indicator score based on the scoring guideline with the individual indicator criteria weight of each R, P and C category. The average of the indicator value provided the average value of each R, P and C. This breakdown is also illustrated in Figure 2.
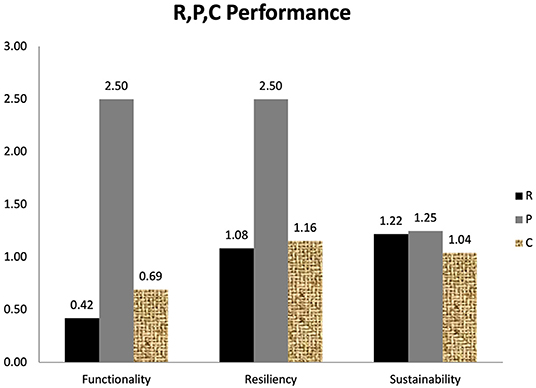
Figure 2. R, P, C scores of South Windsor Stormwater System.
The final value for each of the F, R and S categories are calculated by averaging the respective values of R, P and C as shown individually in Figure 2 prior to obtain three final values, one representing each of the system's functionality (F), resiliency (R), and sustainability (S). Although some detail is further lost by reducing the information to three values, the end result does represent a more efficient means to compare F, R, and S across systems or of the same system over time. These final values for a system's functionality, resiliency and sustainability of the system are shown in Figure 3.
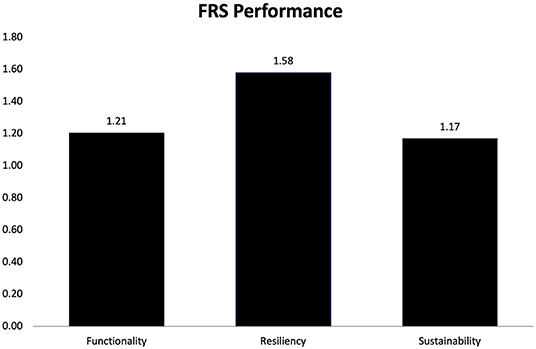
Figure 3. Final FRS results for South Windsor Stormwater System.
The results from this evaluation were well received by the municipality and it was indicated that beside the usefulness of the functionality, resiliency and sustainability assessment, the municipality will also consider the decision matrix analysis in public outreach and information sessions to showcase the complexity of stormwater system and need for greater community participation and emphasis on “soft paths” such as source control among others. The use of this decision matrix analysis therefore helps reduce the subjectivity and inconsistency in evaluating qualitative and complex indicators which are often omitted from assessments because they are perceived as being too difficult to measure. Moreover, the color coding in the decision matrix analysis table retains key elements of the rationale and decision process, while still aggregating the information into a numerical outcome. Updating and retaining these tables over time (e.g., annually) can therefore become a repository of information and provide institutional knowledge for future.
Conclusions and Recommendations
While the usefulness of addressing subjectivity associated with qualitative indicators has been recognized, a credible solution that is both comprehensive but workable on a practical level has been lacking. Much more detailed and complex approaches for including qualitative indicators exist but may require expertise or information that is not readily available nor widely embraced. However, ignoring such indicators however means that a meaningful but difficult-to-interpret amount of data is lost.
The main advantage of the decision matrix analysis presented is the structured stepwise process for guiding decision makers to arrive at a score for qualitative and complex indicators. The decision matrix analysis further provides a straightforward yet effective tool for decision makers for incorporating issues involving significant subjectivity. In the infrastructure sector, when there are many competing priorities, evolving challenges, and growing demands, using a template to assign score helps address the subjectivity in the decision process and renders the assessment more transparent, defensible, and consistent. Moreover, the presentation of how the information itself is presented and assessed is more readily understandable and useful for the assessor, decision-maker and by various stakeholders.
The decision matrix analysis can be a valuable tool for small and medium size municipalities which may not have the time, resources, or in-house expertise to use complex methods and tools to conduct independently derive custom values for assessing their infrastructure. The matrix for assessing the infrastructure system within the functionality-resiliency-sustainability (FRS) Framework should be applied periodically to reflect any changes over time to reveal a trend: is the infrastructure becoming more resilient and sustainable according to these more inclusive criteria, or is the infrastructure being overtaken by external events brought about by climate change or other forces?
Finally, the FRS Framework can be used to evaluate other types of infrastructure systems such as water-wastewater, transportation, buildings, and energy by modifying the decision matrix analysis to suit the specific parameters of any system.
Data Availability Statement
The raw data supporting the conclusions of this article will be made available by the authors, without undue reservation.
Author Contributions
JU is the principle author of the manuscript. NB and ET substantially contributed in the review, revision, edits and finalizing the manuscript for publication. All authors contributed to the article and approved the submitted version.
Funding
The research described in this manuscript has been partially supported by Canadian Water Network, and partially by Natural Science and Engineering Research Council of Canada (NSERC).
Conflict of Interest
The authors declare that the research was conducted in the absence of any commercial or financial relationships that could be construed as a potential conflict of interest.
Publisher's Note
All claims expressed in this article are solely those of the authors and do not necessarily represent those of their affiliated organizations, or those of the publisher, the editors and the reviewers. Any product that may be evaluated in this article, or claim that may be made by its manufacturer, is not guaranteed or endorsed by the publisher.
References
Alvarez-Guerra, M., Viguri, J. R., and Voulvoulis, N. (2009). A multicriteria-based methodology for site prioritization in sediment management. Environ. Int. 35, 920–930. doi: 10.1016/j.envint.2009.03.012
Argyroudis, S. A., Mitoulis, S. A., Hofer, L., Zanini, M. A., Tubaldi, E., and Frangopol, D. M. (2020). Resilience assessment framework for critical infrastructure in a multi-hazard environment: case study on transport assets. Sci. Total Environ. 714:136854. doi: 10.1016/j.scitotenv.2020.136854
Brito, M. M., and Evers, M. (2016). Multi-criteria decision-making for flood risk management: a survey of the current state of the art. Nat. Hazards Earth Syst. Sci. 16, 1019–1033. doi: 10.5194/nhess-16-1019-2016
Cinneli, M., Coles, S. R., and Kirwan, K. (2014). Analysis of the potentials of multi criteria decision analysis method to conduct sustainability assessment. Ecol. Indic. 46, 138–148. doi: 10.1016/j.ecolind.2014.06.011
Galarza-Molina, S. L., Torres, A., Moura, P., and Lara-Borrero, J. (2015). CRIDE: a case study in multi-criteria analysis for decision-making support in rainwater harvesting. Int. J. Inf. Technol. Decis. Mak. 14, 43–67. doi: 10.1142/S0219622014500862
Hajkowicz, S., and Collins, K. (2007). A review of multiple criteria analysis for water resource planning and management. Water Resource Manage. 21, 1553–1566. doi: 10.1007/s11269-006-9112-5
Huang, I. B., Keisler, J., and Linkov, I. (2011). Multi-criteria decision analysis in environmental sciences: ten years of applications and trends. Sci. Total Environ. 409, 3578–3594. doi: 10.1016/j.scitotenv.2011.06.022
Jia, H., Yao, H., Tang, Y., Yu, S. L., Zhen, J. X., and Lu, Y. (2013). Development of a multi criteria index ranking system for urban runoff best management practices (BMPs) selection. Environ. Monitor. Assess. 185, 7915–7933. doi: 10.1007/s10661-013-3144-0
Kabir, G., Sadiq, R., and Tesfamariam, S. (2014). A review of multi-criteria decision-making methods for infrastructure management. Struct. Infrastruct. Eng. 10, 1176–1210. doi: 10.1080/15732479.2013.795978
Kangas, D. (2016). Evaluating stormwater management techniques for dense urban areas using multi-criteria decision analysis (Masters thesis). Chalmers University of Technology, Gotherberg, Sweden.
Lai, E., Lundie, S., and Ashbolt, N. J. (2008). Review of multi-criteria decision aid for integrated sustainability assessment of urban water systems. Urban Water J. 5, 315-327. doi: 10.1080/15730620802041038
Lounis, Z., and McAllister, T. (2016). Risk-based decision making for sustainable and resilient infrastructure systems. J. Struct. Eng. 142:F4016005. doi: 10.1061/(ASCE)ST.1943-541X.0001545
Martin, C., Ruperd, Y., and Legret, M. (2007). Urban stormwater drainage management: the development of a multicriteria decision aid approach for best management practices. Eur. J. Oper. Res. 181, 338–349. doi: 10.1016/j.ejor.2006.06.019
Rasa, E. (2009). Multi-criteria decision based evaluation of municipal infrastructure projects (M.A.Sc. thesis). University of British Columbia.
Rehak, D., Senovsky, P., Hromada, M., and Lovecek, T. (2019). Complex approach to assessing resilience of critical infrastructure elements. Int. J. Critic. Infrastruct. Protect. 25, 125–138. doi: 10.1016/j.ijcip.2019.03.003
Steele, K., Carmel, Y., Cross, J., and Willcox, C. (2008). Uses and Misuses of Multi-Criteria Decision Analysis (MCDA) in Environmental Decision-Making: Evaluation and Development of Formal Consensus; Methods for Adding Robustness to Multi-Criteria Decision Analysis, Australian Center of Excellence for Risk Analysis (ACERA) Report 0607 and 0610. ACERA, Australia.
Suresh, B., James, B. J., and Jegathambal, P. (2016). A critical review of multi criteria decision making methods for infrastructure planning and sustainability assessment of infrastructure projects. Int. J. Earth Sci. Eng. 9, 109–123.
The Association of Consulting Engineering Companies Canada (ACEC) the Canadian Construction Association (CCA), the Canadian Parks and Recreation Association (CPRA), the Canadian Public Works Association (CPWA), the Canadian Society for Civil Engineering (CSCE), the Canadian Urban Transit Association (CUTA), the Canadian Network of Asset Managers (CNAM), and the Federation of Canadian Municipalities (FCM). (2019). Monitoring the State of Canada's Core Public Infrastructure: The Canadian Infrastructure Report Card 2019.
Upadhyaya, J. K. (2013). A Sustainability Assessment Framework for Infrastructure: Application in Stormwater System. Doctoral Dissertation, University of Windsor, Canada.
Upadhyaya, J. K., Biswas, N., and Tam, E. K. L. (2014). A review of infrastructure challenges: assessing stormwater system sustainability. Can. J. Civil Eng. 41, 483–492. doi: 10.1139/cjce-2013-0430
Upadhyaya, J. K., Biswas, N., and Tam, E. K. L. (2018). Managing for change: integrating functionality, resiliency and sustainability for stormwater infrastructure. J. Infrastruct. Syst. 24:04018007. doi: 10.1061/(ASCE)IS.1943-555X.0000420
Upadhyaya, J. K., and Moore, G. (2012). Sustainability indicators for wastewater reuse systems and their application to two small systems in rural Victoria, Australia. Can. J. Civil Eng. 39, 674–688. doi: 10.1139/l2012-057
Keywords: infrastructure, assessment, qualitative indicators, functionality, resiliency, sustainability, stormwater
Citation: Upadhyaya JK, Biswas N and Tam EKL (2021) Using Qualitative Indicators in Infrastructure Assessment Using the Functionality–Resiliency–Sustainability Framework. Front. Sustain. Cities 3:746537. doi: 10.3389/frsc.2021.746537
Received: 24 July 2021; Accepted: 24 September 2021;
Published: 04 November 2021.
Edited by:
Golam Kabir, University of Regina, CanadaReviewed by:
Subhrajit Dutta, National Institute of Technology, Silchar, IndiaHusnain Haider, Qassim University, Saudi Arabia
Copyright © 2021 Upadhyaya, Biswas and Tam. This is an open-access article distributed under the terms of the Creative Commons Attribution License (CC BY). The use, distribution or reproduction in other forums is permitted, provided the original author(s) and the copyright owner(s) are credited and that the original publication in this journal is cited, in accordance with accepted academic practice. No use, distribution or reproduction is permitted which does not comply with these terms.
*Correspondence: Jyoti Kumari Upadhyaya, anlvdGl1cEBnbWFpbC5jb20=