Abstract
The paper describes a case study on the design of district energy infrastructure for the green-field project of the Vale de Santo António (Lisbon, Portugal). The methodology is based on a novel framework built on the sequential integration of three software tools: QGIS, City Energy Analyst (CEA) and Urbio. QGIS is used to define the building database (construction solutions, uses and schedules); CEA is used to model the neighborhood energy services (heating, cooling, domestic hot water and electricity, including for EVs); and Urbio is used to design the energy infrastructure to supply the neighborhood in an optimal manner. The study illustrates the high impact of building renovation on heat demand and the existing potential for a two-layout network to minimize pumping demand and heat distribution loss. Moreover, a sensitivity analysis with regard to future carbon tax changes and electricity greening concludes that an electricity-based heating mix is optimal.
Introduction
More than half the global population lives in cities; the UN forecasts this number will grow by an extra 2 million city dwellers per week (UN Department of Economic Social Affairs, 2018). Even so, cities already account for two-thirds of world energy consumption and more than 70% of global CO2 emissions, from which over half comes from buildings' energy use (C40 cities, 2020). As a result, many cities have centered their emission reduction policies on energy efficiency programs aimed at the building sector (Caputo and Pasetti, 2015). As part of these, improved urban energy supply stands out as an essential component (Cajot et al., 2017).
In this context, new tools for urban building energy modeling (UBEM) have been developed and used to optimize the neighbourhoods' energy potential (Moghadam et al., 2017; Ferrando et al., 2020; Sola et al., 2020). They combine detailed and reliable individual building energy models (BEM) with regional and country-level building stock models (Mata et al., 2014; Reinhart and Davila, 2016). In contrast with simple agglomeration of individual BEMs, the cross-influence of micro-climate, long-wave radiation, shade, etc., needs to be included (Li et al., 2017). Additionally, the potential for shared energy infrastructure can be modeled using geographic information systems (GIS) integrating the location of buildings (Allegrini et al., 2015; Fonseca et al., 2016). The impact on energy consumption from targeted building retrofits, upgrades to heating, ventilation or air-conditioning (HVAC) systems, or changes in the behavior of occupants can then be assessed efficiently through this service-based model structure (Shimoda et al., 2004; Frayssinet et al., 2017). As a result, these tools enable the design and simulation of multiple scenarios, thus providing useful material for decision-makers to decide on optimal intervention programs considering financial, environmental, and energy criteria (Gomes et al., 2018; Mourão et al., 2019).
Previous case-studies have helped highlight common elements required for successful UBEM projects (Hong et al., 2020), including a seamless workflow and a strong collaboration between stakeholders. This paper provides a new methodology for combining existing tools into an encompassing framework able to leverage each software's specific strengths, as well as it showcases a concrete example of cross-sector collaboration between urbanists (Lisbon Municipality), researchers (IN+ Center and EPFL) and developers / consultants (CEA and Urbio designers). The spreading of frameworks and methodologies, and their application through use-cases contribute to the shift toward increased interoperability between tools, and the alignment on formats and models required for accelerating the adoption of UBEM and ensuring a high societal impact.
Methodology
In the context of the urban development plan for the neighborhood of the Vale de Santo António (VSA) set in Lisbon, a new framework built on UBEM tools was developed to test multiple district energy infrastructure scenarios (de Santo António et al., 2016).
Case Study Description
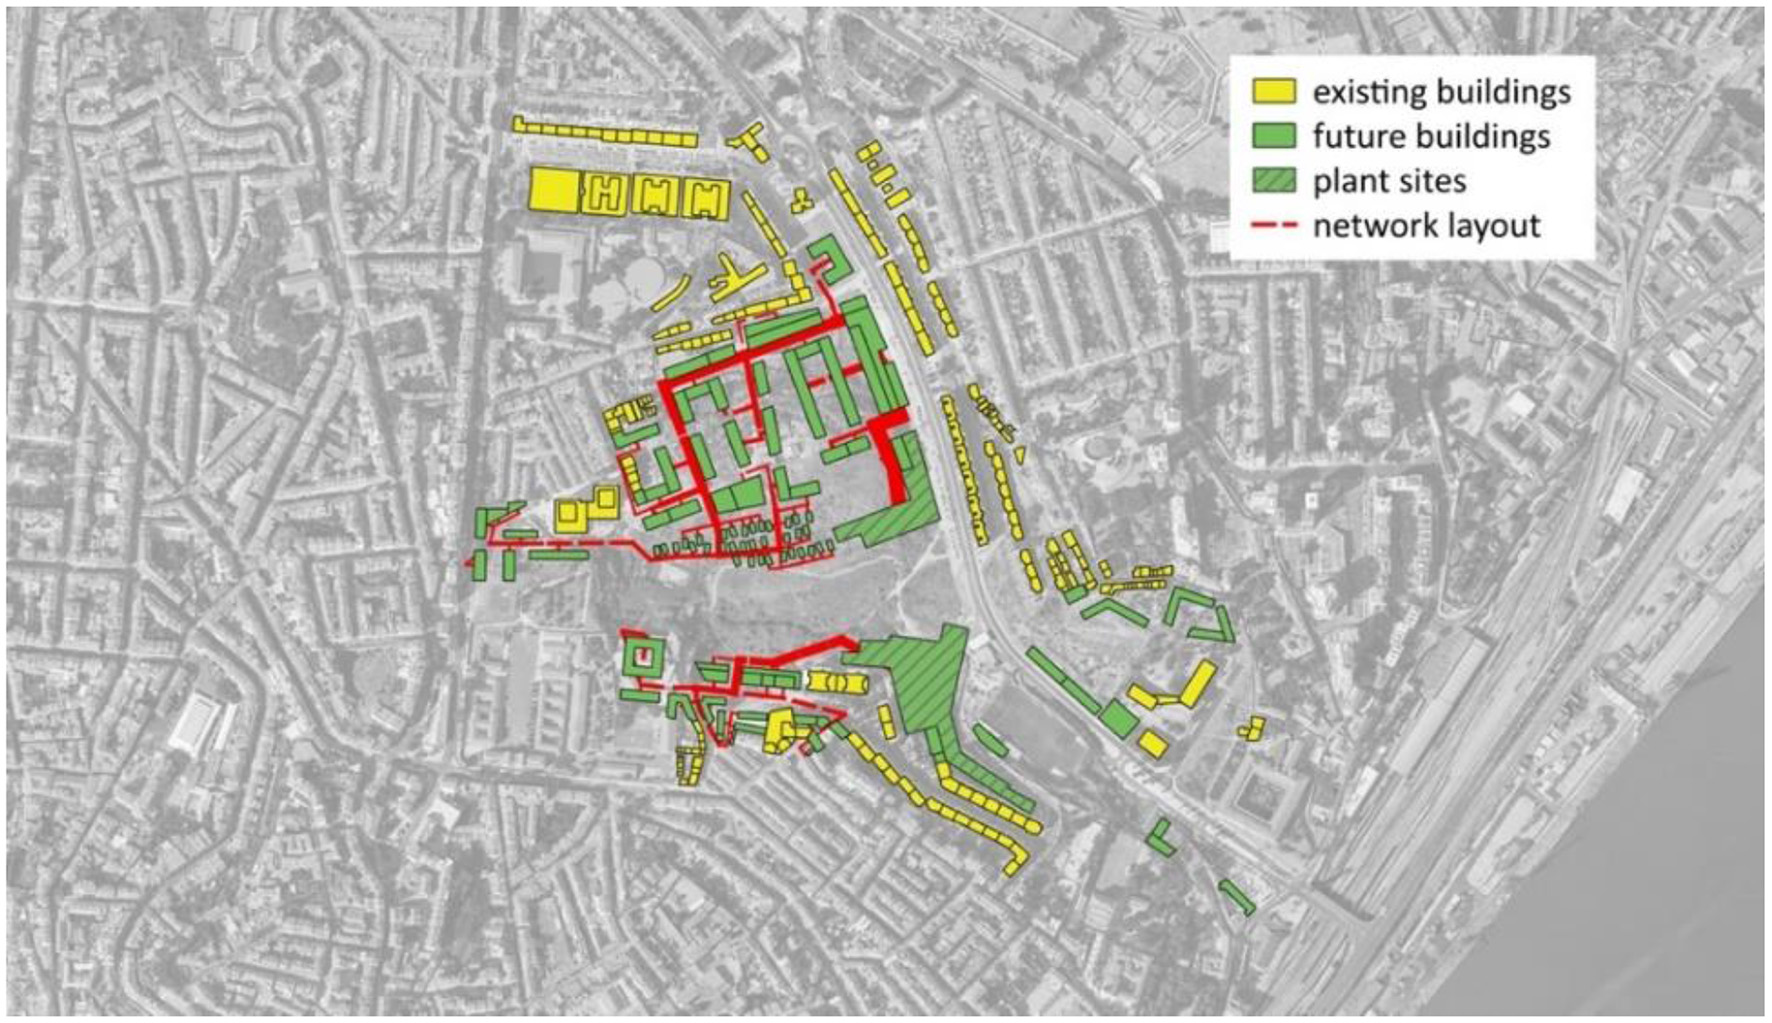
The VSA urban development plan foresees the construction of mostly residential buildings (80% of floor space) with an overall capacity of around 2,500 dwellings ranging from single-household units to multi-story buildings. The remaining floor space will be shared between businesses and public services. The proposed building distribution within the VSA is shown in Figure 1. The neighborhood energy infrastructure may be extended to include existing buildings immediately surrounding the project area.
Figure 1
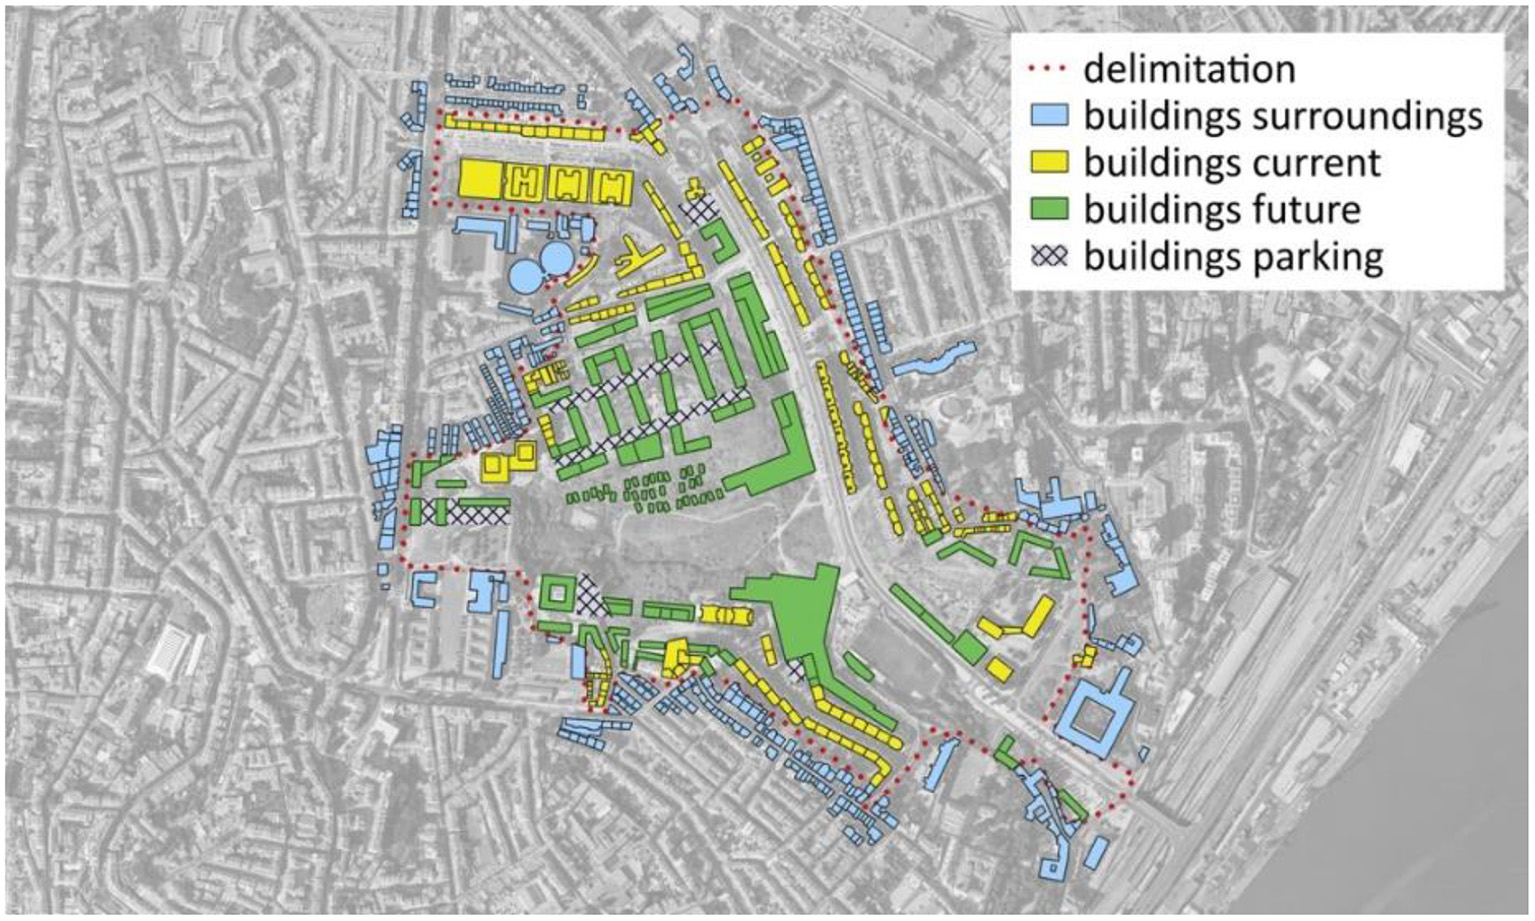
VSA buildings layer.
Framework
For the project, three software tools—QGIS, CEA and Urbio—were used sequentially (Figure 2). This framework responds to the lack of building stock and consumption data by generating, as faithfully as possible, all missing inputs for the modeling of energy infrastructure, and the evaluation of the impact of different intervention scenarios at urban-scale.
Figure 2
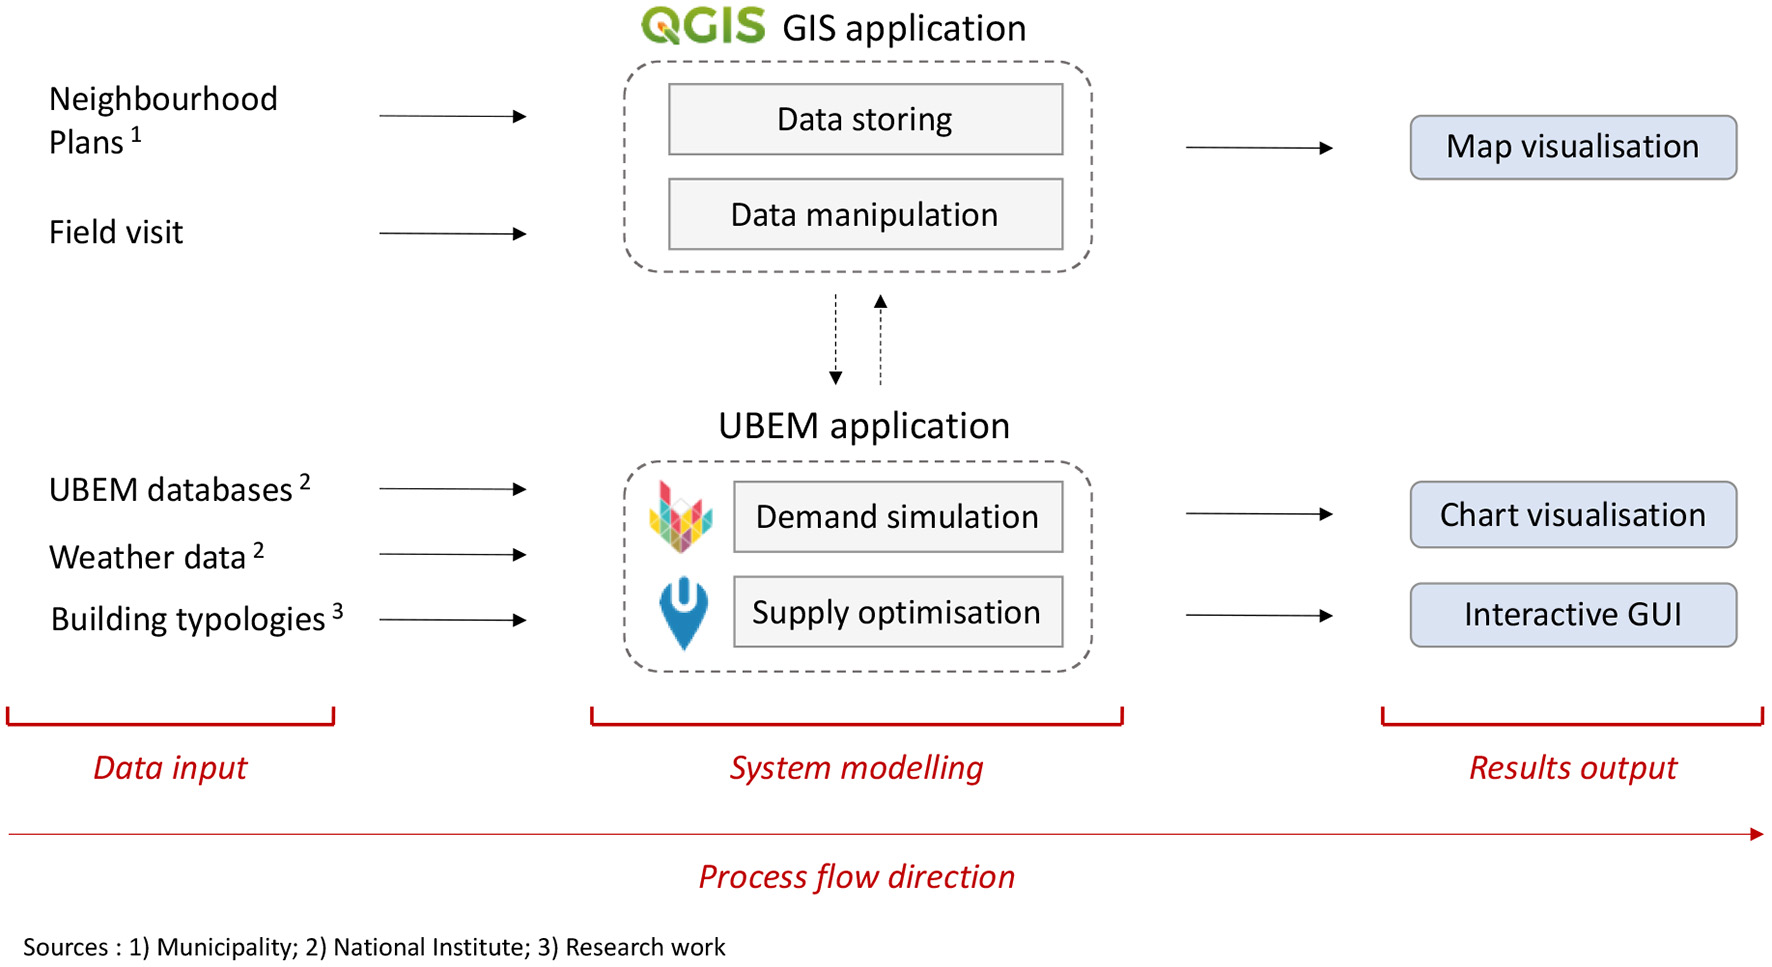
The entire framework (incl. QGIS, CEA for demand simulation & Urbio for supply optimisation). Source: (1) Municipality; (2) National Institute; (3) Research Work.
Outcomes
The VSA project is defined in terms of the building stock and behavior of the occupants. The VSA is composed of existing and future buildings. The existing buildings already exist and are mainly residential with low thermal insulated solutions. The new buildings represent building stock projected by the municipality for the central area for the next decades, including both residential and services buildings with better thermal and comfort standards. Unlike future buildings, the energy consumption of the existing buildings is expected to evolve as a result of increasing financial resources and living standards, which will close the current energy gap (the difference between estimated and real energy consumption).
Portugal has one of the lowest energy consumption for building acclimatization in Europe, especially in the residential sector. This is related to both high energy prices, cultural habits, low income (Simões et al., 2016). The Portuguese government, through the Long-Term Strategy for Building Renovation (República Portuguesa, 2020), aims to meet the European and national objectives to achieve carbon neutrality, promote the energy efficiency of existing buildings and improving thermal comfort. Having this in mind, three scenarios were defined to reflect the Portuguese reality, the Restricted scenario (reflecting the reality today), Comfort (acceptable thermal comfort) and CEA default (implies higher comfort standard values). They are summarized in Figure 3.
Figure 3
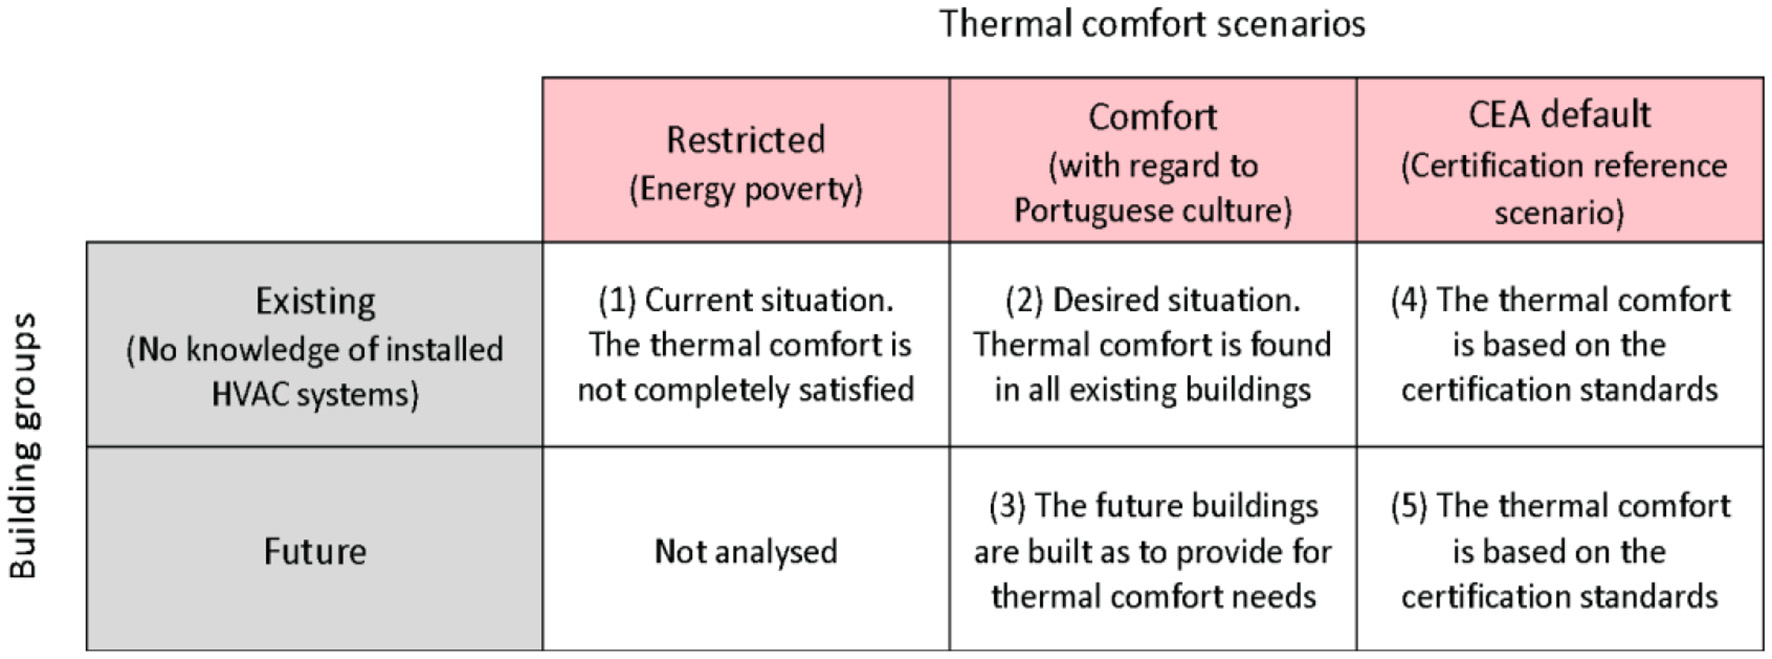
Building stock and thermal comfort scenarios' overview.
Three output sets were defined based on current knowledge about the VSA and by using the capabilities of the proposed framework. These provided well-founded and diverse information to stakeholders for final decision making on the energy supply system to be installed. The output sets were:
-
Comparison of energy demand with CEA between restricted, comfort and CEA default scenarios for existing and future buildings.
-
Comparison of thermal network designs with CEA for future buildings.
-
Energy infrastructure scenarios with Urbio for future buildings.
Data Collection and Generation
Context Data
The generation of future energy infrastructure scenarios is driven by an optimisation process. The optimisation process can rely on financial, environmental or energy cost functions. To align the cost functions with the local reality, data on fuels were collected including prices, the renewable energy source (RES) share, carbon intensity (CI) and the primary energy factor (PEF). The fuels considered were electricity, natural gas, hot water via district heating, and wood chips (pellets). A distinction is made between the price at which the inhabitants can buy their electricity from energy providers and at which they are remunerated for injecting electricity in the grid (notably produced from solar panels) (Tables 1, 2).
Table 1
| Carrier | Unit | Value | References |
|---|---|---|---|
| Electricity (buy) | €/kWh | 0.215 | Pordata, 2020b |
| Electricity (sell) | €/kWh | 0.095 | Diário da República, 2018 |
| Natural Gas | €/kWh | 0.091 | Pordata, 2020a |
| Hot water | €/kWh | 0.039 | Climaespaço, 2019 |
| Wood chips | €/kWh | 0.061 | Urbio, 2020 |
Energy carrier prices.
Table 2
| Carrier | PEF [-] | GHG emissions [kgCO2eq/kWh] | RES share [%] | References |
|---|---|---|---|---|
| Electricity | 2.5 | 0.144 | 52 | Direção Geral da Energie e Geologia, 2013; Rede Elétrica Nacional, 2019 |
| Natural gas | 1.11 | 0.202 | 0 | Direção Geral da Energie e Geologia, 2013 |
| Wood chips | 0.06 | 0.0108 | 100 | Direção Geral da Energie e Geologia, 2013 |
Fuel characteristics.
The RES share, the CI and the PEF for fuels permit different objectives to be achieved, such as the maximization of renewable energies, the minimization of emissions or the optimisation of energy efficiency. Where available, values were sourced from the national department for energy (Direção Geral da Energie e Geologia, 2013).
Building Data
Given the lack of building-specific data, archetypes with reference parameter values were assigned. This was found to provide a useful approach for descriptive data generation. Each archetype either defined a construction standard or an occupancy type. The construction standard focuses on the envelope characteristics of the building, HVAC systems and their corresponding supply, while the occupancy type details the level of indoor comfort, the internal loads, the occupancy schedule and the HVAC operational modes. Together, a construction standard and an occupancy type defines a unique building typology.
In the case of the VSA, the construction standards of the existing buildings were defined by the year of construction, using the Portuguese building stock research projects (Pinto, 2005; Vasconcelos et al., 2015; Gouveia et al., 2018; Sousa, 2018). For occupancy types, the VSA buildings were grouped between residential, utility and service buildings.
Energy Demand Simulation
Thermal Comfort Scenarios
Given the uncertainty on the current status and future development of space heating and cooling systems, two different thermal comfort scenarios were designed and tested for the existing residential buildings: the restricted and the comfort scenario. Both scenarios were based on analyses comparing real consumption data with theoretical simulations (Ferreira, 2017; Palma et al., 2019). These scenarios represent thermal comfort under culturally distinct heating and cooling traditions (Gouveia et al., 2012; Magalhães, 2016). Only the comfort scenario was used to model the energy consumption for future buildings in the VSA development. All remaining occupancy types were assigned the default thermal comfort scenarios from CEA. The distribution of thermal comfort scenarios within the building stock for the VSA is illustrated in Figure 4.
Figure 4
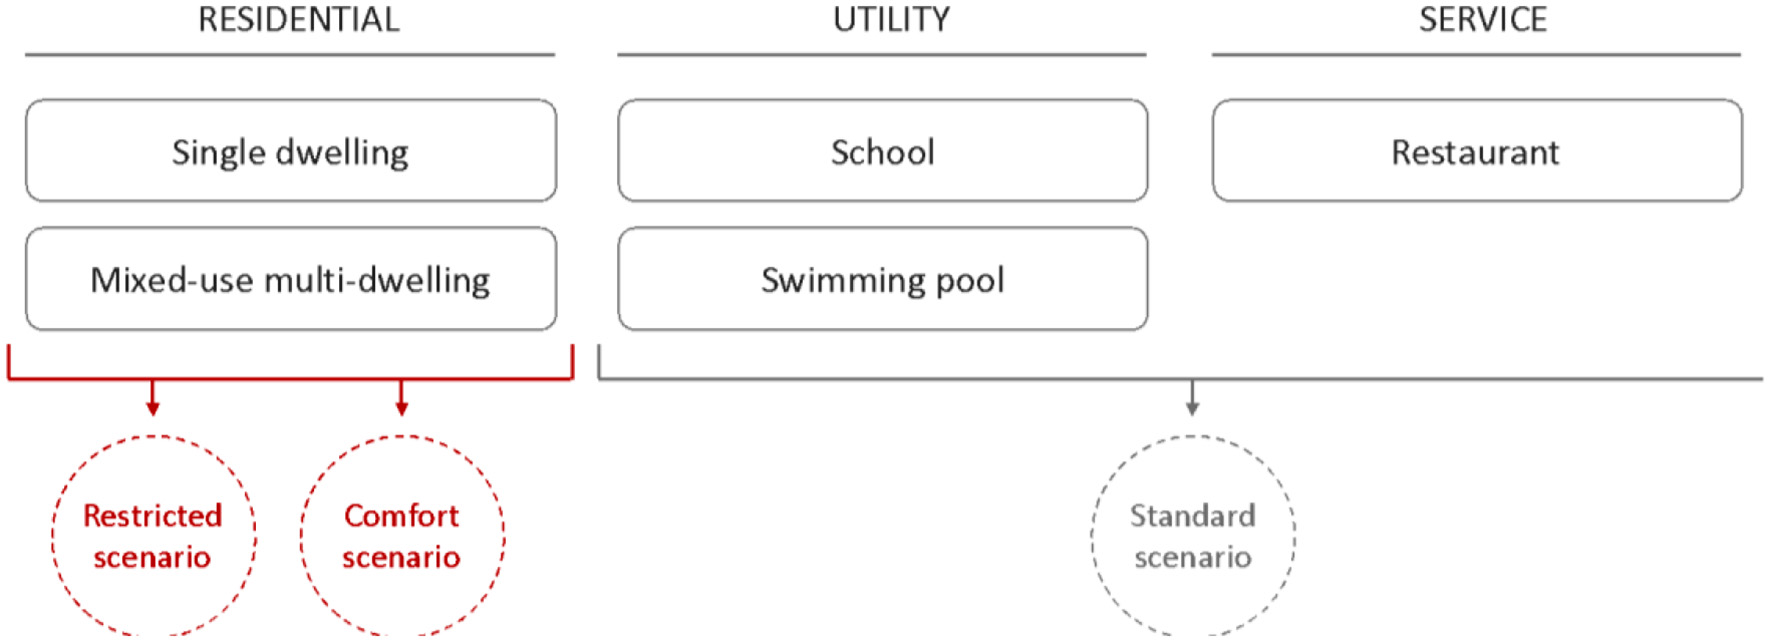
Thermal comfort scenarios.
The thermal comfort scenarios were defined using the parameters in CEA. A distinction was made between active and inactive people to model the presence of inhabitants at home. The parameters are shown in Table 3.
Table 3
| Restricted scenario | Comfort scenario | |||||||
|---|---|---|---|---|---|---|---|---|
| Heating | Cooling | Heating | Cooling | |||||
| Installation share | 90% | 20% | 100% | 100% | ||||
| Conditioned area | 12.5% | 12.5% | 25% | 25% | ||||
| Setpoint/setback temperature | 18/16°C | 25/30°C | 18/16°C | 25/30°C | ||||
| Setpoint period | 13–15 h 19–21 h |
Inactive All users |
13–15 h 19–21 h |
Inactive All users |
13–15 h 19–23 h |
Inactive All users |
12–15 h 19–22 h |
Inactive All users |
| Off time period | Weekday Night |
Active All users |
Weekday Night |
Active All users |
Weekday | Active | Weekday | Active |
VSA thermal scenarios parametrisation.
Electric Vehicles
Several assumptions were required to predict the power demand from the EV passenger fleet for future buildings in the VSA. Given the rapid growth expected for this passenger fleet, more parking spaces will need to be equipped for charging. The corresponding electricity demand was based on the forecast conditions for the year 2030.
By 2030, the world EV passenger fleet is forecast to grow from 16 million vehicles in 2020 to 210 million vehicles in 2030, divided one-third hybrid (PHEV) and two-thirds battery (BEV) powered vehicles (IEA, 2019). Based on 2020 levels (European Commission, 2020), such an increase would correspond to a total penetration of 13.5% for a fixed-size fleet in Portugal. A similar ratio of BEV and PHEV was assumed.
An average daily distance 40 km/day per car was assumed for residents of Lisbon (Santiago, 2016). While the entire distance is supplied by electricity for BEVs, this share was assumed to be only 50% for the PHEVs.
Even though the efficiency per km differs between PHEV and BEV vehicles, due to the respective size of batteries and motors, a unique efficiency of 0.2 kWh/km was assumed for all EV cars. This efficiency corresponds to the stated average efficiency for electric vehicles currently being sold (E-Cube, 2019).
In the urban development plan, one parking place is provided per household and it was assumed that this corresponds to the car of a resident. The main outcomes from this assessment are summarized in Table 4.
Table 4
| Parameters | Unit | Value |
|---|---|---|
| Residential cars | – | 2,466 |
| BEV cars | – | 222 |
| PHEV cars | – | 111 |
| Total daily electrical demand | MWh/d | 4 |
| Total annual electrical demand | MWh/y | 1,458 |
VSA estimated EV charging requirements for 2030.
Energy Demand Comparison
Two main spatial scales, those of buildings and district, were considered when comparing scenarios for the VSA. Firstly, the scenarios can be compared at the building level. At such level, it is easier to gain a rapid understanding of the interaction between the building characteristics and the scenarios. The methods benefits from comparing the effects of the scenarios on buildings with varied characteristics. Once these insights have been gathered, the user can better perceive the underlying phenomena at the scale of the district.
Building Scale
The energy demand for two existing building types (single and multi-family) and one future building type were compared for each scenario as shown in Table 5.
Table 5
| Characteristics | Building E1 | Building E2 | Building F1 |
|---|---|---|---|
| Building stock | Existing | Existing | Future |
| Number of floors | 1 | 15 | 8 |
| Construction period | 1920–1945 | 1990–2005 | – |
Sample buildings characteristics.
Building type E1 is a single-dwelling unit for which the total energy demand is strongly influenced by space heating and thermal comfort scenario. The CEA default scenario depicts an unrealistic situation where 75% of the end-use energy demand is related to space heating. Depending on whether the comfort or restricted scenario is considered, this percentage is reduced from 40% to <20%. The restricted and comfort scenarios represent realistic lower and upper bounds for the buildings in the VSA as shown in Figure 5 which includes the energy demand from a comparable reference Portuguese dwelling (Fonseca, 2015; Eurostat, 2020).
Figure 5
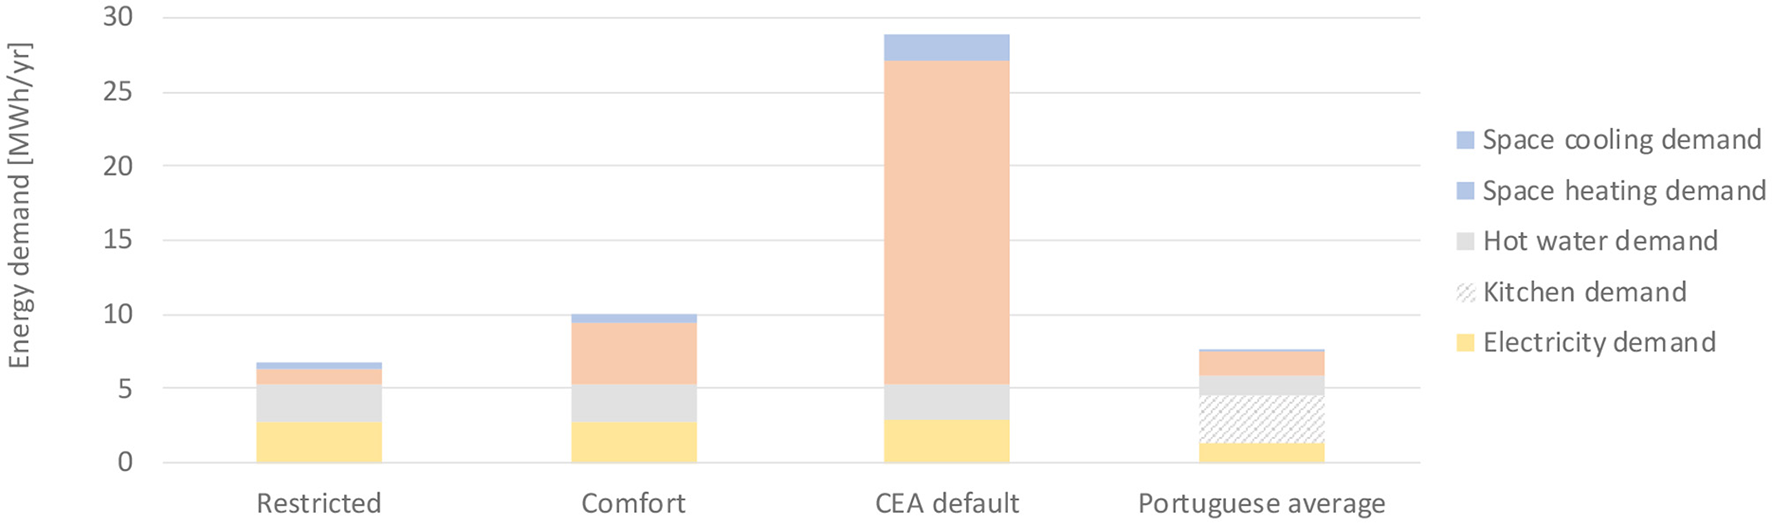
E1 energy demand per end-use.
The energy demand intensity acts as a normalizing measure to compare the energy demand of buildings with different floor area and heights. The impact of insulation on energy demand for space heating—where highly insulated buildings have lower final heat demand—accounts for most of the difference in energy demand intensity between building types E1, E2, and F1, as shown in Figure 6.
Figure 6
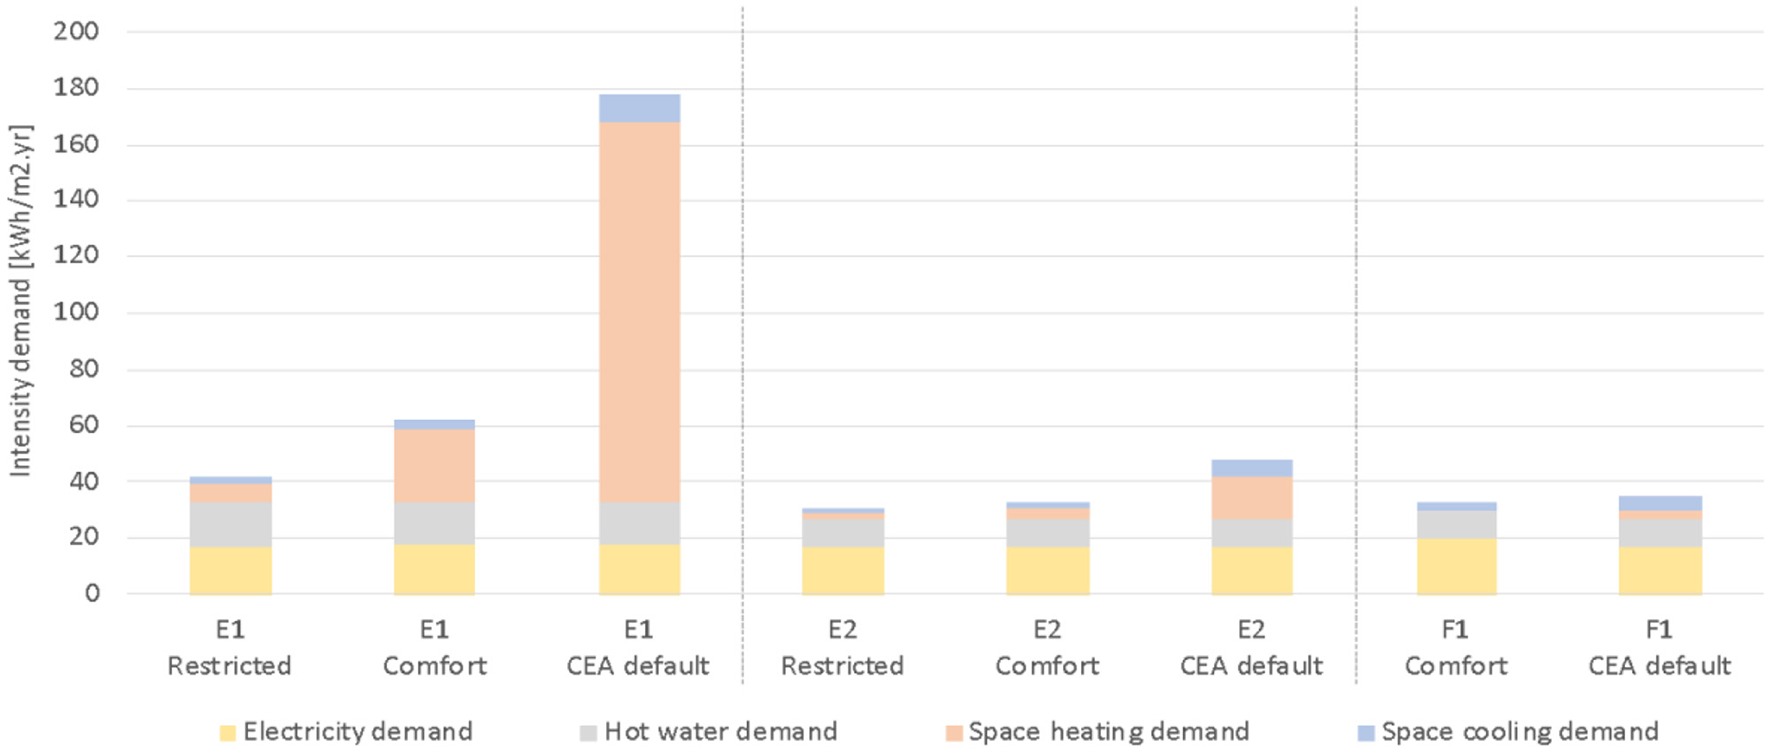
Energy demand intensity per end-uses for selected buildings.
Renovation of the exterior envelope of an old building to current standards reduces the total energy demand of the building by about 15%, while simultaneously improving the thermal comfort for its inhabitants, as has been documented and observed in different EU countries (Haas and Biermayr, 2000; Sunikka-Blank and Galvin, 2012). Studies show that occupants adapt their thermal comfort choice with the level of building insulation, resulting in under consumption before building renovation and a subsequent increase in comfort level after renovation.
District Level
For future buildings, the demand from EVs in 2030 represents more than 20% of the total electricity demand. However, EV demand in the future may be flexible if power consumption can be adapted depending on the availability of power from renewable sources.
Two synergies for VSA should be highlighted. First, pool heating occurs during opening hours while residential DHW demand takes place mostly in the early morning or at night. Second, since space cooling demand occurs during the summer while DHW demand happens all year round, the cold and heat supply can be balanced daily during the summer for the future VSA district. Both synergies should be taken into account when designing the thermal supply systems, particularly for district-scale use.
Thermal Network Layout Optimization
Layout Design
Until recently, thermal networks were only applied for district heating purposes. However, district networks are also now installed for district cooling as well, although these remain marginal compared to district heating systems.
In the scope of the VSA, three sets of buildings were defined to analyse the district heating and cooling (DHC) network performance. This three-layout methodology has the aim to provide decision makers with information about the alternatives for layout and building connections (Figure 7).
Figure 7
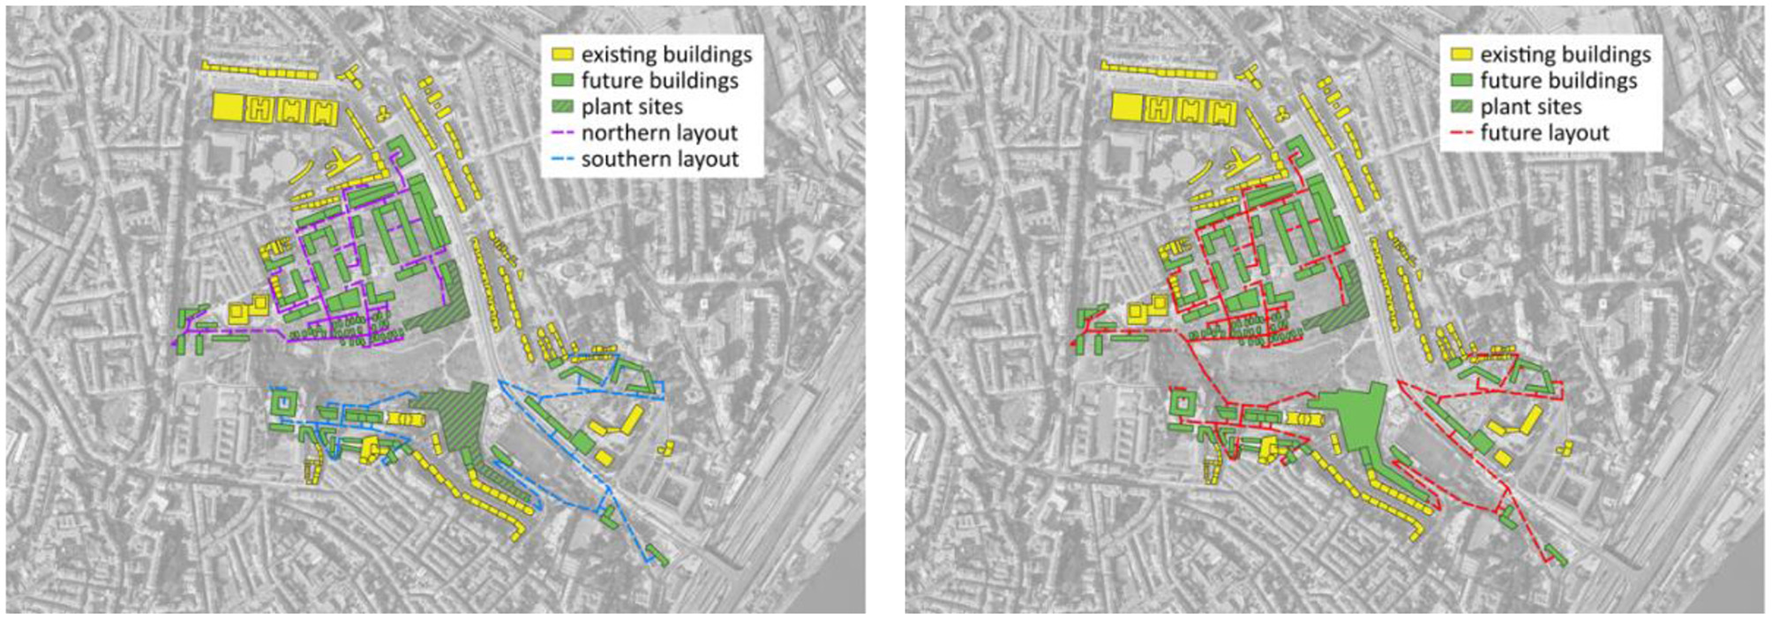
Northern, southern and future layouts.
CEA is used to design the thermal network layouts connecting each set of buildings. As shown in Figure 8, the northern layout reaches the highest linear heat density, i.e., total heat demand divided by total length of pipes. The southern layout requires many pipes for only a small energy supply.
Figure 8
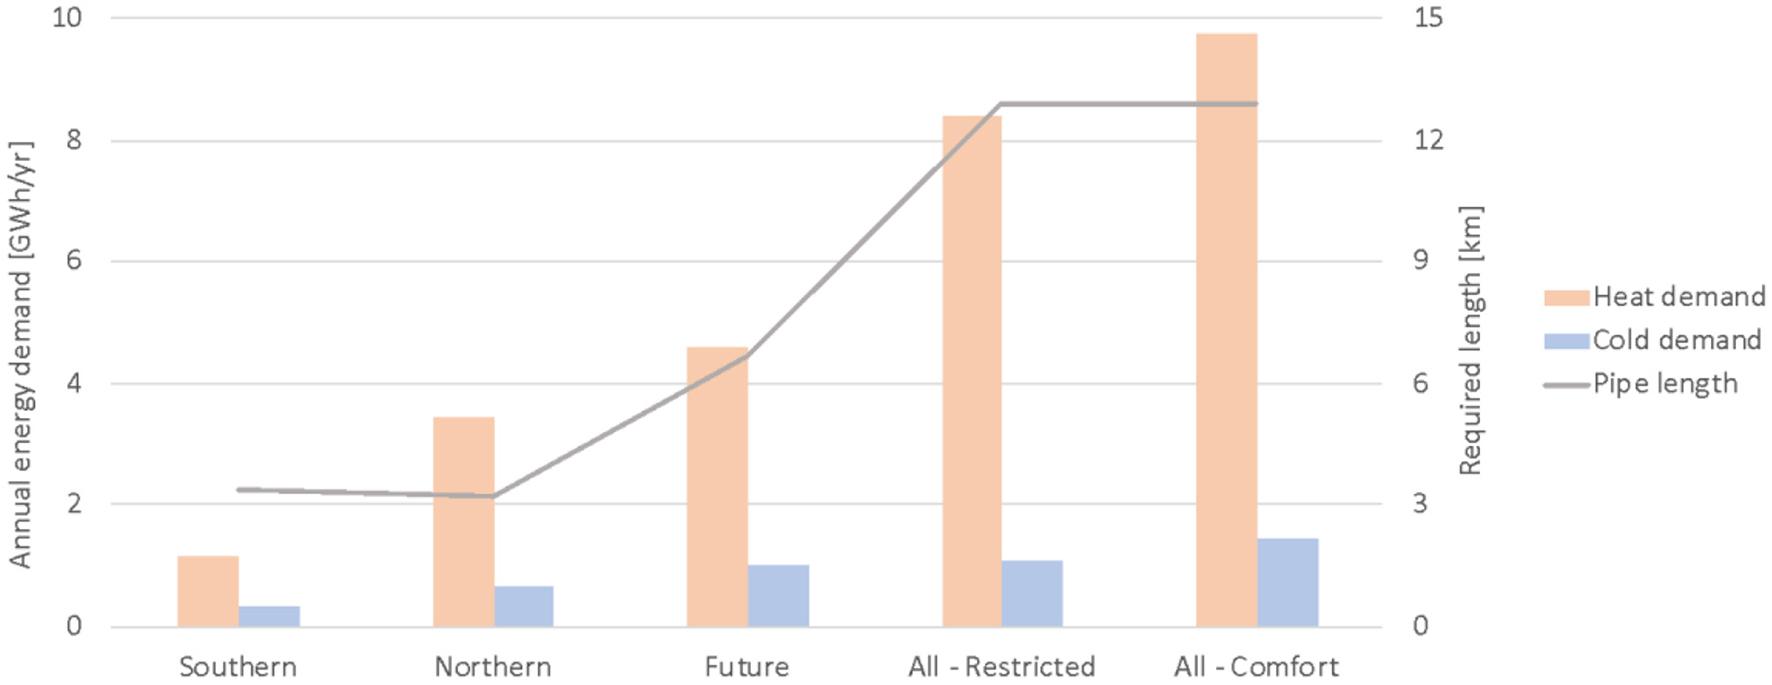
Layout demand and pipe length per building set.
Performance Comparison
The network performance was compared over a period of 1 year. The yearly consumption per layout, including the combined consumption of the northern and southern layout, is compared in Figure 9. These results show that the future layout with only a single plant site requires more pumping than a two-layout structure made of the northern and southern network.
Figure 9
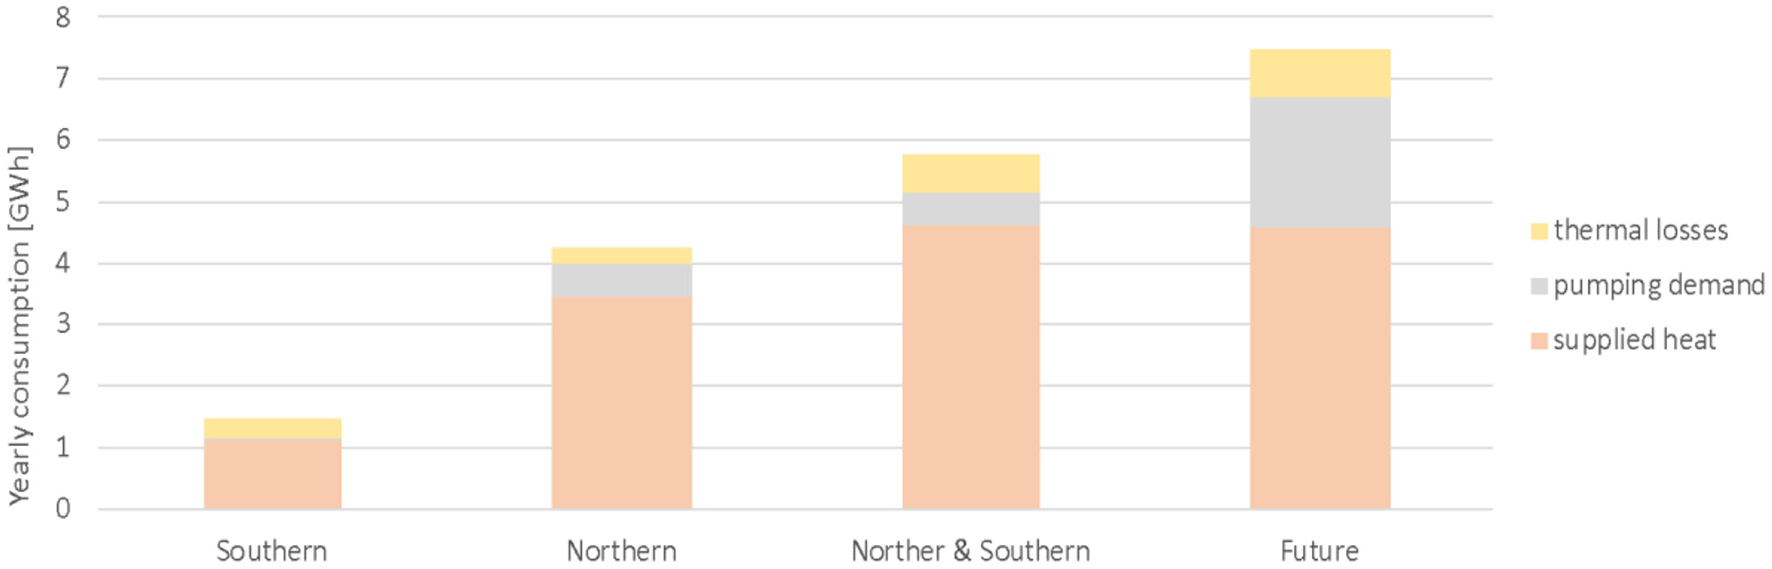
Network-layout performances' comparison.
Perimeter Optimization
There is a strategic benefit from a two-layout structure rather than a single layout. Both plant sites are located close to unconnected existing buildings. As part of future renovation, the networks could be extended to supply these neighboring buildings. However, if a single network was installed, extending the network in this way would aggravate the pumping demand.
The southern layout has a low linear heat density as shown in Figure 8. This is due to connections with distant and isolated buildings. In addition to requiring higher investment, the extended network results in high thermal loss. Therefore, a new network including the northern layout and a more concentrated southern layout was tested, as shown in Figure 10.
Figure 10
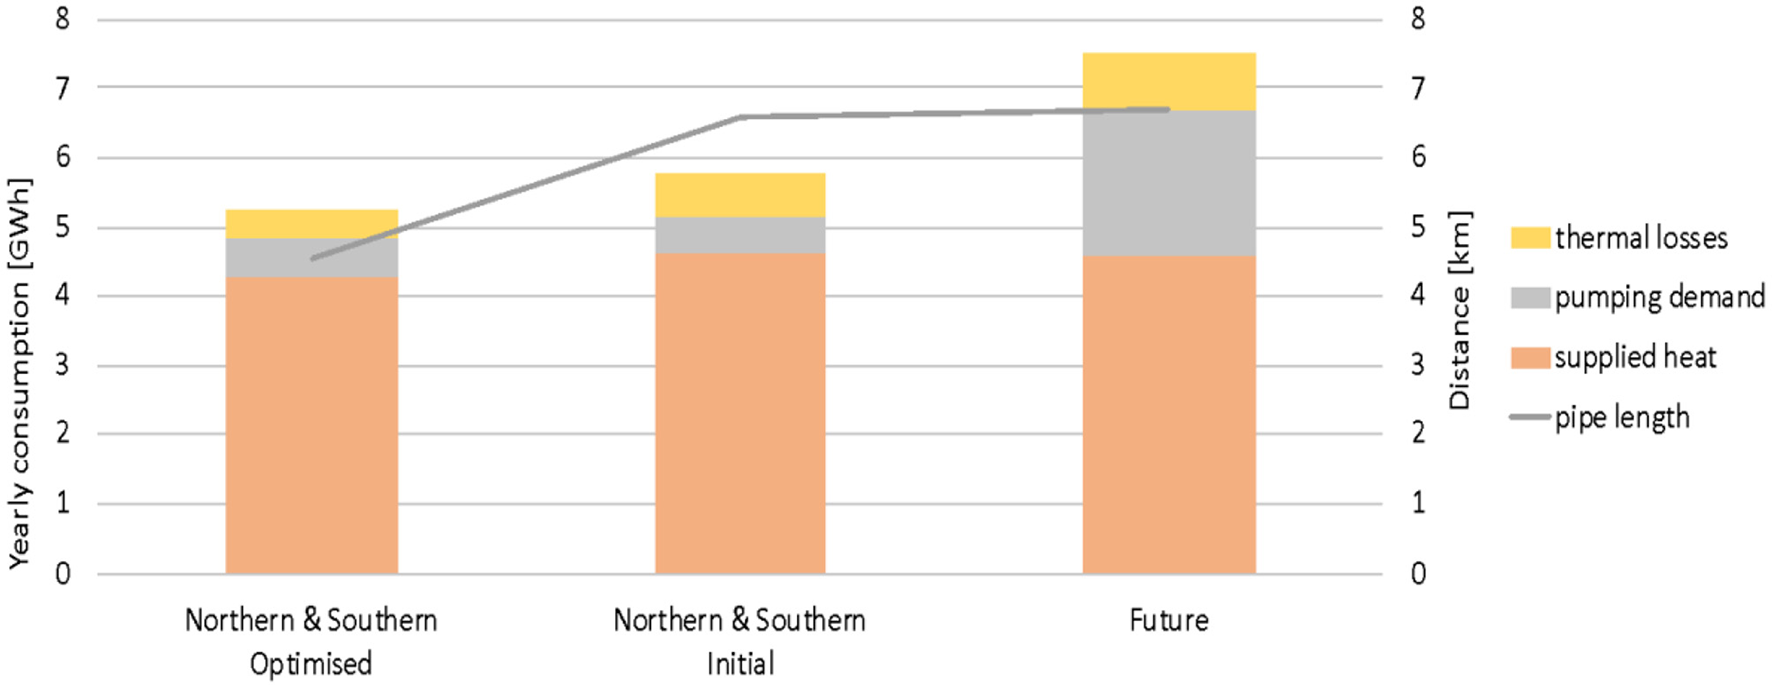
Comparison of the optimized layout.
The optimized layout reduces the pipe length by over a third with little impact on the heat supplied. The thermal losses also decrease. The southern layout possesses a lower heat demand from the future buildings. Yet, it also provides a higher potential for expansion to existing buildings within and outside the VSA perimeter. An optimized two-layout structure is illustrated in Figure 11.
Figure 11
Optimized two-layout structure.
Evaluation of Infrastructure Scenarios
Methodology
Urbio was used to generate infrastructure scenarios, each being Pareto-optimal and considering multiple objectives. The scenarios were compared based on key performance indicators to quantify the general trade-offs and help select optimal pathways.
In a second stage, the selected pathways were tested under hypotheses regarding the changing context. Two major trends were taken from the strategic plan of the Portuguese government in the (Roadmap for Carbon Neutrality 2050, 2019) (RNC) (Ministério do Ambiente e Transição Energética, 2019). The RNC foresees an increasing share of renewable energy in the electrical mix with a target of 100% by 2050. Moreover, it underlines the need for green taxation that penalizes fossil fuels while promoting clean technologies. The expected changes from 2020 to 2050 are illustrated in Figure 12.
Figure 12
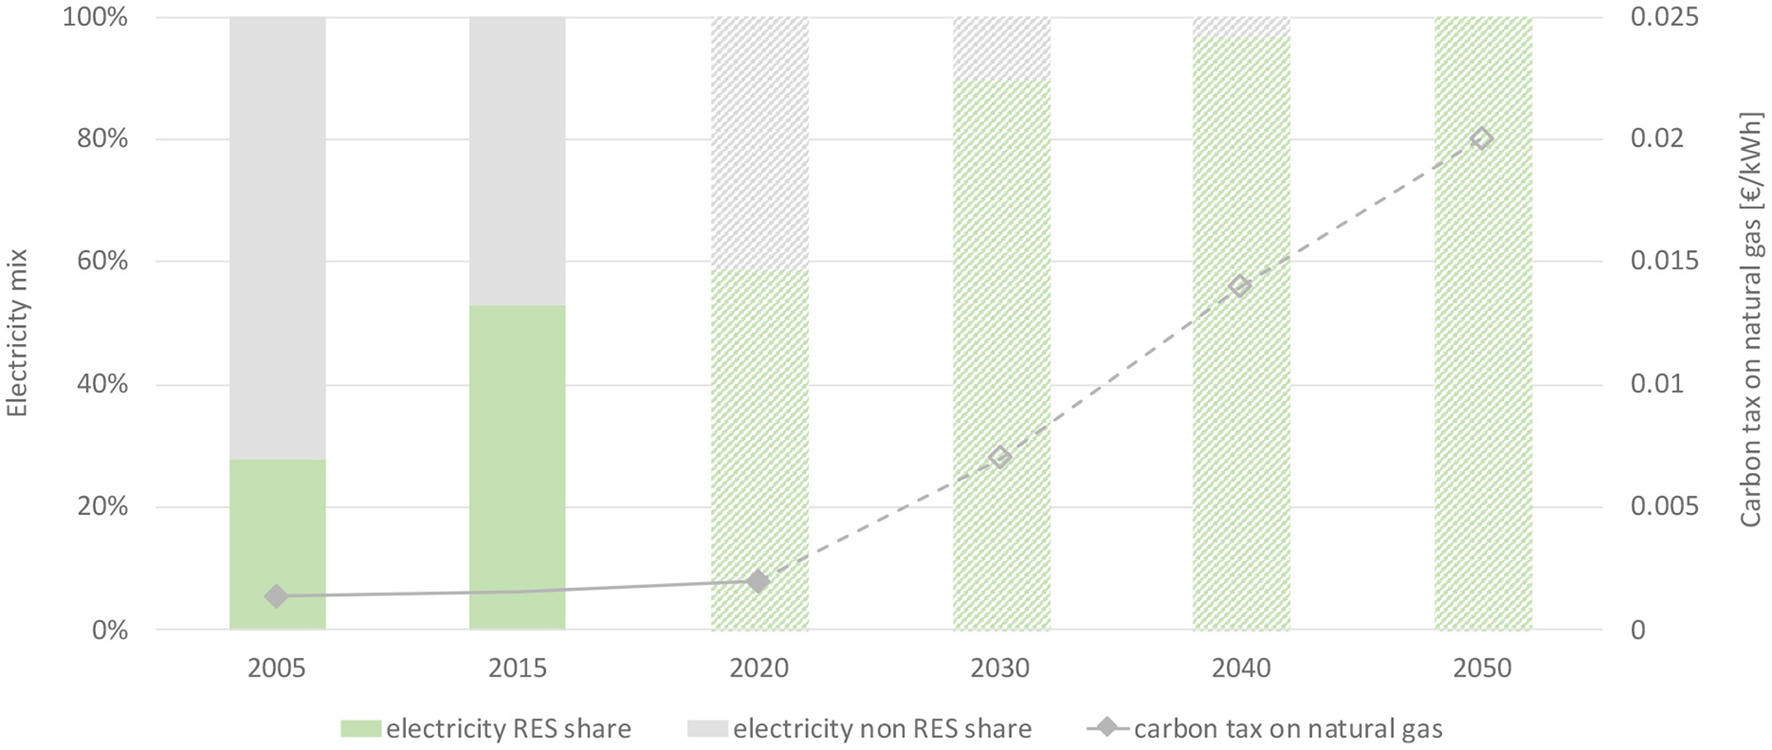
Future trends for the energy context.
Photovoltaic Panels
The local conditions in Lisbon—solar radiation, electricity selling price—provide an economic incentive to maximize electricity production from photovoltaic (PV) panels. For the VSA, even though around 50% of the PV production is sold to the local provider at discount, maximizing PV production helps reduce by 25% the total annualized cost of the energy infrastructure. Therefore, a fixed amount of PV production 6 GWh/y was selected for the pathways.
Heating Pathways
Heat can be supplied to buildings using two possible pathways: a decentralized electrical pathway or a centralized gas pathway. The former considers the installation of decentralized air-source heat pumps (ASHP), while the latter uses a heating network supplied by a central combined heat and power (CHP) plant to provide part of the heat demand.
The cost structure is shown in Figure 13. The first chart accounts for all costs, whereas the second chart accounts uniquely for the costs related to the heating services. The revenues comprise the monetary savings from not importing electricity—PV auto consumption and CHP generation—and from exporting electricity. In the second chart, the revenues from CHP electricity generation were subtracted from its operational expenditures for greater clarity.
Figure 13
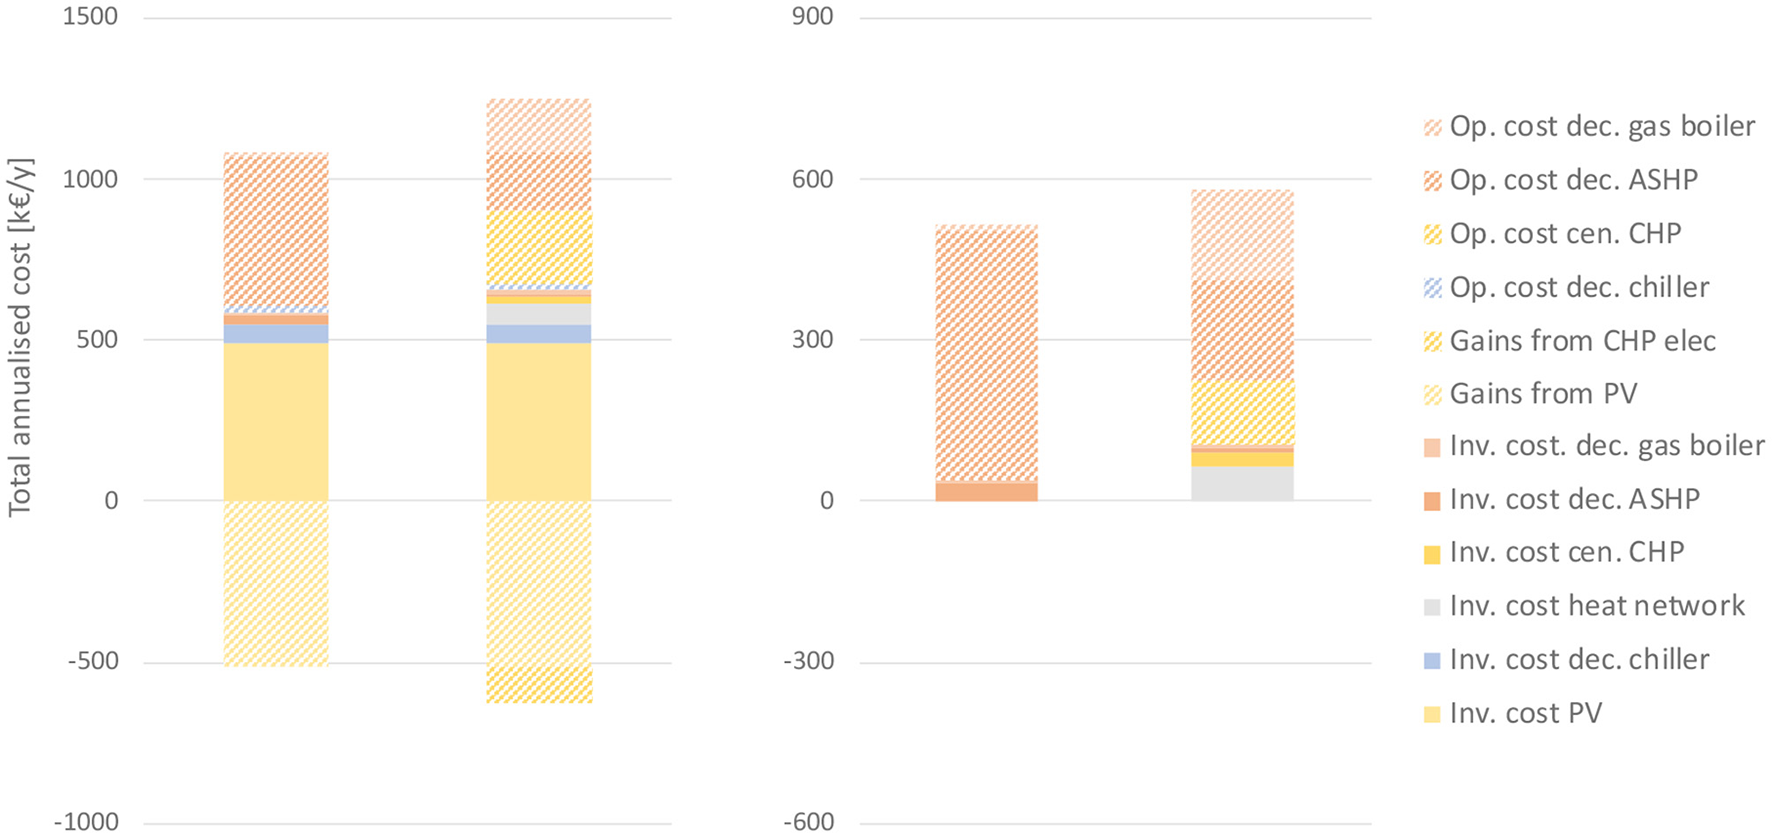
Cost structure of the pathways (left: total costs; right: heating costs).
Heating represents by far the biggest share of the total annualized cost. The savings and revenues from PV electricity generation (auto consumption and export) balance out entirely the investment cost. Air conditioning (cooling) requires high initial investment but is cheaper to run than the heating systems. For heating, both pathways have high operational costs relative to investment cost. In this respect, electricity represents the total operational cost for the decentralized electrical pathway, whereas it represents less than half of the operational cost for the centralized gas pathway. The heating network corresponds to more than half of the total investment cost for the centralized gas pathway. Finally, the electrical decentralized pathway appears to offer the cheapest infrastructure.
A more realistic distinction between energy prices, where the local provider purchases the fuel at a cheaper price compared to the building owner, would have reduced the average cost of the energy imports for the centralized gas pathway, thus making both scenarios more competitive.
Based on the assumptions shown in Figure 12, the expected evolution of cost and GHG emissions for both scenarios are shown in Figure 14, together with the RES in 2050. The clustered columns show the evolution of the decentralized electrical pathway (left) and the centralized gas pathway (right) with respect to each criterion. Only the operational cost of the heating systems is considered for the cost evolution. The entire emissions of the neighborhood are included for the GHG emission estimates.
Figure 14
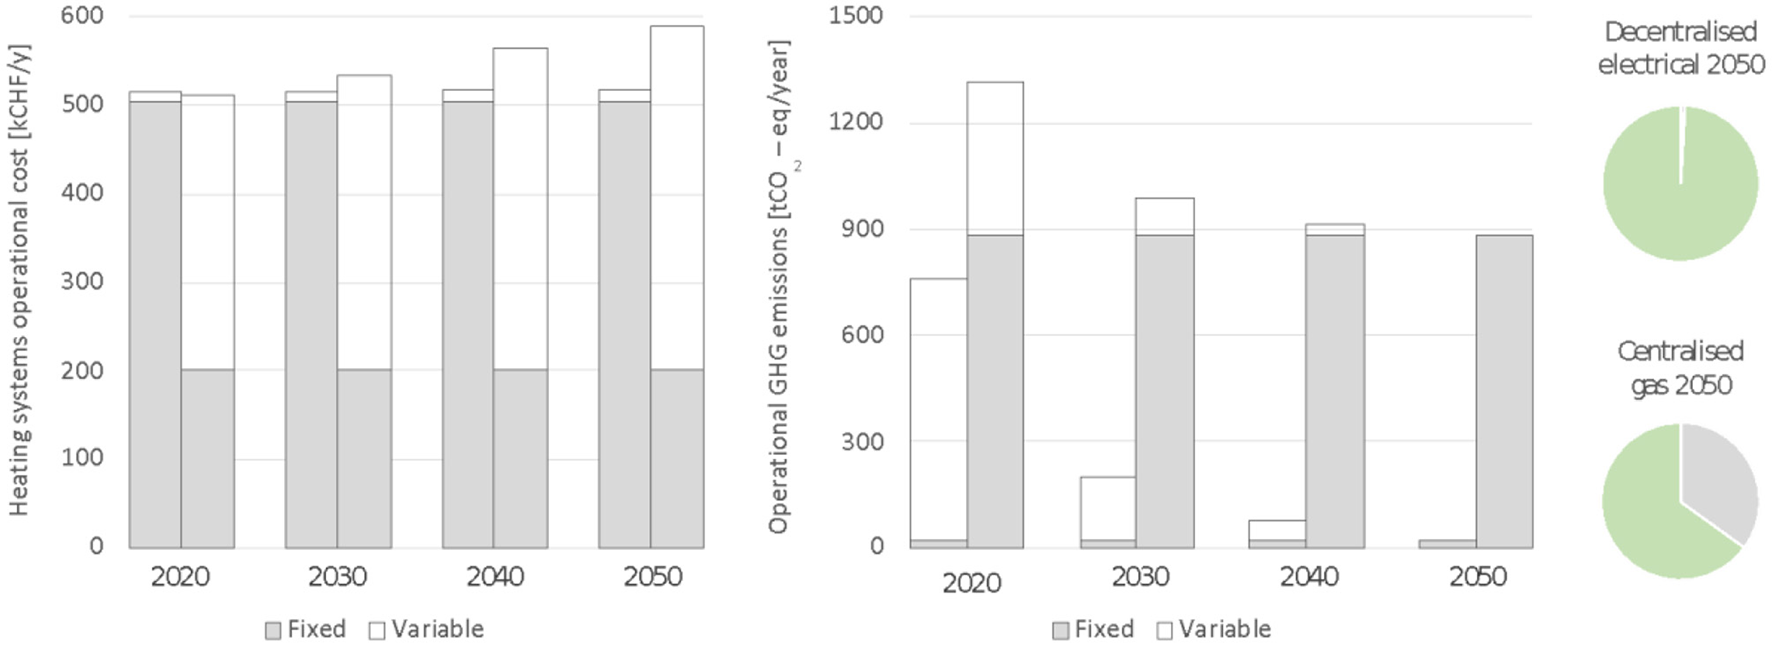
Impact of future trends on the scenarios.
In both charts, the bars are divided into fixed and variable portions depending on whether they represent conversion systems affected or not by the trend. With respect to the future trend, the decentralized electrical pathway performs better as it is insensitive to an increased natural gas prices from a carbon tax, while being capable of taking advantage of the greening of the electrical grid. The centralized gas pathway fares worse due to its significant natural gas emissions.
It can be concluded that when both options are available, it is better to opt for an electrical pathway as the financial and environmental performance, already competitive, improve with time compared with the gas pathway.
Conclusions
The methodology proposed in this paper was used to study urban energy infrastructure through the sequential combination of three software tools: QGIS, CEA, and Urbio. Building typologies were used in CEA to simplify the energy simulation of a large building stock and compensate for the lack of specific building data. Various DHC layouts were tested and compared, while their outputs were illustrated in QGIS. Urbio generated pathways for which the economic and environmental performance could be compared.
The demand simulation highlights the importance of human behavior in understanding current and future energy demand. Moreover, changes in energy demand and the potential for expansion were shown to be essential considerations when dimensioning district heating layouts. Finally, the pathway comparison highlighted the importance of selecting the right energy mix to ensure optimal performance over time.
Funding
This work was funded by Fundação para a Ciência e a Tecnologia as part of the project UIDP/EEA/50009/2020-FCT.
Publisher's Note
All claims expressed in this article are solely those of the authors and do not necessarily represent those of their affiliated organizations, or those of the publisher, the editors and the reviewers. Any product that may be evaluated in this article, or claim that may be made by its manufacturer, is not guaranteed or endorsed by the publisher.
Statements
Data availability statement
The original contributions presented in the study are included in the article, further inquiries can be directed to the corresponding author/s.
Author contributions
Work is based on AJ thesis available at: https://infoscience.epfl.ch/record/280847. The framework used included Urbio's software. NS provided help with the integration of the tool, while SC adviced on its application and the analyses to be made with. RG supervised the general advancement of the work and provided regular feedback on the writing of the thesis (and article). CS was the point of contact with the urbanists of the Municipal Chamber of Lisbon responsible for the greenfield project of the Vale de Santo António. FM helped fit the work in the wider context of Urban Building Energy Modeling tools and gave some insights on the main trends guiding the development of this field. All authors contributed to the article and approved the submitted version.
Conflict of interest
The authors declare that the research was conducted in the absence of any commercial or financial relationships that could be construed as a potential conflict of interest.
References
1
Allegrini J. Orehounig K. Mavromatidis G. Ruesch F. Dorer V. Evins R. (2015). A review of modelling approaches and tools for the simulation of district-scale energy networks. Renew. Sustain. Energy Rev. 52, 1391–1404. 10.1016/j.rser.2015.07.123
2
C40 cities (2020). Why Cities? C40 cities. Available online at: https://www.c40.org/why_cities (accessed May 21, 2020).
3
Cajot S. Peter M. Bahu J. Guignet F. Koch A. Maréchal F. (2017). Obstacles in energy planning at the urban scale. Sust. Cities Soc.30, 223–236. 10.1016/j.scs.2017.02.003
4
Caputo P. Pasetti G. (2015). Overcoming the inertia of building energy retrofit at municipal level: the Italian challenge. Sustain. Cities Soc.15, 120–134. 10.1016/j.scs.2015.01.001
5
Climaespaço (2019). Tarifário de Fornecimento de Calor. Climaespaço. Available online at: http://www.climaespaco.pt/duplo_rede.htm (accessed June 15, 2019).
6
de Santo António V. de França P. São Vicente B. (2016). Câmara Municipal de Lisboa. Available online at: http://www.lisboarendaacessivel.pt/en/locations/vale/de/santo/antonio.html (accessed April 15, 2020).
7
Diário da República (2018). Portaria no. 32/2018.Lisbon: Diário da República.
8
Direção Geral da Energie e Geologia (2013). Despacho (extrato) no. 15793–D/2013.Lisbon: Direção Geral da Energie e Geologia.
9
E-Cube (2019). Planification Stratégique de L'infrastructure de Recharge Publique Vaudoise. Lausanne: E-Cube Suisse.
10
European Commission (2020). European Alternative Fuels Observatory. European Commission. Available online at: https://www.eafo.eu/ (accessed June 15, 2020).
11
Eurostat (2020). Energy Consumption in Households. Eurostat. Available online at: https://ec.europa.eu/eurostat (accessed June 15, 2020).
12
Ferrando M. Causone F. Hong T. Chen Y. (2020). Urban building energy modeling (UBEM) tools: a state-of-the-art review of bottom-up physics-based approaches. Sustain. Cities Soc. 62, 102408. 10.1016/j.scs.2020.102408
13
Ferreira M. F. (2017). Importância dos Comportamentos dos Habitantes no Efeito Prebound do Consumo Energético Nas Habitações. Lisboa: Universidade de Lisboa.
14
Fonseca J. Nguyen T. Schlueter A. Maréchal F. (2016). City energy analyst (CEA): integrated framework for analysis and optimization of building energy systems in neigborhoods and city districs. Energy Build. 113, 202–226. 10.1016/j.enbuild.2015.11.055
15
Fonseca S. M. B. (2015). Caracterização do Consumo de Energia no Sector Residencial em Portugal. Lisbon: University of Lisbon.
16
Frayssinet L. Merlier L. Kuznik F. Hubert J. Milliez M. Roux J. (2017). Modeling the heating and cooling energy demand of urban buildings at city scale. Reneaw. Sustain. Energy Rev. 81, 2318–2327. 10.1016/j.rser.2017.06.040
17
Gomes R. Ferreira A. Azevedo L. Costa Neto R. Laura A. Silva C. (2018). Retrofit measures evaluation considering thermal comfort using building energy simulation: two Lisbon households. Adv. Build. Energy Res. 15, 291–314. 10.1080/17512549.2018.1520646
18
Gouveia J. Fortes P. Seixas J. (2012). Projections of energy services demand for residential buildings: insights from a bottom-up methodology. Energy47, 430–442. 10.1016/j.energy.2012.09.042
19
Gouveia J. Seixas J. Palma P. Simões S. (2018). LIGAR Eficiência Energética Para Todos! Mapeamento da Pobreza Energética em Portugal. Porto: FCT-NOVA.
20
Haas R. Biermayr P. (2000). The rebound effect for space heating - empirical evidence from Austria. Energy Policy28, 403–410. 10.1016/S0301-4215(00)00023-9
21
Hong T. Yixing C. Luo X. Luo N. Lee S. (2020). Ten questions on urban building energy modeling. Build. Environ. 168, 106508. 10.1016/j.buildenv.2019.106508
22
IEA (2019). Global EV Outlook 2019. Paris: IEA.
23
Li W. Zhou Y. Cetin K. Eom J. Wang Y. Chen G. et al . (2017). Modeling urban building energy use: a review of modeling approaches and procedures. Energy141, 2445–2457. 10.1016/j.energy.2017.11.071
24
Magalhães S. (2016). The Relationship Between Heating Energy Use, Indoor Temperature and Heating Energy Demand Under Reference Conditions in Residential BuildingsPorto: University of Porto.
25
Mata É. Kalagasidis A. Johnsson F. (2014). Building-stock aggregation through archetype buildings: France, Germany, Spain and the Uk. Build. Environ. 81, 270–282. 10.1016/j.buildenv.2014.06.013
26
Ministério do Ambiente e Transição Energética (2019). Roteiro Para a Neutralidade Carbónica 2050 (RNC2050). Lisbon: Ministério do Ambiente e Transição Energética.
27
Moghadam S. Delmastro C. Corgnati S. Lombardi P. (2017). Urban energy planning procedure for sustainable development in the built environment: a review of available spatial approaches. J. Clean. Product. 165, 811–827. 10.1016/j.jclepro.2017.07.142
28
Mourão J. Gomes R. Matias L. Niza S. (2019). Combining embodied and operational energy in buildings refurbishment assessment. Energy Build. 197, 34–46. 10.1016/j.enbuild.2019.05.033
29
Palma P. Gouveia J. Simoes S. (2019). Mapping the energy performance gap of dwelling stock at high-resolution scale: Implications for thermal comfort in Portuguese households. Energy Build. 190, 246–261. 10.1016/j.enbuild.2019.03.002
30
Pinto (2005). Criteria to Define Limits for Building Airtightness: Airtightness of some Portuguese Dwellings.Lisbon: Pinto.
31
Pordata (2020b). Preços do Gás Natural Para Utilizadores Domésticos e Industriais. Pordata. Available online at: https://www.pordata.pt/Europa/Pre%C3%A7os+do+g%C3%A1s+natural+para+utilizadores+dom%C3%A9sticos+e+industriais+(Euro)-147%A7os+do+g%C3%A1s+natural+para+utilizadores+dom%C3%A9sticos+e+industriais+(Euro)-1478 (accessed June 15, 2020).
32
Pordata. (2020a) Preços da Electricidade Para Utilizadores Domésticos e Industriais (PPS). Pordata. Available online at: https://www.pordata.pt (accessed June 15, 2020).
33
Rede Elétrica Nacional (2019). Technical Data 2019. Lisbon: Rede Elétrica Nacional.
34
Reinhart C. Davila C. (2016). Urban building energy modeling e a review of a nascent field. Build. Environ. 97, 196–202. 10.1016/j.buildenv.2015.12.001
35
República Portuguesa (2020). Long-Term Strategy for Building Retrofit (ELPRE). República Portuguesa. Available online at: https://participa.pt/contents/consultationdocument/ELPREconsultapublica.pdf
36
Roadmap for Carbon Neutrality 2050 (2019). República Portuguesa, Fundo Ambiental. Lisbon: APA.
37
Santiago M. (2016). Assessing the Potential of Electric Vehicles for Commutes in Portugal. Lisbon: University of Lisbon.
38
Shimoda Y. Fujii T. Morikawa T. Mizuno M. (2004). Residential end-use energy simulation at city scale. Build. Environ. 39, 959–967. 10.1016/j.buildenv.2004.01.020
39
Simões S. Gregório V. Seixas J. (2016). Mapping fuel poverty in Portugal. Energy Proc. 106, 155–165. 10.1016/j.egypro.2016.12.112
40
Sola A. Corchero C. Salom J. Sanmarti M. (2020). Multi-domain urban-scale energy modelling tools: a review. Sustain. Cities Soc. 54, 101872. 10.1016/j.scs.2019.101872
41
Sousa C. (2018). Building Energy Modeling at Urban Scale Using Multi-Detail Archetypes: Addressing the Uncertainties and Applications.Lisbon: University of Lisbon.
42
Sunikka-Blank M. Galvin R. (2012). Introducing the prebound effect: the gap between performance and actual energy consumption. Build. Res. Inform. 40, 260–273. 10.1080/09613218.2012.690952
43
UN Department of Economic and Social Affairs (2018). World Urbanization Prospects 2018. New-York, NY: UN Department of Economic and Social Affairs.
44
Urbio (2020). Rendez Votre Installation Solairepompe à Chaleurréseau de Chaleurchaudière à Pelletsmicrogridchaufferiecentrale Ccfbatteriemaisonbâtimentparc Immobilierquartierville. Urbio. Available online at: https://www.urb.io/fr/
45
Vasconcelos B. Pinheiro M. Manso A. Cabaço A. (2015). A Portuguese approach to define reference buildings for cost-optimal methodologies. Appl. Energy140, 316–328. 10.1016/j.apenergy.2014.11.035
Summary
Keywords
energy supply system, urban energy modeling, district heating and cooling, CEA, Urbio
Citation
Jewell A, Schüler N, Cajot S, Gomes R, Silva CS and Marechal FMA (2022) Designing a District Energy Infrastructure - a Case-Study in Lisbon. Front. Sustain. Cities 4:863787. doi: 10.3389/frsc.2022.863787
Received
27 January 2022
Accepted
12 April 2022
Published
03 May 2022
Volume
4 - 2022
Edited by
Kh Md Nahiduzzaman, University of British Columbia, Okanagan Campus, Canada
Reviewed by
Xiangfei Kong, Hebei University of Technology, China; Amin Mohammadpour Shotorbani, University of British Columbia, Canada
Updates
Copyright
© 2022 Jewell, Schüler, Cajot, Gomes, Silva and Marechal.
This is an open-access article distributed under the terms of the Creative Commons Attribution License (CC BY). The use, distribution or reproduction in other forums is permitted, provided the original author(s) and the copyright owner(s) are credited and that the original publication in this journal is cited, in accordance with accepted academic practice. No use, distribution or reproduction is permitted which does not comply with these terms.
*Correspondence: Alexandre Jewell alexandre.jewell@me.com
This article was submitted to Sustainable Infrastructure, a section of the journal Frontiers in Sustainable Cities
Disclaimer
All claims expressed in this article are solely those of the authors and do not necessarily represent those of their affiliated organizations, or those of the publisher, the editors and the reviewers. Any product that may be evaluated in this article or claim that may be made by its manufacturer is not guaranteed or endorsed by the publisher.