Abstract
Empirical evidence points out that urban form adaptation to climate-induced flooding events—through interventions in land uses and town plans (i. e., street networks, building footprints, and urban blocks)—might exacerbate vulnerabilities and exposures, engendering risk inequalities and climate injustice. We develop a multicriteria model that draws on distributive justice's interconnections with the risk drivers of social vulnerabilities, flood hazard exposures, and the adaptive capacity of urban form (through land uses and town plans). The model assesses “who” is unequally at-risk to flooding events, hence, should be prioritized in adaptation responses; “where” are the high-risk priority areas located; and “how” can urban form adaptive interventions advance climate justice in the priority areas. We test the model in Toronto, Ontario, Canada, where there are indications of increased rainfall events and disparities in social vulnerabilities. Our methodology started with surveying Toronto-based flooding experts who assigned weights to the risk drivers based on their importance. Using ArcGIS, we then mapped and overlayed the risk drivers' values in all the neighborhoods across the city based on the experts' assigned weights. Accordingly, we identified four high-risk tower communities with old infrastructure and vulnerable populations as the priority neighborhoods for adaptation interventions within the urban form. These four neighborhoods are typical of inner-city tower blocks built in the 20th century across North America, Europe, and Asia based on modern architectural ideas. Considering the lifespan of these blocks, this study calls for future studies to investigate how these types of neighborhoods can be adapted to climate change to advance climate justice.
Introduction: Climate Change and Double Injustice in Flood Risks and Adaptation
The risks to lives, livelihoods, and property from climate change-related hazards, including floods from extreme rainfall events, is not equal, ensuing from the triad of: spatially differentiated patterns of social- and climate-related vulnerabilities, exposure to hazards, and adaptive capacity where adaptive capacity refers to the ability to cope (Carter et al., 2015; Thomas and Warner, 2019). Empirical evidence shows that the urban form of socially and climatically vulnerable neighborhoods with high exposure to flooding often maintains low adaptive capacity that renders marginalized groups unable to cope with flood hazards (Anguelovski et al., 2016; Michael et al., 2019). For instance, there is evidence that low-income neighborhoods contain a higher percentage of impervious surfaces than affluent neighborhoods due to a lack of green spaces (Bautista et al., 2015; Garcia-Lamarca et al., 2021), leading to their inadequate adaptive capacity.
These risk inequities are rooted in the uneven patterns of urban development based on economic rationales that have long prioritized infrastructure investments in high-value real estate, leading to decades of disinvestments in hazard-exposed and impoverished yet vulnerable neighborhoods (Herreros-Cantis et al., 2020). The prevalence of climate change further extended the rationales underlying inequities, hence, exacerbated vulnerabilities and exposures through land use planning (Anguelovski et al., 2016), and we argue the town plans' design, where the town plan is defined as the streets and their networks and the arrangements of the building footprints and urban blocks (Conzen, 1960). Henceforth, urban form refers to land uses and the town plan – two of the three Conzen's (1960) urban morphology components1. For example, when retreat is adopted as a land use adaptation measure for flood-prone areas, it often entails the forced relocation of marginalized communities to sites far away from their social networks and livelihoods, hence worsening their vulnerabilities (Henrique and Tschakert, 2019).
Despite such unequal outcomes, there is a deficit of empirical studies that propose methodologies to measure how the adaptive capacity (or adaptation) of urban form is connected to the differential vulnerabilities (i.e., different sensitivities to risks), exposures, and risk inequities (Mohtat and Khirfan, 2021). This deficit is attributed to the nascence of theoretical studies that connect urban form with adaptation and adaptive capacity in general (Dhar and Khirfan, 2017; Sharifi, 2019c), and with climate justice in particular (Mohtat and Khirfan, 2021).
To identify how adaptation interventions can be distributed to avoid flood risk inequities, hence advance climate justice, this study draws on Rawls's (1971) distributive justice, referring to the just spatial distribution of resources to maximize benefits to the disadvantaged. We operationalize Dhar and Khirfan's (2017) framework for measuring urban form's adaptive capacity to investigate the spatial distribution of adaptation interventions, hence urban form's adaptive capacity, and explore this adaptive capacity's connections to differential vulnerabilities and hazard exposures. Accordingly, we develop a multicriteria model that includes indicators and variables to identify the spatial distribution patterns of risk drivers: social vulnerabilities, flood hazard exposures, and areas with a low adaptive capacity of urban form. Our model assesses specifically “who” are unequally at-risk to flooding events, hence should be prioritized for adaptation interventions; “where” are the high-risk priority areas located; and “how” urban form adaptive interventions may advance climate justice in these priority areas.
We test this model, which can be applied in any city within Canada and beyond, in Toronto, Ontario, Canada, where there are indications of increased frequency and intensity of flood events combined with the disparities in social vulnerabilities (Feltmate and Thistlethwaite, 2012; Rincón et al., 2018). We aim to identify how social vulnerabilities, flood exposures, and adaptation interventions within the urban form are distributed in Toronto? Based on this, which neighborhoods are experiencing the highest risks of floods and need to be prioritized in adaptation? And how can we identify these priority neighborhoods?
To answer these queries, we developed a survey that asked Toronto-based flooding experts to weigh the importance of risk drivers of our multicriteria model and their associated indicators in triggering flood risks in Toronto. We then overlaid the values of the risk drivers and their indicators in ArcGIS, using the experts' assigned weights. The results reveal that flood risks are disproportionately distributed in four tower neighborhoods with old infrastructure, where low-income, racialized, and migrant populations concentrate, namely: Thorncliffe Park, Flemingdon Park, North St. James Town, and Black Creek.
From Differential Vulnerabilities to Climate Justice in Urban Form Adaptation to Flooding Risks
Vulnerability, or people's susceptibility to being adversely affected by shocks, stresses, and hazards (Adger, 2006b; Gallopín, 2006), is not equal but differential. Differential vulnerability entails that some social groups undergo greater human, livelihood, and financial losses due to their exposure to stresses and lack of coping capacity (Suarez, 2002; Thomas et al., 2019). Evidence on differential vulnerabilities abounds globally: from the proximity of racial neighborhoods to contaminated sites and the ensuing negative impacts on the health of their residents in the USA, to the lack of low-income communities' access to potable water and sanitary services, hence, their sensitivity to droughts in the Philippines (Bautista et al., 2015; Porio et al., 2019). Differential vulnerabilities are rooted in the historical capitalist processes of urban development and their embedded domination and oppression patterns that shape inequity in the spatial distribution of urban assets (e.g., housing, land, green space, and infrastructure) and entitlements among socially different groups, whether across income, race, gender, or ethnicity, among others (Sen, 1982; Ribot, 2014; Michael et al., 2019). With the emergence of climate change as an urban crisis, the historical disinvestments in disenfranchised neighborhoods and the systematic exclusions of the disadvantaged from power structures place vulnerable groups in unsafe living conditions, exacerbating their vulnerabilities and exposures to different hazards, including flooding events (Blaikie et al., 2005; Michael et al., 2019). Additionally, efforts to mitigate climatic hazards, such as through adaptation, align with the uneven historical mechanisms of urban development, prioritizing the protection of urban economies over climate justice through selective investment in vital urban infrastructure and wealth reproduction systems (Long and Rice, 2019, 2020).
Flood Risks and Climate Justice Challenges
Changing precipitation rates combined with the increase in the density of urban impervious surfaces, old and overburdened drainage systems, and urban population, particularly in low-lying areas, intensify the risk of loss of lives and livelihoods and damage to properties and infrastructure from rainfall run-off and river flooding events (Faccini et al., 2018; O'donnell and Thorne, 2020; Sohn et al., 2020). Yet, individuals experience these flood risks differentially, depending on three context-specific risk drivers: social vulnerabilities, low adaptive capacity, and exposure to flooding hazards. In fact, empirical evidence indicates that social vulnerabilities are associated with inequities in flood hazard exposures and access to adaptive capacity, triggering inequities in the spatial distribution of risks across the lines of race, income, and ethnicity, among others (Suarez, 2002; Islam and Winkel, 2017; Herreros-Cantis et al., 2020).
The uneven processes of urban development have forced marginalized groups with economically precarious and socially unstable conditions to live in deteriorating settlements, prone to power outages and infrastructure failures in the face of hazards (Walker and Burningham, 2011; Graham et al., 2016). Many of these settlements are located in low real estate value and precarious sites, like low-lying areas, floodplains, and industrial zones with impervious surfaces, which increase their exposure to flooding events. The lack of land tenure rights and informality in the Global South and discriminatory policies and zoning laws based on market rules in the Global North have led, over time, to the systematic disinvestment in these vulnerable and flood-prone neighborhoods (Chakraborty et al., 2014; Borie et al., 2019; Michael et al., 2019). Among the residents of these neighborhoods are new immigrants with language and employment barriers who lack community connections and citizenship entitlements, including election rights, to influence the formal urban governance structures and local decision-makers; hence, they are often excluded from flood awareness, warning, and management programs (Donner and Rodríguez, 2008; Dodman et al., 2019; Turhan and Armiero, 2019). Additionally, the employment of these vulnerable groups in low-paying service jobs, their everyday struggles for basic needs like food, and their lack of housing ownership render them financially unable to adopt flood protective behavior, such as buying insurance and retrofitting their flimsy settlements (Anguelovski et al., 2020; Herreros-Cantis et al., 2020; Ziervogel, 2020).
With their lack of preparedness, disenfranchised and marginalized vulnerable groups are more at risk of losing life, assets, and income due to flood hazards than the affluent groups in society (Collins et al., 2018; Kim et al., 2018). In addition, they have fewer opportunities for recovery, reconstruction, and relief due to their lack of access to personal wealth and timely and adequate assistance programs such as loans and emergency services (Rufat et al., 2015; Graham et al., 2016; Thomas and Warner, 2019). Hence, their frequent experience of risks worsens their existing vulnerabilities, reproduces new ones, and reduces their capacity to cope with future hazards.
Climate Justice Challenges in Urban Form Adaptation
Climate change adaptation refers to “the process of adjustment to actual or expected climate and its effects … to moderate or avoid harm or exploit beneficial opportunities” while adaptive capacity is the ability of humans, institutions, and systems to adapt to climatic effects (IPCC, 2014, p. 5). Urban form adaptation entails physical interventions in the built environment and functions to minimize risks by improving the adaptive capacity of urban form to reduce vulnerabilities and exposures, thereby coping with, surviving, and recovering from hazards (Dhar and Khirfan, 2017). Specifically, improving the adaptive capacity of town plans and land uses can enhance urban form's flexibility to absorb unknown climatic events with uncertain patterns, such as flooding ensuing from extreme precipitations. This improved adaptive capacity can ensure that the urban form maintains its functions and structure, contributing to urban form resilience (Dhar and Khirfan, 2017; Khirfan and El-Shayeb, 2020).
Khirfan and El-Shayeb (2020) connect urban form adaptation and resilience by drawing on Meerow et al. (2016, p. 39) definition of resilience: “the ability of an urban system-and all its constituent socio-ecological and socio-technical networks across temporal and spatial scales to maintain or rapidly return to desired functions in the face of a disturbance, to adapt to change, and to quickly transform systems that limit current or future adaptive capacity.” Accordingly, adaptation (and adaptive capacity) is among the three pathways to resilience, along with persistence and transformation. Framing urban form adaptation under the umbrella of resilient planning has rendered resilience central to flood adaptation policies and projects to enhance the flexibility and adaptability of urban forms to increased rainfall events (Lennon, 2015; Graham et al., 2016; Shi, 2020; Shokry et al., 2020). This is evident in the shift in land use policies to integrate large-scale green projects that absorb and dissipate rainwater run-off (Anguelovski et al., 2019; Shi, 2020) and urban design interventions that incorporate resilient water-sensitive infrastructure in town plans to infiltrate, harvest, and convey rainwater (Watson and Adams, 2010; Matos Silva and Costa, 2016).
Despite its benefits for urban form adaptation to climate change-induced floods, resilient planning risks ignoring the underlying causes behind risk inequities and differences in adaptive capacity, perpetuating the historic uneven processes of urban development (Meerow et al., 2019). In particular, the application of resilience planning as a development agenda in the last decades has capitalized on branding cities as climate- and flood-adaptive sites to encourage investments by the tourism industry, real-estate developers, and the new sustainability class (Connolly, 2019; Anguelovski et al., 2020; Garcia-Lamarca et al., 2021). The exclusionary controls over the types and locations of investments can exacerbate vulnerabilities, whether through increased land values/rents and ensuing climate gentrification (Chu et al., 2017; Shi, 2020) or through the forced relocation of marginalized groups to clear space for large-scale projects (Henrique and Tschakert, 2019). Accordingly, enhancing urban form resilience through flood-adaptive land use planning and town plan design risks excluding vulnerable neighborhoods that already lack sufficient adaptive capacity (Anguelovski et al., 2016).
Theoretical Framing: How to Combine Urban Form Adaptation With Distributive Justice
To investigate how the adaptive capacity of urban form is connected to differential vulnerabilities and exposures to floods, and how urban form adaptation responses should be distributed to advance climate justice, the theoretical framework of this study combines Dhar and Khirfan's (2017) urban design resilient index (UDRI) the distributive justice notion.
The UDRI Framework
We draw on Dhar and Khirfan's (2017) UDRI framework to assess and compare the adaptive capacity of urban form in different urban neighborhoods to identify the disadvantaged ones whose adaptive capacity is also low. We focus on this framework because it is clear, comprehensive, and generalizable; it is also applicable to Conzen's (1960) urban form components, particularly land uses and town plans. The framework includes seven concepts that impact the resilience, hence the adaptive capacity of urban form across functional, spatial, physical, and temporal dimensions; they are harmony with nature, polyvalency, heterogeneity, connectivity, indeterminacy, latency, and modularity (refer to Table 1 for definitions).
Table 1
| The UDRI framework (Dhar and Khirfan, 2017) | Evidence on how to apply concepts to: | The concepts used in our theoretical framework | ||||||||
|---|---|---|---|---|---|---|---|---|---|---|
| Concepts | Definitions | Examples | Urban form applications | Concepts | Urban form applications | |||||
| Town plans | Land uses | 3D built form | City-wide scales | Sources | Town plans | Land uses | ||||
| Harmony with nature | The organization of urban form to minimize impacts on the environment while strengthening natural ecosystems to absorb risks. | GBI and natural elements that can minimize urban imperviousness. | ✓ | ✓ | ✓ | ✓ | Meerow and Newell, 2017; Li et al., 2020 | Harmony with nature | ✓ | |
| Polyvalency | The ability of urban form to serve diverse functions during and after disasters. | Multi-purpose open spaces that can provide space for temporary shelters after a disaster. | ✓ | ✓ | ✓ | ✓ | Roggema, 2014; Sharifi, 2019a | Polyvalency | ✓ | |
| Heterogeneity | The separation of urban form components to dissipate risks. | A mixture of different land cover types across a spatial unit that can spread out run-offs. | ✓ | ✓ | ✓ | ✓ | Cadenasso et al., 2013; Zhou et al., 2017 | Heterogeneity | ✓ | |
| Connectivity | The ability of urban form components to hierarchically be connected to facilitate emergency management | Well-connected street networks that facilitate emergency rescue. | ✓ | ✓ | ✓ | ✓ | Sharifi and Yamagata, 2014 | Connectivity | ✓ | |
| Indeterminacy | Urban form organization, including determined and non-determined morphological elements, which leaves a variety of possibilities to cope with unknown functional, spatial, and environmental changes. | Vacant spaces that accidentally are created from intersections among street networks can be used to function as bioswales. | ✓ | ✓ | ✓ | Not found | Flexibility* (the additional concept) | ✓ | ||
| Latency | Design opportunities that enable urban form to accommodate different uses to cope with uncertainty. | Adequate spaces adjacent the streets that can be used as a shelter. | ✓ | ✓ | ✓ | Not found | ||||
| Modularity | A modular urban form can group and control different parts, facilitating the modification of the parts affected by a shock without affecting others. | Modular-shaped housing units, which facilitate their retrofit after disasters. | ✓ | ✓ | ✓ | Not found | ||||
The UDRI framework adapted from Dhar and Khirfan (2017, p. 83–84) and the concepts from this framework that this study uses.
While Dhar and Khirfan (2017) developed their UDRI framework for measuring the resilience of urban form at the neighborhood scale, this study applies it at the urban scale – that is, for the entire city. To facilitate this, we draw on only four of the seven concepts in the UDRI, namely: harmony with nature, polyvalency, heterogeneity, and connectivity, for which we found empirical evidence of their application at the city scale (see Table 1). Furthermore, we add a fifth concept, flexibility, due to the numerous theoretical and empirical debates regarding its application in assessing the general resilience of urban form at the city scale (Roggema, 2014; Sharifi, 2019a; Freire and Monteiro, 2020), particularly with regards to flooding events (Sharifi, 2019c).
While Dhar and Khirfan (2017) applied their resilient concepts to all three of Conzen's (1960) urban form components (i.e., land uses, town plans, and the three-dimensional (3D) built form), we apply the five concepts only to land uses and town plans. Our reason for this is the lack of data that facilitate measuring the adaptive capacity of the 3D urban form elements to flood risks at the city scale.
Accordingly, beginning with land uses, we consider that their adaptive capacity can be enhanced through the configurational characteristics of harmony with nature, heterogeneity, and polyvalency. Land uses in harmony with nature have a minimal impact on the natural environment and can mitigate climatic hazards by strengthening ecosystem functions. One of the prevalent ways to enhance harmony with nature through land uses for adaptation to flooding is by integrating green and blue infrastructure (GBI). GBI refers to an interconnected network of natural (e.g., lakes, streams, and parks) and semi-natural ecosystems (e.g., community gardens and green roofs) that benefit humans through providing ecosystem services (Bolund and Hunhammar, 1999; Mohtat and Khirfan, 2021). GBI can mimic natural hydrological processes such as infiltration, evapotranspiration, retention, detention, and slow flow (Liu et al., 2019) that collectively promote nature-based solutions for adaptation (IPCC, 2022). Therefore, several studies have introduced GBI as a decentralized approach for managing the excess rainwater and regulating flooding, which can supplement the centralized urban drainage gray infrastructure (Abebe et al., 2018; Li et al., 2020). Heterogeneous land uses, through the variation of their types over a spatial unit, facilitate the spread and dissipation of hazards across space. For instance, urban forms that include a rich combination of land use types with different porosity (e.g., open spaces, industrial uses, green spaces, and residential uses) are better able to dissipate rainwater run-off (Cadenasso et al., 2013; Dhar and Khirfan, 2017; Zhou et al., 2017). Polyvalent land uses allow a change in functions without significant physical changes to accommodate hazards (Dhar and Khirfan, 2017). For example, recreational spaces adjacent to rivers can become spaces that temporarily accommodate floods (Macintosh, 2013).
As for town plans, we consider that their adaptive capacity increases when they are flexible and connected. Flexibility refers to the urban form's ability to integrate future changes and interventions for adaptation; hence, it bears some similarities with Dhar and Khirfan's (2017) latency and indeterminacy concepts (Table 1). However, the difference is that Dhar and Khirfan (2017) used latency and indeterminacy at the micro scale in relation to small spaces adjacent to streets and intersections while Sharifi (2019a,c) used flexibility to elaborate on the characteristic of adaptable urban form at the larger scale, such as urban blocks. Therefore, we replace latency and indeterminacy with flexibility. Flexibility and connectivity often go hand in hand. Flexible town plans facilitate accommodating adaptive interventions and incorporating land modification regulations. For example, integrating green spaces in fined-grained urban blocks is easier and more cost-effective than large-grained ones with little connectivity (Salat, 2017; Sharifi, 2019a,c). Connectivity enhances the town plans' permeability by increasing the contact between blocks with streets. It, therefore, accelerates access to buildings and emergency management in the advent of intense rainfall events leading to run-off flooding (Sharifi and Yamagata, 2014; Sharifi, 2019b).
Distributive Justice
Distributive justice refers to the just spatial/temporal distribution of resources to maximize benefits to the most vulnerable (Rawls, 1971; Adger, 2006a; Shi et al., 2016). Building on Rawls's (1971) liberty and maximization rules, distributive justice gives those with the greatest need the right to equal access to resources and the priority in their spatial allocation (Sen, 1992; Adger, 2006a). We draw on the distributive justice notion to identify how different the neighborhoods' urban forms are shaped in terms of the five resilience concepts, how social vulnerabilities and exposures are distributed, hence how we can remedy flood risk inequities. Accordingly, our theoretical framework indicates that the residents of neighborhoods at a high risk of floods are most in need of adaptation, deserving to be prioritized in the decisions around adaptive urban form interventions.
Theoretical Framework
Our theoretical framework connects these disparate notions whereby the identification of high-risk neighborhoods ensues from the simultaneous presence of four flood risk drivers: (1) exposures to flooding hazards; (2) social vulnerabilities; (3) low adaptive capacity of land uses; and (4) low adaptive capacity of town plans (Figure 1). Drawing on our interpretation from the UDRI framework, we assess the adaptive capacity of land uses based on their degree of harmony with nature, heterogeneity, and polyvalency while evaluating the adaptive capacity of town plans in terms of their connectivity and flexibility.
Figure 1
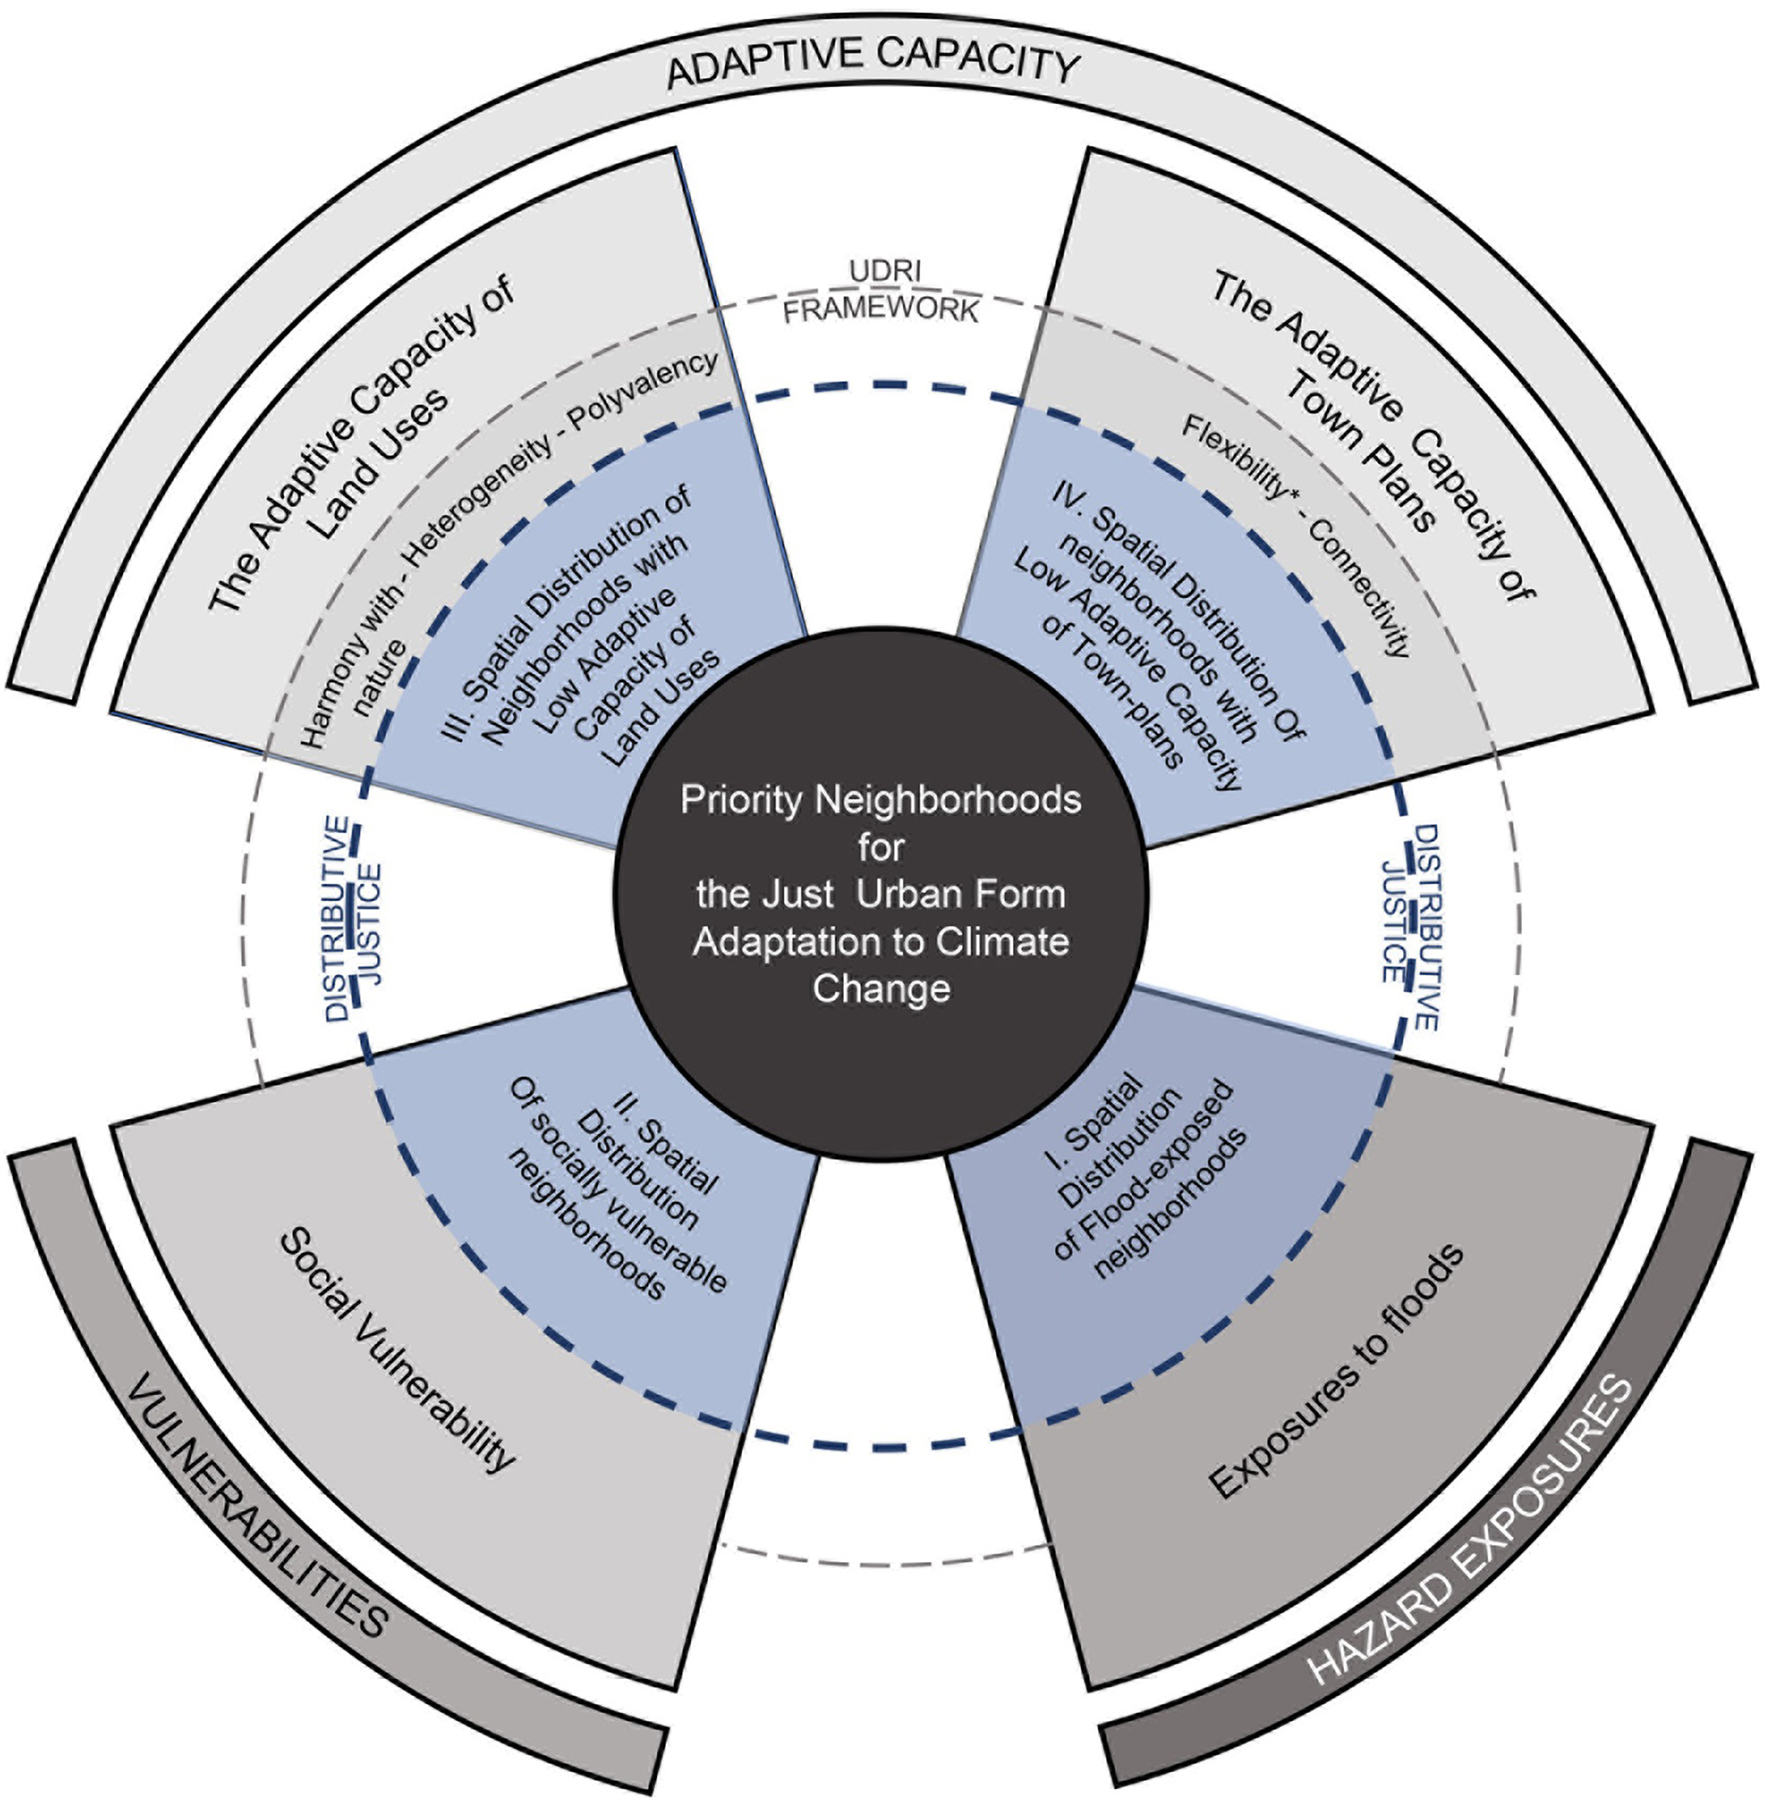
The theoretical framework. *Flexibility is not included in the UDRI framework.
Methodology
To operationalize our theoretical framework, our methodology started with developing a conceptual framework that includes indicators and variables for measuring the four flood risk drivers (hereafter, we dub this conceptual framework “the multicriteria model”). We then conducted overlay analysis in ArcGIS using the experts' assigned weights.
Conceptual Framework: Our Proposed Multicriteria Model
Several studies propose multicriteria models (MM) to identify the spatial distribution of flood risks and their drivers, hence the priority areas for adaptation responses. In most existing studies, MMs include physical factors that cause flood hazards and exposures, such as slope, elevation, rainfall, and soil types (Lin et al., 2019; Ogato et al., 2020). However, less attention is paid to the unequal spatial distribution of adaptation interventions, hence differences in the adaptive capacity of land uses and town plans across neighborhoods and their connections to differential vulnerabilities and exposures. The few empirical studies that connect urban form adaptation with differential vulnerabilities and flood exposures also consider the unequal access of vulnerable groups to GBI to identify priority areas for just adaptative interventions– see Meerow and Newell (2017) and Li et al. (2020). However, they overlook frameworks like the UDRI that take into account the configurational characteristics of resilient urban form.
Thus, we operationalized our theoretical framework to address this deficit by proposing a MM whose indicators and variables tackle the spatial distribution of four co-existing risk drivers: (1) flood hazard exposures; (2) social vulnerabilities; (3) low adaptive capacity of land uses (due to a lack of harmony with nature, heterogeneity, and polyvalency); (4) low adaptive capacity of town plans (due to a lack of flexibility and connectivity) – (see Figure 1 and Table 2). Our MM, in total, includes 38 variables, which measure 15 indicators per neighborhood as the unit of analysis, whereby the City of Toronto has defined the neighborhood's boundaries since the 1990's to facilitate collecting data, planning, and analysis2 (City of Toronto, 2019). We mapped all the variables in ArcGIS. We normalized the variables' values from zero to ten (using linear scale transformation) to make them comparable to and combinable with each other (Meerow and Newell, 2017; Lin et al., 2019; Li et al., 2020). We calculated the average of variable values to map each indicator. The following sections explain in detail each risk driver's indicators and variables and the data sources.
Table 2
| Risk drivers | Indicators | Variables (per neighborhood) | (+) or (–) relationship with risks | Data sources | |
|---|---|---|---|---|---|
| I. Exposure to flood hazards | Proximity to floodplains | The percentage of land covered by floodplains | + | TRCA, 2020b | |
| Run-off coefficients | The Run-off coefficients of land use categories (Table 3) | + | City of Toronto, 2020e | ||
| II. Social vulnerabilities | Age | The percentage of people who are 19 years old and under | + | City of Toronto, 2019 | |
| The percentage of 65 years old and above population | + | ||||
| Gender | The percentage of females (15 years old and above) who participate in the labor forcea | + | |||
| The percentage of female people | + | ||||
| Wealth | The percentage of the low-income population | + | |||
| The percentage of households spending 30% and more of their income on shelter costs | + | ||||
| The percentage of Renter households | + | ||||
| Ethnicity, race, and immigration status | The percentage of visible minoritiesb | + | |||
| The percentage of the population with the first generationc status | + | ||||
| The percentage of people with aboriginal identityd | + | ||||
| The percentage of recent immigrants (those who have obtained their landed immigrant or permanent resident statuses between 2011 and 2016) | + | ||||
| The percentage of people with no knowledge of official language (English or French). | + | ||||
| Employment status | The percentage of male people who are not in the labor forcee | + | |||
| The percentage of unemployedf individuals | + | ||||
| Family structure | The percentage of single-parent families | + | |||
| The percentage of Couple census families with three children and more | + | ||||
| The percentage of persons living alone | + | ||||
| Education | The percentage of people (25–64 years old) who have no certificate, diploma, or degree (including high school diploma) | + | |||
| The percentage of people (25–64 years old) whose highest degree is a secondary (high) school diploma or equivalency certificate. | + | ||||
| Built-environment conditions | The percentage of households living in homes with need for major repair | + | |||
| The percentage of households with more than one person per room | + | ||||
| The percentage of Labor Force (above 15) whose main mode of commute to work is public transportationg | + | ||||
| The percentage of movers (people who have lived in another area and have moved here since 2015 or less) | + | ||||
| The percentage occupied private dwellings built before the 1980'sh | + | ||||
| Population density | + | ||||
| III. The adaptive capacity of town plans | Flexibility | The average size of blocks | + | City of Toronto, 2020b | |
| The average size of building footprints | + | City of Toronto, 2020a | |||
| Connectivity | The average density of street networks' intersections | – | City of Toronto, 2020b | ||
| IV. The adaptive capacity of land uses | Harmony with nature | The percentage of land allocated to green spaces | – | City of Toronto, 2020e | |
| and blue spaces | – | ||||
| The density of street trees per square meter | – | ||||
| Polyvalency | The percentage of land covered by open spaces | – | |||
| The percentage of land covered by mixed land uses | – | ||||
| The heterogeneity of land uses | Total number of land use patches | – | |||
| The number of different patches (patch richness) | – | ||||
| The average frequency of different patch types | The number of Commercial patches | – | |||
| The number of Commercial Residential patches | – | ||||
| The number of Commercial Residential Employment patches | – | ||||
| The number of Residential patches | – | ||||
| The number of Open Space patches | – | ||||
| The number of Institutional patches | – | ||||
| The number of Employment Industrial patches | – | ||||
| The number of Utility and Transportation patches | – | ||||
The multicriteria model including the major risk drivers and their associated indicators and variables.
*Flexibility is the additional fifth concept of our theoretical framework.
Structural gender inequality causes female workers to suffer more than their male counterparts from unstable working conditions and low income (Kalev and Deutsch, 2018), reducing their access to assets to cope with risks.
Visible minority refers to “persons, other than Aboriginal peoples, who are non-Caucasian in race or non-white in color” (Chakraborty et al., 2020, p. 4).
First generation refers to “persons born outside Canada. For the most part, these are now, or once were, immigrants to Canada” (Chakraborty et al., 2020, p. 4).
Aboriginal identity relates to “persons who are First Nations (North American Indian), Métis or Inuk (Inuit) or those who are Registered or Treaty Indians or those who have membership in a First Nation or Indian band” (Chakraborty et al., 2020, p. 4).
Male not in the labor force refers to male persons “who are unwilling or unable to offer or supply labor services under conditions existing in their labor markets (including persons who were full-time students currently attending school)” (Statistics Canada, 2008). Many cultures consider males as the main persons who financially support families. Therefore, this variable can indicate the unfavorable financial condition of households, which reduces their access to adaptive resources.
Unemployed persons are those “without work, are available for work and are actively seeking work” (Statistics Canada, 2008).
Flooding events can damage public transportation infrastructure (such as subways), leading to the closure of public transit systems and delays (Nirupama et al., 2014) and adversely affecting those who depend on them.
The Canadian building codes before the 1980's were not strict enough to include emergency conditions (Archer, 2003).
Exposure to Flood Hazards
To identify the exposure of each neighborhood to flood hazards, our MM proposes two indicators: “proximity to flood plains” (Chakraborty et al., 2014; Lyu et al., 2016) and “run-off coefficients” (Thompson, 2006; Meerow and Newell, 2017; Li et al., 2020). We measured the proximity to floodplains by calculating the percentage of land covered by floodplains in each neighborhood using the Floodplain Mapping Index data (TRCA, 2020b) and the Intersect Analysis tool in ArcGIS. We estimated the average Run-off coefficients for each neighborhood, using Thompson's (2006) rational method (also see Li et al., 2020). We first estimated the average area of land covered by land use categories in the rational approach, using the land use data (City of Toronto, 2020e) and the Intersect Analysis tool in ArcGIS (Table 3). We then multiplied the percentage values with their relevant coefficient amount to calculate the average estimated amount for each neighborhood.
Table 3
| Land use categories | Coefficient |
|---|---|
| Utility and transportation | 0.85 |
| Industrial | 0.8 |
| Multi-family and apartment residential | 0.65 |
| Commercial | 0.6 |
| Institutional | 0.6 |
| Single family residential | 0.4 |
| Open spaces | 0.2 |
Social Vulnerabilities
We adopted Chakraborty et al.'s (2014) social vulnerability index to measure the vulnerability of Canadians to floods. Chakraborty et al. (2020) developed this index's indicators and variables based on theoretical debates, policy documents, and Canadians' demographic characteristics across census tracts. They used several statistical approaches to assure the index's generalizability, validity, and replicability. Hence, it is reliable enough to represent Canadians' socioeconomic characteristics, making it an appropriate tool for measuring social vulnerabilities across Toronto in this study. Accordingly, we considered “age,” “gender,” “wealth,” “ethnicity, race, and immigration status,” “employment status,” “family structure,” “education,” and “built-environment conditions” as social vulnerability indicators (see the full list of indicators and variables in Table 2). We extracted all the variable values from the Neighborhood Profiles, which the City of Toronto has built based on the 2016 census data (City of Toronto, 2019).
The Adaptive Capacity of Land Uses
As our theoretical framework indicates (Figure 1), when it comes to assessing the adaptive land uses, this study draws on the three indicators of “harmony with nature,” “polyvalency,” and “heterogeneity” (Table 2).
Dhar and Khirfan (2017) have proposed that the larger the amounts of land covered by natural porous surfaces, such as GBI, the higher harmony with nature of land uses. Thus, we considered the percentage of land covered by green and blue spaces and the density of street trees as variables for measuring the harmony with nature and the adaptive capacity of land uses.
To measure heterogeneity, or the spatial differentiation of land uses, we calculated the values of variables proposed by Cadenasso et al. (2013) per neighborhood. These variables include: (1) the number of land use patches; (2) patch richness, in reference to the number of different land use patches such as commercial, residential, and institutional; (3) the frequency of different patch types, referring to the number of times each land use patch appears in the urban landscape (Table 2). Note that the more the variables' values, the higher the urban form's ability to spread and mitigate climatic hazards like floods.
Several studies have referred to open spaces and mixed-use developments as polyvalent (or multifunctional) land uses that can accommodate floods and provide space for erecting emergency shelters (Macintosh, 2013; Roggema, 2014; Sharifi, 2019a). Therefore, we considered the percentages of areas covered by these land use types per neighborhood as variables to measure polyvalency.
For all the indicators, we used the Zoning By-Law data provided by the City of Toronto (2020e). We used the Intersect Analysis and Summary Statistics tools in ArcGIS to map all the indicators. In addition, the Dissolve and Merge tools in ArcGIS were used for analyzing the third indicator.
The Adaptive Capacity of Town Plans
Building on our theoretical framework, we draw on two indicators of “flexibility” and “connectivity” (Table 2) to measure the adaptive capacity of town plans.
Salat (2017) and Sharifi (2019c) proposed that fine-grained blocks and building footprints are more flexible than large-grained blocks to accommodate changes, such as through small-scale adaptive interventions for incremental adaptation at a lower cost. Furthermore, they can accelerate emergency responses in the advent of flooding disasters by providing opportunities for multi-use developments and enhancing access points at street edges. Thus, we compared the flexibility of town plans in different neighborhoods by calculating the average size of their blocks and building footprints, whereby the smaller the size, the higher the flexibility.
Sharifi and Yamagata (2014); Feliciotti et al. (2016), and Dhar and Khirfan (2017) argued that the connectivity of town plans promotes the accessibility of blocks and buildings through street networks, thus facilitating evacuation planning, emergency search, and rescue activities in the advent of flooding disasters. As Feliciotti et al. (2016) proposed, the higher the number of three- and four-way intersections, the higher the connectivity. Therefore, we used the average density of street networks' intersections per neighborhood as the variable for measuring the connectivity of town plans; in other words, the higher the density, the higher the connectivity.
For both indicators, we used the data provided by the City of Toronto (2020b,d). Furthermore, we used ArcGIS for the Intersect Analysis and Summary Statistics tools to produce the indicators' maps (Table 2).
Weighted Overlay Analysis Through ArcGIS
Since risks result from intersections among multiple drivers with unequal importance, the existing GIS-based multicriteria approaches on flood risk mapping often involve weighted overlay analysis. Qualitative and mixed-method research studies like this one often use experts' judgments for weightings, such as through different approaches of rating and ranking – see: Meerow and Newell (2017); Rincón et al. (2018); Li et al. (2020). This weighting approach facilitates quantifying immeasurable data and responds to the challenges of data scarcity (Wang et al., 2011; Lin et al., 2019).
For this study, we conducted an online survey (using Qualtrics) to seek the experts' opinions regarding the weights of flood risk drivers (Figure 1) and their associated indicators (Table 2). Our survey population comprised Toronto-based planning experts who have experience in at least one of the fields of urban flood management, climate change adaptation, and/or adaptive urban form. We found these experts through a systematic search on Google, LinkedIn, and LinkedIn Premium. Our search yielded 392 relevant experts, working variously in four academic, 13 non-governmental, 27 governmental, and 44 private organizations. We shared the survey link with these experts through email and/or LinkedIn messaging from April to the end of June 2021. The survey eventually yielded 120 responses (31% response rate).
To ask the survey participants to weigh the flood risk drivers, we drew on the Analytic Hierarchy Process (AHP), which is a rational, accurate, cost-effective, and easy-to-use approach for measuring the importance of immeasurable elements through pair-wise comparisons (Lin et al., 2019). First proposed by Saaty (1990) for quantifying the weights of decision criteria, AHP became a popular approach for subjective evaluation of flood risk drivers in GIS overlay analysis – (see: Lin et al., 2019; Li et al., 2020; Ogato et al., 2020). Building on this approach, we asked the expert participants to pair-wisely compare the relative importance of the four risk drivers regarding the exacerbation of flood risks in Toronto with a scale that ranges from 1 (equal importance) to 9 (extremely more important) – see Saaty (1990) and Figure 2.
Figure 2
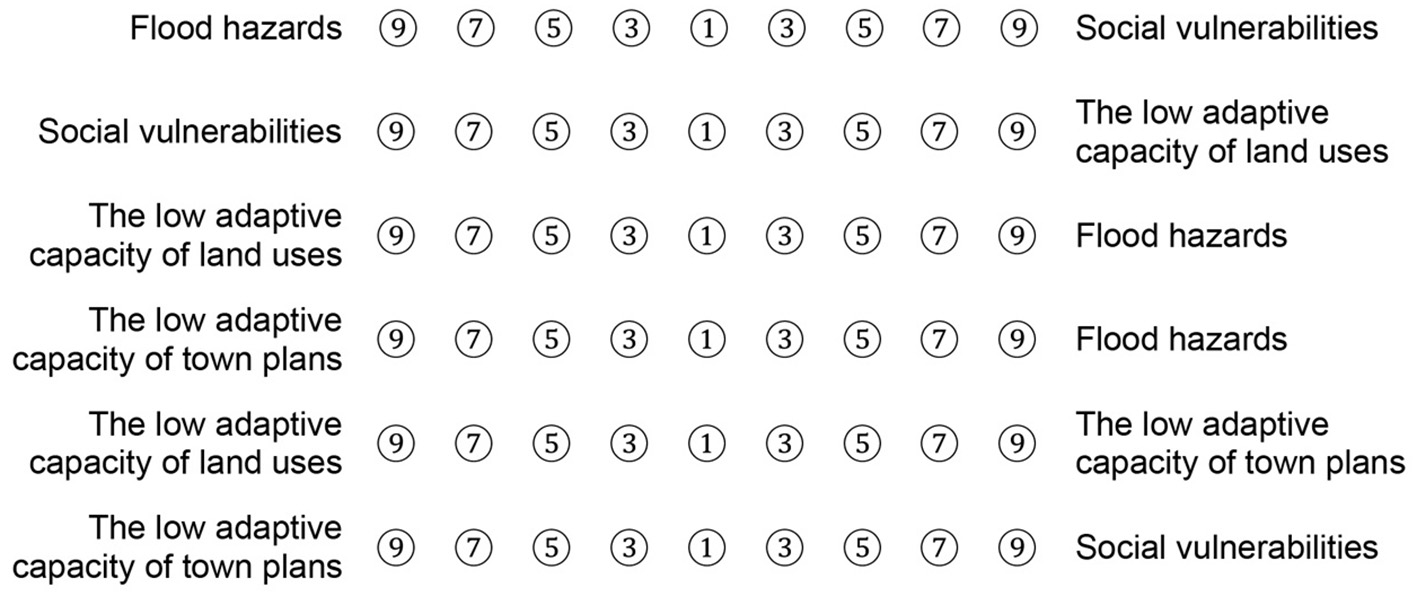
Concepts' weightings through AHP approach.
To interpret the data, we created a pair-wise comparison matrix (i.e., [C]) for each participant based on the fundamental AHP scale suggested by Saaty (1990):
where cij represents the scale preferred by participants for the importance of concept i over the concept j. We then divided the components of the pair-wise comparison matrix [C] by the summation of each column to calculate the normalized matrix [M ]:
where mij is the component of the normalized matrix. We eventually obtained the weight of the ith concept (1 ≤ i ≤ 4) as the average of each row in the normalized matrix:
To evaluate the consistency of the survey responses, we calculated the Consistency Index as follows:
where λmax is the maximum eigen value of the pair-wise comparison matrix [C] and n is the number of concepts that are compared (i.e., n = 4). According to Saaty (1990), a consistent matrix has a Consistency Index of <10% of the Consistency Ratio (C.R.); where the value of the C.R. for a matrix with the size of four is proposed to be 0.9 by Saaty (1990). Considering these consistency criteria, we filtered the responses and calculated the weight of concepts corresponding to each participant. The final weights of concepts are the average of weights obtained for each participant.
While AHP approach is reliable for weighting the four risk drivers, it may become a lengthy task for weighting the 16 indicators due to a large number of pair-wise comparisons (Li et al., 2020). Accordingly, we measured the weights of indicators through direct rating (DR) where expert participants assigned a weight (from 0 to 10) to the impact of indicators on each risk driver – (see Bottomley and Doyle, 2001; Yang et al., 2011) on DR. The final weight of each indicator is the average of weights assigned by all the participants.
Using the weights assigned by the experts, we began our overlay analysis in two steps: overlaying the indicator maps to map their associated concepts and overlaying the risk drivers' maps to draw the final flood risk map. We used the Union Analysis tool and the weighted sum average function in ArcGIS to complete the weighted overlay analysis for both steps. Note that we normalized all the concepts and the final risk map values from 0 to 10, using linear scale transformation (see Figure 3).
Figure 3
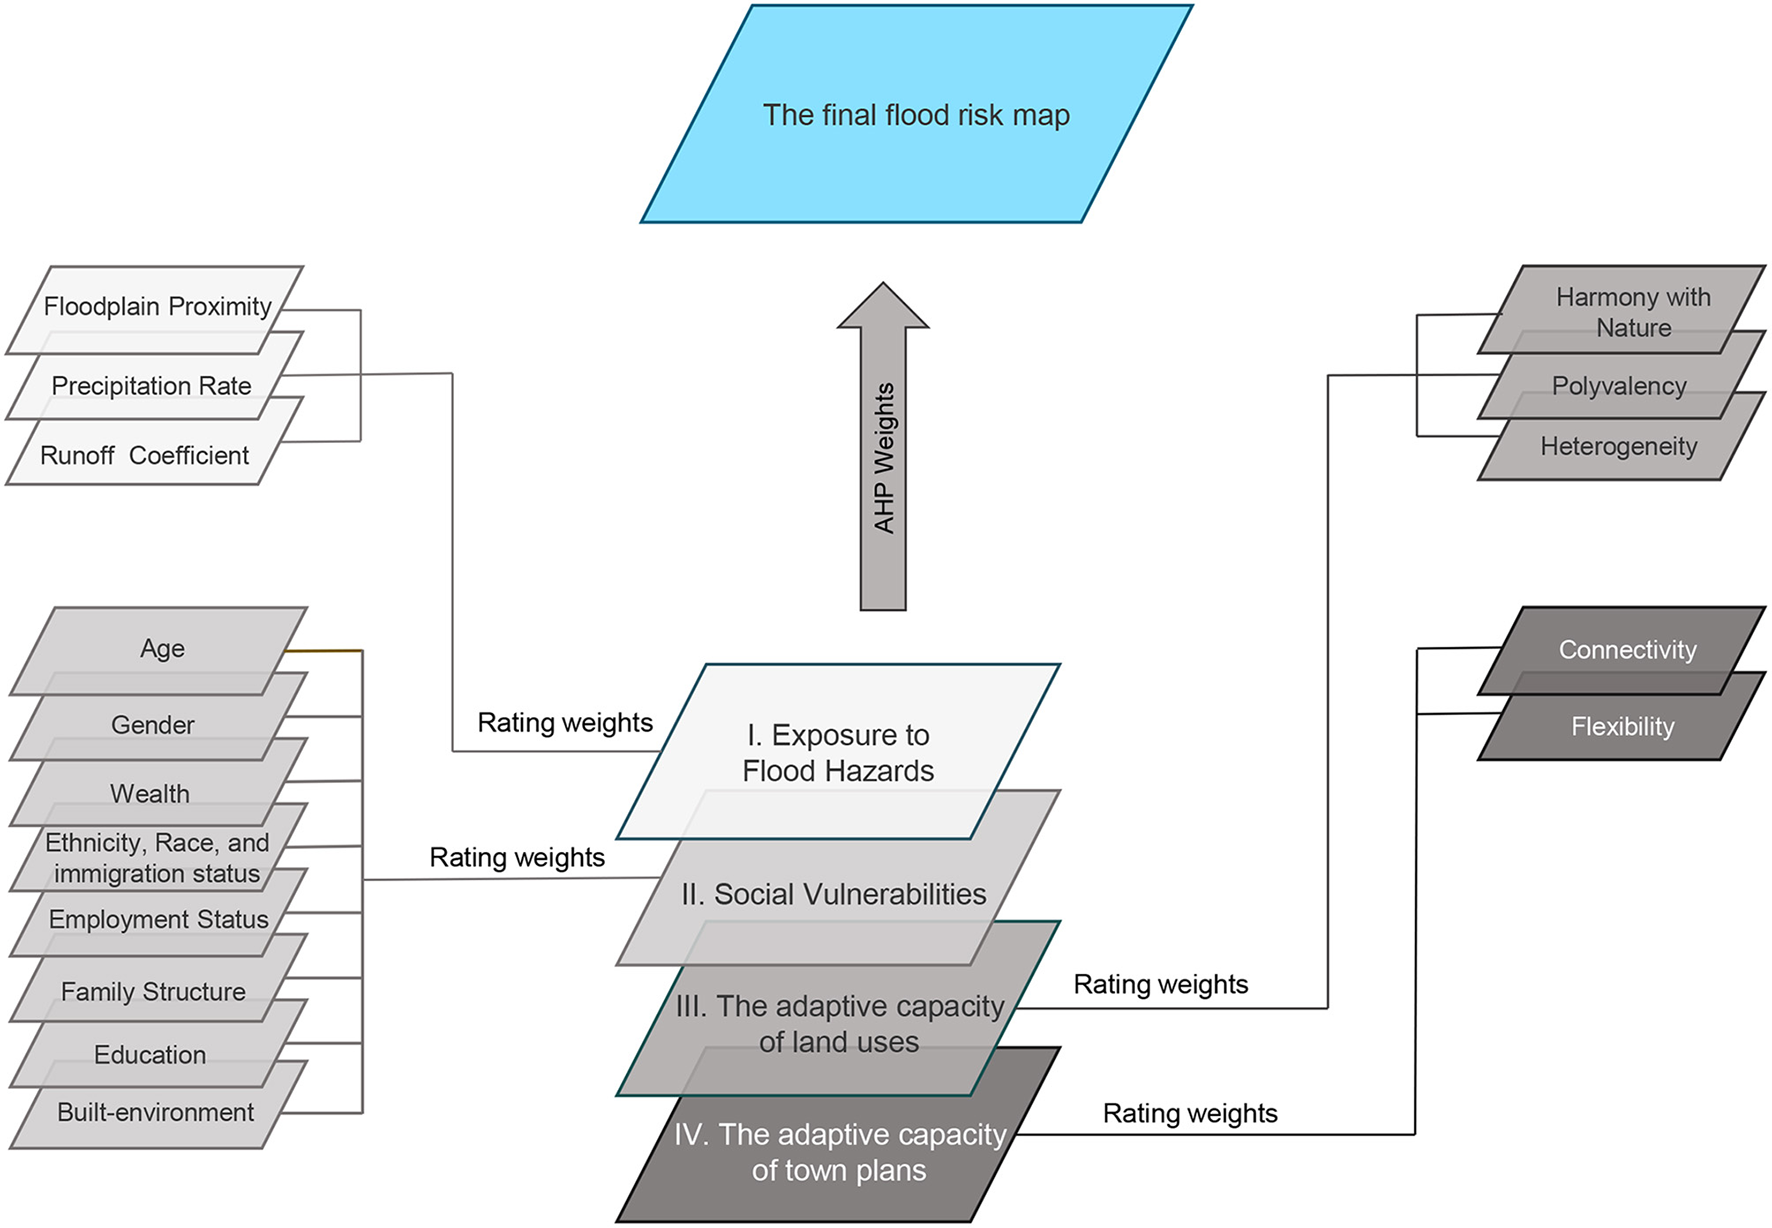
A schematic diagram showing the overlay analysis process.
The Case Study: Toronto
Toronto is Ontario's capital and Canada's foremost economic hub. Toronto spreads over 633.5 km2, and its population totals 2.73 million (in 2016), 50% of which are visible minorities, which makes it the most populous city in Canada and one of the most multicultural cities in the world (Filion et al., 2015; Statistics, 2017). The city's location within the Lake Ontario Watershed and its exposure to moist air masses and high precipitation rates have caused several historical flooding events that caused a loss of lives and damages to properties and infrastructure in 1878, 1954 (after Hurricane Hazel), 1976, 2005, and 2013 (Nirupama et al., 2014; Rincón et al., 2018; TRCA, 2021).
More importantly, there is evidence of increased precipitation rates due to global climate change in this city. Feltmate and Thistlethwaite (2012) mentioned that six 50-year and two 10-year precipitation events had been recorded during just 15 years – from 1996 to 2011. Over the last decade, governmental, non-governmental, academic, and private organizations at the different municipal, regional, and provincial levels have developed stormwater management plans, policies, and/or strategies to promote climate change adaptation (Henstra et al., 2020).
In Toronto, the City's Water Division oversees developing policies and implementing strategies for stormwater management and climate change adaptation. After the approval of the Climate Change Action Plan in 2007, the City of Toronto published its first climate adaptation strategies, including actions on flood protection and emergency management, in a document titled “Ahead of the Storm: Preparing Toronto for Climate Change” (City of Toronto, 2008). Following this document, the City continued to work on its first Resilience Strategy, which includes 50 major plans, such as the Basement Flooding Protection Program and Wet Weather Flow Master Plan and Management Guidelines (City of Toronto, 2017, 2020c).
The City of Toronto collaborates with other organizations as well. Vertically, it works with regional and provincial governmental organizations such as the Toronto and Region Conservation Authority (TRCA). Being one of the 36 conservation authorities in Ontario, the TRCA receives funds from municipalities to offer them information on flood mapping, educational workshops, awareness programs, and low impact development (LID) design guidelines (TRCA and CVC, 2010; Henstra and Thistlethwaite, 2017; TRCA, 2020a,b). At the provincial level, the City receives advice from the Ministry of Environment, Conservation, and Parks (MECP) and the Ministry of Environment and Climate Change (MECC), among others (City of Toronto, 2020c; Henstra et al., 2020). Horizontally, non-governmental organizations (e.g., Toronto Environmental Alliance), private firms (e.g., Metrolinx), and academic institutions (e.g., Intact Center for Climate Change Adaptation) assist the City of Toronto in conducting feasibility assessment projects and developing strategies and standards (Mah et al., 2018; Metrolinx, 2018; City of Toronto, 2020c).
Results: How Are Flood Risks Distributed?
Mapping the Risk Drivers
Exposure to Flood Hazards
In terms of exposure to flood hazards, the survey results show that the average weights of proximity to flood plains and run-off coefficients are 0.47 and 0.53 (Figure 4A). Accordingly, experts believe that the run-off coefficient has a slightly higher impact on exposure to flood hazards in Toronto than proximity to flood plains. When we overlay the indicator values in ArcGIS, using their assigned weights, the results show that Flemingdon Park neighborhood, followed by West Humber-Clairville, and Morningside, are the most exposed to flood hazards (Figure 5A and Table 4).
Figure 4
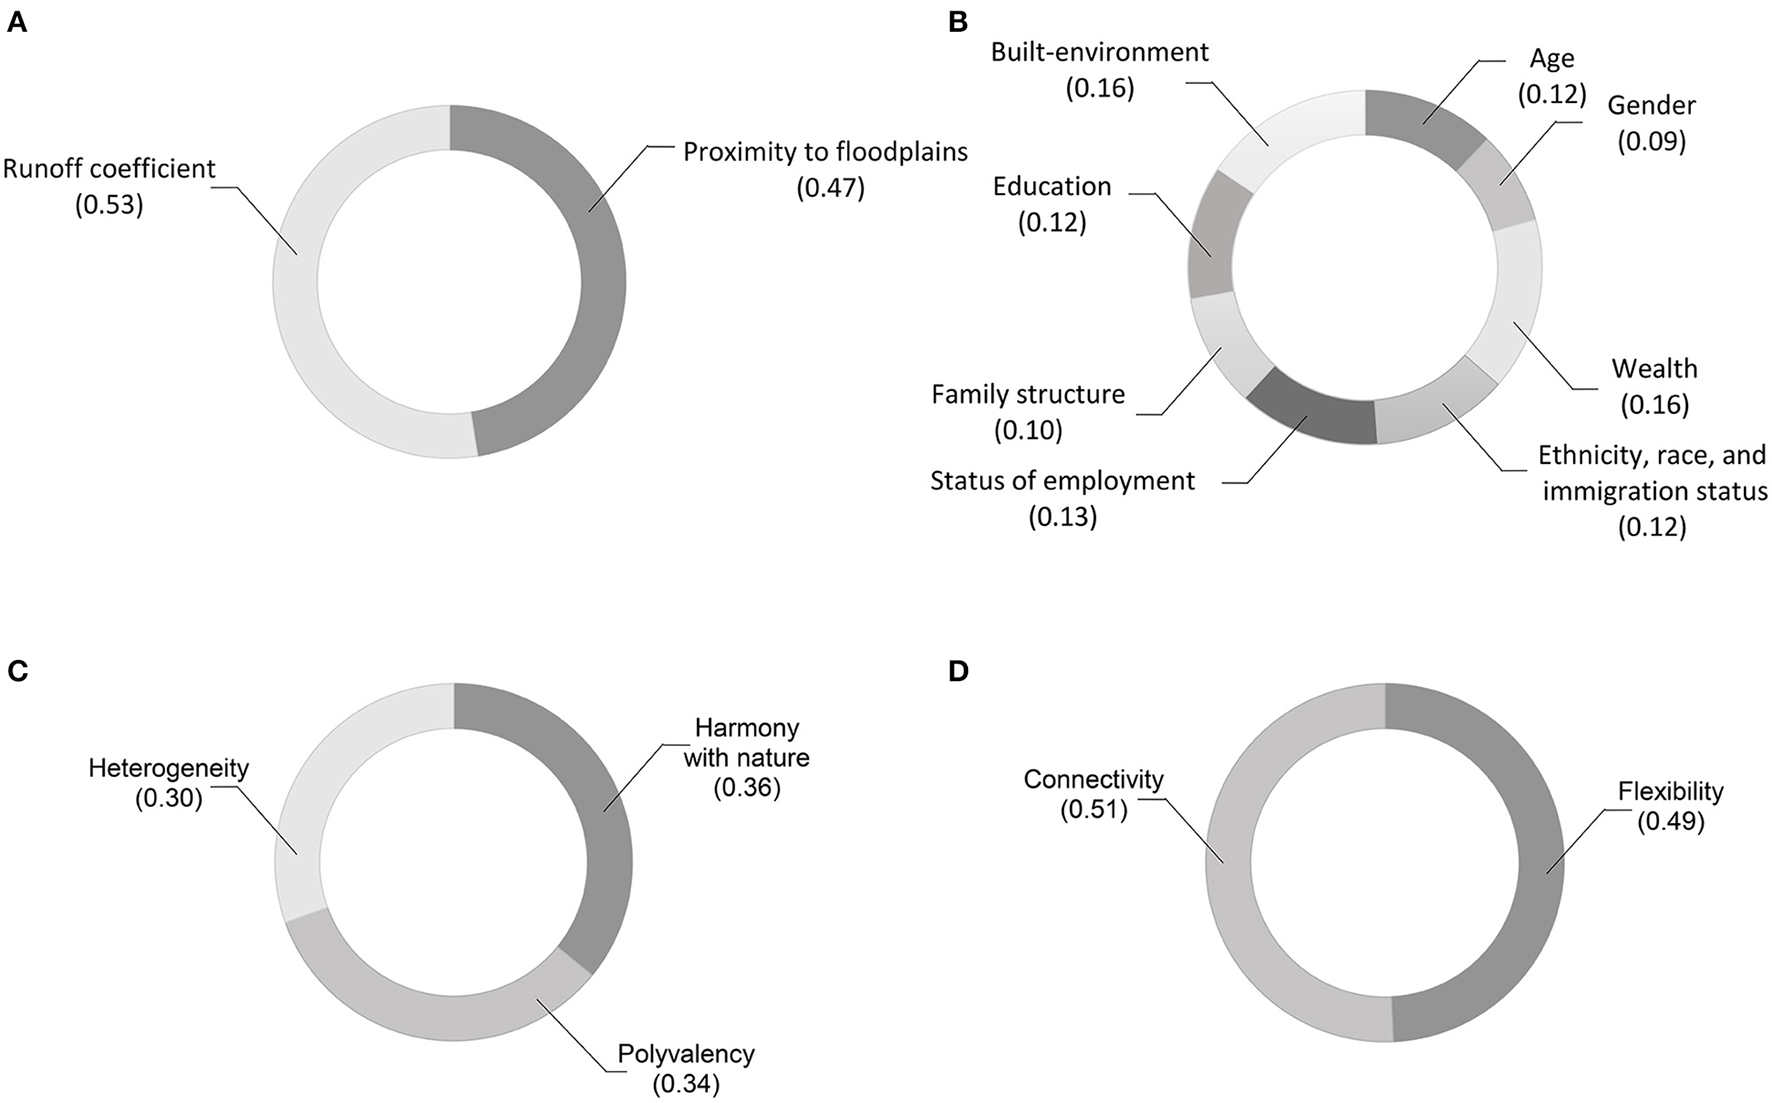
The average weights of risk drivers' indicators. (A) The average weights of flood exposure indicators. (B) The average weights of vulnerability indicators. (C) The average weights of indicators associated with the adaptive capacity of land uses. (D) The average weights of indicators associated with the adaptive capacity of town plans.
Figure 5
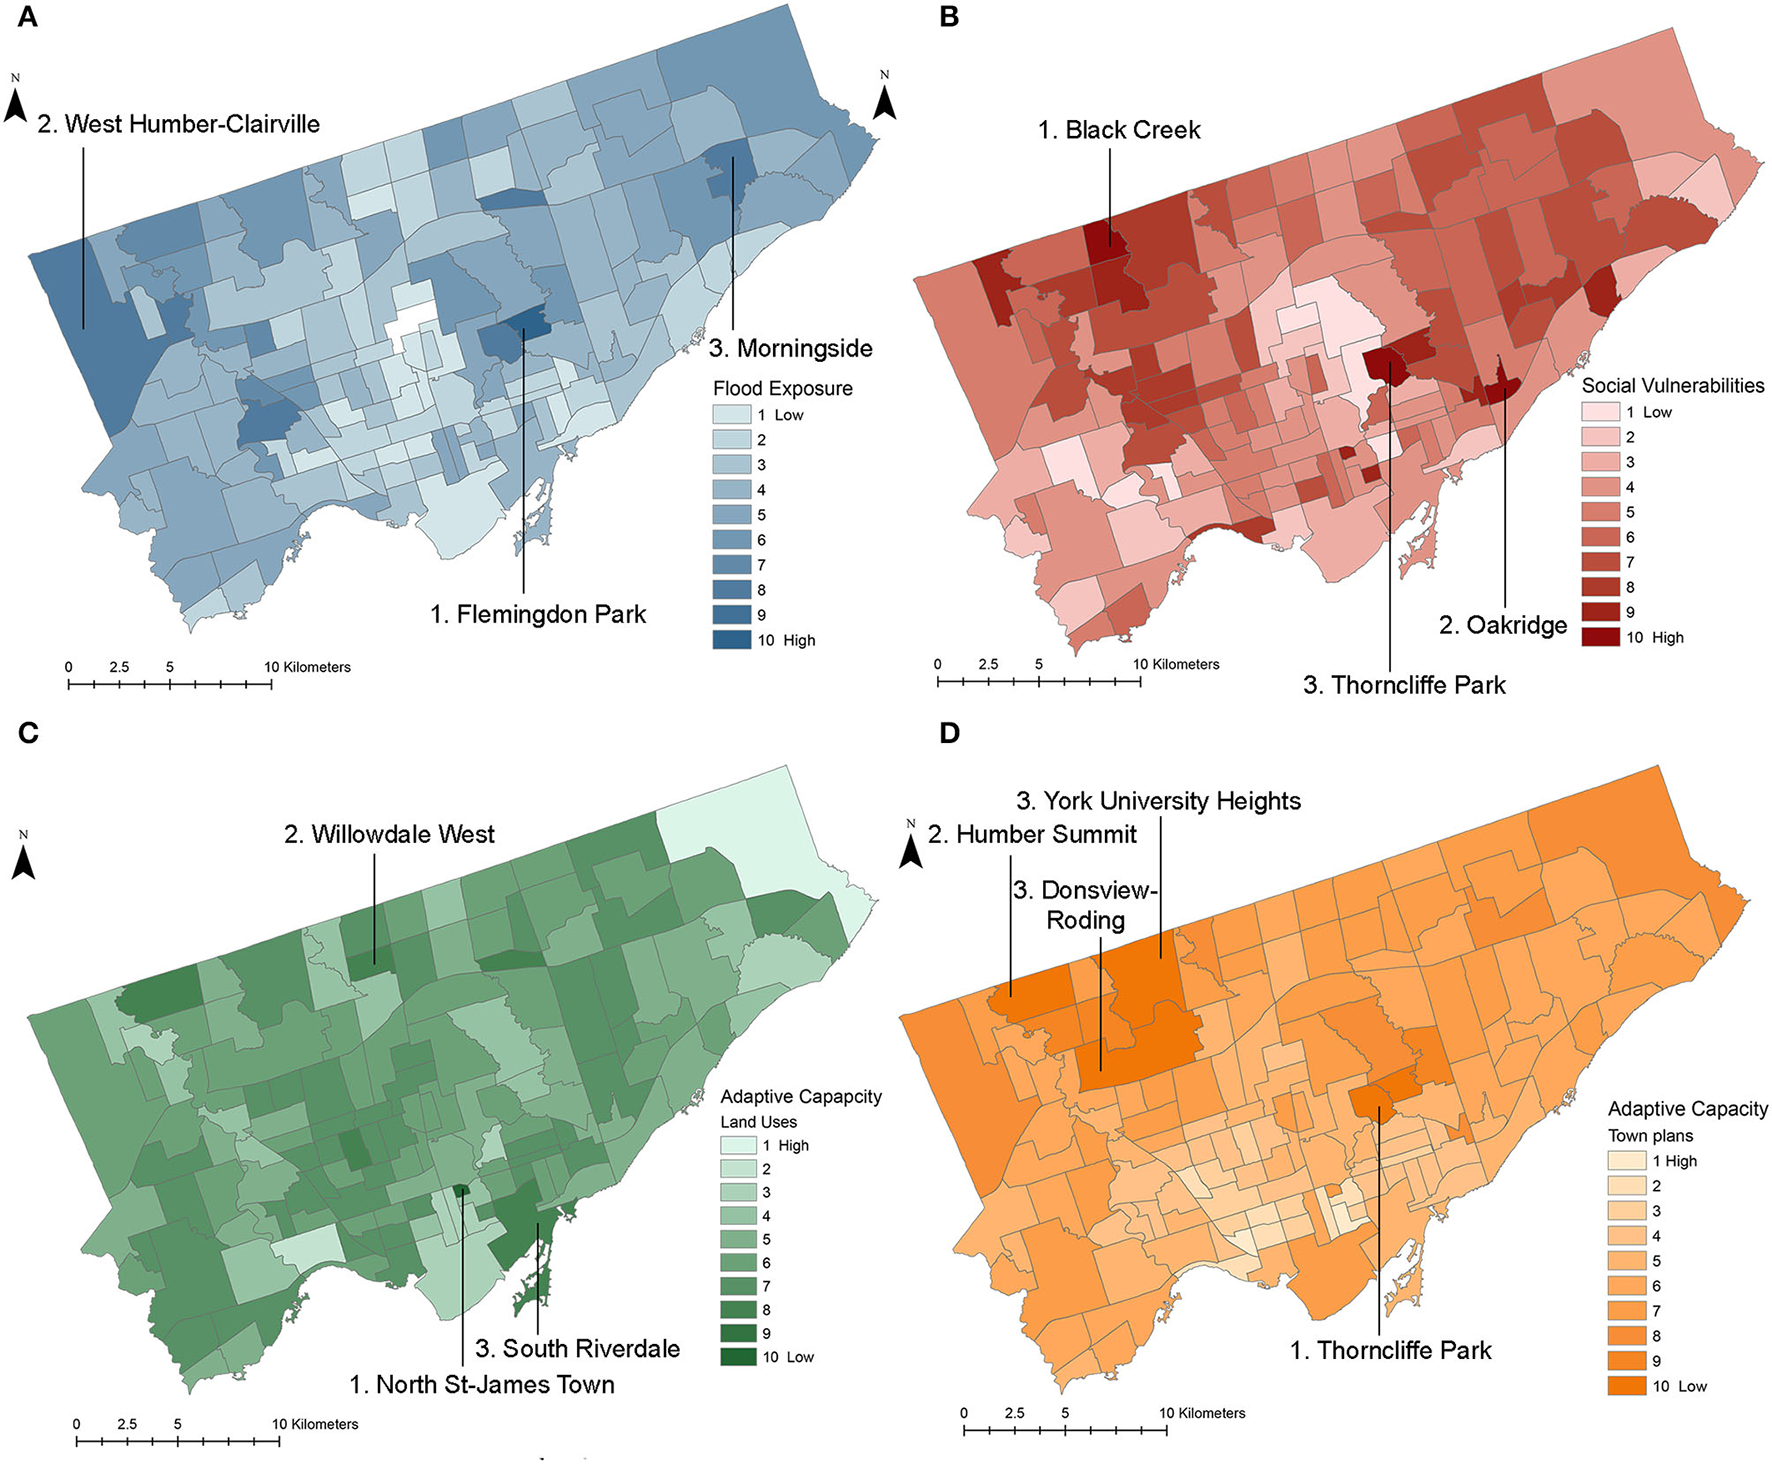
The spatial distribution of the four risk drivers. (A) The spatial distribution of flood hazard exposures across the neighborhoods. (B) The spatial distribution of social vulnerabilities across the neighborhoods. (C) The spatial distribution of neighborhoods with a low adaptive capacity of land uses. (D) The spatial distribution of neighborhoods with a low adaptive capacity of town plans.
Table 4
| Neighborhoods with the worst conditions | |||
|---|---|---|---|
| Ranks | Names | Values (see the legends in Figure 5) | |
| (A) Exposure to flood hazards | 1 | Flemingdon park | 10.0 |
| 2 | West Humber-Clairville | 7.8 | |
| 3 | Morningside | 7.7 | |
| (B) Social vulnerabilities | 1 | Black Creek | 10.0 |
| 2 | Oakeridge | 9.8 | |
| 3 | Thorncliffe Park | 9.6 | |
| (C) Adaptive capacity of land uses | 1 | North St. James Town | 10 |
| 2 | Willowdale West | 7.5 | |
| 3 | South Riverdale | 7.2 | |
| (D) The Adaptive capacity of town plans | 1 | Thorncliffe Park | 10 |
| 2 | Humber summit | 9.6 | |
| 3 | York University heights | 9.3 | |
| 3 | Downsview-Roding | 9.3 | |
The list of neighborhoods with the worst conditions in terms of each risk driver.
Social Vulnerabilities
With regards to social vulnerabilities, the survey results show that wealth and built-environmental conditions (weighted at 0.16 each) have the greatest impact on social vulnerabilities, while gender (weighted 0.09) is the least impactful (Figure 4B). In addition, the overlay analysis of indicators' values by using their weights shows the disproportionate spatial distribution of social vulnerabilities within the city. In this respect, Black Creek neighborhood followed by Oakridge and Thorncliffe Park have the highest social vulnerability to floods (Figure 5B and Table 4).
The Adaptive Capacity of Land Uses
When it comes to the adaptive capacity of land uses, the survey results reveal that harmony with nature followed by polyvalency (weighted 0.36 and 0.34, respectively) have the highest impacts. In contrast, heterogeneity (weighted 0.30) maintains the minimum impact on land uses (Figure 4C). After overlaying these indicators' values (using their assigned weights), the results show that land uses in the North St. James Town neighborhood followed by Willowdale West and South Riverdale have the lowest adaptive capacity (Figure 5C and Table 4).
The Adaptive Capacity of Town Plans
Last, with regards to the adaptive capacity of the town plans, the survey results reveal that flexibility and connectivity (weighted 0.49 and 0.51, respectively) have relatively similar impacts on the adaptive capacity of town plans (Figure 4D). The results of our weighted overlay analysis using ArcGIS show variation among Toronto's neighborhoods in terms of the adaptive capacity of their town plans. As shown in Figure 5D and Table 4, Thorncliffe Park followed by Humber Summit, York University Heights, and Downsview-Roding have the lowest adaptive capacity in their town plans.
Mapping the Final Flood Risk Map: Identifying the Priority Neighborhoods
To map the final flood risk map and to identify which of Toronto's neighborhoods should be prioritized for adaptation interventions, we overlaid the maps of risk drivers (Figure 5) using the weights assigned by the experts. As the experts' survey results show (Figure 6), social vulnerabilities (0.32) have the highest impact on flood risks in Toronto, while exposure to floods (0.22) has the lowest impact. In addition, the experts believe that the adaptive capacity of land uses (0.23) and town plans (0.23) have similar impacts on flood risks. The results of the weighted overlay analysis reveal that Thorncliffe Park followed by Flemingdon Park, North St. James Town, and Black Creek are four neighborhoods that are disproportionately at risk from flooding, hence, must be prioritized in urban form adaptation interventions (Figure 7 and Table 5).
Figure 6
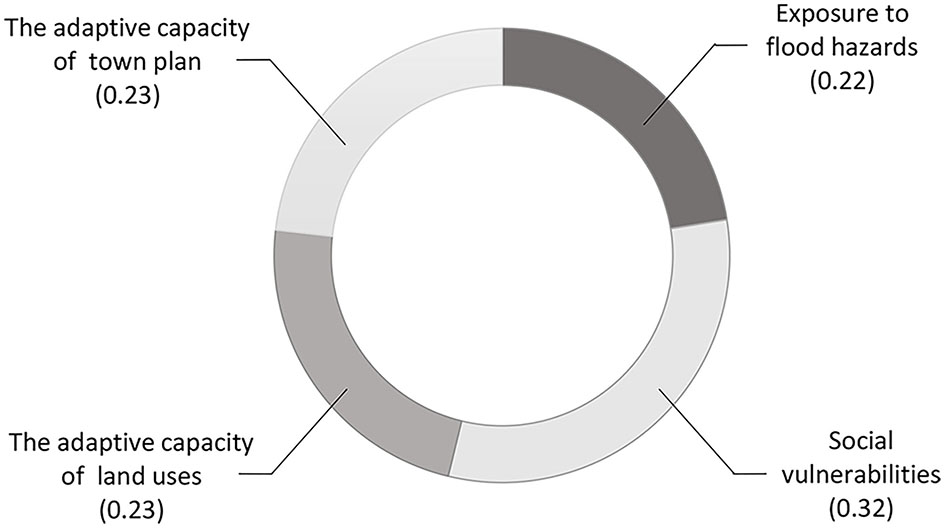
The average weights of risk drivers, assigned by experts.
Figure 7
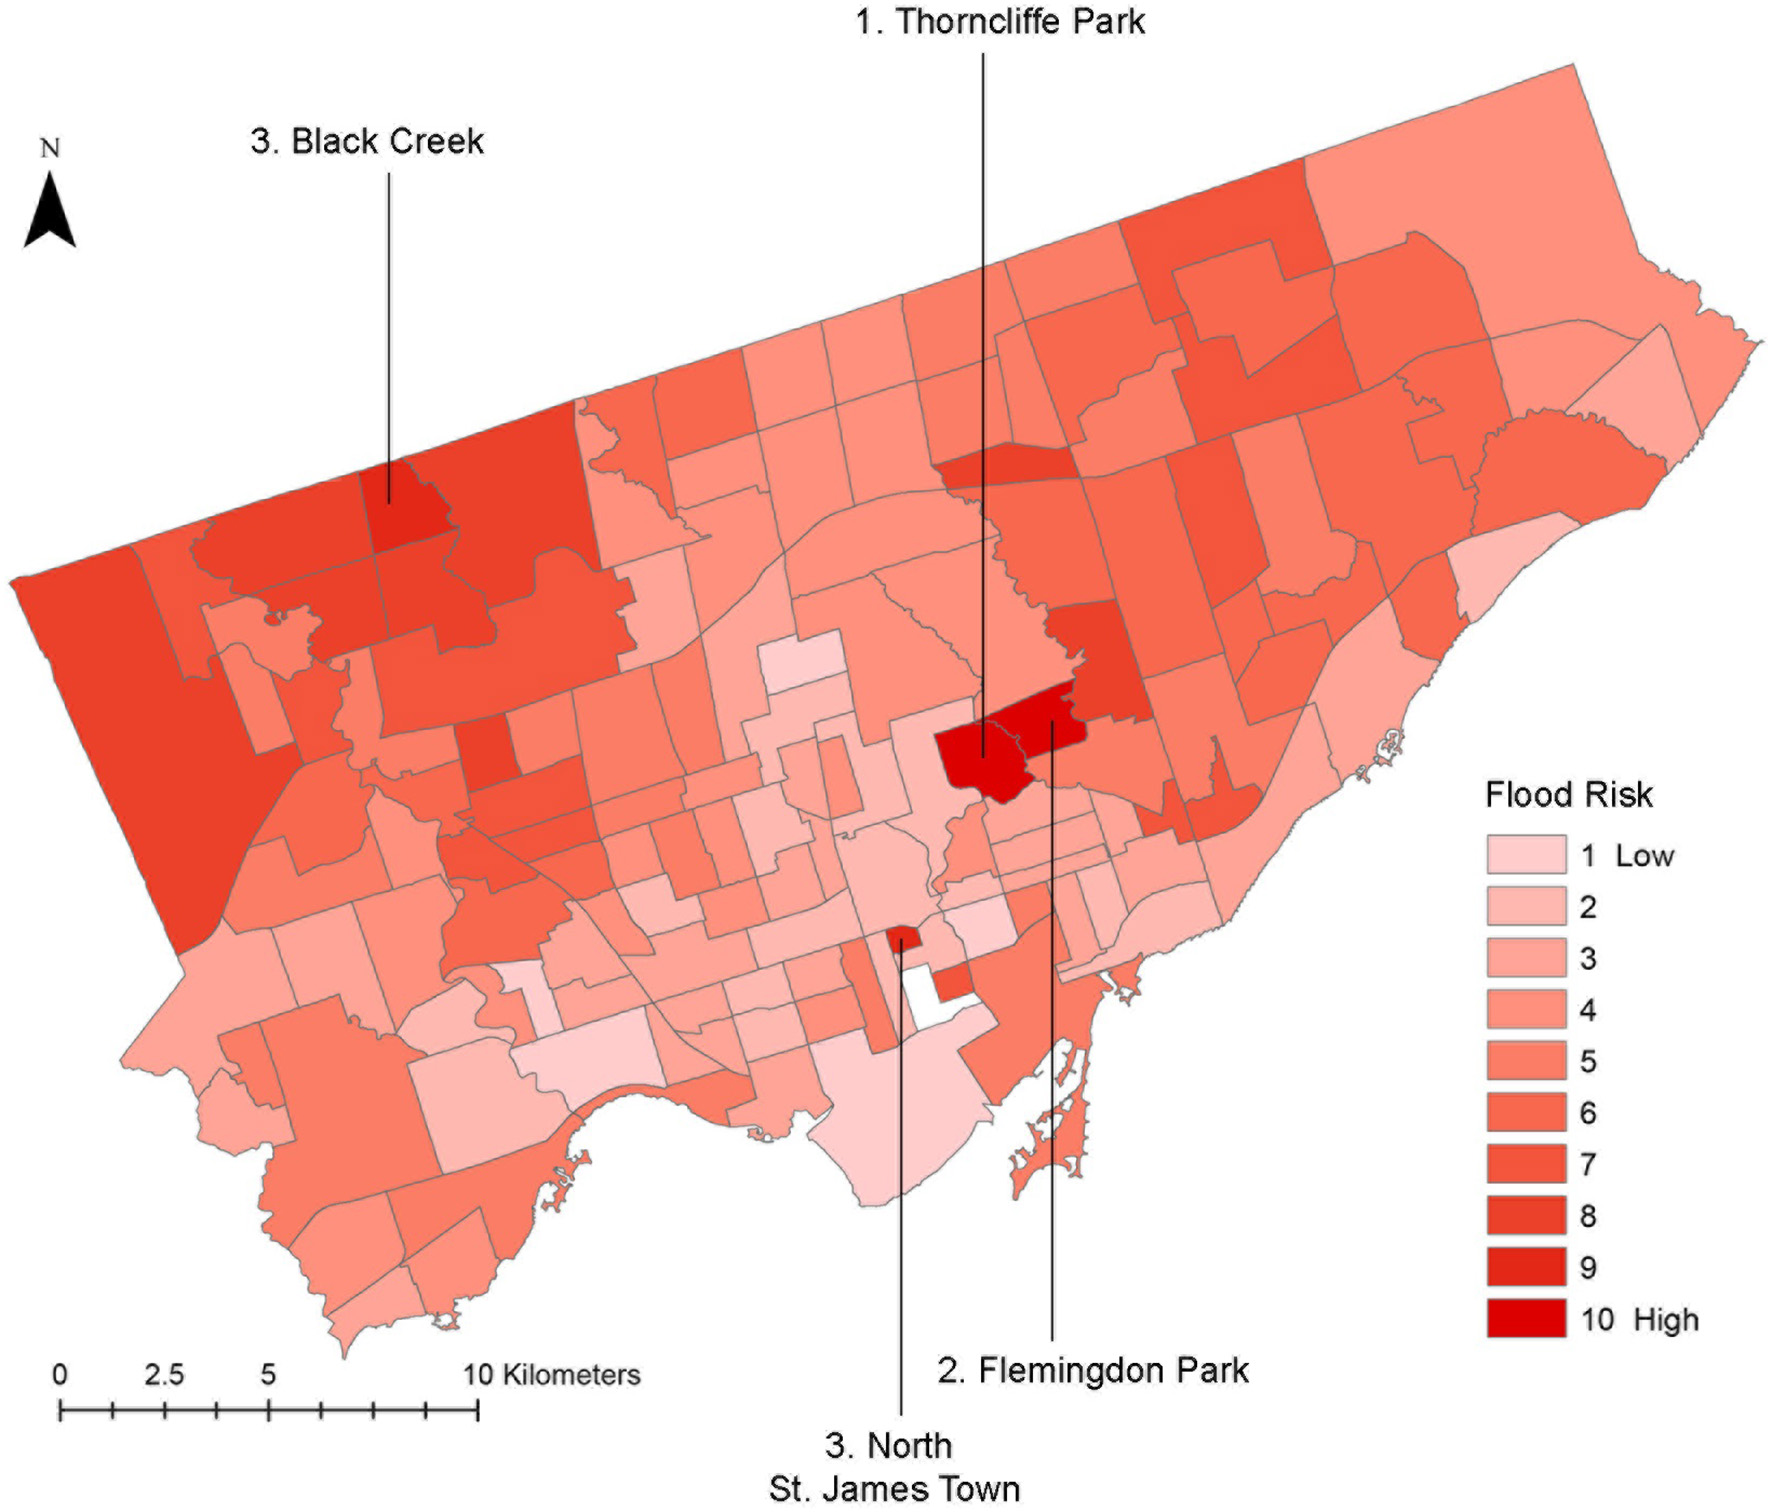
The spatial distribution of flood risks and the priority neighborhoods for urban form adaptation in Toronto (the values are normalized from 1 to 10 when 1 shows low risks and 10 shows high risks).
Table 5
| The priority neighborhoods | |||
|---|---|---|---|
| Ranks | Names | Values (see the legend in Figure 7) | |
| The flood risk map | 1 | Thorncliffe Park | 10.0 |
| 2 | Flemingdon Park | 9.4 | |
| 3 | North St. James Town | 8.2 | |
| 3 | Black Creek | 8.2 | |
The priority neighborhoods and their normalized risk value.
Discussion: Delving Deeper Into the Priority Neighborhoods
Our results show that social vulnerabilities, flood hazard exposures, and urban form adaptive interventions are distributed unequally within the City of Toronto, imposing disproportionate flood risks on three disenfranchised neighborhoods: Thorncliffe Park, Flemingdon Park, North St. James Town, and Black Creek. These four neighborhoods are high-density tower communities with aging infrastructure. They were built based on Le Corbusier's tower in the park concept during the 1950's and 1960's in response to the housing boom after the Second World War. Over time, the working middle-class's disinterest in occupying these towers turned them into “ethnic enclaves” for low-income immigrant families. Often, several families can be found living communally in one unit. The increase of population density in these towers led to disinvestments in their repair and maintenance, leading to dilapidated apartment units and amenities (E.R.A. Architects University of Toronto, 2008; Hassen, 2021). The unfavorable conditions of the built environment, the concentration of poverty, and the impervious surface materials with high run-off coefficients are the main reasons behind the vulnerability to increased precipitation and exposure to increased flooding (Figure 8).
Figure 8
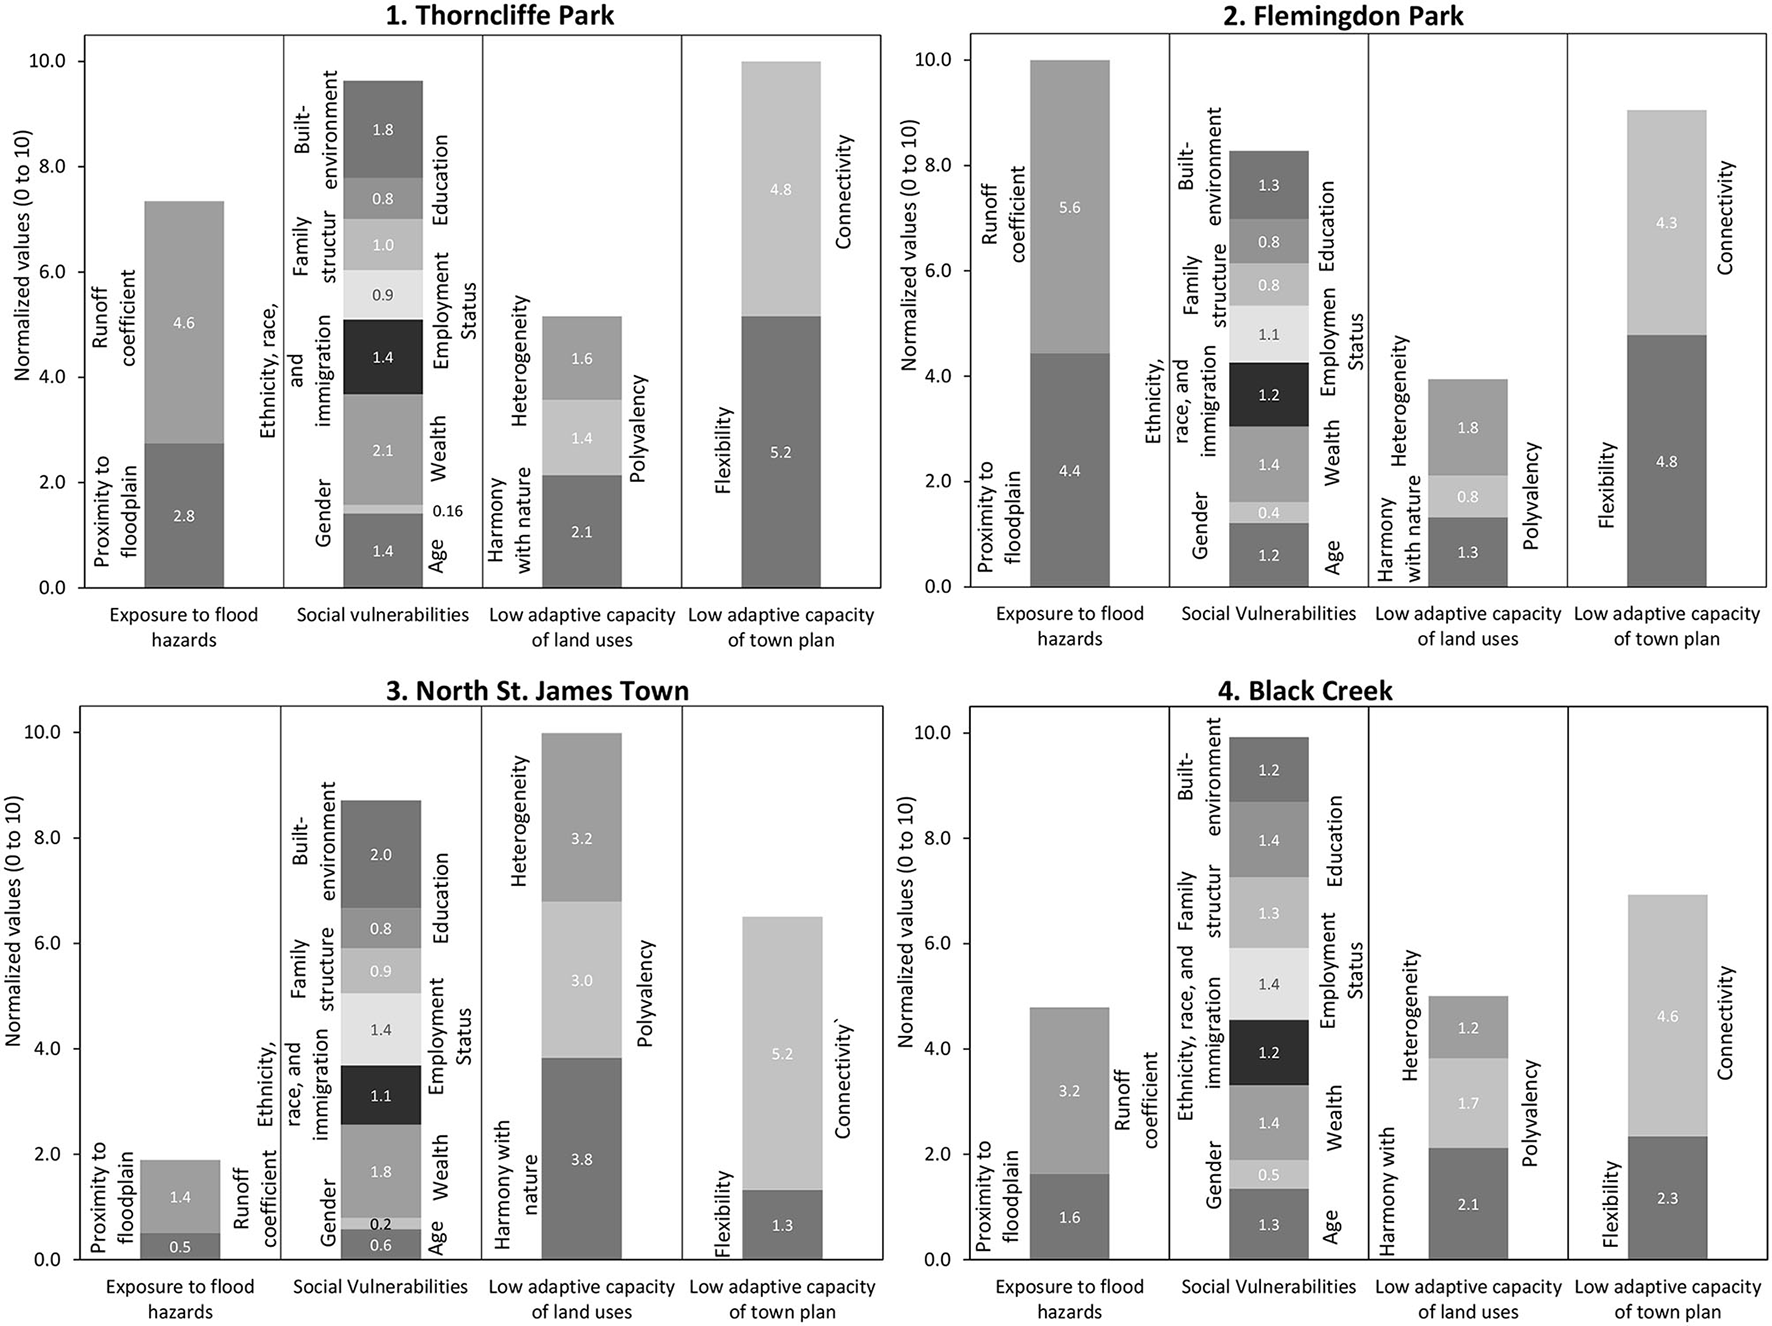
The values of risk drivers and their indicators in the three priority neighborhoods.
More importantly, our analysis of indicator values in Figure 8 shows inadequate adaptive capacities of these neighborhoods' land uses and town plans. The high-rise developments and the separation of land uses have resulted in a lack of land-use heterogeneity as well as urban form's large-grained blocks and disconnected streets (Figure 8). Although the “towers in the park” urban form includes ample open green spaces, other factors reduce the urban form's flexibility to incorporate future changes and its ability to spread run-offs. This is due to the discriminatory policies, lack of maintenance, and, more recently, infill development that have decreased and continue to reduce the quantity and quality of open green spaces and the land uses' harmony with nature. For example, North St. James Town has the lowest area of green space per person in Toronto since new apartment complexes have replaced open green spaces between the towers over time (Nguyen, 2014; Hassen, 2021) – (see Figure 9). Additionally, in Thorncliffe Park, Metrolinx3 plans to replace some open spaces and business buildings with the train yards of the Ontario Line (Aecom Canada Ltd., 2021). These plans have raised the concerns of grassroots environmental justice activists (Savetpark Community, 2021).
Figure 9
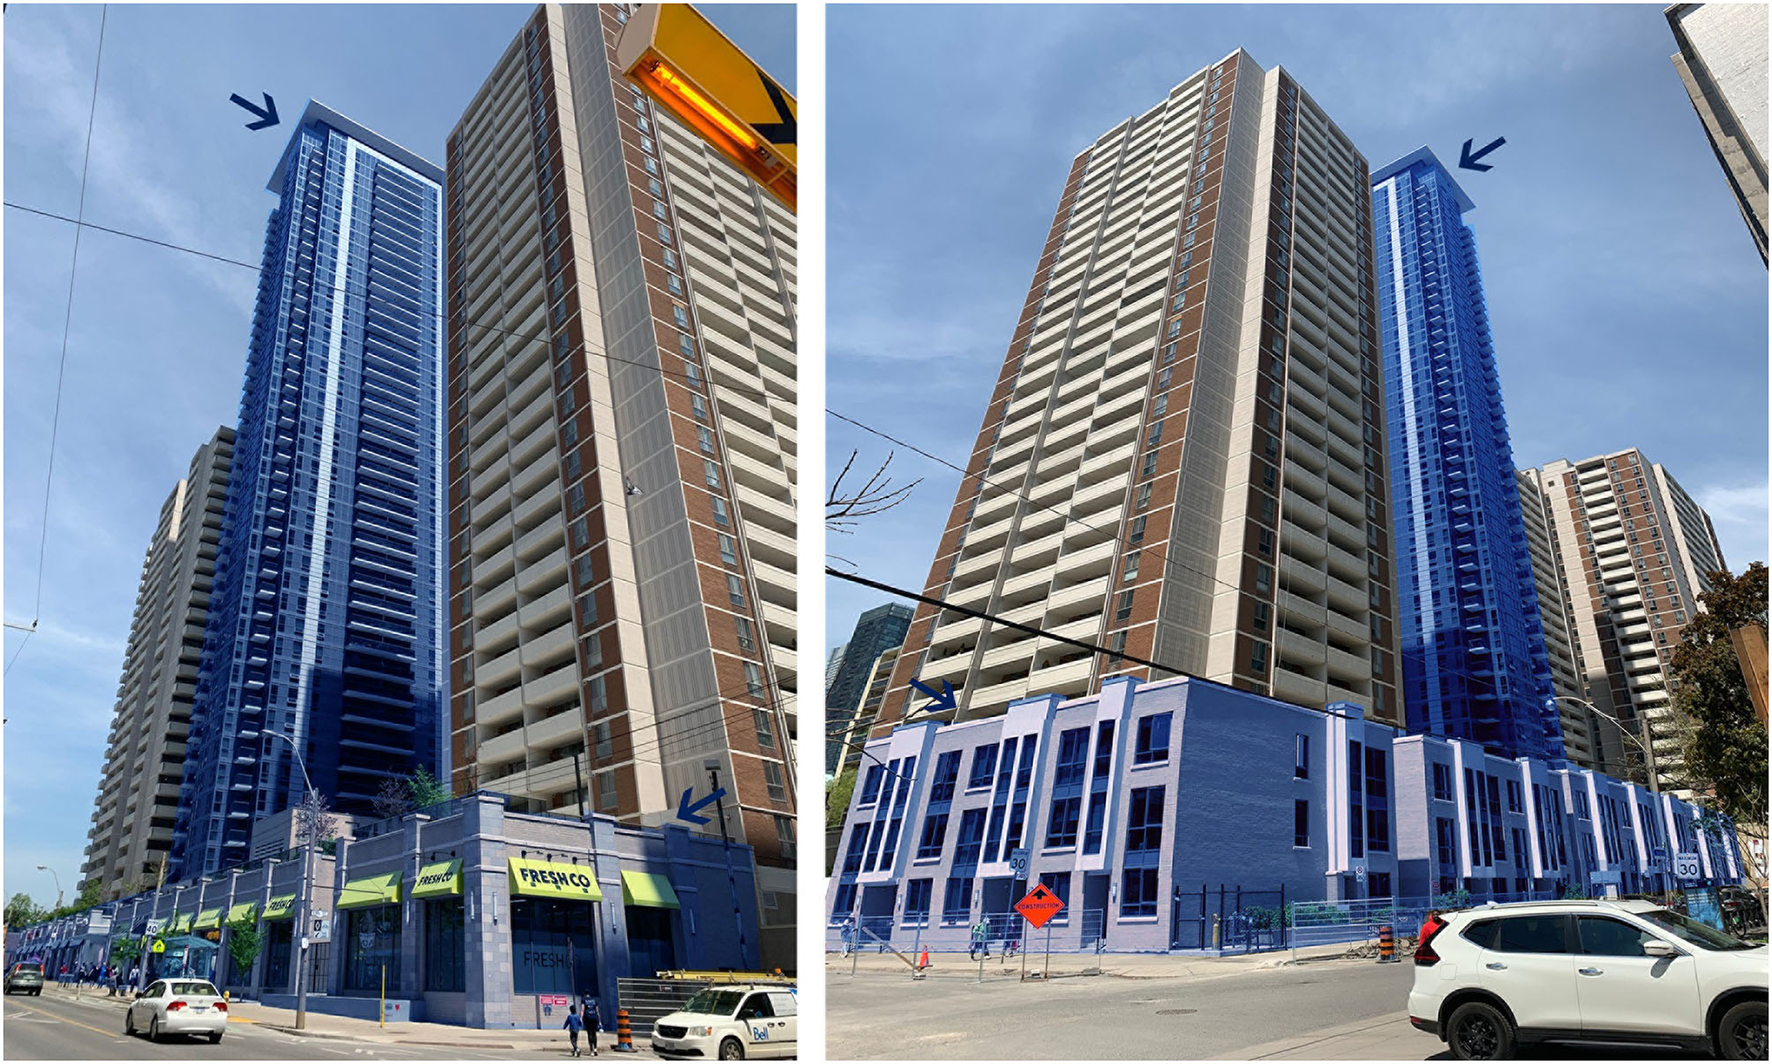
Infill development (the displacement of open spaces with new constructions) in the North St. James Town. Blue highlights show the new developments (photo credit: Luna Khirfan).
Yet, social vulnerabilities remain the most critical in triggering flood risks, particularly the lack of access to wealth when combined with unfavorable built-environmental conditions (Figure 6). Similarly, the run-off coefficient and harmony with nature are the most important indicators of flood exposure and adaptive capacity (Figure 4). Accordingly, we call for future theoretical and empirical studies to investigate how GBI interventions and nature-based solutions can address the root causes of vulnerability in tower communities in Toronto and elsewhere while advancing just adaptation to flooding. Furthermore, we propose that future research explores how low-income and disadvantaged communities and marginalized groups can participate and integrate their needs in the design and implementation of small-scale GBI in a way that curbs, if not altogether avoids, gentrification by maintaining housing affordability.
More importantly, our findings show that the need to prioritize tower communities for just adaptation to changing climate may not be specific to Toronto but applies globally. As they age and dilapidate over time, tower buildings that once were modern 20th century housing types have become the 21st century's affordable housing enclaves for low-income, marginalized, and vulnerable communities, particularly in Western Europe and North America. Over the last two decades, municipalities around the world have proposed strategies to advance social equity and to improve the conditions of the built-environment in similar tower buildings, whether through renovations, public realm improvements, mixed-use developments, and/or the integration of urban agriculture (E.R.A. Architects University of Toronto, 2008; Benko et al., 2018; Veschambre, 2018). Some of these improvements include climate mitigation strategies (i.e., decreasing greenhouse gas emissions through improved energy efficiency) (Aragon et al., 2018; Seebauer et al., 2019). Yet, there is a need for studies that inform both research and policy on the adaptation of tower neighborhoods to climatic events including flooding through participatory processes that are grounded in context-specific needs and the local communities' lived experiences as well as the knowledge of local experts.
Conclusion
This study proposed a multicriteria model whose variables and indicators assess the spatial distribution of social vulnerabilities, flood hazard exposure, and urban form's adaptive capacity to facilitate an assessment of “who” are unequally at-risk to flooding events, hence, should be prioritized in adaptation interventions; “where” are the high-risk priority areas located; and “how” urban form adaptive interventions may advance climate justice in these locations. Specifically, this model changes how risk inequalities are understood by combing sociodemographic indicators with five configurational characteristics of resilient and adaptive land uses and town plans: harmony with nature, heterogeneity, polyvalency, flexibility, and connectivity. We tested the model in Toronto, through weighted overlay analysis using ArcGIS and an online survey of 120 Toronto-based flooding experts, to identify how social vulnerabilities, flood exposures, and adaptation interventions are distributed within Toronto's urban form. This information enables us to identify which neighborhoods are experiencing the highest risks of floods.
The results reveal the uneven spatial distribution of flood risks, hence, identify four neighborhoods that should be prioritized for adaptation interventions: Thorncliffe Park, Flemingdon Park, North St. James Town, and Black Creek. Indeed, these are inner-city, high-density tower communities with old infrastructure and low-income, racialized, and migrant populations – typical of the 20th century modern tower block communities dotted across North America, Europe, and Asia. This study was part of a bigger project. Building on the experts' surveys, the following steps include working with the vulnerable communities through participatory and interactive processes to develop small-scale adaptive GBI solutions grounded on place-based experiences, representing the neighborhood residents' everyday lived experiences. Surely, as more empirical studies investigate the root causes of climate related risks in tower communities beyond Toronto and Canada, we will learn more about why certain communities will need to be prioritized in adaptation interventions and how we can work with them to advance just climate solutions that are grounded in the communities' context-specific needs.
Funding
The funding for this research project was provided by the Social Sciences and Humanities Research Council of Canada (SSHRC) under file number 435-2016-0243. Dr. Amrita Daniere funded the open access publication expenses of our paper. The funders had no role in our research, including manuscript preparation, data collection, and analysis.
Publisher's Note
All claims expressed in this article are solely those of the authors and do not necessarily represent those of their affiliated organizations, or those of the publisher, the editors and the reviewers. Any product that may be evaluated in this article, or claim that may be made by its manufacturer, is not guaranteed or endorsed by the publisher.
Statements
Data availability statement
The original contributions presented in the study are included in the article/supplementary material, further inquiries can be directed to the corresponding author/s.
Ethics statement
The studies involving human participants were reviewed and approved by the University of Waterloo Research Ethics Board (ORE #42887). The patients/participants provided their written informed consent to participate in this study.
Author contributions
NM: research design, investigation, conceptualization, methodology, data curation, formal analysis, literature review, and writing—review and editing. LK: research design, conceptualization, writing—review and editing, supervision, funding acquisition, and project administration. Both authors contributed to the article and approved the submitted version.
Acknowledgments
We are sincerely grateful to the experts who shared their valuable insights through surveys. We would express our deep gratitude to Dr. Alireza Najma for his assistance with analyzing the survey results. Last but not least, we would like to express our special thanks to Dr. Amrita Daniere, who kindly funded the open access publication expenses of our paper.
Conflict of interest
The authors declare that the research was conducted in the absence of any commercial or financial relationships that could be construed as a potential conflict of interest.
Footnotes
1.^ The third component is the three-dimensional built form.
2.^ The City of Toronto consists of 25 wards and 140 neighborhoods. While each ward includes a number of neighborhoods, it is essential to underscore that, in some cases, the ward boundaries do not always align with their associated neighborhoods.
3.^ Metrolinx is a Government of Ontario's agency, which integrates and manages all transportation modes in the Greater Toronto and Hamilton areas (Metrolinx, 2022).
References
1
Abebe Y. Kabir G. Tesfamariam S. (2018). Assessing urban areas vulnerability to pluvial flooding using GIS applications and Bayesian Belief Network model. J. Clean. Prod.174, 1629–1641. 10.1016/j.jclepro.2017.11.066
2
Adger W. N. (2006a). Fairness in Adaptation to Climate Change.Cambridge, MA: MIT press. 10.7551/mitpress/2957.001.0001
3
Adger W. N. (2006b). Vulnerability. Glob. Environ. Change16, 268–281. 10.1016/j.gloenvcha.2006.02.006
4
Aecom Canada Ltd . (2021). Metrolinx Early Works Report, Ontario Line Lower Don Bridge and Don Yard Early Works. Markham, ON: Metrolinx.
5
Anguelovski I. Brand A. L. Connolly J. J. Corbera E. Kotsila P. Steil J. et al . (2020). Expanding the boundaries of justice in urban greening scholarship: Toward an emancipatory, antisubordination, intersectional, and relational approach. Ann. Am. Assoc. Geographers110, 1743–1769. 10.1080/24694452.2020.1740579
6
Anguelovski I. Irazábal-Zurita C. Connolly J. J. (2019). Grabbed urban landscapes: Socio-spatial tensions in green infrastructure planning in Medellín. Int. J. Urban Reg. Res.43, 133–156. 10.1111/1468-2427.12725
7
Anguelovski I. Shi L. Chu E. Gallagher D. Goh K. Lamb Z. et al . (2016). Equity impacts of urban land use planning for climate adaptation: Critical perspectives from the global north and south. J. Plan. Educ. Res.36, 333–348. 10.1177/0739456X16645166
8
Aragon V. Teli D. James P. (2018). Evaluation of retrofit approaches for two social housing tower blocks in Portsmouth, UK. Fut. Cities Environ.4:8. 10.5334/fce.8
9
Archer J. (2003). A Brief History of the National Buildings Code of Canada. A Brief History of the National Buildings Code of Canada. Ottawa, ON: Institute for Research in Construction.
10
Bautista E. Hanhardt E. Osorio J. C. Dwyer N. (2015). New York City environmental justice alliance waterfront justice project. Local Environ.20, 664–682. 10.1080/13549839.2014.949644
11
Benko M. Balla R. Hory G. (2018). Participatory place-making in the renewal of post-Communist large prefabricated housing estate: Újpalota case study, Budapest. J. Place Manage. Dev. 11, 232–241. 10.1108/JPMD-06-2017-0050
12
Blaikie P. Cannon T. Davis I. Wisner B. (2005). At Risk: Natural Hazards, People's Vulnerability and Disasters.London: Routledge. 10.4324/9780203974575
13
Bolund P. Hunhammar S. (1999). Ecosystem services in urban areas. Ecol. Econ.29, 293–301. 10.1016/S0921-8009(99)00013-0
14
Borie M. Pelling M. Ziervogel G. Hyams K. (2019). Mapping narratives of urban resilience in the global south. Glob. Environ. Change54, 203–213. 10.1016/j.gloenvcha.2019.01.001
15
Bottomley P. A. Doyle J. R. (2001). A comparison of three weight elicitation methods: good, better, and best. Omega29, 553–560. 10.1016/S0305-0483(01)00044-5
16
Cadenasso M. L. T. A Pickett S. Mcgrath B. Marshall V. (2013). “Ecological heterogeneity in urban ecosystems: Reconceptualized land cover models as a bridge to urban design,” in Resilience in Ecology and Urban Design, eds S. Pickett, M. CADENASSO, and B. Mcgrath. Dordrecht: Springer. 10.1007/978-94-007-5341-9_6
17
Carter J. G. Cavan G. Connelly A. Guy S. Handley J. Kazmierczak A. (2015). Climate change and the city: Building capacity for urban adaptation. Prog. Plann.95, 1–66. 10.1016/j.progress.2013.08.001
18
Chakraborty J. Collins T. W. Montgomery M. C. Grineski S. E. (2014). Social and spatial inequities in exposure to flood risk in Miami, Florida. Nat. Hazards Rev.15:04014006. 10.1061/(ASCE)NH.1527-6996.0000140
19
Chakraborty L. Rus H. Henstra D. Thistlethwaite J. Scott D. (2020). A place-based socioeconomic status index: Measuring social vulnerability to flood hazards in the context of environmental justice. Int. J. Disaster Risk Reduct.43:101394. 10.1016/j.ijdrr.2019.101394
20
Chu E. Anguelovski I. Roberts D. (2017). Climate adaptation as strategic urbanism: Assessing opportunities and uncertainties for equity and inclusive development in cities. Cities60, 378–387. 10.1016/j.cities.2016.10.016
21
City of Toronto (2008). Ahead of the Storm: Preparing Toronto for Climate Change.Toronto, ON: City of Toronto.
22
City of Toronto (2017). Resilience Strategy [Online]. Toronto, ON: City of Toronto.
23
City of Toronto (2019). Neighbourhood Proiles [Online]. Toronto, ON: Publisher.
24
City of Toronto (2020a). Building Footprints and Tower Points [Online]. Toronto, ON: Publisher.
25
City of Toronto (2020b). Edge of Roads [Online]. Toronto, ON: Publisher.
26
City of Toronto (2020c). Toronto's First Resilence Strategy. Toronto, ON: City of Toronto.
27
City of Toronto (2020d). Toronto Centerline [Online]. Toronto, ON: Publisher.
28
City of Toronto (2020e). Zoning By-law [Online]. Toronto, ON: Publisher.
29
Collins T. W. Grineski S. E. Chakraborty J. (2018). Environmental injustice and flood risk: A conceptual model and case comparison of metropolitan Miami and Houston, USA. Reg. Environ. Change18, 311–323. 10.1007/s10113-017-1121-9
30
Connolly J. J. (2019). From Jacobs to the Just City: A foundation for challenging the green planning orthodoxy. Cities91, 64–70. 10.1016/j.cities.2018.05.011
31
Conzen M. R. G. (1960). Alnwick, Northumberland: A study in town-plan analysis. Transact. Papers1960:122. 10.2307/621094
32
Dhar T. K. Khirfan L. (2017). A multi-scale and multi-dimensional framework for enhancing the resilience of urban form to climate change. Urban Clim.19, 72–91. 10.1016/j.uclim.2016.12.004
33
Dodman D. Archer D. Satterthwaite D. (2019). Editorial: Responding to climate change in contexts of urban poverty and informality. Environ. Urban.31, 3–12. 10.1177/0956247819830004
34
Donner W. Rodríguez H. (2008). Population composition, migration and inequality: The influence of demographic changes on disaster risk and vulnerability. Soc. Forces87, 1089–1114. 10.1353/sof.0.0141
35
E.R.A. Architects and University of Toronto (2008). Mayor's Tower Renewal; Opportunities Book. Toronto, On: City of Toronto.
36
Faccini F. Luino F. Paliaga G. Sacchini A. Turconi L. De Jong C. (2018). Role of rainfall intensity and urban sprawl in the 2014 flash flood in Genoa City, Bisagno catchment (Liguria, Italy). Appl. Geograp.98, 224–241. 10.1016/j.apgeog.2018.07.022
37
Feliciotti A. Romice O. Porta S. (2016). Design for change: Five proxies for resilience in the urban form. Open House Int. 41, 23–30. 10.1108/OHI-04-2016-B0004
38
Feltmate B. Thistlethwaite J. (2012). Climate Change Adaptation: A Priorities Plan for Canada. Intact Centre.
39
Filion P. Moos M. Vindorai T. Walker R. (2015). Canadian Cities in Transition: Perspectives for an Urban Age.Don Mills, ON: Oxford University Press.
40
Freire R. Monteiro E. (2020). The Potential to Become Compact: A Study of Urban Form Flexibility in Brazilian Cities. p. 1–19. 10.2139/ssrn.3630462
41
Gallopín G. C. (2006). Linkages between vulnerability, resilience, and adaptive capacity. Glob. Environ. Change16, 293–303. 10.1016/j.gloenvcha.2006.02.004
42
Garcia-Lamarca M. Anguelovski I. Cole H. Connolly J. J. Argüelles L. Baro F. et al . (2021). Urban green boosterism and city affordability: For whom is the 'branded'green city?Urban Stud.58, 90–112. 10.1177/0042098019885330
43
Graham L. Debucquoy W. Anguelovski I. (2016). The influence of urban development dynamics on community resilience practice in New York City after Superstorm Sandy: Experiences from the Lower East Side and the Rockaways. Glob. Environ. Change40, 112–124. 10.1016/j.gloenvcha.2016.07.001
44
Hassen N. (2021). Leveraging built environment interventions to equitably promote health during and after COVID-19 in Toronto, Canada. Health Promot. Int. 37:daab128. 10.1093/heapro/daab128
45
Henrique K. P. Tschakert P. (2019). Contested grounds: Adaptation to flooding and the politics of (in) visibility in São Paulo's eastern periphery. Geoforum104, 181–192. 10.1016/j.geoforum.2019.04.026
46
Henstra D. Thistlethwaite J. (2017). Climate change, floods, and municipal risk sharing in Canada, Toronto, Institute on Municipal Finance and Governance, Munk School of Global Affairs. Toronto, ON: University of Toronto.
47
Henstra D. Thistlethwaite J. Vanhooren S. (2020). The governance of climate change adaptation: Stormwater management policy and practice. J. Environ. Plan. Manage.63, 1077–1096. 10.1080/09640568.2019.1634015
48
Herreros-Cantis P. Olivotto V. Grabowski Z. J. Mcphearson T. (2020). Shifting landscapes of coastal flood risk: Environmental (in) justice of urban change, sea level rise, and differential vulnerability in New York City. Urban Transform.2, 1–28. 10.1186/s42854-020-00014-w
49
IPCC (2014). “Summary for policymakers,” in Impacts,Adaptation, and Vulnerability. Part A: Global and Sectoral Aspects. Contribution of Working Group II to the Fifth Assessment Report of the Intergovernmental Panel on Climate Change, eds C. B. Field, V. R. Barros, D. J. Dokken, and K. J. Mach. Cambridge: Cambridge University Press.
50
IPCC (2022). Climate Change 2022: Impacts, Adaptation, and Vulnerability. Contribution of Working Group II to the Sixth Assessment Report of the Intergovernmental Panel on Climate Change. Cambridge: Cambridge University Press.
51
Islam N. Winkel J. (2017). “Climate change and social inequality,” in UN Department of Economic and Social Affairs (DESA) Working Papers. 10.18356/2c62335d-en
52
Kalev A. Deutsch G. (2018). Gender inequality and workplace organizations: Understanding reproduction and change. Handbook Sociol. Gender2018, 257–269. 10.1007/978-3-319-76333-0_19
53
Khirfan L. El-Shayeb H. (2020). Urban climate resilience through socio-ecological planning: A case study in Charlottetown, Prince Edward Island. J. Urban.13, 187–212. 10.1080/17549175.2019.1650801
54
Kim H. Marcouiller D. W. Woosnam K. M. (2018). Rescaling social dynamics in climate change: The implications of cumulative exposure, climate justice, and community resilience. Geoforum96, 129–140. 10.1016/j.geoforum.2018.08.006
55
Lennon M. (2015). Green infrastructure and planning policy: A critical assessment. Local Environ.20, 957–980. 10.1080/13549839.2014.880411
56
Li L. Uyttenhove P. Vaneetvelde V. (2020). Planning green infrastructure to mitigate urban surface water flooding risk–A methodology to identify priority areas applied in the city of Ghent. Landsc. Urban Plan.194:103703. 10.1016/j.landurbplan.2019.103703
57
Lin L. Wu Z. Liang Q. (2019). Urban flood susceptibility analysis using a GIS-based multicriteria analysis framework. Nat. Hazards97, 455–475. 10.1007/s11069-019-03615-2
58
Liu L. Fryd O. Zhang S. (2019). Blue-green infrastructure for sustainable urban stormwater management—lessons from six municipality-led pilot projects in Beijing and Copenhagen. Water11:2024. 10.3390/w11102024
59
Long J. Rice J. L. (2019). From sustainable urbanism to climate urbanism. Urban Stud.56, 992–1008. 10.1177/0042098018770846
60
Long J. Rice J. L. (2020). Climate urbanism: Crisis, capitalism, and intervention. Urban Geography2020, 1–7. 10.1080/02723638.2020.1841470
61
Lyu H.-M. Wang G.-F. Shen J. S. Lu L.-H. Wang G.-Q. (2016). Analysis and GIS mapping of flooding hazards on 10 May 2016 Guangzhou, China. Water8:447. 10.3390/w8100447
62
Macintosh A. (2013). Coastal climate hazards and urban planning: how planning responses can lead to maladaptation. Mitigation Adaptation Strategies Global Change18, 1035–1055. 10.1007/s11027-012-9406-2
63
Mah E. Sritharan D. Holness S. (2018). Community Hubs and Climate Change; A Feasibility Assessment. Toronto, ON: Toronto Environmental Alliance, Toronto Community Benefits Network Enviro martum.
64
Matos Silva M. Costa J. P. (2016). Flood adaptation measures applicable in the design of urban public spaces: Proposal for a conceptual framework. Water8:284. 10.3390/w8070284
65
Meerow S. Newell J. P. (2017). Spatial planning for multifunctional green infrastructure: Growing resilience in Detroit. Landsc. Urban Plan.159, 62–75. 10.1016/j.landurbplan.2016.10.005
66
Meerow S. Newell J. P. Stults M. (2016). Defining urban resilience: A review. Landsc. Urban Plan.147, 38–49. 10.1016/j.landurbplan.2015.11.011
67
Meerow S. Pajouhesh P. Miller T. R. (2019). Social equity in urban resilience planning. Local Environ.24, 793–808. 10.1080/13549839.2019.1645103
68
Metrolinx (2018). Climate Adaptation Strategy. Toronto, ON: Metrolinx.
69
Metrolinx (2022). About Us: Metrolinx Overview [Online]. Available online at: https://www.metrolinx.com/en/aboutus/about_us_index.aspx (accessed May 19, 2022).
70
Michael K. Deshpande T. Ziervogel G. (2019). Examining vulnerability in a dynamic urban setting: The case of Bangalore's interstate migrant waste pickers. Clim. Dev.11, 667–678. 10.1080/17565529.2018.1531745
71
Mohtat N. Khirfan L. (2021). The climate justice pillars vis-à-vis urban form adaptation to climate change: A review. Urban Climate39:100951. 10.1016/j.uclim.2021.100951
72
Nguyen K. (2014). Microcity: Rehabilitating St. James Town, Toronto's First Towers-in-the-Park Community. Master of Architecture, Carleton University.
73
Nirupama N. Armenakis C. Montpetit M. (2014). Is flooding in Toronto a concern?Nat. Hazards72, 1259–1264. 10.1007/s11069-014-1054-2
74
O'donnell E. C. Thorne C. R. (2020). Drivers of future urban flood risk. Philo. Transact. R. Soc. A378:20190216. 10.1098/rsta.2019.0216
75
Ogato G. S. Bantider A. Abebe K. Geneletti D. (2020). Geographic information system (GIS)-Based multicriteria analysis of flooding hazard and risk in Ambo Town and its watershed, West Shoa zone, Oromia Regional State, Ethiopia. J. Hydrol.27:100659. 10.1016/j.ejrh.2019.100659
76
Porio E. Dator-Bercilla J. Narisma G. Cruz F. Yulo-Loyzaga A. (2019). Drought and Urbanization: The Case of the Philippines. Urban Drought: Springer. 10.1007/978-981-10-8947-3_12
77
Rawls J. (1971). A Theory of Justice. Oxford, Oxford University Press. 10.4159/9780674042605
78
Ribot J. (2014). Cause and response: vulnerability and climate in the Anthropocene. J. Peasant Stud.41, 667–705. 10.1080/03066150.2014.894911
79
Rincón D. Khan U. T. Armenakis C. (2018). Flood risk mapping using GIS and multicriteria analysis: A greater Toronto area case study. Geosciences8:275. 10.3390/geosciences8080275
80
Roggema R. (2014). Towards a spatial planning framework for climate adaptation. Smart Sustain. Built Environ.1, 29–58. 10.1007/978-94-007-7152-9_2
81
Rufat S. Tate E. Burton C. G. Maroof A. S. (2015). Social vulnerability to floods: Review of case studies and implications for measurement. Int. J. Disaster Risk Reduct.14, 470–486. 10.1016/j.ijdrr.2015.09.013
82
Saaty T. L. (1990). Multicriteria decision making: The analytic hierarchy process: Planning, priority setting. Resource Allocat.2, 1–20.
83
Salat S. (2017). A systemic approach of urban resilience: Power laws and urban growth patterns. Int. J. Urban Sustain. Dev.9, 107–135. 10.1080/19463138.2016.1277227
84
Savetpark Community (2021). Save Thorncliffe Park [Online]. Available: https://www.savetpark.ca/
85
Seebauer S. Friesenecker M. Eisfeld K. (2019). Integrating climate and social housing policy to alleviate energy poverty: An analysis of targets and instruments in Austria. Energy Sources Part B: Econ. Plan. Policy14, 304–326. 10.1080/15567249.2019.1693665
86
Sen A. (1982). Poverty and Famines: An Essay on Entitlement and Deprivation.Oxford: Oxford university press. 10.1093/0198284632.003.0010
87
Sen A. (1992). Inequality Reexamined.Oxford: Oxford University Press.
88
Sharifi A. (2019a). Resilient urban forms: A macro-scale analysis. Cities85, 1–14. 10.1016/j.cities.2018.11.023
89
Sharifi A. (2019b). Resilient urban forms: A review of literature on streets and street networks. Build. Environ.147, 171–187. 10.1016/j.buildenv.2018.09.040
90
Sharifi A. (2019c). Urban form resilience: A meso-scale analysis. Cities93, 238–252. 10.1016/j.cities.2019.05.010
91
Sharifi A. Yamagata Y. (2014). Resilient urban planning: Major principles and criteria. Energy Proc.61, 1491–1495. 10.1016/j.egypro.2014.12.154
92
Shi L. (2020). Beyond flood risk reduction: How can green infrastructure advance both social justice and regional impact?Socio-Ecol. Pract. Res.2, 311–320. 10.1007/s42532-020-00065-0
93
Shi L. Chu E. Anguelovski I. Aylett A. Debats J. Goh K. et al . (2016). Roadmap towards justice in urban climate adaptation research. Nat. Clim. Chang.6:131. 10.1038/nclimate2841
94
Shokry G. Connolly J. J. Anguelovski I. (2020). Understanding climate gentrification and shifting landscapes of protection and vulnerability in green resilient Philadelphia. Urban Clim.31:100539. 10.1016/j.uclim.2019.100539
95
Sohn W. Kim J.-H. Li M.-H. Brown R. D. Jaber F. H. (2020). How does increasing impervious surfaces affect urban flooding in response to climate variability?Ecol. Indic.118:106774. 10.1016/j.ecolind.2020.106774
96
Statistics Canada (2008). Labour Force [Online]. Available online at: https://www150.statcan.gc.ca/n1/pub/81-004-x/def/4153361-eng.htm (accessed May 9, 2022).
97
Statistics Canada. (2017). Census Profile, 2016 Census. Toronto, ON: Publisher.
98
Suarez P. (2002). “Urbanization, climate change and flood risk: addressing the fractal nature of differential vulnerability,” in Proceedings Second Annual IIASA-DPRI Meeting Integrated Disaster Risk Management Megacity Vulnerability and Resilience (Laxenburg), 1–19.
99
Thomas K. Hardy R. D. Lazrus H. Mendez M. Orlove B. Rivera-Collazo I. et al . (2019). Explaining differential vulnerability to climate change: A social science review. Wiley Interdisciplinary Rev. Clim. Change10:e565. 10.1002/wcc.565
100
Thomas K. A. Warner B. P. (2019). Weaponizing vulnerability to climate change. Glob. Environ. Change57:101928. 10.1016/j.gloenvcha.2019.101928
101
Thompson D. B. (2006). “The rational method,” in Engineering Hydrology. Available online at: http://drdbthompson.net/writings/rational.pdf
102
TRCA (2020a). Communicating Flood Risk to Residents Living in Riverine Flood Vulnerable Areas. Toronto, ON: Toronto and Regional Conservation Authorities.
103
TRCA (2020b). Flood Plain Mapping Index [Online]. Toronto, ON: Publisher.
104
TRCA (2021). TRCA Flood Risk Management [Online]. Available online at: https://trca.ca/conservation/flood-risk-management/history
105
TRCA and CVC (2010). Low Impact Development Stormwater Management Planning and Design Guide. Toronto, ON: Toronto and Region Conservation Authority (TRCA), Credit Valley Conservation Authority (CVC).
106
Turhan E. Armiero M. (2019). Of (not) being neighbors: Cities, citizens and climate change in an age of migrations. Mobilities14, 363–374. 10.1080/17450101.2019.1600913
107
Veschambre V. (2018). Renewal and'deverticalization'in French social housing: The emblematic case of the Rhone-Alpes Region. Built Environ.43, 620–636. 10.2148/benv.43.4.620
108
Walker G. Burningham K. (2011). Flood risk, vulnerability and environmental justice: Evidence and evaluation of inequality in a UK context. Crit. Soc. Policy31, 216–240. 10.1177/0261018310396149
109
Wang Y. Li Z. Tang Z. Zeng G. (2011). A GIS-based spatial multicriteria approach for flood risk assessment in the Dongting Lake Region, Hunan, Central China. Water Res. Manage.25, 3465–3484. 10.1007/s11269-011-9866-2
110
Watson D. Adams M. (2010). Design for Flooding: Architecture, Landscape, and Urban Design for Resilience to Climate Change.Hoboken, NJ: John wiley & sons. 10.1002/9781118259870
111
Yang M. Qian X. Zhang Y. Sheng J. Shen D. Ge Y. (2011). Spatial multicriteria decision analysis of flood risks in aging-dam management in China: A framework and case study. Int. J. Environ. Res. Public Health8, 1368–1387. 10.3390/ijerph8051368
112
Zhou W. Pickett S. T. Cadenasso M. L. (2017). Shifting concepts of urban spatial heterogeneity and their implications for sustainability. Landsc. Ecol.32, 15–30. 10.1007/s10980-016-0432-4
113
Ziervogel G. (2020). Climate urbanism through the lens of informal settlements. Urban Geography2020, 1–5. 10.1080/02723638.2020.1850629
Summary
Keywords
climate justice, urban form adaptation, distributive justice, Toronto, spatial analysis, flood risks
Citation
Mohtat N and Khirfan L (2022) Distributive Justice and Urban Form Adaptation to Flooding Risks: Spatial Analysis to Identify Toronto's Priority Neighborhoods. Front. Sustain. Cities 4:919724. doi: 10.3389/frsc.2022.919724
Received
13 April 2022
Accepted
02 June 2022
Published
29 June 2022
Volume
4 - 2022
Edited by
Amrita G. Daniere, University of Toronto, Canada
Reviewed by
Tenley M. Conway, University of Toronto Mississauga, Canada; Emma Porio, Ateneo de Manila University, Philippines
Updates
Copyright
© 2022 Mohtat and Khirfan.
This is an open-access article distributed under the terms of the Creative Commons Attribution License (CC BY). The use, distribution or reproduction in other forums is permitted, provided the original author(s) and the copyright owner(s) are credited and that the original publication in this journal is cited, in accordance with accepted academic practice. No use, distribution or reproduction is permitted which does not comply with these terms.
*Correspondence: Niloofar Mohtat nmohtat@uwaterloo.ca
This article was submitted to Climate Change and Cities, a section of the journal Frontiers in Sustainable Cities
Disclaimer
All claims expressed in this article are solely those of the authors and do not necessarily represent those of their affiliated organizations, or those of the publisher, the editors and the reviewers. Any product that may be evaluated in this article or claim that may be made by its manufacturer is not guaranteed or endorsed by the publisher.