Abstract
Data on electricity consumption is crucial for assessing and modeling energy systems, making it a key element of sustainable urban planning. However, many countries in the Global South struggle with a shortage of statistically valid, geocoded, and disaggregated household-level data. This paper aims to develop a generic methodology for the generation of such a database in terms of electricity consumption. The methodology was tested in Kigali, the capital city of Rwanda, with a focus on all single-family residential building types of the inner city. Discrete data on buildings is obtained through combined information products derived from very high resolution (VHR) satellite imagery, field surveys, and computer assisted personal interviewing. In total, 509 valid geocoded survey datasets were used to evaluate and model household electricity consumption, as well as electrical appliance ownership. The study's findings reveal that the arithmetic mean of specific electricity consumption was 3.66 kWh per household per day and 345 kWh per capita per year in 2015. By subdividing the data into distinct building types as well as their spatial location, and weighting the specific values according to their proportion in the study area, a more accurate mean value of 1.88 kWh per household per day and 160 kWh per capita per year was obtained. Applying this weighted mean to extrapolate household electricity consumption for the study area, in conjunction with the sample's precision level, resulted in an estimate of 126–137 GWh for the year 2015. In contrast, using the arithmetic mean would have led to values twice as high, even exceeding the total electricity consumption of the entire city, including multi-family and non-residential buildings. The study highlights the significance of on-site data collection combined with geospatial mapping techniques in enhancing of understanding of residential energy systems. Using building types as indicators to distinguish between households with contrasting electricity consumption and electrical appliance load levels can address the challenges posed by rapid urban growth in the Global South. This proposed method can assist municipal administrations in establishing a database that can be updated resource-efficiently at regular intervals by acquiring new satellite images.
1. Introduction
The United Nations Conference on the Human Environment in Stockholm in 1972 (United Nations, 1973) was the first world conference to focus on environmental issues. Latest the UN Framework Convention on Climate Change (UNFCCC) (United Nations, 1992) led to global awareness of sustainable development. Based on this framework, the anthropogenic impact on the climate system is not only recognized but should be reduced to a sustainable level. The Kyoto Protocol (United Nations, 1998) and the Paris Agreement on Climate Change (United Nations, 2015a) set milestones in terms of climate action and commitment to reduce greenhouse gas (GHG) emissions. UN's New Urban Agenda (United Nations, 2017) and Sustainable Development Goals (SDGs) (United Nations, 2015b) brought the issue into the urban context. SDG 7 (Affordable and Clean Energy), SDG 11 (Sustainable Cities and Communities), and SDG 13 (Climate Action) are particularly important. The rapid growth of cities especially in emerging and developing countries is creating social, economic, and environmental challenges. The global energy system is the largest single contributor to climate change (IPCC, 2014; WRI, 2017). Reducing energy consumption and energy-related GHG emissions is of utmost global importance to avoid catastrophic climate change (Leopold, 2014). As cities are responsible for a large share of energy consumption and associated GHG emissions, the interdependence of the three SDGs mentioned is evident.
At the global level, Rwanda ratified the UNFCCC in 1998 (UNFCCC, 2022b) and the Paris Agreement on Climate Change in 2016 (UNFCCC, 2022a). Rwanda also joined the Climate Vulnerable Forum (CVF) in 2009 (Climate Vulnerable Forum, 2022), whereby all member states are pursuing the 1.5°C limit by the commitment to 100% electricity supply from renewable energies by 2050 (UNFCCC, 2016). In 2007 Rwanda acceded to the East African Community (EAC) Treaty, which includes energy cooperation among partner states. Milestones include the establishment of the Eastern Africa Power Pool (EAPP) in 2005, the EAC Climate Change Master Plan in 2011, and the EAC Vision 2050 of 2014 (Hankins et al., 2016). The EAC Vision 2050 emphasizes sustainability as well as the environment and natural resource management (EAC, 2016). At the national level, there are several plans, guidelines, strategies, and policies related to sustainable development in general and its application in the energy sector in particular. This includes among others “Rwanda's Adaption Communication to the UNFCCC” (GoR and MoE, 2021), the “National Roadmap of Green Secondary City Development” (GoR and GGGI, 2015), the “Sustainable Energy for All (SE4ALL) Action Agenda” (MININFRA, 2015c, 2016b), the “National Strategy for Climate Change and Low Carbon Development” (GoR, 2011), the “Energy Sector Strategic Plan” (MININFRA, 2015a, 2018), and “Rwanda Energy Policy” (MININFRA, 2015b). The core objectives of Rwanda's energy policy include: “Ensuring the sustainability of energy [...] consumption so as to prevent damage to the environment and habitats” (MININFRA, 2015b). In terms of sustainability and climate protection, Rwanda not only focuses on renewable energies but also demand side management and energy efficiency (MININFRA, 2015b; Republic of Rwanda, 2015). Rwanda wants to become a “developed climate-resilient, low carbon economy by 2050” (GoR, 2011). Achieving energy security and a low carbon energy supply is one of the three key strategic objectives (GoR, 2011). Low carbon urban systems and sustainable urban development as well as sustainable supply and demand of energy are specifically addressed in Rwanda's “Vision 2050” (MINECOFIN, 2020). Yet the commitment to climate protection and renewable energies in Rwanda is not limited to the political level but also finds substantial support among the population (Oluoch et al., 2022).
To develop policies and initiate a change toward more sustainability, data on energy supply and end use is a prerequisite (Ó Gallachóir et al., 2007). In general, data for countries of the Global South are scarce, often outdated and rarely with spatial reference (Bhattacharyya and Timilsina, 2009; Tatem and Linard, 2011; Cader et al., 2018). Larger databases are available for top-down analyses, but these are often based on assumptions, estimations and calculations. Common providers of aggregated energy data are, for example, the International Energy Agency (IEA), the International Renewable Energy Agency (IRENA), the World Bank Group with their “World Development Indicators”, and the CIA with their “World Factbook”. While these data can be used as a preliminary estimate, they do not allow for disaggregation or local analysis. Rwanda is well aware of this and has been successfully addressing the situation for years with data generation at the local level and the use of GIS. Worth mentioning are their integrated planning and data management as one of the pillars of the “National Strategy for Climate Change and Low Carbon Development” already published in 2011 (GoR, 2011), Rwanda's “Land Management and Planning Vision 2050” (Warnest et al., 2012), and most recently the “National Land-Use and Development Master Plan 2020–2050” (Republic of Rwanda, 2020). There is also a training of Sector Land Managers, in which a Land Information System (an administrative GIS) has been developed and is being applied in Rwanda (Ali et al., 2016). At the time of the survey, about 400 Sector Land Managers were working in the 416 administrative sectors in Rwanda. Although Rwanda already uses GIS extensively, the spatial data available mainly focuses on mapping and monitoring various areas of natural science (Warnest et al., 2012; Byizigiro et al., 2020; Ngwijabagabo et al., 2021; Tafahomi and Nadi, 2021), land use and land cover change (Warnest et al., 2012; Akinyemi et al., 2017; Rwanyiziri et al., 2020; Bizimana et al., 2021; Kabeja et al., 2021), solar energy (potential) (Ukwishaka et al., 2021), and the electricity network (ESRI Rwanda et al., 2022; EUCL and ESRI Rwanda, 2022). GIS applications in the health sector and modeling spatio-temporal dynamics of diseases do also exist (Bizimana and Nduwayezu, 2021; Nyandwi et al., 2022). Rwanda is thus a good example of effectively employing GIS in countries of the Global South. Yet data on specific electricity consumption in this context is insufficient, and that is precisely where this study comes in. Without going into the physical details of electrical engineering, three fundamental aspects of electricity consumption determine the system of electricity generation and distribution: quantity, location, and time. Once this data is available, including a reliable forecast for the future, the power plant portfolio and the power network can be reliably planned and ultimately built to ensure a secure supply of electricity. With the high penetration of variable renewable energies and increasing electricity consumption, it becomes even more important. The main challenge of an energy system is balancing supply and demand. When electricity demand exceeds supply, power blackouts occur. This is a major problem in sub-Saharan Africa, especially in less well-off areas (Aidoo and Briggs, 2019). The method presented can be used to support dynamic cities in their efforts to achieve more sustainable development, thereby increasing resilience to climate change and alleviating poverty.
Electricity demand forecasting becomes increasingly important (Yang et al., 2021) and distinguishing between different households in electricity consumption leads to more accurate results (Grandjean et al., 2012; Carlson et al., 2013). Tusting et al. (2019) showed correlations between housing type and socio-economic factors by analyzing 51 national census reports in sub-Saharan Africa. A relationship between dwelling types, socio-economic parameters and electricity consumption was demonstrated by Cheng and Steemers (2011), McLoughlin et al. (2012), and Jones et al. (2015). According to Torriti (2014), building type is the most common characteristic of household electricity demand models. Some researchers use electricity consumption data to classify households (Beckel et al., 2013; Hino et al., 2013). The approach of this study is exactly vice versa and consists of assigning electricity consumption to a given categorization of households. The same principle has been successfully applied to solid waste generation patterns in Da Nang, Vietnam (Vetter-Gindele et al., 2019) as well as socio-economic conditions in general in Belmopan, Belize (Warth et al., 2020).
Aggregated data from urban infrastructure sectors such as energy and water consumption or solid waste generation are difficult to break down to individual households. Here, the top-down approach fails due to the exact allocation to the levels of residential, commercial, and industrial, the general reliability and accuracy of the data, the unequal characteristics of the population (the gap between rich and poor or between urban and rural), and the dynamics of cities especially in the Global South (population growth, increasing income, etc.). Thus, there is the challenge of generating reliable, specific, disaggregated data as cost-effectively and quickly as possible, and then being able to use this data target-oriented for bottom-up analyses. This study aims to assess urban household electricity consumption by on-site data collection and geospatial mapping techniques. The method will be tested in Kigali, Rwanda. It is based on the hypothesis that there is a relationship between electricity consumption and building typology, which also represents the ownership of electrical appliances. Gustavsson (2007) and Koo et al. (2018) claim that households will have an increasing number of electric appliances as a function of time after getting access to electricity. This in turn leads to higher electricity consumption. The differences should be specifically considered in urban dynamics (e.g., rising income, informal settlement upgrading) or general bottom-up analyses (extrapolation). A static approach with an average electricity consumption (arithmetic mean) that applies to all households would not be expedient (Carlson et al., 2013). Without reliable data on electricity consumption at the industry, public or commercial level, it is difficult to use a top-down approach solely for the household level. Furthermore, bottom-up approaches are more accurate than disaggregating higher-level statistics, especially when there is significant variability in the specific data. By analyzing building types as well as their spatial distribution in Kigali, and linking them to information gathered in field surveys, a reliable extrapolation of household electricity consumption at a bigger scale is possible. This facilitates the planning and design of electricity grids and power plant portfolios, especially with high penetration of variable renewable energies. It also supports sustainable urban development, as it is possible to assess both the status quo and possible future scenarios under business as usual or compliance with the SDGs or other national or international climate protection targets. The bottom-up assessment here is to compare the extrapolation of the specific values based on the arithmetic mean and the weighted mean. The hypothesis is that weighting according to the proportion of each distinct building type in the study area leads to a better estimate than an arithmetic mean.
2. Materials and methods
Figure 1 shows the framework for the bottom-up assessment of household electricity consumption. The starting points for this study are two datasets whose consolidation enables bottom-up analyses. Dataset (A) describes the building stock obtained through Earth observation and dataset (B) contains various specific data on individual households obtained through surveys. The consolidation is achieved by an exact assignment via GPS coordinates. The methodology can be divided into two consecutive modules. An analysis and evaluation of specific parameters based on the building typology (blue area) is followed by an extrapolation to the study area (gray area). The individual steps are elaborated in the following sections, with reference to this figure throughout the manuscript.
Figure 1
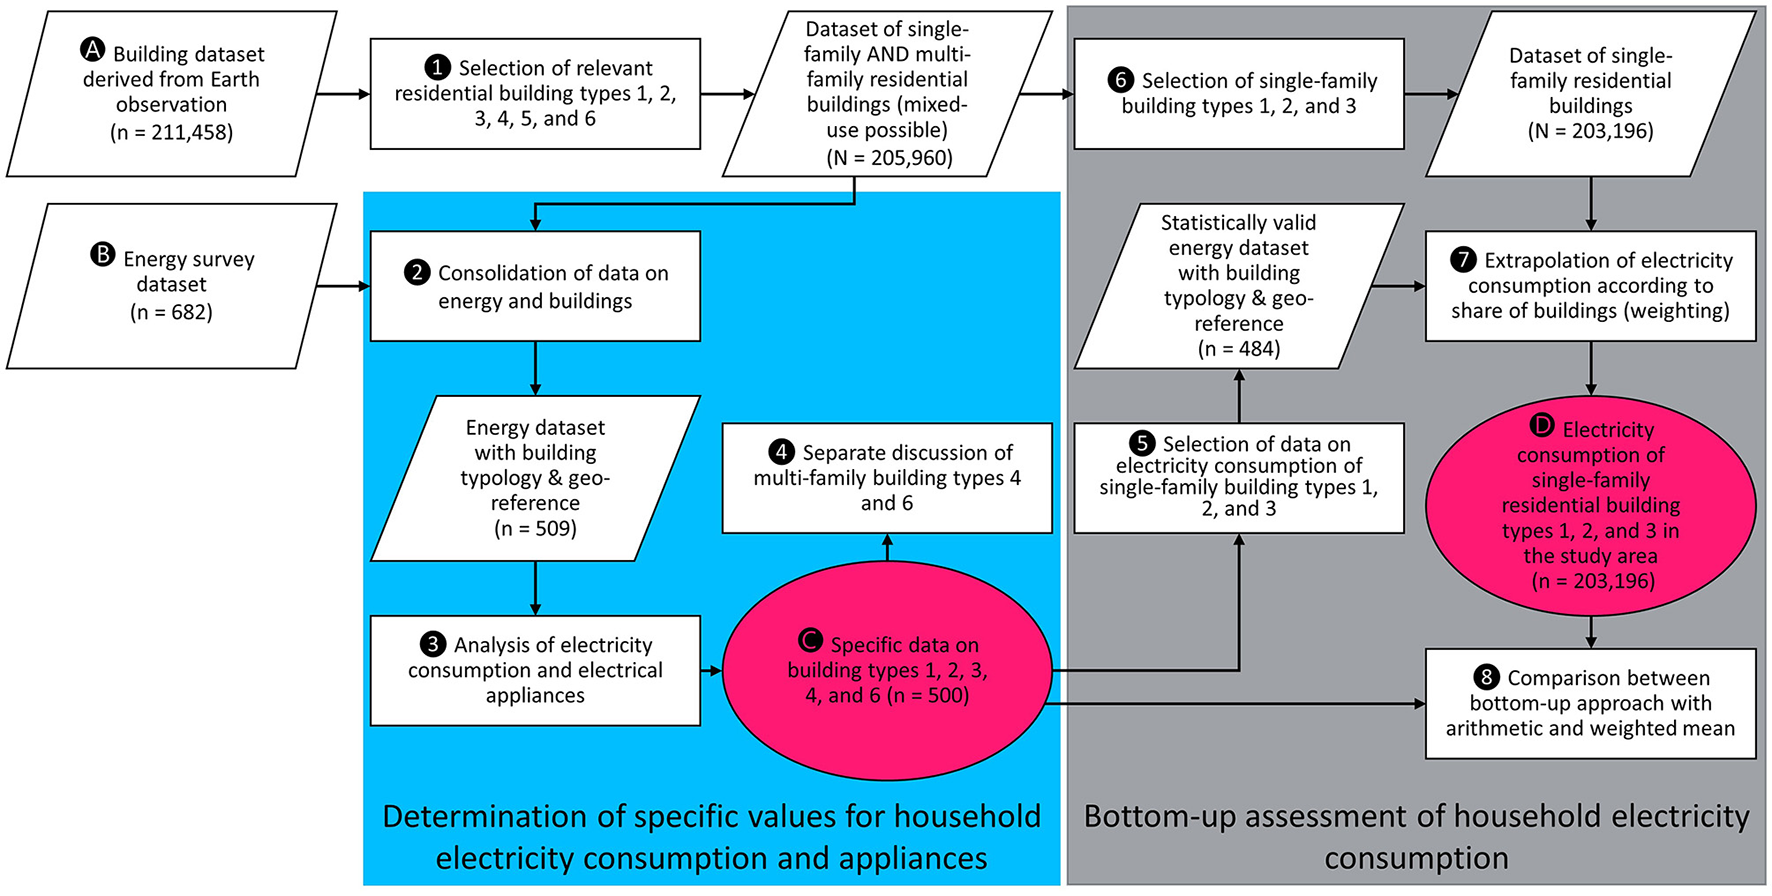
Framework and approach for this study. The rectangles represent processes, parallelograms represent the inputs and the outputs of the processes, which is one dataset each. The ovals represent the main outcomes of the study. The blue area shows the methodology for determining the specific values of household electricity consumption and ownership of electrical appliances depending on the building type. The gray area shows the methodology for extrapolating household electricity consumption using the arithmetic mean compared to weighting the specific consumption values based on the proportion of building types in the study area. The whole approach can be described as a bottom-up assessment.
2.1. Study area
Rwanda is one of the most densely populated countries in sub-Saharan Africa (World Bank, 2020) and is landlocked by the Democratic Republic of Congo, Uganda and Tanzania (Figures 2A, B, red). Kigali is the capital city of Rwanda and at the same time the central province of the country (Figure 2B, green). In addition to the province of Kigali, Rwanda consists of four other provinces, namely the Northern, Southern, Eastern, and Western provinces (Figure 2B, gray). The provinces are further subdivided into districts. The city has undulating topography with an elevation range from 1,332 and 2,073 meters above sea level (produced using Copernicus WorldDEM-30 © DLR e.V. 2010–2014 and © Airbus Defense and Space GmbH 2014–2018 provided under COPERNICUS by the European Union and ESA; all rights reserved). Covering an area of approximately 730 km2 (Joshi et al., 2013), the city was home to 1.75 million inhabitants in 2022 (NISR, 2023), with an average annual growth rate of 4.42% between 2012 and 2022 (NISR and MINECOFIN, 2014; NISR, 2023). It is divided into three districts, Gasabo in the North, Nyarugenge in the Southeast, and Kicukiro in the Southwest (Figure 2C, black dashed). The considered study area is limited by the satellite data availability of Bachofer et al. (2019) and covers the densely built-up area partly overlapping with all three districts of Kigali (see Figures 2, 3).
Figure 2
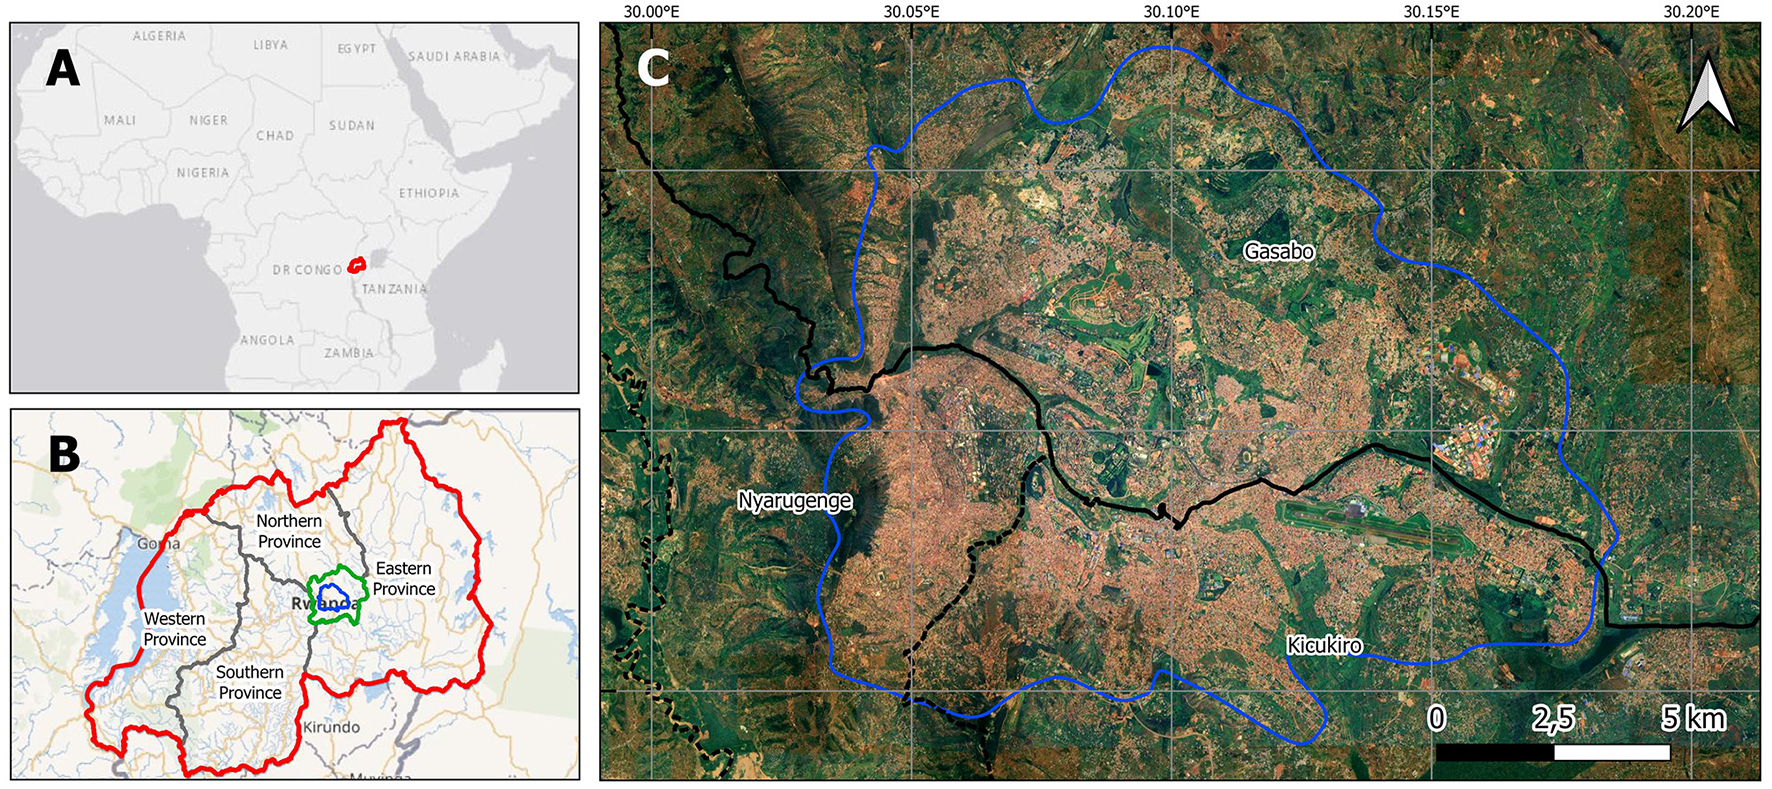
(A) Location of Rwanda in Africa (red), (B) Location of Kigali (green) and other provinces (gray) in Rwanda, study area (blue), (C) Subset of a satellite image of Kigali, its three districts (black), and study area (Pléiades satellite image of 9th August 2015 used in Bachofer et al., 2019).
Figure 3

(A) Subset of the building types dataset for Kigali and (B) overview map with study area (Pléiades satellite image of 9th August 2015 used in Bachofer et al., 2019).
Kigali has a relatively large forest area, wetlands and agriculturally used areas, while the built-up area in 2013 was only 17% and is projected to be 25% in 2025 (Joshi et al., 2013). Kigali is further characterized by its hilly topography and the built-up areas of different densities, creating challenges for urban planning and the provision of drinking water, electricity, and other public services (Manirakiza, 2014; Burns, 2021). Distribution through pipelines, grids or roads gets more difficult. By the definition of the city, the built-up area is equal to the urbanized area, which divides into City Center Area, City Fringe Area, and Suburban Area (Joshi et al., 2013). In contrast, the fifth Integrated Housing Living Conditions Survey (EICV5) conducted between October 2016 and October 2017 divides the distribution of households in Kigali into 73.8% urban and 26.2% rural (NISR, 2018c). In this study, the definition of an urbanized area is a zone characterized by planned and informal settlements with a high population density, whereas a rural area is mostly characterized by scattered settlements. Kigali comprises both urbanized and rural areas that are in the process of urbanization. The study was conducted in the urbanized area defined here and covers approximately 175 km2, which corresponds to 24% of the total area of Kigali (Figures 2B, 3B blue).
More than 70% of the city's residents live in informal settlements, most of which evolved before 2010 (Uwayezu and Vries, 2020). It is the time when the management of Kigali and other stakeholders introduced the processes of urban restructuration after the adoption of the Kigali conceptual master plan in 2007 which was followed by the adoption of the detailed master plans for the three districts of Gasabo, Kicukiro and Nyarugenge (City of Kigali, 2013). Informal settlement upgrading is an important pillar of the dynamics of the city.
In the Global South, the gap between rich and poor is believed to be relatively wide (World Bank, 2020). The Gini coefficient thereby is a benchmark for the distribution of income and wealth in an individual country. The value lies between 0 and 1, with 1 representing total income and wealth inequality. In Rwanda, the Gini coefficient has declined from 0.522 in 2006 to 0.448 in 2015 and 0.429 in 2017 (NISR, 2016b, 2018a). This value is still rather high compared to 0.327 in France, 0.317 in Germany, 0.354 in Italy, 0.323 in Switzerland, 0.332 in the UK and on average 0.434 in sub-Saharan Africa in 2015 (World Bank, 2020). In Rwanda, GDP per capita increased at the same time from USD 369 in 2006 to USD 758 in 2015, USD 784 in 2017 and USD 854 in 2021 (NISR, 2022). Even though these data refer to the national level, a comparison in the international context is possible and the changes in these economic parameters show the dynamics of the country. Looking at Kigali, the median annual income per household is about USD 6,000 (Uwayezu and Vries, 2020). Yet, there is a wide range with a disproportionate number of less well-off households. Although there is no data for the Gini coefficient at the city level, there are certain similarities to the national level.
As in most sub-Saharan African countries, rural electrification in Rwanda lags behind urban electrification (REG, 2015; World Bank, 2016). As of June 2014, rural electrification was 7.7% and urban electrification was 61.5% (Bimenyimana et al., 2018). Even though these values are at the national level, at least some conclusions can be drawn for Kigali, as it also has rural and urban areas. In 2015, access to electricity in Rwanda was around 23%, and in Kigali 51% respectively (REG, 2015). NISR (2018b) reports access to electricity in Kigali to be as high as 73.6% in the fiscal year 2013/2014 and 79.6% in the fiscal year 2016/2017. A fiscal year in Rwanda always starts in June of one year and ends in June of the following year. Kigali had about 33% of all connections in the country in 2015 (NISR, 2016b; RURA, 2016b), although only about 13% of the population live there (NISR, 2012). In Rwanda, the household sector thereby is the largest consumer of electricity (51%) (MININFRA, 2015a) and energy in general [91% in 2010; (Safari, 2010) and 82% in 2016; (MININFRA, 2018)].
2.2. Spatial analysis of housing and building structures
To gain a better understanding of different household electricity consumption patterns related to the standard of living and the socio-economic status of the residents in Kigali, a spatial dataset on building types was used in this study. It was published by Bachofer et al. (2019) and contains an inventory of 211,458 buildings in the urban area of the city for the year 2015 (Figure 3). The building footprints were extracted with an object-based image analysis approach (OBIA) from very high-resolution satellite imagery (Pléiades, tri-stereo acquisition mode) and classified with a semi-automated approach into nine predefined classes based on their size, shape, height, roof color, neighborhood, and green space per property of the buildings, as well as their location within the city. These classes include Basic, Block, Bungalow, Villa, Mid-rise, High-rise, Hall, Special, and Construction sites (short names), of which the first six are predominantly used for residential purposes and the latter three are therefore not considered in this study (Table 1 and Process 1 Figure 1). A validation based on 900 selected reference buildings confirmed a classification accuracy of 95.4% for this dataset.
Table 1
| Category | Building type | ||
|---|---|---|---|
| Single-family residential | 1–Rudimentary, basic or unplanned buildings (Basic) 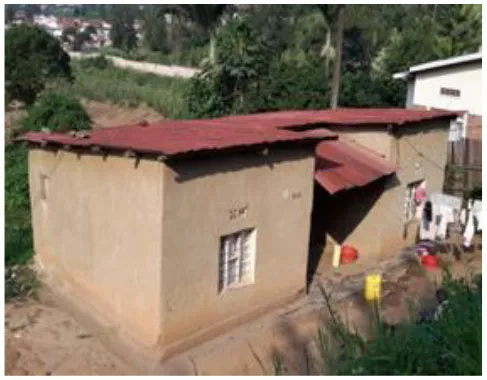 |
2–Bungalow-type buildings (Bungalow) 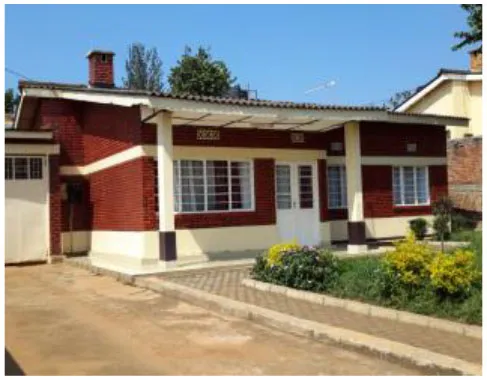 |
3–Villa-type buildings (Villa) 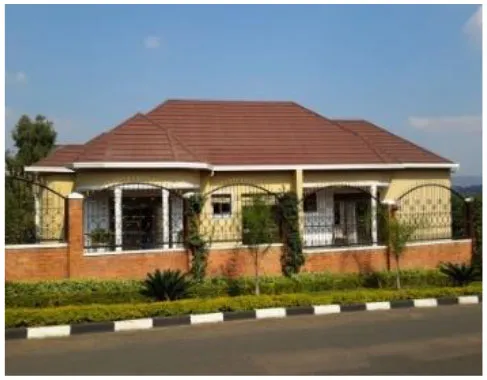 |
| Multi-family residential (mixed use possible) | 4–Building in block structure/large courtyard buildings (Block) 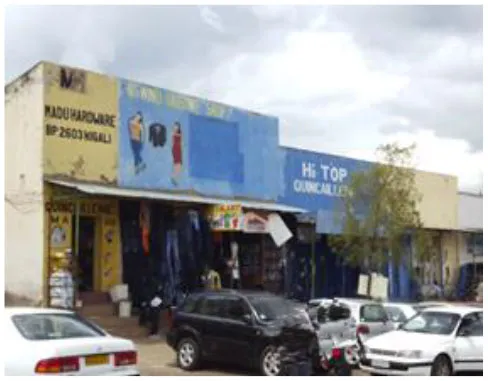 |
5–Low to mid-rise multi-unit buildings (Mid-rise) 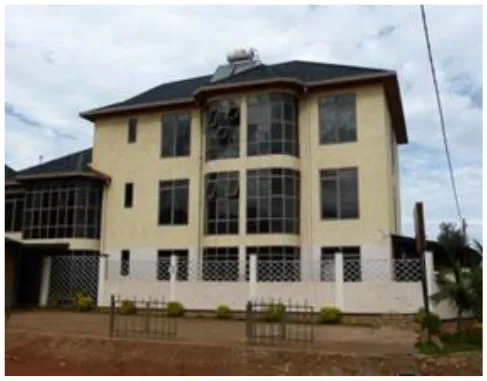 |
6–High-rise buildings (High-rise) 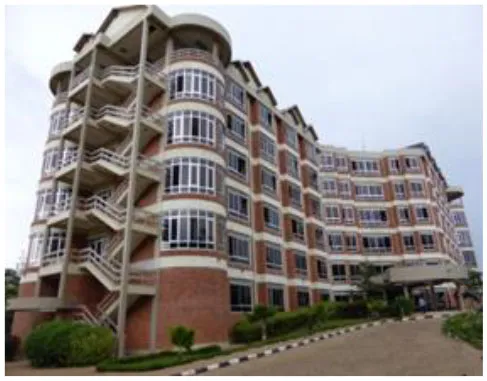 |
Building types in Kigali that are predominantly used for residential purposes derived from Bachofer et al. (2019) with representative example pictures and short names in brackets.
The dataset serves as an independent reference for the statistical values on household electricity retrieved by field surveys as described in the following section. The dataset regarding single-family and multi-family residential buildings in the study area refers to 205,960 buildings (Figure 1). Accordingly, this study follows a similar approach as described by Vetter-Gindele et al. (2019) where household solid waste generation patterns were disaggregated by building types in the city of Da Nang, Vietnam. Thus, the proposed methodology can also be applied to other urban infrastructure sectors.
Figure 3 shows a part of the core urban area of Kigali and illustrates how buildings of different sizes and usage form the heterogeneous morphology of the urban environment. The northern part of Kicukiro is dominated by large hall-like buildings of the industrial and public levels for which electricity consumption is generally high. In Nyarugenge, the share of Basic buildings is high. In general, the building types Basic, Block, and Bungalow are predominant in the poor, low-middle income residential and commercial neighborhoods. In the city center, Mid-rise and High-rise buildings as well as Bungalows and Villas with more regular arrangements are the majority. In general, Basic is the predominant building type in Kigali in 2015 with 170,805 out of 211,458 buildings.
2.3. Determination of specific values for household electricity consumption and appliances
Information on electricity consumption and electrical appliances was gathered from 682 households during two field surveys in June and November 2015 (Marathe and Eltrop, 2017). The 682 households were each located in a different building, and the GPS coordinates of the respective households (buildings) were also determined. This enabled the consolidation with the data from Bachofer et al. (2019) into one single dataset (Process 2 Figure 1). This resulted in n = 509 fully utilizable, viable energy datasets with a clear geo-reference. Among those, nine households did not have access to electricity, so they were excluded from the analyses. The authors trust in the preliminary work of Marathe and Eltrop (2017) regarding reliable data collection according to the World Bank (Grosh and Muñoz, 1996). Since the non-response rate only affects the sample size for the data collection (sampling design), but not the evaluation or analysis of the data, the level of precision (e) can be calculated using a rearrangement of equations by Israel (1992). The size of population (N) is derived from Bachofer et al. (2019) and corresponds to the number of the respective building types in the study area (Table 2). This allowed the study area to be considered as a whole and additionally based on the defined individual building types. A maximum variability was assumed by setting the degree of variability (p) to the most conservative value possible (p = 0.5). A confidence level of 95% leads to a z-score of 1.96. The level of precision (e) per building type and cumulatively for the entire study area was determined using equation (1) based on Israel (1992).
Table 2
| Category | Building type | Size of population (N) (Bachofer et al., 2019) | Sample size (n) after data consolidation of Marathe and Eltrop (2017) and Bachofer et al. (2019) | Level of precision (e) |
|---|---|---|---|---|
| Single-family | Basic | 170,805 | 228 (237) | ±6.49% (6.36%) |
| Bungalow | 27,610 | 185 | ±7.18% | |
| Villa | 4,781 | 71 | ±11.54% | |
| Multi-family/mixed-use | Block | 1,587 | 14 | ±26.08% |
| High-rise | 371 | 2 | ±69.11% | |
| Mid-rise | 806 | 0 | N/A | |
| Sum | 205,154 | 500 (509) | ±4.38% (4.34%) |
Level of precision for all building types that are predominantly used for residential purposes where the confidence level is 95% (z = 1.96) and p = 0.5 using equation (1) according to Israel (1992).
The sample size of 500 results in a level of precision of e = 4.38%. Including the nine households without access to electricity, e = 4.34%. The different distribution of the sample compared to the population leads to unequal levels of precision of the different building types (Table 2). The subdivision into several building types leads to a larger sample or greater error associated with it. For the two most predominant building types (Basic and Bungalow together account for 93.8% of all buildings in the study area) the sample was large enough to keep e <10%. Calculations regarding the level of precision for the building types Block and High-rise resulted in e = 26.08% and e = 69.11% respectively. Mid-rise buildings were not included in the field surveys by Marathe and Eltrop (2017), making them the only residential building type not considered further after the data consolidation process (Process 2 Figure 1). As this building type is almost identical to High-rise in terms of dwelling units and accounted for only 0.38% of all residential buildings in the study area in 2015, this is considered negligible (Table 2).
In Rwanda, there are almost exclusively (99.7%) prepaid electricity meters (REG, 2020). This leads electricity customers to estimate the monthly cost of electricity rather than the correct electricity consumption in kilowatt hours (kWh). Thus, the questionnaire was designed in this regard and then offset against the associated electricity tariff. As of 1st September 2015, there was an increase in the household electricity tariff in Rwanda from 158 (134 + 18% VAT) (RURA, 2012) to 215 (182 + 18% VAT) (RURA, 2015) Rwandan Francs (RWF) per kWh. This was considered in the calculation of the electricity consumption of the two survey periods: June and November 2015. To calculate the daily electricity consumption per household, the average monthly electricity expenditure was multiplied by factor 12 and divided by the respective applicable electricity tariff (either 158 or 215 RWF/kWh) and divided by 365 (Process 3 Figure 1). With regard to the average electricity consumption per capita per year, this value was divided by the household size and multiplied by a factor of 365 (Process 3 Figure 1). The question about the number of inhabitants (household size) thereby was part of the questionnaire. Consequently, the specific electricity consumption of the households was analyzed and evaluated based on the two parameters mentioned above.
The time of the surveys coincided with Rwanda's fiscal year 2015/2016. During this period, 89,964 households were connected to the national grid, bringing the total number of households with access to the grid in June 2016 to 589,964, which represents a share of 24.3% of Rwanda's households (MININFRA, 2016a). Due to the changing electrification rate and inequality in income and wealth, the authors assume that there is also an unequal distribution in electricity consumption with positive skewness. This means that the majority of households tend to have low electricity consumption, while a few households have very high consumption. Descriptive statistics are used to test this hypothesis. To graphically display various parameters of the distribution a histogram is compiled, followed by boxplots.
Furthermore, questions on ownership of electrical appliances were included in the field survey. Although the respective quantity of each electrical appliance was asked for, the evaluation in this article is based on a binary system (ownership: yes or no). The value for electrical appliance ownership describes the share of households of each building type, where the appliance exists and is always between 0 and 100% (Process 3 Figure 1). To avoid any confusion, reference is made to this definition of electrical appliance ownership in the whole article. The literature also speaks of diffusion (rate), penetration (rate), or saturation (rate), whereby different definitions are used as values above 100% are possible (McNeil and Letschert, 2010; McLoughlin et al., 2012; Agyeman et al., 2015; Cabeza et al., 2018; Dominguez et al., 2019; Sanchez-Escobar et al., 2021). In addition to the ownership of electrical appliances per se, this article also analyses the categorization of these appliances. Depending on the scientific discipline or research approach, there are different types of categorization. Examples include the type of appliance, function or service provided, location and position in the building, or pattern of use (Yao and Steemers, 2005; Firth et al., 2008; Esslinger and Witzmann, 2012; Bhatia and Angelou, 2015; Jones et al., 2015). For the categorization according to the scope of this article, an electrotechnical approach based on physical determinants seemed more appropriate. In this respect, the UN provides a categorization based on the typical in-use power of electrical appliances. The appliances are divided into five load levels: 3–49 watts (W), 50–199 W, 200–799 W, 800–1,999 W, >2,000 W (Koo et al., 2018). This approach is crucial for power system planners or urban planners and allows the results to be placed within the UN SE4All “Multi-Tier Framework of Measuring Household Electricity Access” (Tenenbaum et al., 2014).
2.4. Extrapolation of household electricity consumption to the city level
The average specific electricity consumption of each building type, determined by on-site data collection, is subsequently complemented by a spatial dataset on building types. This allows an extrapolation of household electricity consumption at different levels (gray area in Figure 1). The bottom-up analysis refers solely to the households representing the building types. Variations in household size within the individual building types were thereby not considered, as the reference to building level is always decisive. The evaluation of specific electricity consumption and ownership of electrical appliances per building type from Section 2.3 (blue area in Figure 1) was the basis for the bottom-up analysis described in this section. The first step is to select the single-family residential buildings from the generated dataset (Outcome C Figure 1C), which corresponds to Process 5 in Figure 1. The building types Block and High-rise are not included in the bottom-up analysis due to the following reasons. Firstly, their share of the residential building stock in the study area is only 0.77 and 0.18% respectively (Table 2). Secondly, they belong to the category of multi-family residential buildings and may even have a mixed use (public or commercial). The assumption about the number of dwelling units per building is a non-quantifiable source of error. Since the sample in the field studies was too small, the level of precision (Table 2) does not allow for valid extrapolation. As shown in Process 4 Figure 1, the multi-family building types Block and High-rise are considered separately. The bottom-up analysis thus refers to the buildings in Kigali where the assessment is robust and reliable enough without neglecting relevant elements. This includes all 203,196 single-family residential buildings in the study area (Process 6 Figure 1). The dataset of Bachofer et al. (2019) had an overall accuracy of 95.4%. Considering the single-family building types Basic, Bungalow and Villa, the values for user's accuracy and producer's accuracy are even more accurate. This non-significant uncertainty is neglected in the extrapolation. However, the levels of precision in the specific electricity consumption of the building types (Table 2) have a significant influence. Accordingly, a range rather than a specific value is given for total household electricity consumption (Process 7 Figure 1). Sampling errors due to a biased sample can thus be compensated. To finally extrapolate to the city level, various additional assumptions were made. The bottom-up assessment comprises a comparison of the extrapolation of the specific values based on the arithmetic mean and the weighted mean (Process 8 Figure 1). Weighting is based on the proportion of each building type in the study area. The weights (w1, w2, …, wn) are normalized to 100%. The non-empty finite data tuple (x1, x2, ..., xn) corresponds to the specific electricity consumption per building type or the ownership of electrical appliances per building type (observations). The weighted mean values are determined for both household electricity consumption and ownership of the electrical appliances using equation (2) by Everitt and Skrondal (2010). Due to the normalization of the weights, the representation of the denominator in the equation could be omitted.
3. Results
3.1. Specific household electricity consumption
As described in Section 2.3, households were not asked directly about their electricity consumption, but about their estimated monthly electricity expenditures. Analyses based on the electricity tariff at the time of the respective survey yielded the actual electricity consumption (in kWh) (Process 3 Figure 1). To carry out a specific analysis, the electricity consumption must be put into a temporal (e.g., day, year) and functional context (e.g., household, capita). The specific units used in this article are electricity consumption per household per day and electricity consumption per capita per year. Results of the first specific unit can be placed within the UN SE4All “Multi-Tier Framework of Measuring Household Electricity Access” (Tenenbaum et al., 2014). The second unit used is often found in energy statistics on countries or regions.
A histogram of the distribution of specific electricity consumption at the household level in Kigali is shown in Figure 4. The unit is kWh per household per day and the bin width is 1. 150 households (30.0%) had an electricity consumption of less than or equal to 1 kWh per day. The second interval contains 95 values (19.0%) and the third interval contains 53 values (10.6%). Eight values (1.6%) are in the intervals above 20 kWh per household per year. They are not visualized in the figure for better readability of the other values.
Figure 4
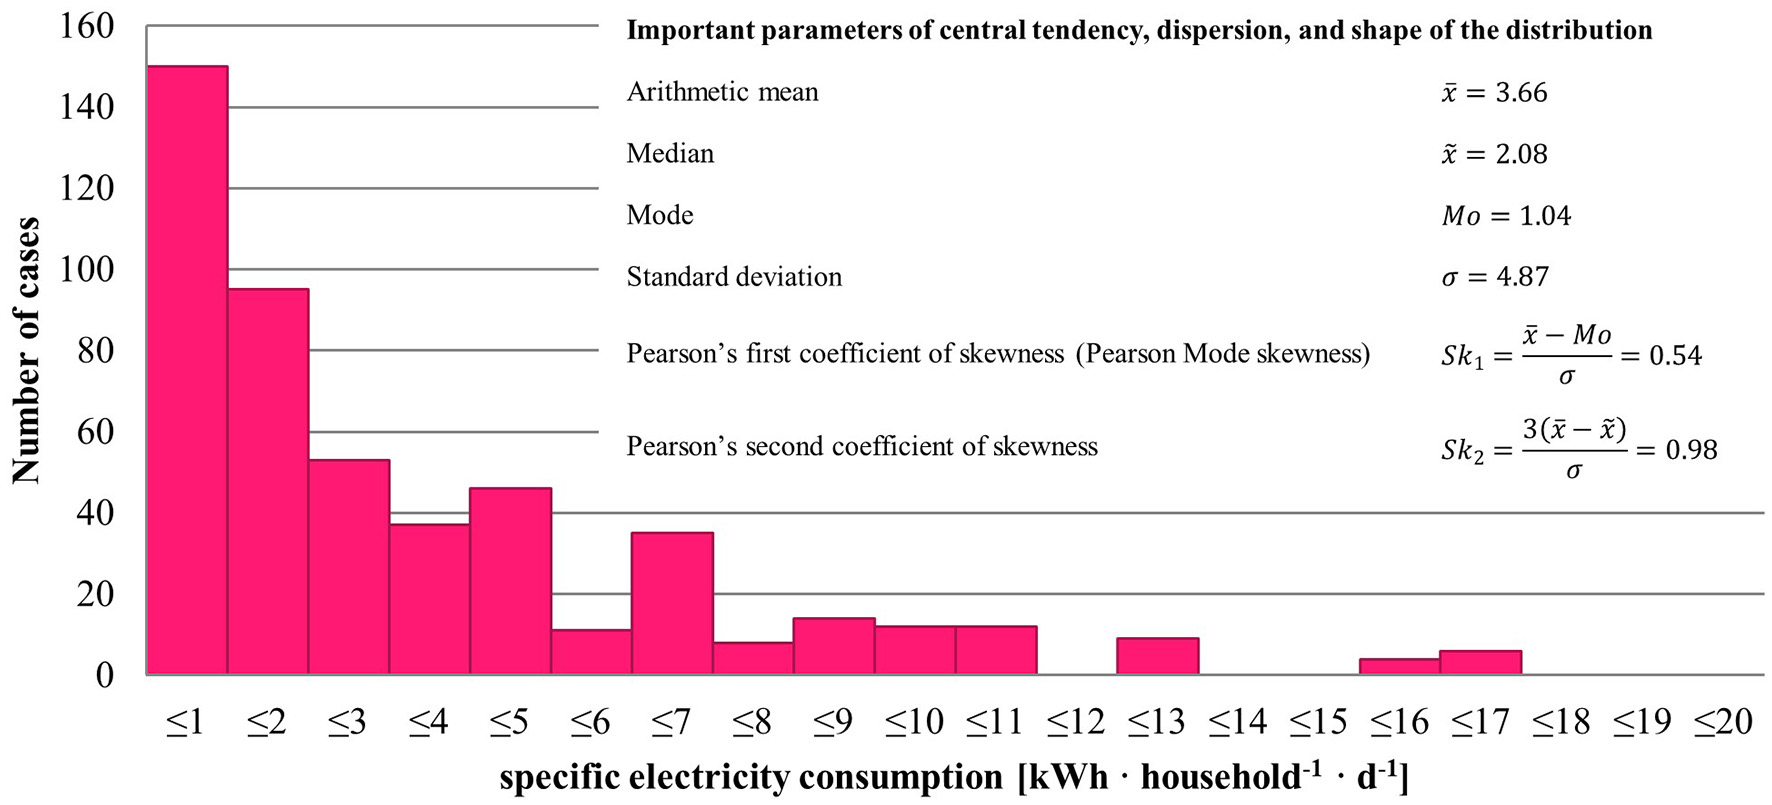
Distribution of specific electricity consumption at the household level in Kigali (n = 500). Eight values above 20 are not visualized in the figure.
Both values of Pearson's coefficients of skewness are slightly positive which indicates a positively skewed distribution (Figure 4). Most households and consequently residential buildings have a low electricity consumption and a few have a very high consumption. When the histogram in Figure 4 is thought of as a distribution curve, the tail is longer on the right side. To obtain a more detailed picture, especially in the case of higher electricity consumption, subdividing the sample seemed reasonable (Process 3 and Outcome C Figure 1). Regarding the specific electricity consumption per household per day, the arithmetic mean was 3.66 kWh and the median was 2.08 kWh (Figure 5). Disaggregating the samples based on building types, an increasing arithmetic mean and median from Basic via Bungalow to Villa emerges. Due to the lack of validity, statistics of Block and High-rise buildings are displayed in a faded magenta color (Process 4 Figure 1). The building type Villa had an average specific electricity consumption of 7.91 kWh per household per day, which was 7 times the one of Basic (1.16) and 1.5 times the one of Bungalow (5.32). With a median value of 4.16 kWh per household per day, the building type Bungalow has a more than 4 times higher consumption than Basic (0.83 kWh per household per day). For Villas (6.12 kWh per household per day) the value is even 6 times higher.
Figure 5
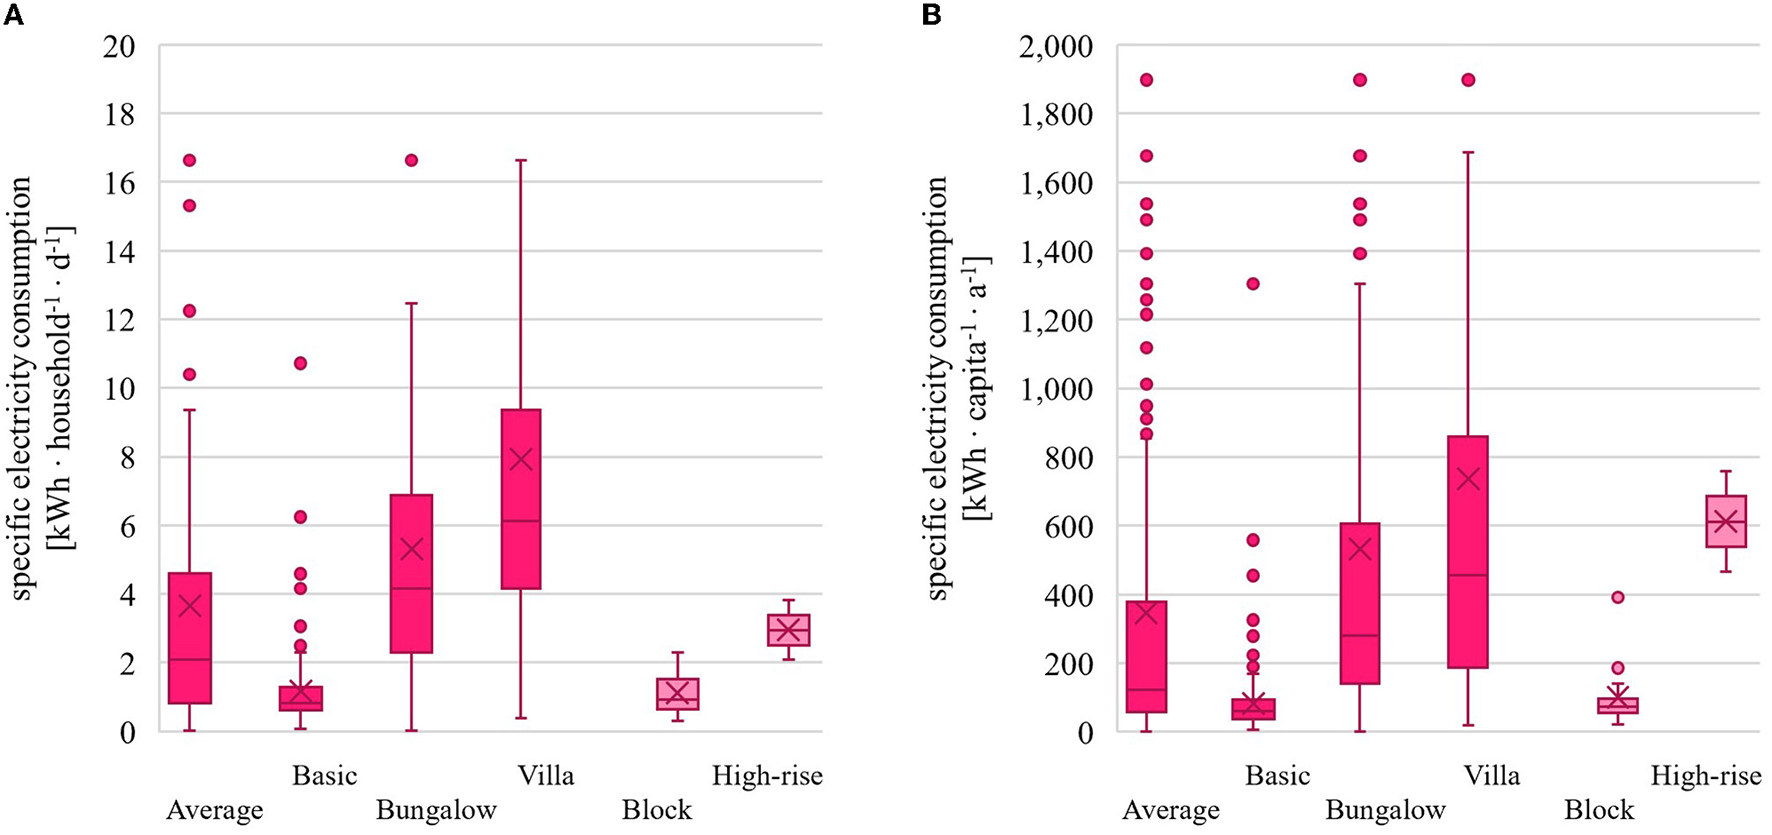
Specific household electricity consumption by building type in Kigali (n = 500). (A) With the unit kWh per household per day. At total of 4 outliers above 20 are not visualized in the figure. (B) With the kWh unit per capita per year. A total of 11 outliers above 2,000 are not visualized in the figure.
The same pattern was observed within the analyses of individual residents. Thereby, the specific electricity consumption per capita per year for n = 500 resulted in a mean value of 345 kWh and a median of 123 kWh (Figure 5). People living in the building type Villa had an average electricity consumption of 737 kWh per year, which is 9 times the consumption of people living in the building type Basic (84 kWh per year). The mean electricity consumption of people living in the building type Bungalow was 532 kWh per capita per year. With a median of 61 (Basic), 279 (Bungalow) and 455 (Villa), the value is 4.6-fold in Bungalow compared to Basic, and 7.5-fold in Villa, respectively.
3.2. Electrical appliances ownership and load level
Households were also asked about the ownership or existence of electrical appliances. The datasets were analyzed individually based on the building types, whereby the standard deviation, as well as arithmetic and weighted mean values, were calculated based on the sample (n = 484) of single-family residential buildings (Table 3). For devices such as phones, radios, electric illuminants, televisions, and electric irons, there were hardly any differences between the building types. In contrast, the difference is vast for microwaves, washing machines, electric stoves, and even refrigerators. This becomes particularly evident when comparing the Basic and Villa building types. For the multi-family building types Block and High-rise, the sample was too small to allow a statistically valid evaluation (Process 4 Figure 1). Due to n = 2 for High-rise buildings, the value for ownership of electrical appliances could only be 0, 50, or 100%. In Table 3, the electrical appliances are further subdivided into load levels. In our analysis, we only adjusted electric irons. According to the categorization by Koo et al. (2018), electric irons would be one load level higher, but we asked about the power rating (in-use power) of the appliances in the field surveys, and the arithmetic mean for an electric iron was 238 watts. Electrical appliances with a high in-use power and load level respectively (e.g., electric stoves) were mostly present in building type Villa, but not in Basic. Thus, the combined analyses of electrical appliance ownership and load levels show that as the load level increases, the share of electrical appliances decrease from Villa via Bungalow to Basic. Furthermore, the arithmetic and weighted mean have been analyzed. Weighting is based on the proportion of each building type in the study area (Process 7 Figure 1). Since Basic is the predominant building type, there is also a greater difference between the arithmetic mean and weighted mean when there are greater differences in ownership of electrical appliances between building types Basic and Villa. This is particularly evident looking at refrigerators. While 98.6% of the Villa building type have a refrigerator, only 22.8% of the Basic building type have one. Here, the arithmetic mean of 55.6% would lead to an overestimation, as our proposed approach with the weighted mean only yields a value of 32.7%.
Table 3
| Electrical appliance | Building type | STDEV.S | Arithmetic mean | Weighted mean | Load level [watt] | ||
|---|---|---|---|---|---|---|---|
| Basic | Bungalow | Villa | |||||
| Phone | 98.7% | 99.5% | 98.6% | 0.5% | 99.0% | 98.8% | 3–49 |
| Radio | 53.5% | 49.2% | 50.7% | 2.2% | 50.0% | 52.8% | |
| Electric illuminants | 71.5% | 61.1% | 59.2% | 6.6% | 63.8% | 69.8% | 50–199 |
| TV | 71.5% | 90.3% | 94.4% | 12.2% | 80.8% | 74.6% | |
| Computer | 28.5% | 75.1% | 88.7% | 31.6% | 55.0% | 36.2% | |
| Refrigerator | 22.8% | 82.2% | 98.6% | 39.9% | 55.6% | 32.7% | 200–799 |
| Electric iron | 51.8% | 56.8% | 54.9% | 2.5% | 52.6% | 52.5% | |
| Microwave | 1.3% | 30.8% | 47.9% | 23.6% | 19.0% | 6.4% | 800–1,999 |
| Washing machine | 0.4% | 12.4% | 21.1% | 10.4% | 7.8% | 2.6% | |
| Electric kettle | 16.7% | 31.4% | 39.4% | 11.5% | 24.8% | 19.2% | 2,000 plus |
| Electric stove | 0.9% | 15.7% | 22.5% | 11.0% | 9.6% | 3.4% | |
| Vacuum cleaner | 0.0% | 3.2% | 4.2% | 2.2% | 1.8% | 0.5% | |
Ownership of electrical appliances by building type and load level categorization according to Koo et al. (2018) of the category single-family buildings in Kigali (n = 484).
3.3. Extrapolation of household electricity consumption to the city level
The specific results of the building types can ultimately be used for a bottom-up analysis of electricity consumption at the household level (Process 7 Figure 1). The first step is an extrapolation based on the 2015 building stock of Kigali's inner-city from Bachofer et al. (2019). This corresponds to the size of population (N) from Table 2. Here, the average values of electricity consumption per building type are simply multiplied by the number of buildings. Among the 682 households surveyed by Marathe and Eltrop (2017), the electrification rate was 95.9%, with only the Basic building type (27 out of 382) and Bungalow (1 out of 205) lacking electricity. With the calculated levels of precision (e), a range for the extrapolated electricity consumption is then obtained (Outcome D Figure 1). In the case of multi-family buildings (Block and High-rise), there was already a large uncertainty regarding the specific electricity consumption due to the small sample size and a possible mixed use (public or commercial). The assumption regarding the number of dwelling units per building represents a further source of error, hence they are not included in the extrapolation but discussed separately (Process 4 Figure 1). In total, 203,196 of the 211,458 buildings are considered for the extrapolation of residential electricity consumption. Table 4 shows the calculations for the individual building types, which are ultimately accumulated (Sum). The electricity consumption at the entire household level in the considered area of Kigali thereby was 125–144 GWh in 2015. Dividing the minimum and maximum by the total amount of buildings results in a weighted mean of 613–709 kWh per household per year. Applying equation (2), the weighted mean value is 688 kWh per household per year. Applying the methodology presented here, the extrapolation of the weighted mean in combination with the level of precision of the sample resulted in 126–137 GWh for the year 2015. Dispensing with the subdivision according to building types and using only the arithmetic mean, a range of 254–278 GWh results in the cumulative electricity consumption in 2015 (Process 8 Figure 1). This corresponds to about twice the amount for the analysis with reference to the building types.
Table 4
| Building type | Average electricity consumption [kWh per household per year] | Proportion of each building type in the study area | Electrification rate at n = 682 | Minimum accumulated electricity consumption [GWh] | Maximum accumulated electricity consumption [GWh] |
|---|---|---|---|---|---|
| Basic | 423.64 | 84.1% | 92.9% | 62.88 | 72.43 |
| Bungalow | 1,940.28 | 13.6% | 99.5% | 49.48 | 57.14 |
| Villa | 2,888.07 | 2.4% | 100.0% | 12.21 | 15.40 |
| Sum | 613–709 | 100.0% | 95.9% | 124.58 | 144.15 |
| Weighted mean | 687.71 | 100.0% | 94.0% | 125.60 | 137.09 |
| Arithmetic mean | 1,364.87 | 100.0% | 95.9% | 254.31 | 277.59 |
Accumulated range of electricity consumption at the household level of Kigali's inner-city in 2015 (n = 484, N = 203,196).
To make an extrapolation to the city scale, the data from Bachofer et al. (2019) is not sufficient and other statistics or datasets must be utilized. Since there is no distribution of building types at this level, only reasonable assumptions can be made. According to the fourth Integrated Housing Living Conditions Survey (EICV4) conducted between October 2013 and October 2014, there were approximately 295,000 households in Kigali (NISR, 2016a). These were divided among the three districts as follows: 147,000 in Gasabo, 76,000 in Kicukiro, and 73,000 in Nyarugenge. According to the fifth Integrated Housing Living Conditions Survey (EICV5) conducted between October 2016 and October 2017, there were approximately 410,000 households in Kigali (NISR, 2018c). These were divided among the three districts as follows: 230,000 in Gasabo, 98,000 in Kicukiro, and 81,000 in Nyarugenge. Since no explicit data are available for 2015 and the nationwide census data were each collected over 12 months (October-October), the mean value of the surveys is used for the assessment. Hence, the estimation is 352,500 households in Kigali in 2015 (Gasabo 188,500; Kicukiro 87,000; Nyarugenge 77,000). The fastest method would be simply scaling up from the 203,196 households considered in our extrapolation to the 352,500 households of the estimation. However, this consideration neglects two important points: the distribution of building types within the province, and the electrification rate. Since Bachofer et al. (2019) focused on the central and most urbanized part of Kigali, especially the share of the building type Basic will increase in rural areas. Officially, the electrification rate in Kigali was 51% in 2015 (REG, 2015). This in turn contradicts our calculation of 95.9% electrification rate and extrapolation with the buildings of the GIS analysis compared to the official statistics. As a result, the electrification rate for the whole city would be 203,196 · 95.9%/352,500 = 55.3%. Vice versa, a 51% electrification rate of 352,500 households would translate into only 179,775 households with access to electricity. The same applies to an extrapolation based on the population. Here, the data are available at the smallest administrative level (cells), but they are from 2012. On the one hand, an extrapolation to 2015 would have to be made here first and we would lose buildings as a proxy from our surveys, which would thus contain two further errors. Nonetheless, a statistically valid extrapolation can be made to our study area (Figure 2B and Table 4). A top-down comparison fails because there is no possibility of disaggregation.
4. Discussion
4.1. Overview and contextualization of the methods for building types
In the following section, the presented results will be placed in the context of science and literature. The hypothesis and the method used are evaluated. The building types used in this study are in line with the types of dwellings that exist in the official statistics of Rwanda. Nevertheless, the physical parameters of buildings in the EICVs are mainly limited to the analysis of floor and roof material. The EICV5 shows that 98.8% of residential buildings in Kigali had corrugated metal roofs and 73.4% had modern flooring by 2017 (NISR, 2018b). While this observation is already useful for comparison to other areas in Rwanda, it is not accurate enough for intra-city comparisons and analyses. The results of Bachofer et al. (2019) are based on several input parameters and are therefore more comprehensive. The classification into the building types presented here shows a more detailed view of the building stock. The method applied in this article corresponds to a generic approach. Based on its own determination of building types, the method is transferable to other cities as well as other urban infrastructure sectors and socio-economic parameters, as Vetter-Gindele et al. (2019) and Warth et al. (2020) have proved.
4.2. Specific household electricity consumption and extrapolation to the city level
In general, Rwanda already has a good database with specific data on several urban infrastructure sectors. The 2016 “Statistical Yearbook of Rwanda” and the “Integrated Household Living Conditions Surveys” (EICV 4 and 5) were mainly used to compare our results as these official sources refer to the period of our survey. Values from large databases such as the CIA's “World Factbook” or the World Bank Group's “World Development Indicators” are not used for comparison as they are often based on assumptions, estimations, or calculations. The same applies to sources such as Munyaneza et al. (2016) or Bimenyimana et al. (2018). To validate our results, we used gathered data from other studies. For example, a survey carried out in 2013 showed that about 50% of households in Rwanda with an electricity connection had an annual electricity consumption of <240 kWh (MININFRA, 2015a). Only 7% of households had an annual electricity consumption which is >1,800 kWh. Since income is increasing in Rwanda (World Bank, 2020), and there is a positive relationship between income and energy consumption (Soytas and Sari, 2003; Lee, 2005; Lee and Chang, 2007), it is assumed that this should also be the case in Kigali. In this context, Gouldson et al. (2016) point out an annual increase in Kigali's electricity consumption of 11.2%. However, it is not possible to determine exactly what proportion of this is to be allocated to existing electricity customers and what proportion is to be allocated to newly connected customers. A study by Koo et al. (2018) reported only slightly different values. Nationwide, the average monthly household consumption of electricity was 20.8 kWh, while it was 29.2 kWh in urban areas and 9.9 kWh in rural areas. This results in 350.4 kWh per household per year, and 0.96 kWh per household per day in urban areas. Analyses of surveys between 2011 and 2015 by Lenz et al. (2017) show that Rwandan households connected to the grid had on average an electricity consumption of 132 kWh per year and a median of 72 kWh per year. Nsengimana et al. (2020) calculate an annual electricity consumption of 1,996 kWh for an exemplary household in Kigali. While the values mentioned can be attributed to electricity consumption in households, there are other sources where this is not the case. According to Joshi et al. (2013), electricity consumption in Kigali was 405 kWh per capita in 2011 and is estimated at 500 kWh per capita in their calculations. Based on the wording, we assume that a top-down approach was applied and that the data also include industrial and commercial electricity consumption. This literature research shows that, in addition to the calculated values, there is also definitely collected data on household electricity consumption. Approaches to disaggregate households do already exist, but unfortunately not in the depth as in our approach. Consequently, at least we compared our aggregated data to other studies. The arithmetic mean of all households (n = 500) was 1,337 kWh per household per year in our study. The median was 759 kWh per household per year and therefore about 3 times the median of entire Rwanda in 2013 (MININFRA, 2015a). This is not surprising, since within the subsequent 2 years the electricity demand may have increased and households in Kigali tend to have a higher electricity consumption than in other areas of the country. Koo et al. (2018) show that the specific electricity demand of households in urban Rwanda is about three times that of rural areas. If only the predominant building type Basic is considered (424 kWh per household per year), there is only an increase of 21% in our data compared to Koo et al. (2018). It is important to note, that we only analyzed those households that have an electricity connection. If the nine households without electricity are considered, any values must be multiplied by the factor 0.959. On the other hand, the official data regarding the electrification rate could also be used. Including the 51% access to electricity in Kigali (REG, 2015), the arithmetic mean of all households in our study is reduced to 681 kWh per household per year. This would be in line with the weighted mean of urban Kigali (613–709 kWh per household per year). Regardless of the precise value, a comparison with other countries will help to get an idea of the dimension. The average electricity use in European households in 2006 was 2,700 kWh per year (Almeida et al., 2011). For the study by Almeida et al. (2011), 100 households have been audited per country in 12 geographically representative EU member states. Electric space and water heating were excluded from the analysis. Despite data from other studies on Rwanda being lower, our data is considered accurate. The disaggregation and the focus on urbanized single-family households in Kigali with access to electricity complicate the comparison with other studies.
The fact that the differences between the building types are more evident in the energy consumption per capita per year than in the specific unit per household per day is due to the multiplication by 365 and to the different average number of residents per building type. The average number of residents (household size) in the building type Basic was 5.75, Bungalow was 5.27 and Villa was 5.41. In the case of the building type Basic, the low household electricity consumption is additionally divided by a larger number of residents than in the case of the other two. Comparing the results regarding household members with those of the official statistics, a certain discrepancy can be observed. The average household size decreased from 5.0 (EICV2 in 2006) to 4.6 (EICV4 in 2014) (NISR, 2016b). An analysis of the EICV5 data by Khundi-Mkomba et al. (2021) resulted in an average of 4.43 and a standard deviation of 2.11. If only 2,434 urban households are taken from the EICV5, the mean value is 4.33 and the standard deviation is 2.37 (Khundi-Mkomba, 2021). Joshi et al. (2013) state that the average household size in Kigali was 4.35 in 2015. Despite figures from other studies being lower, our data is considered accurate, since our survey included control questions such as the number of adults, teenagers, and children in the household. Sampling errors due to a biased sample were compensated for by applying a level of precision (e).
Aggregated data can be more reliable if they are measured. For example, the amount of electricity sold by the energy supply company is suitable for our analysis. A comparison of our bottom-up approach with a top-down approach can serve to validate our results. In 2015, total electricity production in Rwanda was 524 GWh (plus 39 GWh net imports) while consumption in the industry sector was 96 GWh, and in the household sector 233 GWh (NISR, 2016b). In contrast, the same source states that household electricity consumption a year earlier was 355 GWh (NISR, 2016b). A 34% decrease in 1 year with an increasing number of consumers is quite questionable. Between July 2014 and June 2015, Rwanda's domestic electricity consumption was 337.3 GWh (REG, 2015). Total energy consumption in residential, commercial and public buildings in Kigali was 664 GWh in 2015 (Gouldson et al., 2016). This includes all types of fuels, and thus also firewood and charcoal for cooking, which make up a considerable proportion. Only the consumption of electricity in private buildings (residential and commercial) in Kigali was 142 GWh in 2014 with an annual increase of 11.2% (Gouldson et al., 2016), which results in a value of 158 GWh in 2015. This would mean that the extrapolation based on our arithmetic mean for the households in the urbanized part of Kigali alone (254–278 GWh) would be higher than for Kigali as a whole. Weighting according to the proportion of building types in the study area, the share of the urbanized part of Kigali in the total electricity consumption of the household sector would be between 79.5 and 86.8% in 2015 (126–137 GWh of 158 GWh). This appears to be a lot, but still realistic, as the majority of households are covered, the rest have a low electrification rate and low consumption, and the official data is inconsistent and could be based on assumptions. The modeling presented here is for the year 2015. To update the data and generate output D, it is only necessary to create a new dataset A (satellite image) and complete processes 6 and 7 (see Figure 1). Going through all the processes and especially the on-site surveys only need to be done at very irregular intervals, as the specific electricity consumption may change over several years.
4.3. Additional energy-related points of interest
About electrical appliance ownership, the EICV5 provides data to compare the results of our study. In Kigali 90.8% own a phone, 42.7% own a TV, and 14.6% own a Computer (NISR, 2018b). Additionally quintiles for the whole country from poor to rich are provided. The range from Q1 to Q5 is 48.4–93.0% for mobile phones, 0.4–42.9% for TV, and 0.0–15.2% for computers. Furthermore, EICV5 provides data on the main source of lighting in Kigali. It was 78.4% electricity, 0.8% oil lamp, 0.4% firewood, 10.5% candle, 1.5% lantern, 7.4% batteries, 0.9% solar panel, and 0.6% others (NISR, 2018c). The survey by Koo et al. (2018) from 2016 provides also additional data but only aggregated at the national level. The electrical appliances ownership included 73.6% phone charger, 59.6% radio, 45.5% TV, 31.4% electric iron, 27.3% smartphone charger, 24.6% DVD player, 22.6% rechargeable flashlight, 10.6% refrigerator, 9.8% computer, 8.0% water kettle, 6.7% fluorescent tube, and 2.0% microwave. The results of our study on electrical appliances (see Section 3.2) were slightly higher than the official statistics. However, it also shows that the weighting by building type is more in line with these data (Table 3). A distortion due to the arithmetic mean arises especially in the case of electrical appliances, which are more likely to be found in well-off households. For white goods like refrigerators, the arithmetic mean is 1.7-fold compared to the weighted mean. Regarding electric stoves, it is 2.8-fold.
Rwanda faces power blackouts (REG, 2020) and high electricity tariffs (RURA, 2020). As a landlocked country, power plant components, construction materials, construction itself, import, and transport are highly expensive. The challenge of an energy system is balancing supply and demand with the lowest possible costs. The results presented here are intended to help sustainable urban development with regard to the planning and design of electricity grids and power plant portfolios. Thereby, the article solely focuses on the electricity consumption of households in Kigali's inner-city. The authors are well aware that, there are regional differences, also within the country. We also acknowledge that other energy sources are quite relevant in terms of quantity and in terms of related GHG emissions. Other energy sources were included in the surveys. As they have no direct influence on the electricity system, they have not been examined in detail in the results section. Nevertheless, there are interactions between thermal and electrical energy at the household level. Especially when areas such as cooking are also gradually electrified. Without going into the disaggregation by building type, the distribution for cooking energy in our study was: 53.6% charcoal, 19.2% gas, 9.0% electricity, 0.8% firewood, 0.8% paraffin, 0.2% others, and 16.4% no answer. In the EICV4, as many as 83.3% of respondents in Rwanda said they cooked mainly with firewood and 15.2% with charcoal (NISR, 2016b). Cukić et al. (2021) even speak of 90% of Rwandans using solid fuels for cooking. The EICV5 (NISR, 2018c) again provides disaggregated values for Kigali in 2016/2017. The primary fuel used for cooking was: 68.1% charcoal, 22.4% firewood, 6.1% gas, 0.2% electricity, 0.1% biogas, 0.1% oil or kerosene, 0.0% crop waste, and 3.1% others. In rural areas even 92.7% of the population used firewood. In 2020 little changes can be seen. Still, most of the population in Rwanda uses wood as the main source of cooking with 86.0% of cases followed by charcoal with 11.8% (MINALOC and LODA, 2020). Gas was used by 1.2% of households and most predominantly in Kigali. More specifically, 29.0% of households in Kigali were using wood, 8.1% gas, and 61.6% charcoal. These traditional cooking methods cause very high GHG emissions. Nevertheless, this situation will change in the near future thanks to several plans and strategies for GHG mitigation, reducing dependence on biomass, and promoting LPG (Cukić et al., 2021). In addition, the share of electric stoves and their use will continue to increase. This dynamic must be considered for future studies. Our findings in combination with studies on cooking energy in Rwanda (Cukić et al., 2021; Khundi-Mkomba et al., 2021) should be included in this context.
Another point that goes beyond the analysis, but should nevertheless be addressed here, are economic issues. A total 78% of households in Kigali have a monthly income of <300,000 RWF (Nkubito and Baiden-Amissah, 2019). The average expenditure on electricity in our study was around 20,000 RWF per household. Thus, 78% of all households would spend more than 6.5% of their income on electricity. However, this value varies greatly between building types. The average monthly expenditure was 6,088 RWF per month for Basic, 28,398 RWF per month for Bungalow, and 42,979 RWF per month for Villa. However, since it can also be assumed that income will increase with a rising building type, the issue of suppressed demand may not only be relevant in the Basic building type. Changing the view from the consumer to the supplier, another interesting aspect is seen. The average expenditure on electricity per household per month in our study was around 20,000 RWF. To cover the annual cost of USD 50 per electricity customer, electricity consumption of at least 130 kWh per month or 1,560 kWh per year is required (MININFRA, 2018). Assuming an exchange rate of 1,000 RWF per USD, a grid connection cannot be operated economically for 73% of the households in Kigali. A further important fact is, that Rwanda changed its electricity tariff structure to usage levels (consumption blocks per month) as of 1st January 2017 (RURA, 2016a). The specific electricity price in the household sector has since been linked to the quantity, which reduces the burden on smaller consumers. Conversely, consumers have to pay significantly more from 15 or 50 kWh per month, which was even intensified from 2020 onwards (RURA, 2020). If there is a suppressed demand based on the price, this could increase electricity consumption of the Basic buildings and have an impact on electricity savings especially for Villas. This social and environmental flagship concept of Rwanda facilitates the provision of basic needs for the less well-off households and at the same time leads to climate protection for the wealthier ones.
Rwanda's goal is to increase the total household electricity access to 100% by 2024 through both on-grid (52%) and off-grid (48%) options (MININFRA, 2018). It also has ambitions to integrate more renewable energy sources into the system. With the increasing use of renewable energy technologies and off-grid solutions, data on the power consumption of households and other consumers is needed and indispensable. Nevertheless, the mere amount of electricity is not sufficient for adequate modeling of the energy system (Hayn et al., 2014; Torriti, 2014; Prinsloo et al., 2016). The temporal characteristics of the consumption, i.e., the load profile, have significant impacts on system design and costs as well as GHG emissions. Future research should address this aspect and also use various parameters from this study for modeling and/or validation. Time-of-use data or probability distributions of electricity consumption could be collected through survey questionnaires or smart meters. This would allow the use of regression analyses, neural networks, and other bottom-up stochastic approaches to generate load profiles. To avoid further data collection, the dataset presented here can also be used to generate load profiles. This can be achieved with a behavior-based load profile generator as presented by Pflugradt (2016), where the calculation of probability distributions and time-of-use data can be dispensed with.
4.4. Evidence to support the working hypothesis
The results presented in Section 3 support the working hypothesis. We demonstrated that a well-founded building typology is a useful proxy for household electricity consumption. A subdivision of the specific electricity consumption by household categories (Table 1) is expedient due to a positive skewness of the distribution. A bottom-up analysis based on the disaggregation according to building typology is more accurate, reliable, and realistic than using only an arithmetic mean of all households. Weighting the specific values according to their proportion in the study area and then carrying out a bottom-up analysis is particularly advantageous when there are large differences and dynamics in consumption and generation patterns of urban infrastructure sectors at the household level (urban-rural gap, formal vs. informal settlements, high Gini coefficient, population growth, etc.). The generic applicability of the methodology and thus the validation of the working hypothesis is also evident in other cities as well as other urban infrastructure sectors and socio-economic parameters, as Vetter-Gindele et al. (2019) and Warth et al. (2020) have proved. Carlson et al. (2013) also stated that the (arithmetic) mean is not a good basis for decision-making on energy policy or energy in general. The extrapolation presented refers to the year 2015. Nevertheless, it can be updated as needed by using the specific analysis of the individual building types, simply by obtaining and evaluating new satellite images. The overall methodology is based on a dynamic approach rather than a static one.
5. Conclusions
With the path Rwanda is taking in terms of land use management, low-carbon development and resilience to climate change, it is already a role model for other countries in the region and even for the whole Global South. Since the energy system is the single largest contributor to climate change, efforts should be intensified in this infrastructure sector. Like many other countries, Rwanda is focusing on the expansion of renewable energies. Due to increasing electricity consumption and volatility of electricity generation, it is especially crucial to balance supply and demand to make the energy system sustainable. However, a reliable method and database about electricity consumption at the household level is lacking in most dynamic cities. Using the method presented here, rapidly growing cities can cope with increasing electrification rates, increasing specific electricity consumption, and increasing electricity generation from variable renewable energy sources. The study shows how on-site analyses accompanied by geospatial mapping techniques can lead to a better understanding of residential energy systems. The temporal aspect of electricity consumption, however, is still an important issue that remains to be addressed. Using building types as indicators to distinguish between households with contrasting electricity consumption and load levels of electrical appliances present in the households helps to tackle the challenges of rapid urban growth. Disaggregated specific consumption data for infrastructure sectors like electricity is fundamental for urban planning. The weighting of specific values according to their proportion in the study area followed by a bottom-up analysis is preferable to the use of an arithmetic mean especially when there is an inhomogeneous population or when inhomogeneous urban development is evident. The proposed method can help municipal administrations to establish a database that can be updated at both regular intervals by the acquisition of new satellite images and resource-efficiently compared to time-consuming and expensive field surveys at the entire city level. The approach presented in this article can help cities and also countries like Rwanda achieve its various sustainable energy goals, as well as be applied in other countries of the Global South due to its generic nature.
Statements
Data availability statement
The raw data supporting the conclusions of this article will be made available by the authors, without undue reservation.
Author contributions
Conceptualization, methodology, validation, data curation, and formal analysis: JV-G. Investigation: JV-G, AB, and FB. Resources: JV-G, AB, FB, EU, and GR. Writing—original draft preparation: JV-G, AB, FB, and EU. Writing—review and editing: JV-G, AB, FB, EU, GR, and LE. Visualization: JV-G and AB. Supervision and funding acquisition: FB and LE. Project administration: AB, FB, and LE. All authors contributed to the article and approved the submitted version.
Funding
This research was supported by the German Ministry of Education and Research (Bundesministerium für Bildung und Forschung, BMBF) with the research project Rapid Planning, Grant No. 01LG1301J and 01LG1301K. The open access publication fee was funded by the University of Stuttgart.
Acknowledgments
Special thanks go to all the people involved on-site in Kigali. Without them, neither the documents could have been translated nor the interviews and data collection conducted. Abias Philippe Mumuhire (City of Kigali) and Sylvie Kayitesi Kanimba (UN Habitat) helped obtain the necessary permits and established contact with the interviewers. The interviewers included Canisius Gakwaya, Prosper Havugimana, Oliver Mutijima, Solange Niyigena, Jean Claude Nshimiyimana, and Claire Uwimana. Gratitude is also due to Dr Sheetal Marathe, a former colleague at IER, who accompanied the interviews on-site and provided the raw data for analysis.
Conflict of interest
The authors declare that the research was conducted in the absence of any commercial or financial relationships that could be construed as a potential conflict of interest. The reviewer FK-M declared a shared affiliation with the authors EU and GR to the handling editor at the time of the review.
Publisher’s note
All claims expressed in this article are solely those of the authors and do not necessarily represent those of their affiliated organizations, or those of the publisher, the editors and the reviewers. Any product that may be evaluated in this article, or claim that may be made by its manufacturer, is not guaranteed or endorsed by the publisher.
References
1
Agyeman K. Han S. Han S. (2015). Real-time recognition non-intrusive electrical appliance monitoring algorithm for a residential building energy management system. Energies8, 9029–9048. 10.3390/en8099029
2
Aidoo K. Briggs R. C. (2019). Underpowered: Rolling blackouts in Africa disproportionately hurt the poor. Afr. Stud. rev.62, 112–131. 10.1017/asr.2018.78
3
Akinyemi F. O. Pontius R. G. Jr Braimoh A. K. (2017). Land change dynamics: insights from Intensity Analysis applied to an African emerging city. J. Spatial Sci.62, 69–83. 10.1596/26639
4
Ali D. Deininger K. Duponchel M. (2016). Improving sustainability of land administration through decentralized service provision: evidence from Rwanda. Washington, DC. 10.1596/24708
5
Almeida A d. Fonseca P. Schlomann B. Feilberg N. (2011). Characterization of the household electricity consumption in the EU, potential energy savings and specific policy recommendations. Energy Build.43, 1884–1894. 10.1016/j.enbuild.2011.03.027
6
Bachofer F. Braun A. Adamietz F. Murray S. d'Angelo P. Kyazze E. et al . (2019). Building stock and building typology of kigali, Rwanda. Data4, 105. 10.3390/data4030105
7
Beckel C. Sadamori L. Santini S. (2013). “Automatic socio-economic classification of households using electricity consumption data,” in e-Energy '13: Proceedings of the Fourth International Conference on Future Energy Systems 75–86. 10.1145/2487166.2487175
8
Bhatia M. Angelou N. (2015). Beyond Connections : Energy Access Redefined: ESMAP Technical Report;008/15. License: CC BY 3.0 IGO. Available online at: https://openknowledge.worldbank.org/handle/10986/24368 (accessed December 09, 2022).
9
Bhattacharyya S. C. Timilsina G. R. (2009). Energy demand models for policy formulation: a comparative study of energy demand models. Policy research working paper. 10.1596/1813-9450-4866
10
Bimenyimana S. Asemota G. N. O. Li L. (2018). The state of the power sector in rwanda: a progressive sector with ambitious targets. Front. Energy Res.6, 68. 10.3389/fenrg.2018.00068
11
Bizimana J. P. Nduwayezu G. (2021). Spatio-temporal patterns of malaria incidence in Rwanda. Trans. GIS25, 751–767. 10.1111/tgis.12711
12
Bizimana J. P. Nduwayezu G. Gabineza C. Niyonzima T. (2021). Spatial and temporal analysis of the land use and land cover changes in gatumba mining landscape, Rwanda. Rwanda J. Eng. Sci. Technol. Environ.4, 1067.
13
Burns H. (2021). “A Smart City Masterplan, Kigali,” in Urban planning for transitions, eds. N. Douay, and M. Minja (London, New York: iSTE; Wiley) 153–169. 10.1002/9781119821670.ch10
14
Byizigiro R. V. Rwanyiziri G. Mugabowindekwe M. Kagoyire C. Biryabarema M. (2020). Estimation of soil erosion using RUSLE model and GIS: the case of satinskyi catchment, Western Rwanda. Rwanda J. Eng. Sci. Technol. Environ.3, 14–33. 10.4314/rjeste.v3i1.2S
15
Cabeza L. F. Ürge-Vorsatz D. Ürge D. Palacios A. Barreneche C. (2018). Household appliances penetration and ownership trends in residential buildings. Renew. Sustain. Energy Rev.98, 1–8. 10.1016/j.rser.2018.09.006
16
Cader C. Pelz S. Radu A. Blechinger P. (2018). Overcoming data scarcity for energy access planning with open data–the example of Tanzania. Int. Arch. Photogram. Remote Sens. Spat. Inf. Sci.42, 23–26. 10.5194/isprs-archives-XLII-4-W8-23-2018
17
Carlson D. R. Scott Matthews H. Bergés M. (2013). One size does not fit all: Averaged data on household electricity is inadequate for residential energy policy and decisions. Energy Build.64, 132–144. 10.1016/j.enbuild.2013.04.005
18
Cheng V. Steemers K. (2011). Modelling domestic energy consumption at district scale: A tool to support national and local energy policies. Environ. Modell. Softw.26, 1186–1198. 10.1016/j.envsoft.2011.04.005
19
City of Kigali (2013). The City of Kigali Development Plan (2013-2018). Kigali, Rwanda.
20
Climate Vulnerable Forum (2022). Member states. Available online at: https://thecvf.org/category/member-states/ (accessed December 22, 2022).
21
Cukić I. Kypridemos C. Evans A. W. Pope D. Puzzolo E. (2021). Towards sustainable development goal 7 “universal access to clean modern energy”: national strategy in Rwanda to scale clean cooking with bottled gas. Energies14, 4582. 10.3390/en14154582
22
Dominguez C. Orehounig K. Carmeliet J. (2019). Modelling of rural electrical appliances saturation in developing countries to project their electricity demand: A case study of sub-Saharan Africa. Int. J. Sustain. Energy Plan. Manag.2019, 5–16. 10.5278/ijsepm.2564
23
EAC (2016). East African Community Vision 2050: Regional Vision for Socio-Economic Transformation and Development. Arusha, Tanzania: EAC.
24
ESRI Rwanda EUCL and, REG.. (2022). Rwanda Survey up: ArcGIS Map. Transformers, Power lines. Available online at: https://www.arcgis.com/home/webmap/viewer.html? Available online at: https%3A%2F%2Feuclgis.reg.rw%2Fserver%2Frest%2Fservices%2FRwanda_Survey_up%2FMapServerandsource=sd (accessed December 20, 2022).
25
Esslinger P. Witzmann R. (2012). “Entwicklung und Verifikation eines stochastischen Verbraucherlastmodells für Haushalte,” in 12. Symposium Energieinnovation.
26
EUCL ESRI Rwanda (2022). Rwanda Electrical Geo-Portal. Available online at: https://euclgis.reg.rw/portal/home/ (accessed October 21, 2022).
27
Everitt B. Skrondal A. (2010). The Cambridge Dictionary of Statistics. Cambridge, UK, New York: Cambridge University Press. 10.1017/CBO9780511779633
28
Firth S. Lomas K. Wright A. Wall R. (2008). Identifying trends in the use of domestic appliances from household electricity consumption measurements. Energy Build.40, 926–936. 10.1016/j.enbuild.2007.07.005
29
GoR (2011). Green Growth and Climate Resilience: National Strategy for Climate Change and Low Carbon Development. Government of Rwanda (GoR), prepared with the assistance of Smith School of Enterprise and Environment (SSEE), University of Oxford. Kigali, Rwanda.
30
GoR and GGGI (2015). National Roadmap of Green Secondary City Development. Government of Rwanda (GoR); The Global Green Growth Institute (GGGI). Kigali, Rwanda.
31
GoR and MoE (2021). Rwanda's Adaption Communication to the United Nations Framework Convention on Climate Change. Republic of Rwanda (GoR); Ministry of Environment (MoE).
32
Gouldson A. Colenbrander S. Sudmant A. Chilundika N. Musahara H. Melo L. de (2016). The economics of low carbon cities: Kigali Rwanda. University of Leeds.
33
Grandjean A. Adnot J. Binet G. (2012). A review and an analysis of the residential electric load curve models. Renew. Sustain. Energy Rev.16, 6539–6565. 10.1016/j.rser.2012.08.013
34
Grosh M. E. Muñoz J. (1996). A Manual for Planning and Implementing the Living Standards Measurement Study Survey. Washingdon, DC: The World Bank. 10.1596/0-8213-3639-8
35
Gustavsson M. (2007). With time comes increased loads—An analysis of solar home system use in Lundazi, Zambia. Renew. Energy32, 796–813. 10.1016/j.renene.2006.03.015
36
Hankins M. Sosis K. Kinuthia A. Arineitwe J. N. Kithinji J. (2016). EAC–Renewable Energy and Energy Efficiency–Regional Status Report: 2016 East African Community.
37
Hayn M. Bertsch V. Fichtner W. (2014). Electricity load profiles in Europe: The importance of household segmentation. Energy Res. Soc. Sci.3, 30–45. 10.1016/j.erss.2014.07.002
38
Hino H. Shen H. Murata N. Wakao S. Hayashi Y. (2013). A Versatile Clustering Method for Electricity Consumption Pattern Analysis in Households. IEEE Trans. Smart Grid4, 1048–1057. 10.1109/TSG.2013.2240319
39
IPCC (2014). Climate change 2014: Synthesis report. Contribution of Working Groups I, II and III to the Fifth Assessment Report of the. Geneva, Switzerland: Intergovernmental Panel on Climate Change.
40
Israel G. D. (1992). Determing Sample Size: Fact Sheet PEOD-6. University of Florida.
41
Jones R. V. Fuertes A. Lomas K. J. (2015). The socio-economic, dwelling and appliance related factors affecting electricity consumption in domestic buildings. Renew. Sustain. Energy Rev.43, 901–917. 10.1016/j.rser.2014.11.084
42
Joshi S. Joshi S. Damani H. Ng J. Lauwa L. (2013). Kigali city master plan report: Detailed physical plan for Gasabo and Kicukiro, Kigali.
43
Kabeja C. Li R. Rwabuhungu D. E. (2021). Quantifying the Effects of Simulated Changes in Land Use/Cover on Flood Reduction: an Insight From Kigali. African J. Online4, 1041.
44
Khundi-Mkomba F. (2021). Are urban Rwandan households using modern energy sources? an exploration of cooking fuel choices. IJEEP11, 325–332. 10.32479/ijeep.10735
45
Khundi-Mkomba F. Kumar Saha A. Wali U. G. (2021). Examining the state of energy poverty in Rwanda: An inter-indicator analysis. Heliyon7, e08441. 10.1016/j.heliyon.2021.e08441
46
Koo B. Rysankova D. Portale E. Angelou N. Keller S. Padam G. (2018). Rwanda: Beyond Connections. Energy Access Diagnostic Report based on the Multi-Tier Framework. World Bank. Available online at: https://openknowledge.worldbank.org/entities/publication/e36a12eb-b3d3-59be-b2c8-b4f6c11081fa (accessed March 20, 2023).
47
Lee C.-C. (2005). Energy consumption and GDP in developing countries: A cointegrated panel analysis. Energy Econ.27, 415–427. 10.1016/j.eneco.2005.03.003
48
Lee C.-C. Chang C.-P. (2007). Energy consumption and GDP revisited: A panel analysis of developed and developing countries. Energy Econ.29, 1206–1223. 10.1016/j.eneco.2007.01.001
49
Lenz L. Munyehirwe A. Peters J. Sievert M. (2017). Does large-scale infrastructure investment alleviate poverty? impacts of rwanda's electricity access roll-out program. World Dev.89, 88–110. 10.1016/j.worlddev.2016.08.003
50
Leopold A. (2014). Making Climate Change Mitigation More Meaningful: The Link to Universal Energy Access. Rugby, Warwickshire, United Kingdom: Practical Action Publishing.
51
Manirakiza V. (2014). Promoting inclusive approaches to address urbanisation challenges in Kigali. African Rev. Econ. Finan.6, 161–180.
52
Marathe S. D. Eltrop L. (2017). “Domestic energy consumption patterns in Kigali, Rwanda–how disparate are they in view of urbanisation?” in 2017 International Conference on the Domestic Use of Energy (DUE), Cape Town, South Africa, 120–125. 10.23919/DUE.2017.7931834
53
McLoughlin F. Duffy A. Conlon M. (2012). Characterising domestic electricity consumption patterns by dwelling and occupant socio-economic variables: An Irish case study. Energy Build.48, 240–248. 10.1016/j.enbuild.2012.01.037
54
McNeil M. A. Letschert V. E. (2010). Modeling diffusion of electrical appliances in the residential sector. Energy Build.42, 783–790. 10.1016/j.enbuild.2009.11.015
55
MINALOC and LODA (2020). Households Profiling Report. Kigali, Rwanda.
56
MINECOFIN (2020). Vision 2050. Kigali, Rwanda.
57
MININFRA (2015a). Energy Sector Strategic Plan: 2013/14–2017/18. Available online at: https://www.mininfra.gov.rw/fileadmin/user_upload/Mininfra/Documents/Energy_Docs/ESSP_revised.pdf (accessed August 30, 2022).
58
MININFRA (2015b). Rwanda Energy Policy. Available online at: https://www.mininfra.gov.rw/fileadmin/user_upload/Mininfra/Publications/Policies/Energy/Rwanda_Energy_Policy_March_2015.pdf (accessed March 11, 2022).
59
MININFRA (2015c). Sustainable Energy for All Action Agenda: Final Draft for Cabinet Approval. Available online at: https://rise.esmap.org/data/files/library/rwanda/Clean%20Cooking/SE4All%20Action%20Agenda%20Final%20Draft%20for%20Cabinet%20(1).pdf (accessed November 03, 2022).
60
MININFRA (2016a). Infrastructure sector annual report for FY 2015/16: August 2016. Available online at: https://www.mininfra.gov.rw/index.php?eID=dumpFileandt=fandf=10263andtoken=6c267a37c62d08780cd0e6550dc002645ca2253b (accessed February 07, 2023).
61
MININFRA (2016b). Sustainable Energy for All Action Agenda: 2016 Update–Draft. Available online at: https://www.se4all-africa.org/fileadmin/uploads/se4all/Documents/Country_AAs/Rwanda_Action_Agenda.pdf (accessed November 03, 2022).
62
MININFRA (2018). Energy Sector Strategic Plan: 2018/19–2023/24. Available online at: https://www.reg.rw/fileadmin/user_upload/Final_ESSP.pdf (accessed April 21, 2023).
63
Munyaneza J. Wakeel M. Chen B. (2016). Overview of Rwanda energy sector: from energy shortage to sufficiency. Energy Proc.104, 215–220. 10.1016/j.egypro.2016.12.037
64
Ngwijabagabo H. Niyonzima T. Nyandwi E. Hirwa H. Nishyirimbere A. Mwizerwa F. et al . (2021). Spatial suitability analysis and mapping of agroforestry areas. Case study of Musanze District in Northern Province of Rwanda. Rwanda J. Eng. Sci. Technol. Environ.4, 1044.
65
NISR (2012). 4th Population and Housing Census: Provisional Results. 2012. Available online at: http://microdata.statistics.gov.rw/index.php/catalog/65/download/508 (accessed February 22, 2022).
66
NISR (2016a). EICV4–Environment and natural resources thematic Report: Integrated household living conditions survey. Enquête Intégrale sur les Conditions de Vie des Ménages [EICV]. Kigali, Rwanda: The Republic of Rwanda, NISR, National Institute of Statistics of Rwanda.
67
NISR (2016b). Statistical yearbook 2016.
68
NISR (2018a). EICV 5–Main indicators report 2016/2017. Integrated Household Living Conditions Survey. Available online at: https://www.statistics.gov.rw/file/7279/download?token=ns9PQDK8 (accessed January 26, 2023).
69
NISR (2018b). Rwanda Poverty Profile Report: 2016/2017. The Fifth Intergrated Household Living Conditions Survey (EICV5). November 2018. Kigali, Rwanda.
70
NISR (2018c). The fifth Integrated Household Living Conditions Survey (EICV 5): 2016/2017. Thematic Report. Environment and Natural Resources. Kigali, Rwanda.
71
NISR (2022). GDP National Accounts: 2021. Available online at: https://www.statistics.gov.rw/file/11774/download?token=2N6BDYHV (accessed March 16, 2023).
72
NISR (2023). The Fifth Rwanda Population and Housing Census: Main Indicators Report.
73
NISR MINECOFIN (2014). Fourth Population and Housing Census, Rwanda, 2012: Final Results. Main Indictors Report. Available online at: https://www.statistics.gov.rw/file/2868/download?token=xjcIMAtB (accessed May 11, 2023).
74
Nkubito F. Baiden-Amissah A. (2019). Regulatory planning and affordable housing in Kigali City: policies, challenges and prospects. Rwanda J. Eng. Sci. Technol. Environ.2, 845. 10.4314/rjeste.v2i1.6
75
Nsengimana C. Han X. T. Li L. (2020). Comparative analysis of reliable, feasible, and low-cost photovoltaic microgrid for a residential load in Rwanda. Int. J. Photoenergy2020, 8855477. 10.1155/2020/8855477
76
Nyandwi E. Veldkamp T. Amer S. Ruberanziza E. Rujeni N. Umulisa I. (2022). Using routinely collected health records to identify the fine-resolution spatial patterns of soil-transmitted helminth infections in Rwanda. Trop. Med. Infect. Dis7, 202. 10.3390/tropicalmed7080202
77
Ó Gallachóir B. P. Keane M. Morrissey E. O'Donnell J. (2007). Using indicators to profile energy consumption and to inform energy policy in a university—A case study in Ireland. Energy Build.39, 913–922. 10.1016/j.enbuild.2006.11.005
78
Oluoch S. Lal P. Susaeta A. Mugabo R. Masozera M. Aridi J. (2022). Public preferences for renewable energy options: a choice experiment in Rwanda. Front. Clim.4, 874753. 10.3389/fclim.2022.874753
79
Pflugradt N. (2016). Modellierung von Wasser und Energieverbräuchen in Haushalten. Dissertation. Chemnitz: Technische Universität Chemnitz, Technische Thermodynamik.
80
Prinsloo G. J. Dobson R. Brent A. (2016). Scoping exercise to determine load profile archetype reference shapes for solar co-generation models in isolated off-grid rural African villages. J. Energy Southern Africa27, 11–27. 10.17159/2413-3051/2016/v27i3a1375
81
REG (2015). Rwanda Energy Group Ltd: corporate magazine. June-August 2015.
82
REG (2020). Annual Report: For Rwanda Energy Group, of the Year 2019-2020. Available online at: https://www.reg.rw/fileadmin/user_upload/FINAL_REG_ANNUAL_REPORT_19-_2020.pdf (accessed May 09, 2023).
83
Republic of Rwanda (2015). Intended nationally determined contribution (INDC) for the Republic of Rwanda.
84
Republic of Rwanda (2020). National Land Use and Development Master Plan: NLUDMP 2020-2050. Integrative Plan July 2020. Available online at: https://www.environment.gov.rw/index.php?eID=dumpFileandt=fandf=10551andtoken=ef94f9c2e05dfb6b5e43acfdaaefa0dfe0071380 (accessed October 21, 2022).
85
RURA (2012). Board Decision No 007/ENER-RURA/2012: Reviewing the end user electricity tariff in Rwanda. Available online at: https://www.rura.rw/fileadmin/docs/Press_Statement_Electricity.pdf (accessed February 22, 2022).
86
RURA (2015). Board Decision No 001/BD/ICA-CLIA/RURA/2015. Available online at: https://www.rura.rw/fileadmin/docs/BOARD_DECISION_ELECTRICITY_TARIFF_2015.pdf (accessed February 22, 2022).
87
RURA (2016a). Decision No 05/BD/ER-LER/RURA/2016: Itangazo. Available online at: http://igihe.com/IMG/pdf/itangazo-_ibiciro_bishya_by_amashanyarazi_1_.pdf (accessed November 03, 2022).
88
RURA (2016b). Key statistics in electricity sub-sector as of december 2015Available online at: https://www.rura.rw/fileadmin/Documents/docs/Energy_Statistics_report_as_of_December___2015_for_publication.pdf (accessed February 21, 2022)
89
RURA (2020). Decision No 01/BD/ER-EWS/RURA/2020. Available online at: https://rura.rw/fileadmin/publication/Board_Decision_on_Electricity_End_User_Tariffs_in_Rwanda.pdf (accessed November 03, 2022).
90
Rwanyiziri G. Kayitesi C. Mugabowindekwe M. Byizigiro R. V. Muyombano E. Kagabika M. B. et al . (2020). Spatio-temporal Analysis of Urban Growth and Its Effects on Wetlands in Rwanda: The Case of Rwampara Wetland in the City of Kigali. JASEM24, 1495–1501. 10.4314/jasem.v24i9.2
91
Safari B. (2010). A review of energy in Rwanda. Renew. Sustain. Energy Rev.14, 524–529. 10.1016/j.rser.2009.07.009
92
Sanchez-Escobar M. O. Noguez J. Molina-Espinosa J. M. Lozano-Espinosa R. Vargas-Solar G. (2021). The contribution of bottom-up energy models to support policy design of electricity end-use efficiency for residential buildings and the residential sector: a systematic review. Energies14, 6466. 10.3390/en14206466
93
Soytas U. Sari R. (2003). Energy consumption and GDP: Causality relationship in G-7 countries and emerging markets. Energy Econ.25, 33–37. 10.1016/S0140-9883(02)00009-9
94
Tafahomi R. Nadi R. (2021). Protection of Natural Wetlands through Landscape Design in Kigali City. Rwanda J. Eng. Sci. Technol. Environ.4, 585. 10.4314/rjeste.v4i1.11
95
Tatem A. Linard C. (2011). Population mapping of poor countries. Nature474, 36. 10.1038/474036d
96
Tenenbaum B. Greacen C. Siyambalapitiya T. Knuckles J. (2014). From the bottom up: How Small Power Producers and Mini-Grids Can Deliver Electrification and Renewable Energy in Africa. Washington, D.C. World Bank Publications; The World Bank. 10.1596/978-1-4648-0093-1
97
Torriti J. (2014). A review of time use models of residential electricity demand. Renew. Sustain. Energy Rev.37, 265–272. 10.1016/j.rser.2014.05.034
98
Tusting L. S. Bisanzio D. Alabaster G. Cameron E. Cibulskis R. Davies M. et al . (2019). Mapping changes in housing in sub-Saharan Africa from 2000 to 2015. Nature568, 391–394. 10.1038/s41586-019-1050-5
99
Ukwishaka D. Mwizerwa F. Hakizimana J. d. D. (2021). Geospatial Analysis of Site Suitability for Solar Photovoltaic (PV) in Rwanda. Rwanda J. Eng. Sci. Technol. Environ.4, 1047.
100
UNFCCC (2016). COP22.The Low Carbon Monitor: Pursuing the 1.5C Limit Benefits and Opportunities.Annex 6: CVF vision.
101
UNFCCC (2022a). Paris Agreement–Status of Ratification: Chapter XXVII−7. d.
102
UNFCCC (2022b). United Nations Framework Convention on Climate Change–Status of Ratification. Chapter XXVII−7.
103
United Nations (1973). Report of the United Nations Conference on the human environment: A/CONF.48/14/Rev.1.Stockholm, 5-16 June 1972. New York.
104
United Nations (1992). United Nations Framework Convention on Climate Change. New York: United Nations.
105
United Nations (1998). Kyoto Protocol on the United Nations Framework Convention on Climate Change.
106
United Nations (2015a). Paris Agreement. Available online at: http://unfccc.int/files/essential_background/convention/application/pdf/english_paris_agreement.pdf (accessed March 15, 2022).
107
United Nations (2015b). A/RES/70/1: Transforming our world: the 2030 Agenda for Sustainable Development.Resolution adopted by the General Assembly on 25 September 2015.
108
United Nations (2017). New urban agenda: H III : Habitat III : Quito 17-20 October 2016. Nairobi: United Nations.
109
Uwayezu E. Vries W. T. (2020). Access to affordable houses for the low-income urban dwellers in kigali: analysis based on sale prices. Land9, 85. 10.3390/land9030085
110
Vetter-Gindele J. Braun A. Warth G. Bui T. T. Q. Bachofer F. Eltrop L. (2019). Assessment of household solid waste generation and composition by building type in Da Nang, Vietnam. Resources8, 171. 10.3390/resources8040171
111
Warnest M. Sagashya D. G. Nkurunziza E. (2012). “Emerging in a changing climate–sustainable land use management in Rwanda: Knowing to manage the territory, protect the environment, evaluate the cultural heritage,” in FIG Working Week Proceedings1–14.
112
Warth G. Braun A. Assmann O. Fleckenstein K. Hochschild V. (2020). Prediction of socio-economic indicators for urban planning using VHR satellite imagery and spatial analysis. Remote Sens.12, 1730. 10.3390/rs12111730
113
World Bank (2016). World Development Indicators: 2016. Washington, DC: World Bank.
114
World Bank (2020). World Development Indicators: 2020. Washington, DC: World Bank.
115
WRI (2017). CAIT 2017: Climate Analysis Indicators Tool: WRI's Climate Data Explorer. Available online at: http://cait2.wri.org (accessed September 06, 2017).
116
Yang D. Guo J. Li J. Wang S. Sun S. (2021). Knowledge mapping in electricity demand forecasting: a scientometric insight. Front. Energy Res.9, 771433. 10.3389/fenrg.2021.771433
117
Yao R. Steemers K. (2005). A method of formulating energy load profile for domestic buildings in the UK. Energy Build.37, 663–671. 10.1016/j.enbuild.2004.09.007
Summary
Keywords
electricity consumption analysis, electrical appliance ownership, energy consumption, household classification, building typology, remote sensing, data integration, spatial analysis
Citation
Vetter-Gindele J, Bachofer F, Braun A, Uwayezu E, Rwanyiziri G and Eltrop L (2023) Bottom-up assessment of household electricity consumption in dynamic cities of the Global South—Evidence from Kigali, Rwanda. Front. Sustain. Cities 5:1130758. doi: 10.3389/frsc.2023.1130758
Received
23 December 2022
Accepted
12 July 2023
Published
15 August 2023
Volume
5 - 2023
Edited by
João Pedro Gouveia, New University of Lisbon, Portugal
Reviewed by
Paul Isolo Mukwaya, Makerere University, Uganda; Fydess Khundi-Mkomba, University of Rwanda, Rwanda; Gabriel Hoh Teck Ling, University of Technology Malaysia, Malaysia
Updates
Copyright
© 2023 Vetter-Gindele, Bachofer, Braun, Uwayezu, Rwanyiziri and Eltrop.
This is an open-access article distributed under the terms of the Creative Commons Attribution License (CC BY). The use, distribution or reproduction in other forums is permitted, provided the original author(s) and the copyright owner(s) are credited and that the original publication in this journal is cited, in accordance with accepted academic practice. No use, distribution or reproduction is permitted which does not comply with these terms.
*Correspondence: Jannik Vetter-Gindele jannik.vetter-gindele@ier.uni-stuttgart.de
Disclaimer
All claims expressed in this article are solely those of the authors and do not necessarily represent those of their affiliated organizations, or those of the publisher, the editors and the reviewers. Any product that may be evaluated in this article or claim that may be made by its manufacturer is not guaranteed or endorsed by the publisher.