Abstract
Amid the global emergence of smart cities, there exists a lack of consensus among scholars and city leaders regarding their perception and development. Notably, there is a dearth of quality indicators for evaluating the progress of smart city development. This study addresses this gap by focusing on identifying the drivers that influence residents' assessments of life quality and comfort. By gathering assessments from residents in priority areas identified as problematic for city prosperity, and incorporating basic measures of technological development, machine-learning models were constructed using RapidMiner Studio. These models aim to predict the Human Development Index (HDI) of the city and discern the most impactful drivers related to citizens' life satisfaction. The research compares various models, ultimately selecting the optimal Fast Large Margin model. The findings highlight crucial concerns for residents, including air pollution, recycling, basic amenities, and health services. The study relies on a unique dataset comprising official statistical information from 141 smart cities across 73 countries. The developed models offer valuable insights for decision-makers, enabling the formulation of effective strategies for sustainable smart city development and the enhancement of digitalization policies.
1 Introduction
Modern key concepts and initiatives of the smart city have undergone many transformations, and are developing and improving (Kirimtat et al., 2020; José and Rodrigues, 2024). However, today there is no agreed understanding of this phenomenon and the definition of the term “smart city” (Camero and Alba, 2019). It is defined as “the convergence of technology and the city” (Yigitcanlar et al., 2018), and as “centers of economic wealth and hope for a standardized life” (Kutty et al., 2022). No agreement has been reached on the unified definition of concepts such as “smart people,” “smart living,” “smart mobility,” “smart environment,” “smart governance,” “smart economy” (Tutak and Brodny, 2023), and “citizens' quality” (Chang and Smith, 2023). There is no universally accepted understanding of the main drivers for increasing the intelligence of cities (Azevedo Guedes et al., 2018), what makes a city “smarter” and which drivers of a smart city can provide a high quality of life and a comfortable, safe environment for creativity and innovation (Mora et al., 2019; Camboim et al., 2019). There is no single approach to the main application domains of a SC (De Marco and Mangano, 2021). Unknown definitions of the results of the development of a smart city (Lim et al., 2019).
There is also a mismatch between interpretation and understanding of what is “smart” and what is “sustainable,” the “smart mobility” paradigm is not agreed upon (Noy and Givoni, 2018). Even though sustainable development is associated with the expected results of smart city initiatives, this relationship has not received due recognition in scientific circles and practical confirmation (Yigitcanlar et al., 2018). Such uncertainty at the conceptual level emphasizes the need to improve the understanding of the possibilities and consequences of smart cities (Kummitha and Crutzen, 2017).
Despite the current uncertainty, the trend of Smart Cities initiatives continues to spread rapidly around the world. It aims to increase the competitiveness of local communities through innovation and the quality of life of citizens through better public services and a safer environment (Appio et al., 2019). Modern cities are oriented toward integrating technological progress across various spheres and components, such as mobility, energy management, utilization of natural resources, water supply and waste processing, air quality, land-use planning, service networks, construction, as well as economic aspects, social participation, employment development, and ensuring citizens' safety (Campisi et al., 2021). The concept of a smart city is increasingly popular in the development of policies for modern cities based on digital and technological innovations (Verrest and Pfeffer, 2019). The development of a smart city is aimed at creating urban areas with a high quality of life, incorporating opportunities from modern infrastructure, such as economic prospects, cultural richness, demographic-geographic balance, and technological advantages, including healthcare, education, and governance, as well as aligning with sustainable development goals, such as ensuring a clean, green, safe, and reliable environment (Kim et al., 2022). This increases the level of quality of life and contributes to the satisfaction of residents with the introduced smart solutions. It is the feeling of residents regarding the quality and comfort of living that is a decisive assessment of the level of development of a smart city (Szczepańska et al., 2023).
The foundation of the smart city concept lies in the broad and multifaceted application of information and communication technologies, aiming to establish the most favorable living conditions for both residents and visitors of the city. It is important to ensure favorable conditions for economic activity and environmental preservation. One of the crucial aspects of this concept is safety in the broadest sense (Tutak and Brodny, 2023). Despite the often-cited aspiration for sustainable development as a desired outcome of smart city initiatives, there is little evidence on how the results of sustainable development are integrated or achieved within the framework of smart city initiatives (Yigitcanlar et al., 2018).
The United Nations Economic Commission for Europe (UNECE) and International Telecommunication Union (ITU) defines a smart sustainable city as a city that uses innovation, ICT, and other tools to improve the quality of life of its residents, increase the efficiency of city management and the quality of service provision, competitiveness, ensuring needs of the current generation and preserving opportunities for future generations in the sense of social, economic, ecological, and cultural areas [United Nations Economic Commission for Europe (UNECE), 2020]. The UNECE people-smart sustainable city concept expands the understanding of intelligence in city development and considers a set of conditions for improving opportunities that can ensure sustainability and are focused on improving the quality of life and the development of a harmonious society. This approach includes ensuring equal opportunities and efficiency, meeting social needs, and promoting innovation in urban development (United 4, 2017).
Smart city concepts are interesting for scientists and businesses due to the consolidation of the most common modern world trends toward urbanization, informatization, and globalization (Zheng et al., 2020). However, today there is no agreed understanding of key topics regarding research on the level of development of smart cities (Ismagilova et al., 2019). Also, the main drivers that measure it are not defined. Therefore, multi-faceted applied research to identify a reliable set of key performance indicators for smart sustainable cities is relevant.
The purpose of our research was to identify the main drivers that influence the feeling of satisfaction with the quality, comfort, and safety of living in smart cities. Applied research was conducted based on a unique set of official statistical data on 141 smart cities from 73 countries of the world. The dependence of the level of the city HDI, which is a generally accepted measure of the development of smart cities (IMD Smart City, 2023), on 54 measures of the development of smart cities (The Global Data Lab, 2022) was investigated.
To achieve the goal, the following hypotheses were formulated:
-
H1: the level of development of a smart city depends on the number of its residents.
-
H2: the role of information technology is exceptional in the formation of the “smart city” as a vector of global sustainable development.
Graphical analysis was performed to test H1. To verify H2 we built machine-learning models with RapidMiner Studio for predicting the HDI-city level and determining the most influential drivers associated with the perception of citizens of smart cities of comfort and quality of living based on the analyzed indicators.
2 Literature studies
Modern scientists pay a lot of attention to the concept and initiatives of smart cities, but the inconsistency and incompleteness of different approaches give rise to new discussions (Meijer and Bolívar, 2016). Trindade et al. (2017) analyzed scientific works on the problems of environmental sustainability and the smart city to determine the connection between these concepts. They indicated the need for further research on the effectiveness of using the concept of a smart city and relevant practices to ensure the sustainability of cities. José and Rodrigues (2024) conducted a systematic review of the literature on the application of innovative practices for the development of smart cities and explored the main challenges for innovation in a smart city. The authors concluded that the main reason for insufficient progress in smart city initiatives may be the inconsistency of the results of scientific research on the impact of digital innovations on smart cities with innovative practices that are used in smart cities today. Ramaswami et al. (2016) identified the key drivers of smart cities and proposed the main principles of the development of smart cities, for the transition to a smart, sustainable, and healthy future. Ismagilova et al. (2019) considered the creation of a paradigm of smart cities of the future, which guarantees the wellbeing and rights of its residents, developed industry, and urban planning, focused on ecology and sustainability. Addas (2023) studied the sustainability of smart cities and their impact on health. The author conducted a comparative study of different cities to analyze the goals of sustainable development, which may affect the environmental sustainability and sustainability of the city in the future. Chen (2023) studied the relationship between smart cities and urban happiness. He argued that a smart environment that supports landscaping, controls air pollution and provides recycling is associated with happiness; for increasing wellbeing and comfort of life, the efficiency of urban infrastructure is more significant than technical equipment. The author noted that in different cities, citizens have different needs to achieve happiness. Kolokotsa et al. (2024) studied the issue of integration of nature in smart cities. They analyzed the possibilities of using nature-based solutions to combat the negative consequences of large-scale urbanization and climate change. Yadav et al. (2019) proposed a structural framework in developing economies. Correia et al. (2022) conducted an in-depth analysis of the relationship between smart cities and Industry 4.0. In Lipianina-Honcharenko et al. (2024), an innovative approach to municipal waste management using intelligent methods of classification, clustering, and forecasting was introduced. Breytenbach and Kariem (2020) argued that power imbalance within organizations structurally dampens the voices of citizens, ultimately jeopardizing the goals of smart cities. Bibri (2019) provided an overview of smart and smarter cities from the perspective of sustainability and its connection with big data analytics. The author claimed that the context of sustainable development creates misunderstandings and drawbacks in comprehending the concept of smart cities. Meanwhile, there are significant opportunities to utilize big data analytics to achieve the sustainable development goals of future smart cities. Sheikh et al. (2023) proposed a new more-than-human approach to governance in smart cities. Parygin et al. (2022) considered the possibility of using historical data from social networks to predict public opinion regarding a specific decision for urban development. Shayan et al. (2020) studied the risks associated with smart cities. Żywiołek and Schiavone (2021) investigated the perception of intelligent solutions by residents of smart cities and their impact on the feeling of privacy and security, which, in turn, affects the reputation of the city. The authors proposed a methodology for studying residents' satisfaction, determining desires and needs, as well as analyzing risks and potential threats for residents of smart cities. Boreiko et al. (2017) engaged in the development of models and means of the server part of the system for passenger traffic registration of public transport in the “smart” city. In the study (Popova and Izonin, 2023), the authors consider the overall idea of a smart house system, justify the need to use resource-saving systems and technologies, and also consider the integration of such systems during the reconstruction of low-rise residential buildings. Kazarian et al. (2019) presented a model and principles for developing a smart home system using a modular structure and the Redux data flow architectural pattern.
Despite a significant number of scientific studies on the issue of smart city concepts, there is no consensus among scientists regarding the approaches to defining the main concepts and main areas that define a city as “smart.” Analysis of the drivers that characterize the level of development of smart cities in the context of sustainable development requires particularly careful research. Using data science and machine learning methods to understand and analyze the phenomenon of smart cities.
3 Materials and methods
The methodology for selecting indicators and cities was based on a comprehensive approach developed by the United Nations Economic Commission for Europe (UNECE) for evaluating sustainable smart cities [United Nations Economic Commission for Europe (UNECE), 2020]. In particular, the methodology for collecting key performance indicators was used, which involves a multi-level analysis of urban systems taking into account technological, social, and economic parameters. The selection criteria included not only technological development but also the ability of urban systems to ensure population quality of life, considering social, environmental, and governance aspects. A distinctive feature of the study was the combination of objective statistical data and subjective resident assessments, which allowed the creation a more comprehensive and representative model for evaluating smart city development.
To test the hypotheses formulated in Chapter 1, an empirical analysis of the main indicators of development efficiency and innovation characterizing smart cities in different countries of the world was conducted. One of the basic indicators of the development of the world's cities is the Smart City Index (SCI), developed by the Smart City Observatory, which is part of the Global Competitiveness Center of the IMD. The international association “World Smart Sustainable Cities Organization” (WeGO) publishes periodic ratings of the “IMD Smart City Index” to measure the regional competitiveness of smart cities in the field of economic and technological growth and “human” development (standard of living, quality of the environment, inclusive opportunities). The index is calculated based on residents' assessments of various aspects of life in their city that pose threats to their safe and comfortable living (IMD Smart City, 2023).
SCI is calculated from 2019. However, in 2023, its methodology was changed. Modern SCI is focused on citizens' satisfaction with various aspects of life in their city and determines the meaning of comparison of various qualities of cities. This is essentially a city-oriented Human Development Index (HDI-city). SCI is calculated based on reliable empirical data and assessments of city residents regarding the quality and comfort of various aspects of living in these cities. HDI-city is designed to determine the degree of impact of technologies on the creation of new opportunities for solving the problems of urban development and making optimal decisions to improve the quality of life of its residents.
SCI values are generalized assessments of citizens regarding the most relevant problems for them, such as housing affordability, the opportunity to get a decent job, the quality of the natural environment, the importance of technology in ensuring the quality of life, the acceptability of personal limitations caused by the use of AI technology, in particular personal identification and access technologies to personal data, etc.
SCI 2023 is calculated based on the Human Development Index (n.d.) at the city level, provided by The Global Data Lab (2022). Such a technique makes it possible to more accurately evaluate an individual city from a scientific point of view and makes a more transparent and meaningful comparison of quality of life indicators between different cities and with the general index. SCI 2023 standardizes the performance of the city with the average HDI of the city and the average value of people's perceptions (survey) about the quality and comfort of living in it. The Smart City Index is another attempt to measure the level and determine the dynamics of development in individual cities worldwide. It aims to facilitate comparative analysis and simplify the understanding of the impact of implementing innovative solutions to address key quality-of-life issues in these cities (IMD Smart City, 2023).
To test hypothesis H1: the level of development of a smart city depends on the number of its residents, a graphical analysis of the dependence of the value of city HDI 2023 (IMD Smart City, 2023) on the population was carried out for the top 20 smart cities according to the rating of city HDI in 2023 (World Population Review, 2024; Figure 1) and for 30, the largest in terms of population in 2023, smart cities of the world (Batra, 2025; Figure 2).
Figure 1
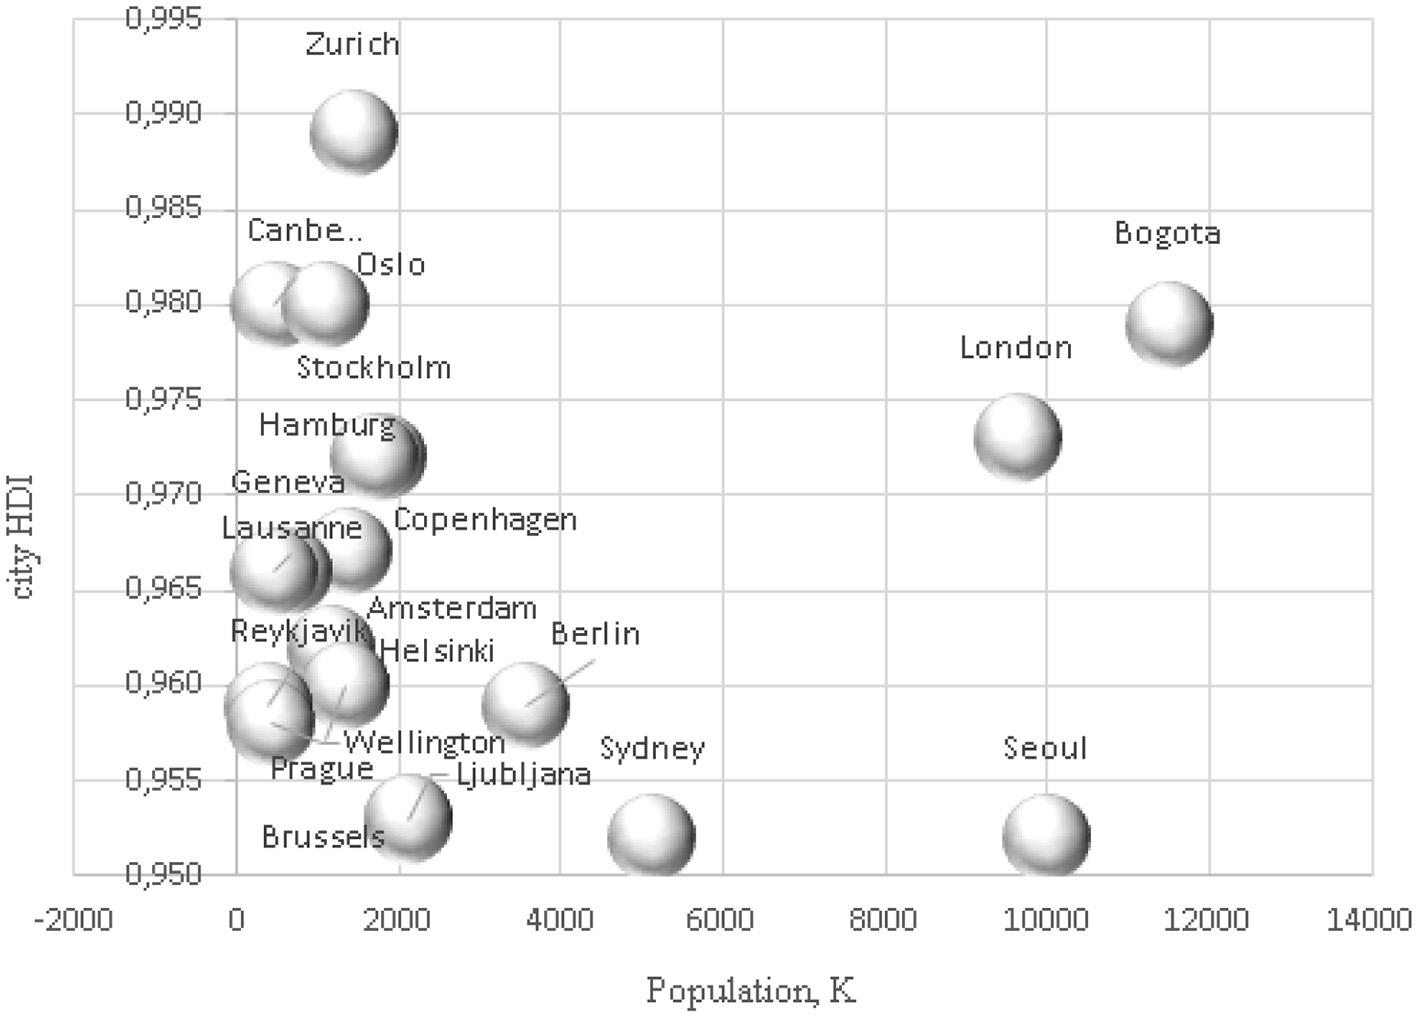
Bubble chart of dependence of city HDI on population in 2023 for the top 20 smart cities by city HDI rating, 2023.
Figure 2
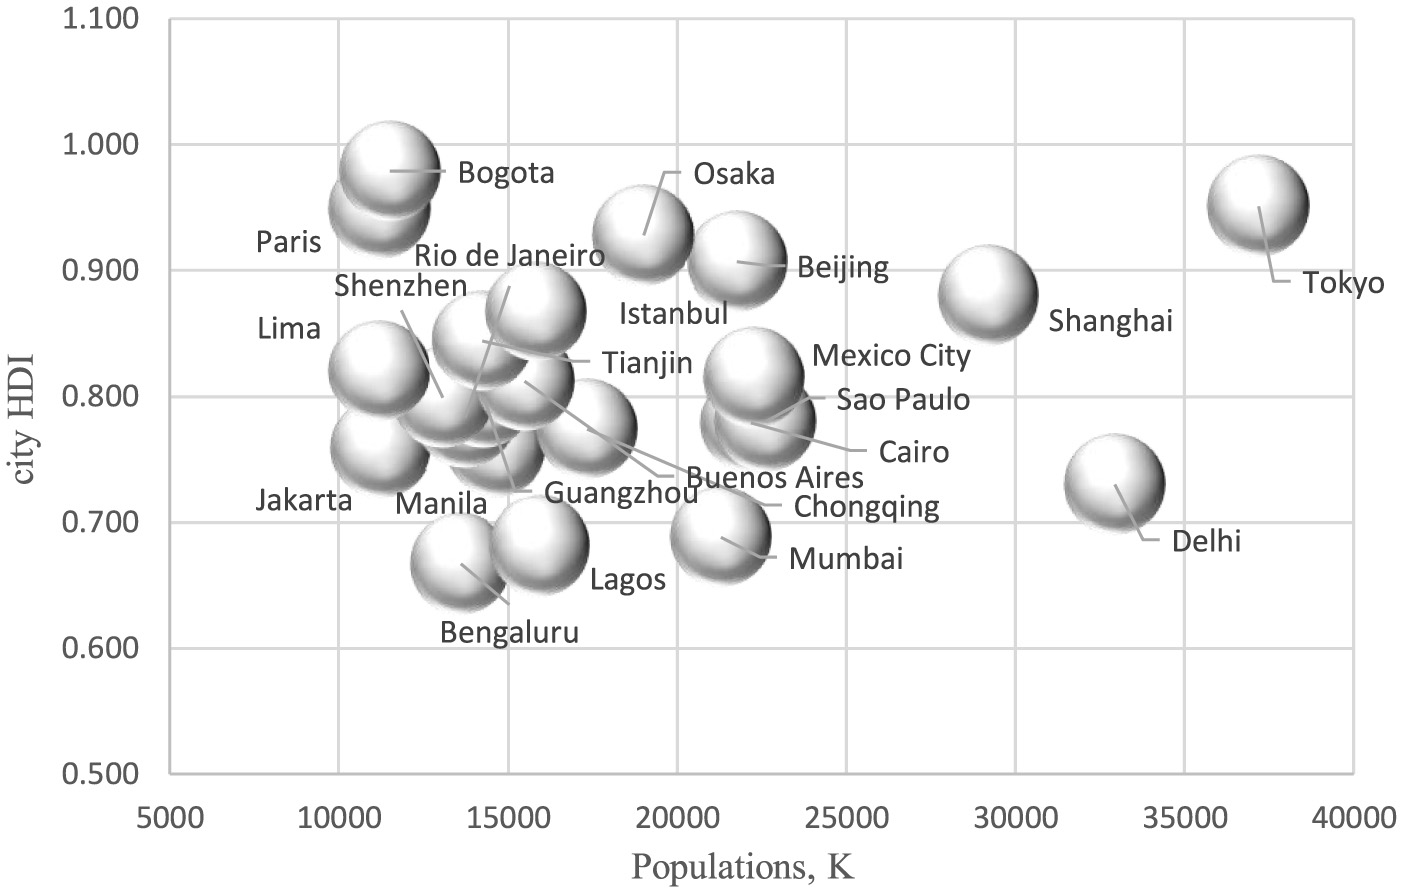
Bubble chart of dependence of city HDI 2023 on population for smart cities top 30 largest cities in the world by population in 2023.
Both Figures 1, 2 indicate the lack of dependence between the population and the level of sustainable development of smart cities.
To test the hypothesis about the exceptional role of digitalization in the development of smart cities, an empirical analysis was conducted based on official statistical data of HDI-city meters for 141 cities from 73 countries of the world (IMD Smart City, 2023). To identify the impact of each of the 54 indicators of sustainable development of a smart city selected for analysis on the quality and comfort of living, applied studies were conducted in the RapidMiner Studio environment (RapidMiner Documentation, n.d.). Fifteen of these indicators are subjective assessments of citizens regarding priority areas that they consider problematic for the prosperity of their city (Table 1). The higher the value of the corresponding indicator, the more % of residents consider this priority area problematic for ensuring their comfortable and safe living in their city. The remaining 39 indicators measure the level of technological development of the city according to the following structures and technologies: health and safety, mobility, activities, opportunities (work and school), governance, health, and safety.
Table 1
| Variable | Means | Variable | Means |
|---|---|---|---|
| afh | Affordable housing | pt | Public transport |
| arp | Air pollution | rdc | Road congestion |
| ba | Basic amenities | rec | Recycling |
| cen | Citizen engagement | sed | School education |
| cor | Corruption | sec | Security |
| fem | Fulfilling employment | smob | Social mobility |
| grs | Green spaces | unem | Unemployment |
| hs | Health services |
The variables that are presented in the priority areas for urban development.
This study reviewed data from 141 cities in 73 countries of the World. The following variables were used in the applied research:
-
1. The target variable
City HDI—Smart City Index.
The range of values of this indicator 0.521–0.898 was divided into two groups: high (city HDI > 0.751) and medium (city HDI ≤ 0.751).
-
2. Independent variables:
-
Assessments of the perceptions of residents on issues related to infrastructure and technology solutions available to them in their city (priority areas; Table 1).
-
The value of each of the above indicators is the % of respondents who chose this indicator as a priority direction, that is, they consider it problematic (one that needs improvement) in the sense of ensuring high-quality, comfortable living in their city.
-
Indicators reflecting the level of technological development of the city on structures and technologies under the following priority areas: health and safety, opportunities, governance mobility, and activities (Table 2; IMD Smart City, 2023).
Table 2
| Variable | Means | |
|---|---|---|
| Structures | ||
| Health and safety | bsn | Basic sanitation is affordable and addresses the requirements of the most economically disadvantaged areas |
| rss | Recycling services meet the necessary standards | |
| psp | There are no problems concerning public safety | |
| app | There are no problems concerning air pollution | |
| msps | The provision of medical services is satisfactory | |
| fh | Finding housing with a rent that amounts to 30% or less of a monthly salary poses no problem | |
| Mobility | tcp | There are no problems concerning traffic congestion |
| pts | Public transport is satisfactory | |
| Activities | gss | Green spaces correspond to satisfaction |
| ca | Cultural activities, including shows, bars, and museums are satisfactory | |
| Opportunities (work and school) | efs | Services for finding employment are accessible |
| cgs | The majority of children have the opportunity to attend a good school | |
| llo | Local institutions offer opportunities for lifelong learning | |
| bcj | New job creating are being generated by businesses | |
| mfw | Minorities feel a sense of welcome | |
| Governance | ilg | Accessing information about local government decisions is easy |
| cco | Corruption among city officials is not a cause for concern | |
| rcdm | Residents contribute to the decision-making processes of the local government | |
| rpf | Residents provide feedback on projects undertaken by the local government | |
| Technologies | ||
| Health and safety | ocmp | Utilizing online reporting for city maintenance problems leads to a prompt resolution |
| ware | A website or App that makes it easier for residents to give away unwanted items | |
| fpw | The availability of free public wifi has enhanced access to city services | |
| cctv | The presence of CCTV cameras has instilled a sense of safety among residents | |
| emp | A website or App that enables residents to monitor air pollution effectively | |
| ama | Arranging medical appointments online has enhanced accessibility to healthcare services | |
| Mobility | csa | The use of Car-sharing apps has alleviated traffic congestion |
| dap | Applications that direct you to an available parking space have decreased travel time | |
| bhr | The availability of bicycle hiring services has reduced congestion | |
| sts | The implementation of online scheduling and ticket sales has simplified the use of public transport | |
| pit | The city provides information on traffic congestion through mobile phones | |
| Activities | opt | The ability to purchase tickets to shows and museums online has simplified the attendance process |
| Opportunities (work and school) | acl | Online access to job listings has facilitated the process of finding employment |
| its | Schools effectively teach IT skills | |
| spcb | The online services provided by the city have streamlined the process of starting a new business | |
| cis | The current internet speed and reliability fulfill the connectivity requirements | |
| Governance | pacf | Public online access to city finances has contributed to a decrease in corruption |
| vip | The implementation of online voting has led to increased participation | |
| oprp | An online platform where residents can propose ideas that have enhanced the quality of city life | |
| pid | Processing identification documents online has resulted in a reduction in waiting times | |
Variables reflecting the level of technological development of the city.
We built the following machine-learning models with RapidMiner Studio (Yildirim, 2021; Poucke, 2020; Kovalchuk et al., 2023a) for predicting the HDI-city level and determining the most influential drivers associated with citizens' perception of comfort and quality of living in smart cities based on the analyzed indicators (Yildirim, 2021):
-
Naive Bayes Model: supervised machine learning algorithm for classification problems;
-
Generalized Linear Model (GLM): providing a flexible generalization of linear models for non-normal data;
-
Logistic Regression: a method for estimating the probability of categorical outcomes such as disease state or customer churn based on observed characteristics;
-
Fast Large Margin (FLM): a scalable approximate technique for max-margin classification related to SVMs;
-
Deep Learning: machine learning algorithms that use multiple layers of non-linear processing units to learn features and patterns from data;
-
Decision Tree: intuitive predictive models that recursively partition data to make predictions with simple decision rules;
-
Random Forest: an ensemble method that combines predictions from decorrelated decision trees to improve accuracy and avoid overfitting;
-
Gradient Boosted Trees: combining the predictive power of ensembles with gradient boosting to sequentially produce strong classification and regression trees;
-
Support Vector Machine (SVM): classifiers based on finding maximum margin decision boundaries.
The Naive Bayes algorithm relies on Bayes' theorem, which asserts that the likelihood of an event happening, given specific evidence, is directly proportional to the likelihood of the evidence occurring when the event has already taken place. This is multiplied by the prior probability of the event happening. The term “naive” is used because of the assumption that each feature being classified is independent of the other features. This simplification streamlines the model, enabling it to make classifications rapidly in comparison to more complex models.
In the Naive Bayes model, the computation of the probability that a data point X is a member of a class Y is performed as follows:
where: P(Y|X) is the posterior probability of class Y given predictor X, P(Y) is the prior probability of class Y, P(X|Y) is the likelihood of predictor X given class Y, P(X) is the prior probability of predictor X.
When categorizing a new data point, the algorithm computes the posterior probability for each class, and the data point is assigned to the class exhibiting the highest probability. Despite its straightforward nature, Naive Bayes frequently demonstrates commendable performance on real-world datasets. Particularly effective for categorical data and applications such as natural language processing, such as spam filtering, Naive Bayes stands out as a simple yet efficient classifier, often serving as a robust baseline model.
Generalized Linear Models (GLMs) represent an expansion of linear regression models, accommodating response variables with distributions that deviate from normality. Unlike linear regression, where the response variable is assumed to be continuously and normally distributed, GLMs relax this assumption. A GLM is comprised of three key elements:
-
Random Component: The response variable Y adheres to a distribution within the exponential family (e.g., binomial, Poisson, etc.).
-
Systematic Component: A linear function Xβ formed by the predictors.
-
Link Function: A link function g() establishes the connection between the expected value of the response E(Y) and the linear predictor Xβ.
The link function serves to convert the anticipated value of the response into the linear scale of the predictors. Standard link functions encompass the logit for binomial data and the log for count data. GLMs provide the flexibility to model non-normally distributed responses by selecting a suitable link function and exponential family distribution. Through this framework, they can effectively manage categorical, count, and other non-continuous responses. The estimation of GLMs involves the utilization of maximum likelihood, where the parameter estimates are determined by maximizing the likelihood of the observed response values given the predictors.
Logistic regression is employed to forecast binary or categorical results using predictor variables. It predicts the probability of an observation belonging to a specific category of the dependent variable. In the case of a binary outcome, logistic regression estimates P(Y = 1) as a function of x. To constrain probabilities within the range of 0 and 1, it utilizes the logistic sigmoid function, defined as:
where βx represents the linear component.
The estimation of β is conducted through maximum likelihood estimation. The coefficients hold an interpretation as the alteration in the log odds of the outcome for a one-unit change in X. Unlike linear regression, logistic regression does not presume a linear association between predictors and the dependent variable. Instead, it models the log odds as a linear function. Logistic regression demonstrates versatility by accommodating both numeric and categorical predictors. It does not necessitate the predictors to exhibit linear relationships or follow a normal distribution. This method is applicable for both predictive tasks and elucidating the relationship between dependent and independent variables. Additionally, extensions of binary logistic regression enable the modeling of multinomial outcomes encompassing more than two categories.
FLM is a supervised machine learning algorithm designed for binary classification, serving as an approximate implementation of SVMs. Its primary objective is to identify the maximum margin hyperplane that effectively separates the two classes. The hyperplane is strategically chosen to maximize the distance between the closest points belonging to the two classes, commonly referred to as the support vectors. Diverging from SVMs, which tackle a intricate quadratic programming problem, FLM employs an approximate optimization approach based on Fisher's Linear Discriminant.
In particular, FLM addresses the following optimization problem:
-
Maximize: Margin = (wTx+ + b) – (wTx− + b)
-
Subject to: yi(wTxi + b) ≥ 1 for all i.
Here, xi represents the training examples, yi denotes the labels, w stands for the normal vector to the hyperplane, and b is the offset term. The optimization objective can be effectively addressed using an iterative algorithm, enabling FLM to handle large datasets with efficiency. While the models generated by FLM may not precisely achieve maximum margin, they offer an approximation of the SVM solution while considerably reducing the training time. This algorithm proves valuable when seeking the generalization capabilities of SVMs for extensive datasets where training speed is a critical factor. It compromises some accuracy in favor of expedited training.
Deep learning belongs to the category of machine learning algorithms that leverage multiple layers of non-linear processing units to extract features and patterns from data. These layers are comprised of artificial neural networks, each executing a non-linear transformation on its input and forwarding the output to the subsequent layer. The lower layers focus on learning simple features, while the higher layers progressively grasp more intricate features by building upon the knowledge acquired from the previous layers. This hierarchical learning structure empowers deep learning models to discern complex concepts directly from raw data, such as identifying faces based on pixel values. Prominent architectures in deep learning encompass convolutional neural networks (CNNs) tailored for computer vision, recurrent neural networks (RNNs) suitable for sequence data like text or audio, and transformers applied to tasks like translation. The effectiveness of deep learning hinges on substantial labeled datasets and substantial computing power for training the multilayer models. Techniques like backpropagation and stochastic gradient descent are employed to iteratively adjust model weights and minimize a loss function. Key merits of deep learning encompass the capacity to directly learn feature representations from data, achieving state-of-the-art accuracy in tasks like image, text, and speech processing, and the ability for end-to-end learning without the need for manually crafted features. Deep learning is the driving force behind various contemporary AI applications, ranging from image recognition to language translation and synthesis. However, it comes with the drawback of being computationally expensive for training and tuning.
Decision trees construct a predictive model for a target variable by acquiring simple decision rules from the features present in the data. Through a process known as recursive partitioning, the dataset is repeatedly divided based on the feature that yields the maximum information gain at each split. In this structure, each internal node corresponds to a feature, while each leaf node signifies a prediction, whether in classification or regression. Notable algorithms for crafting decision trees include ID3, C4.5, CART, and CHAID, each employing distinct approaches to measure information gain. The merits of decision trees encompass interpretability, the capability to handle categorical features, address non-linear relationships, and necessitate minimal data preprocessing. However, challenges arise, such as the propensity for overfitting, instability, and the generation of biased trees for imbalanced datasets. These issues can be mitigated through techniques like regularization, pruning, and the application of ensemble methods. Decision trees find common applications in tasks like classification, fraud detection, and customer segmentation. They serve as the foundation for random forests, a highly popular and potent ensemble method.
Random forest stands as an ensemble-supervised learning technique applicable to both classification and regression tasks. Its operation involves the creation of numerous decision trees during the training phase. For each tree, a random subset of the data is employed, and nodes are split utilizing the optimal features derived from a random subset of features. The final prediction is formed by averaging the predictions generated by each constituent decision tree. Random forests effectively counteract the overfitting tendency of decision trees. By leveraging bootstrapped training samples and feature subsets across many trees, overfitting is mitigated. The introduction of randomization fosters decorrelation between individual trees, diminishing variance and enhancing generalizability. Tuning parameters for random forests encompass drivers like the number of trees (more being advantageous but computationally expensive) and the number of features contemplated at each split (with the default being the square root of the total features).
The advantages of random forests encompass their adeptness at handling non-linear relationships, achieving high predictive accuracy, and robustness to noise. They prove beneficial for both classification and regression endeavors. Nonetheless, drawbacks include a potential for overfitting when dealing with noisy data and a lack of interpretability in the resulting model.
Gradient boosted trees represent an ensemble machine learning approach that amalgamates multiple decision tree models to enhance accuracy and stability. The mechanism involves the sequential addition of new decision tree models, each predicting the residuals or errors of preceding trees. This sequential process boosts the overall model by iteratively reducing loss, aiding in the correction of biases in the data not captured by earlier trees. The amalgamation of numerous weaker base learners with high bias contributes to the formation of a robust overall model. The addition of trees occurs in a stage-wise manner through an optimization procedure that minimizes a loss function by learning from the negative gradient. Common loss functions include squared error for regression tasks and log loss for classification tasks. Hyperparameters for fine-tuning include the number of trees, tree depth, learning rate, and subsample rate for stochastic boosting.
Boosted trees boast advantages such as high predictive accuracy, inherent feature selection capabilities, and adaptability for both regression and classification tasks. However, drawbacks include a lengthier training time compared to random forests and a tendency to exhibit some degree of overfitting when contrasted with bagging methods.
Support Vector Machines (SVMs) serve as supervised learning models applicable to both classification and regression analyses. The primary objective of SVMs is to identify the maximum margin hyperplane that most effectively delineates two classes within the training dataset. By maximizing the margin distance, SVMs enhance the classification confidence for future data points. The foundation of SVMs lies in decision planes, which establish the boundaries for decision-making. These planes distinctly separate objects with different class memberships. The process of determining the maximum margin hyperplane involves solving a quadratic programming optimization problem, yielding support vectors that define the hyperplane. In instances where data lacks linear separability, SVMs employ a kernel trick to map data to a higher dimension. This strategic approach enables the identification of a hyperplane that optimally segregates the classes. Commonly utilized kernels encompass linear, polynomial, and radial basis function kernels. SVMs demonstrate efficacy in high-dimensional spaces and provide flexibility in selecting kernel functions. However, challenges include heightened algorithmic complexity and substantial memory requirements, particularly for extensive datasets.
The most straightforward method for assessing a binary classification model is by examining its overall accuracy, which represents the percentage of correctly classified samples. Accuracy is computed by dividing the number of correct predictions by the total number of predictions:
In binary classification, accuracy can also be computed using the metrics of true positives, true negatives, false positives, and false negatives:
where TP—True Positives, TN—True Negatives, FP—False Positives, FN—False Negatives.
Precision quantifies the percentage of positive predictions that are accurately correct:
Recall (or sensitivity) gauges the percentage of actual positive cases that are accurately predicted as positive:
Specificity assesses the percentage of negative cases that are accurately predicted as negative:
The F-measure strikes a balance between precision and recall in the overall score. It attains its optimal value at 1 and deteriorates toward 0 in less favorable scenarios.
ROC (Receiver Operating Characteristic) curves serve as a visual tool for assessing and comparing the effectiveness of binary classification models. Here are some key points about ROC curves:
The area under the ROC curve (AUC) serves as a comprehensive measure of model performance across all feasible classification thresholds.
A perfect classifier achieves an AUC of 1, while a random classifier attains an AUC of 0.5.
ROC analysis offers tools to choose optimal models and classification thresholds by considering tradeoffs between true positives and false positives.
ROC curves facilitate the comparison of multiple models to identify which one exhibits the best discrimination ability, with the ideal model being closest to the top-left corner.
Key evaluation metrics for classification models include accuracy, precision, recall, specificity, F-measure, and ROC analysis. Optimization of these metrics leads to models that provide reliable predictions for the target classes.
4 Results
Table 3 presents the distribution of smart cities from the analyzed data set by levels of sustainable development (high and medium). Out of 141 cities, 121 have a high level of city HDI. Therefore, residents of the vast majority of analyzed cities highly appreciate the quality and comfort of living in their city.
Table 3
| Value | Count | Percentage |
|---|---|---|
| High | 121 | 85,82% |
| Medium | 20 | 14,18% |
Distribution of smart cities by levels of sustainable development.
Among the created models, the highest accuracy (97.5%) is demonstrated by Fast Large Margin (Figure 3).
Figure 3
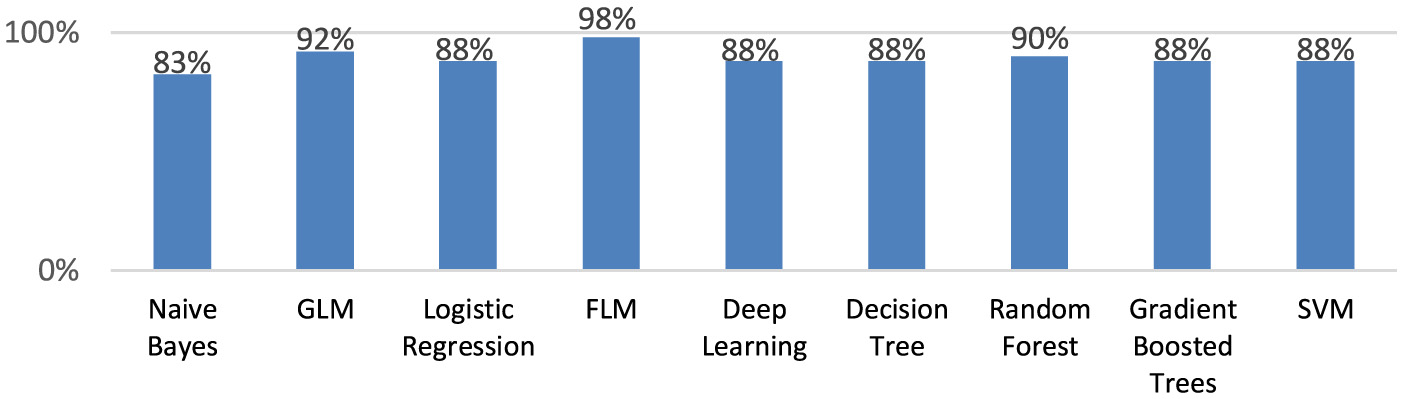
The accuracy of the created machine learning models.
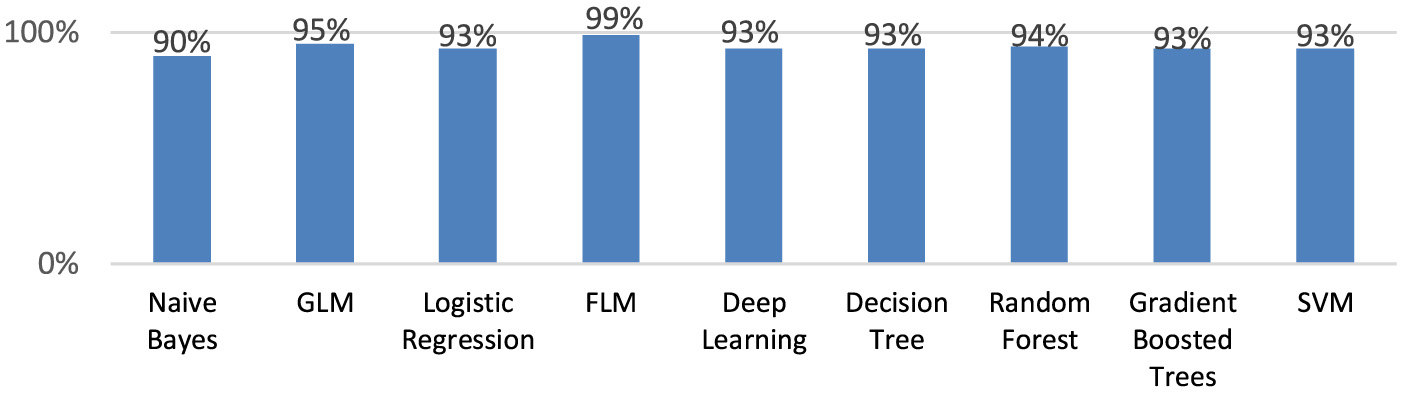
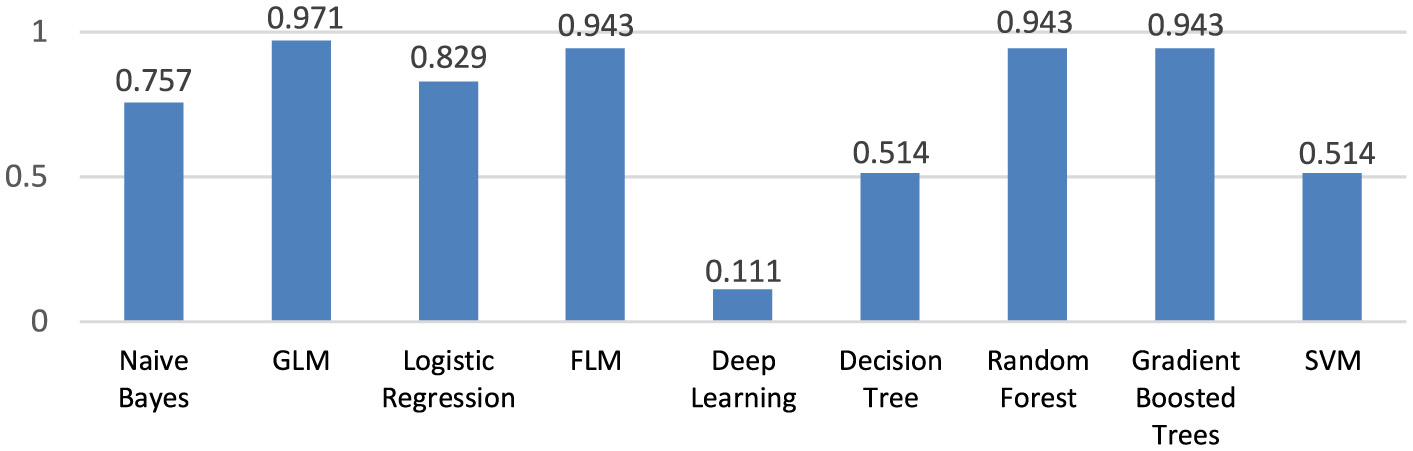
Figure 4 shows, that the precision is the highest for the Fast Large Margin model (97.5%).
Figure 4
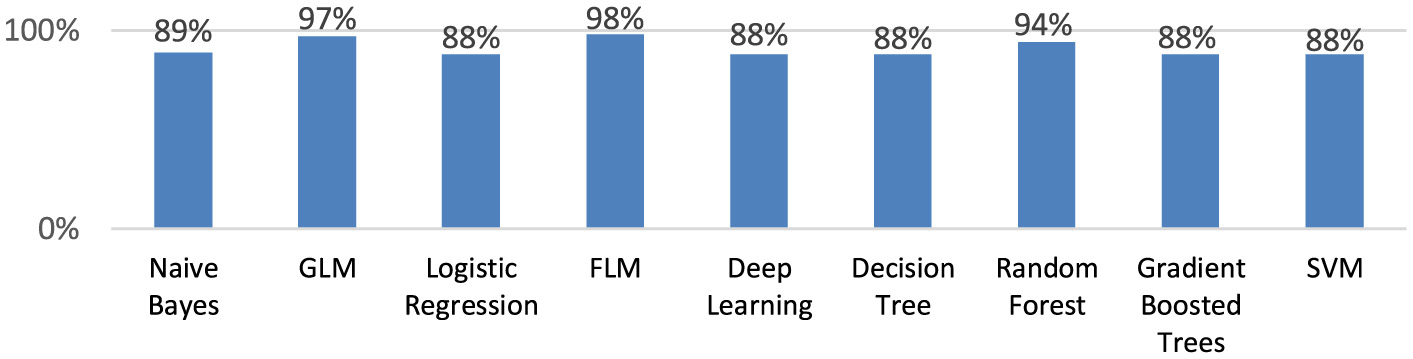
The precision of the created machine learning models.
As can be seen from Figure 5, the recall is the highest (100.0%) for the following models: Fast Large Margin, Logistic Regression, Deep Learning, Decision Tree, Support Vector Machine.
Figure 5
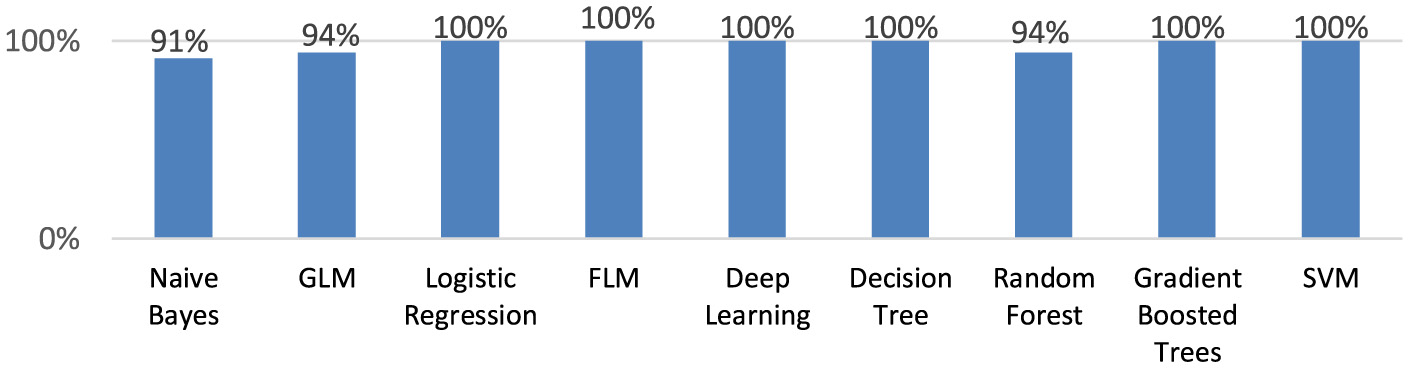
The recall for the created machine learning models.
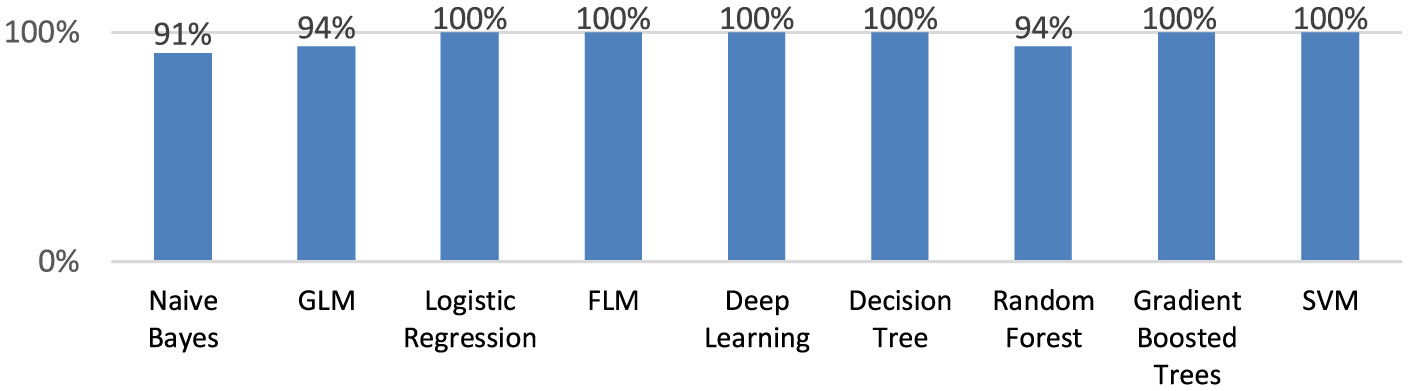
The highest F measure (98.7%) also demonstrated by the Fast Large Margin model (Figure 6).
Figure 6
The F measure for the created machine learning models.
All models besides the Naive Bayes model, GLM, and Random Forest model have the highest specificity (100.0%; Figure 7).
Figure 7
The sensitivity of the created machine learning models.
Fast Large Margin, and Generalized Linear Model have the highest specificity (80.0%; Figure 8).
Figure 8
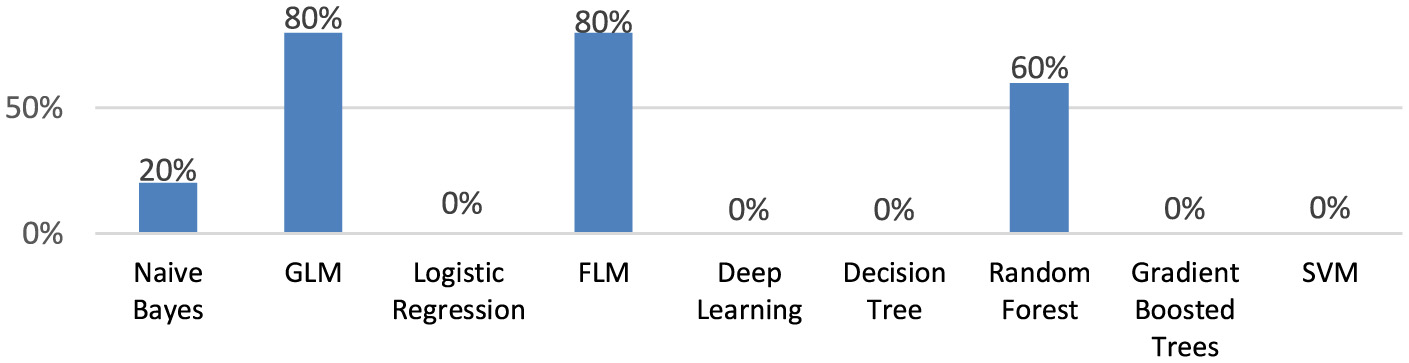
The specificity of the created machine learning models.
The highest AUC measure (0.97%) has Generalized Linear Model. For the Fast Large Margin model AUC = 0.94 (Figure 9).
Figure 9
The AUC of the created machine learning models.
As can be seen from Table 4, the optimal model for the prediction levels of HDI cities is the Fast Large Margin model.
Table 4
| Model | Accuracy (%) | Precision (%) | Recall (%) | F measure (%) | Sensitivity (%) | Specificity (%) | AUC |
|---|---|---|---|---|---|---|---|
| Naive Bayes | 82.5 | 89.3 | 91.4 | 90.1 | 91.4 | 20.0 | 0.76 |
| Generalized Linear Model | 92.4 | 97.1 | 93.8 | 95.3 | 93.8 | 80.0 | 0.97 |
| Logistic Regression | 87.5 | 87.5 | 100.0 | 93.3 | 100.0 | 0.0 | 0.83 |
| Fast Large Margin | 97.5 | 97.5 | 100.0 | 98.7 | 100.0 | 80.0 | 0.94 |
| Deep Learning | 87.5 | 87.5 | 100.0 | 93.3 | 100.0 | 0.0 | 0.11 |
| Decision Tree | 87.5 | 87.5 | 100.0 | 93.3 | 100.0 | 0.0 | 0.51 |
| Random Forest | 90.0 | 94.0 | 94.3 | 94.1 | 94.3 | 60.0 | 0.94 |
| Gradient Boosted Trees | 87.5 | 87.5 | 94.3 | 93.3 | 100.0 | 0.0 | 0.94 |
| Support Vector Machine | 87.5 | 87.5 | 100.0 | 93.3 | 100.0 | 0.0 | 0.51 |
Comparison evaluation tables for creating machine learning models.
The high efficiency of the Fast Large Margin model is associated with its unique algorithmic characteristics of hyperplane optimization in a multidimensional feature space. The model employs complex structural risk minimization mechanisms, enabling non-linear classification with high accuracy by non-linearly mapping input data into a higher-dimensional space. The technical advantage of the method lies in its ability to effectively solve optimization problems with a large number of features through empirical risk minimization, efficient regularization to prevent overfitting, and the use of kernel functions for non-linear feature space transformation. The mathematical apparatus of the model allows working with high-dimensional data, where traditional linear classifiers demonstrate low efficiency, ensuring robust generalization when classifying complex non-linear dependencies.
Table 5 presents the confusion matrix. It is used to evaluate the performance of a classification model and summarizes how well a model correctly or incorrectly predicts different classes. The Fast Large Margin model characterized of the high estimation of the precision, and recall.
Table 5
| Title 1 | True 2 | True 1 | Class precision |
|---|---|---|---|
| pred minimum | 4 | 0 | 100.00% |
| pred high | 1 | 35 | 97.20% |
| Class recall | 80.00% | 100.00% |
Confusion matrix for the Fast Large Margin model.
Figure 10 confirms the obtained results.
Figure 10
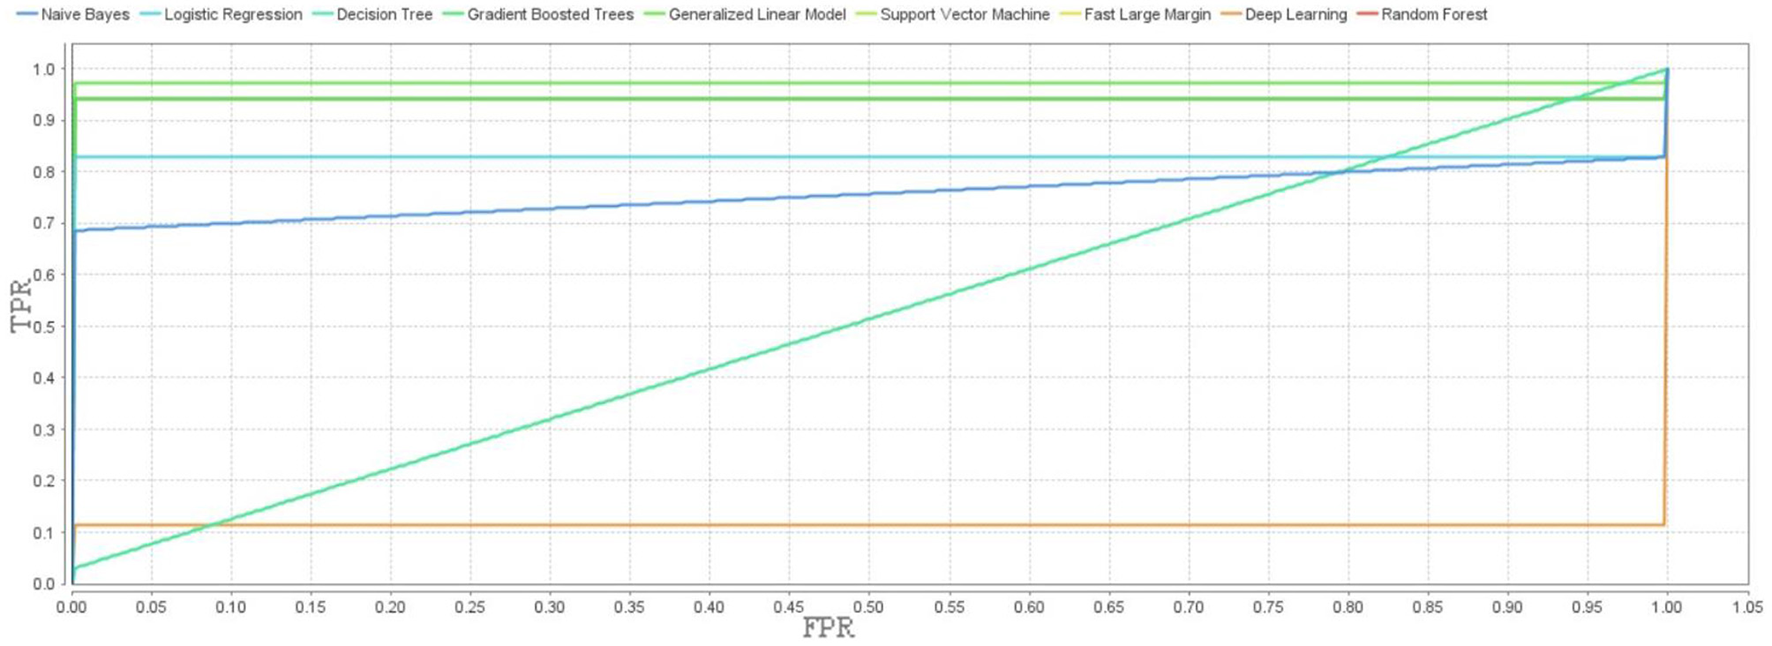
The ROC curves for the created machine learning models.
The Fast Large Margin has the best accuracy, precision, recall, specificity, and F-measure scores among all other built models. This model optimized all metrics that can reliably predict the target classes.
As can be seen from Figure 11, the variables arp—air pollution (0.132), rec—recycling (0.108), ba—basic amenities (0.105), hs—health services (0.074), rcdm—residents contribute to the decision-making processes of the local government (0.072), cis—the current internet speed and reliability fulfill the connectivity requirements (0.072) make the greatest contribution to the distribution of smart cities to the middle or high HDI level. The variables fem (fulfilling employment) and ocmp (utilizing online reporting for city maintenance problems leads to a prompt resolution) do not influence the city HDI level, so they were not included in the constructed model.
Figure 11
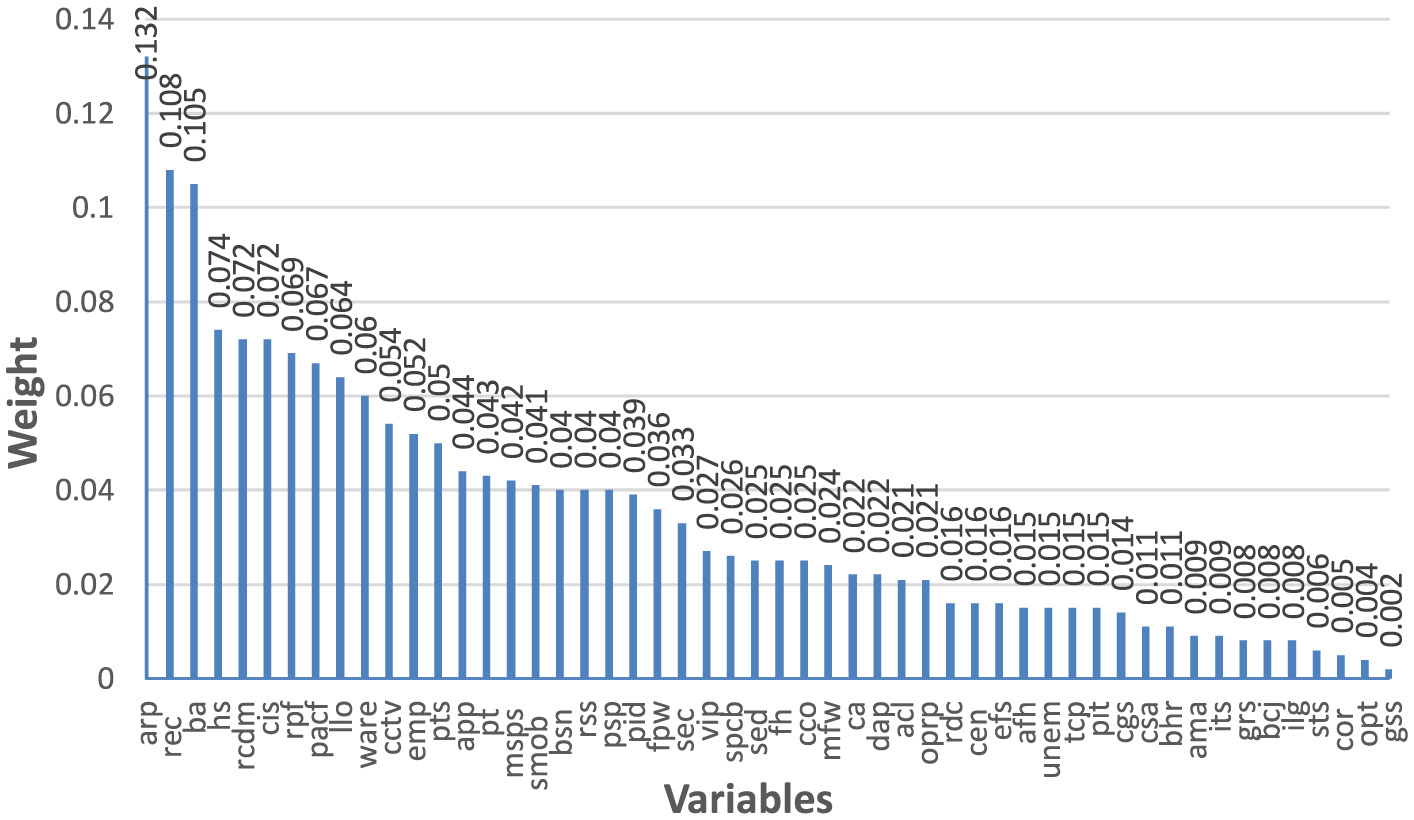
Weights by correlation.
The Lift Chart explains the obvious advantage of using the Fast Large Margin model for predicting the HDI level (Figure 12).
Figure 12
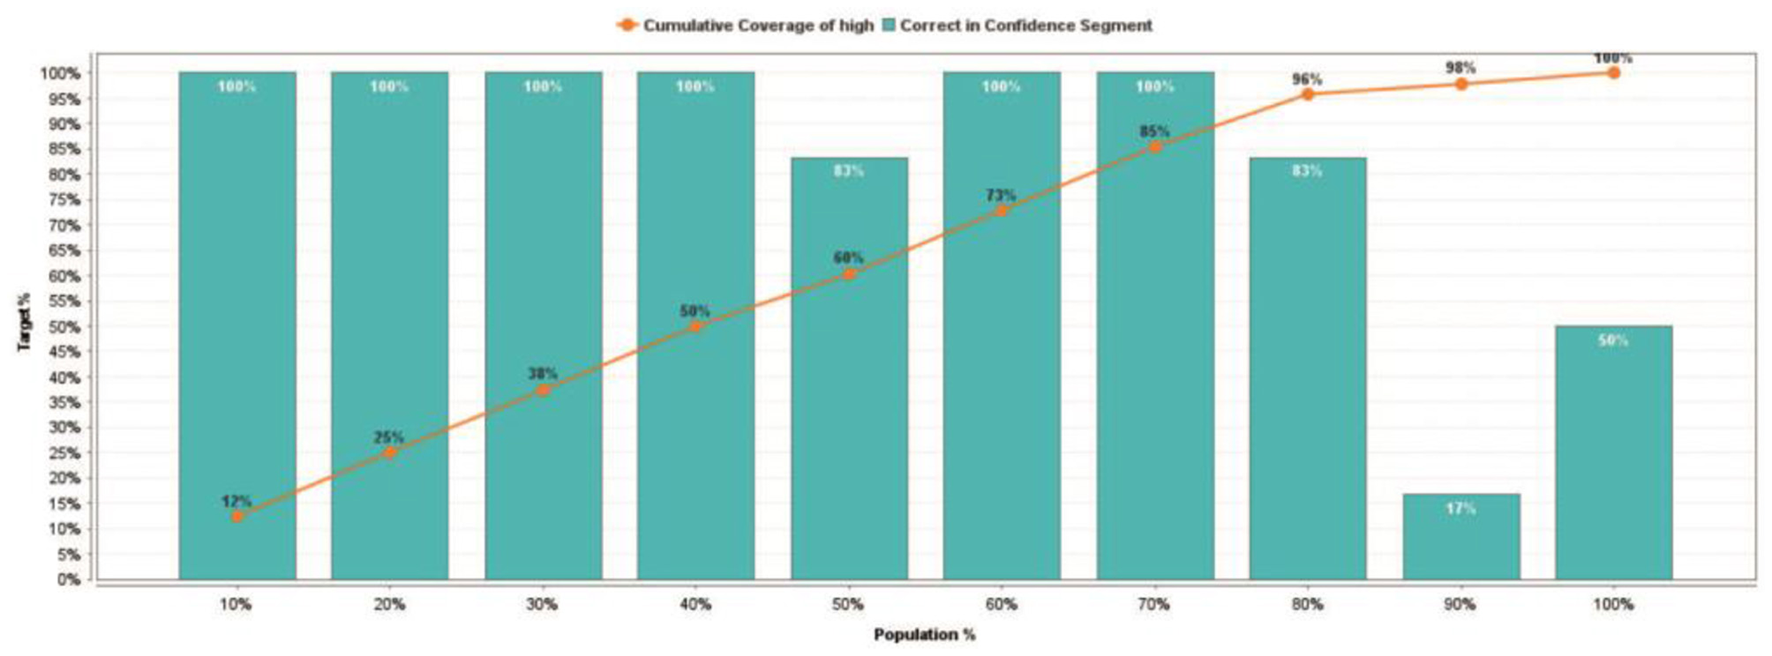
Lift chart for the Fast Large Margin model.
The created Fast Large Margin model predicted a 91% probability of the world's smart cities belonging to a high level of HDI (Figure 13).
Figure 13
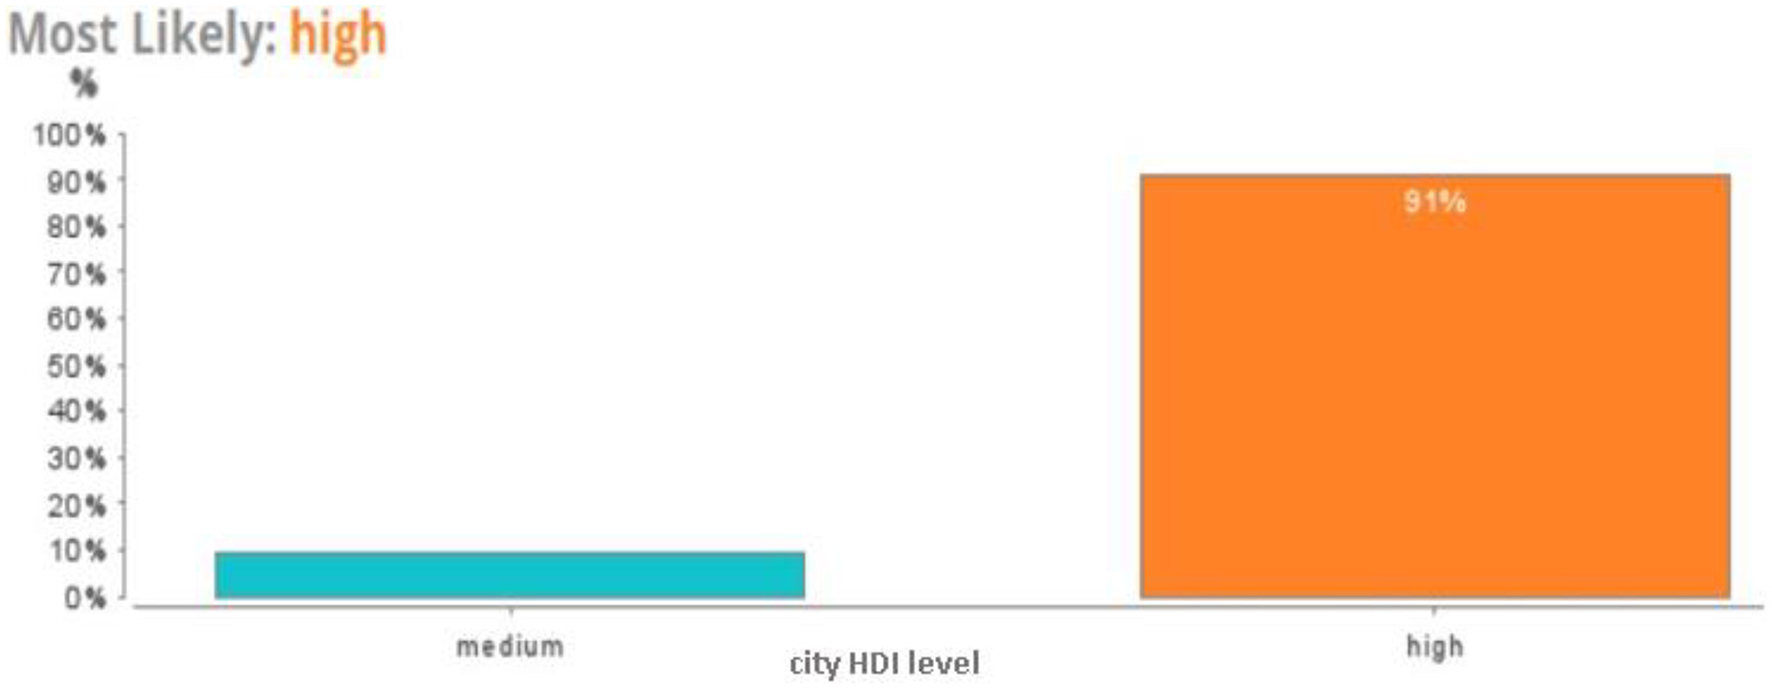
Lift chart for the Fast Large Margin model.
For the smart cities from the dataset, the probability of city HDI level was determined (Table 6).
Table 6
| City | City HDI | Predictions city HDI | Confidence medium | Confidence high |
|---|---|---|---|---|
| 1 | Medium | Medium | 0.943 | 0.057 |
| 2 | Medium | Medium | 0.956 | 0.044 |
| 3 | Medium | Medium | 0.647 | 0.353 |
| 4 | Medium | High | 0.097 | 0.903 |
| 5 | Medium | Medium | 0.885 | 0.115 |
| 6 | Medium | Medium | 0.596 | 0.404 |
| 7 | Medium | Medium | 0.776 | 0.224 |
| 8 | Medium | Medium | 0.598 | 0.402 |
| 9 | High | Medium | 0.963 | 0.037 |
| 10 | High | High | 0.063 | 0.937 |
| 11 | High | High | 0.071 | 0.929 |
| 12 | High | High | 0.143 | 0.857 |
| 13 | High | High | 0.137 | 0.863 |
| 14 | High | High | 0.137 | 0.863 |
| 15 | High | High | 0.156 | 0.844 |
| 16 | High | Medium | 0.724 | 0.276 |
| 17 | High | High | 0.049 | 0.951 |
| 18 | High | High | 0.285 | 0.715 |
| 19 | High | High | 0.134 | 0.866 |
| 20 | High | High | 0.260 | 0.740 |
| 21 | High | High | 0.080 | 0.920 |
| 22 | High | High | 0.106 | 0.894 |
| 23 | High | High | 0.142 | 0.858 |
| 24 | High | High | 0.083 | 0.917 |
| 25 | High | High | 0.055 | 0.945 |
| 26 | High | High | 0.057 | 0.943 |
| 27 | High | High | 0.143 | 0.857 |
| 28 | High | High | 0.139 | 0.861 |
| 29 | High | High | 0.118 | 0.882 |
| 30 | High | High | 0.137 | 0.863 |
| 31 | High | High | 0.066 | 0.934 |
| 32 | High | High | 0.095 | 0.905 |
| 33 | High | High | 0.070 | 0.930 |
| 34 | High | High | 0.087 | 0.913 |
| 35 | High | High | 0.051 | 0.949 |
| 36 | High | High | 0.105 | 0.895 |
| 37 | High | High | 0.052 | 0.948 |
| 38 | High | High | 0.061 | 0.939 |
| 39 | High | High | 0.100 | 0.900 |
| 40 | High | High | 0.132 | 0.868 |
| 41 | High | High | 0.102 | 0.898 |
| 42 | High | High | 0.080 | 0.920 |
| 43 | High | High | 0.080 | 0.920 |
| 44 | High | High | 0.070 | 0.930 |
| 45 | High | High | 0.061 | 0.939 |
| 46 | High | High | 0.071 | 0.929 |
| 47 | High | High | 0.116 | 0.884 |
| 48 | High | High | 0.089 | 0.911 |
| 49 | High | High | 0.071 | 0.929 |
| 50 | High | High | 0.077 | 0.923 |
| 51 | High | High | 0.104 | 0.896 |
| 52 | High | High | 0.089 | 0.911 |
| 53 | High | High | 0.072 | 0.928 |
| 54 | High | High | 0.093 | 0.907 |
| 55 | High | High | 0.078 | 0.922 |
| 56 | High | High | 0.072 | 0.928 |
Predictions of the Fast Large Margin model.
With the help of the built Fast Large Margin model simulator, you can determine the city HDI level for countries that are not included in the 2023 rating based on the corresponding values of the indicators included in the built model and calculate the optimal parameters of the model according to the specified restrictions.
5 Discussion
Based on a unique data set consisting of city HDI values and 54 main indicators of sustainable development for 141 smart cities from 73 countries of the world, we conducted an empirical analysis to determine the main drivers that influence the feeling of life satisfaction of the residents of these cities. All analyzed cities are classified by city HDI levels (high and medium). The vast majority of cities included in the HDI-city SCI 2023 rating have a high level of sustainable development of smart cities. Living in these cities makes their residents feel comfort, quality, and life satisfaction.
The falsity of hypothesis H1 about the dependence of the level of development of a smart city on the number of its inhabitants was confirmed using graphic analysis. Large cities may be developed in areas of the latest IT, but they are inferior to the quality of the natural environment and the comfort of living in a metropolis. Residents of smart cities do not rate them as safe and suitable for a happy life in the city.
To test hypothesis H2 about the exclusive role of information technologies in the formation of a smart city as a vector of global sustainable development, a set of the following machine-learning models was built: Naive Bayes, Generalized Linear, Logistic Regression, Fast Large Margin, Deep Learning, Decision Tree, Random Forest, Gradient Boosted Trees, and Support Vector Machine. The obtained models were compared. Empirical results were obtained using Rapid Miner Studio. It was established that the optimal model for forecasting the level of sustainable development of a smart city is the Fast Large Margin model (Poucke, 2020). To prevent model overfitting, we used the L2 regularization technique, which allowed us to control prediction errors. The error analysis showed that 2.5% of predictions deviate from the actual city HDI level, primarily in borderline cases between medium and high development stages. Most errors have a normal distribution within ±0.05 on the HDI scale, indicating high model stability and its ability to accurately predict city development levels with minimal deviations.
Using this model, the influence of each of the 54 analyzed indicators of sustainable development of smart cities on quality and comfortable living was determined (Table 7). All indicators are subjective assessments of city residents in the following categories: priority areas that they consider problematic for the prosperity of their city; structures (health and safety, mobility, activities, opportunities (work and school), governance), and technologies: (health and safety, mobility, activities, opportunities (work and school), governance). The variables fem and ocmp turned out to be insignificant and did not enter the constructed model. Therefore, the majority of residents from 141 cities do not consider priority areas fulfilling employment a problem for the sustainable development of their smart cities. Also, utilizing online reporting for city maintenance problems leads to a prompt resolution (technologies in health and safety) and does not affect the comfort and quality of living in smart cities.
Table 7
| No. | Variable | Means | Category |
|---|---|---|---|
| 1 | arp | Air pollution | Priority areas |
| 2 | rec | Recycling | Priority areas |
| 3 | ba | Basic amenities | Priority areas |
| 4 | hs | Health services | Priority areas |
| 5 | rcdm | Residents contribute to the decision-making processes of the local government | Governance (structures) |
| 6 | cis | The current internet speed and reliability fulfill the connectivity requirements | Opportunities: work and school (technologies) |
| 7 | rpf | Residents provide feedback on projects undertaken by the local government | Governance (structure) |
| 8 | pacf | Public online access to city finances has contributed to a decrease in corruption | Governance (technologies) |
| 9 | llo | Local institutions offer opportunities for lifelong learning | Opportunities: work and school (structures) |
| 10 | ware | A website or App that makes it easier for residents to give away unwanted items | Health and safety (technologies) |
| 11 | cctv | The presence of CCTV cameras has instilled a sense of safety among residents | Health and safety (technologies) |
| 12 | emp | A website or App that enables residents to monitor air pollution effectively | Health and safety (technologies) |
| 13 | pts | Public transport is satisfactory | Mobility (structures) |
| 14 | app | There are no problems concerning air pollution | Health and safety (structures) |
| 15 | pt | Public transport | Priority areas |
| 16 | msps | The provision of medical services is satisfactory | Health and safety (structures) |
| 17 | smob | Social mobility | Priority areas |
| 18 | bsn | Basic sanitation is affordable and addresses the requirements of the most economically disadvantaged areas | Health and safety (structures) |
| 19 | rss | Recycling services meet the necessary standards | Health and safety (structures) |
| 20 | psp | There are no problems concerning public safety | Health and safety (structures) |
| 21 | pid | Processing identification documents online has resulted in a reduction in waiting times | Governance (technologies) |
| 22 | fpw | The availability of free public WiFi has enhanced access to city services | Health and safety (technologies) |
| 23 | sec | Security | Priority areas |
| 24 | vip | The implementation of online voting has led to increased participation | Governance (technologies) |
| 25 | spcb | The online services provided by the city have streamlined the process of starting a new business | Opportunities: work and school (technologies) |
| 26 | sed | School education | Priority areas |
| 27 | fh | Finding housing with a rent that amounts to 30% or less of a monthly salary poses no problem | Health and safety (structures) |
| 28 | cco | Corruption among city officials is not a cause for concern | Governance (structures) |
| 29 | mfw | Minorities feel a sense of welcome | Opportunities: work and school (structures) |
| 30 | ca | Cultural activities, including shows, bars, and museums are satisfactory | Activities (structures) |
| 31 | dap | Applications that direct you to an available parking space have decreased travel time | Mobility (technologies) |
| 32 | acl | Online access to job listings has facilitated the process of finding employment | Opportunities: work and school (technologies) |
| 33 | oprp | An online platform where residents can propose ideas that have enhanced the quality of city life | Governance (technologies) |
| 34 | rdc | Road congestion | Priority areas |
| 35 | cen | Citizen engagement | Priority areas |
| 36 | efs | Services for finding employment are accessible | Opportunities: work and school (structures) |
| 37 | afh | Affordable housing | Priority areas |
| 38 | unem | Unemployment | Priority areas |
| 39 | tcp | There are no problems concerning traffic congestion | Mobility (structures) |
| 40 | pit | The city provides information on traffic congestion through mobile phones | Mobility (technologies) |
| 41 | cgs | The majority of children have the opportunity to attend a good school | Opportunities: work and school (structures) |
| 42 | csa | The use of Car-sharing apps has alleviated traffic congestion | Mobility (technologies) |
| 43 | bhr | The availability of bicycle hiring services has reduced congestion | Mobility (technologies) |
| 44 | ama | Arranging medical appointments online has enhanced accessibility to healthcare services | Health and safety (technologies) |
| 45 | its | Schools effectively teach IT skills | Opportunities: work and school (technologies) |
| 46 | grs | Green spaces | Priority areas |
| 47 | bcj | New job creating are being generated by businesses | Opportunities: work and school (structures) |
| 48 | ilg | Accessing information about local government decisions is easy | Governance (structures) |
| 49 | sts | The implementation of online scheduling and ticket sales has simplified the use of public transport | Mobility (technologies) |
| 50 | cor | Corruption | Priority areas |
| 51 | opt | The ability to purchase tickets to shows and museums online has simplified the attendance process | Activities (technologies) |
| 52 | gss | Green spaces correspond to satisfaction | Activities (structures) |
Independent variables are included in Fast Large Margin, by weight rating.
Priority areas, which they consider to be the most problematic for the development of a smart city, exert the greatest influence on the formation of a feeling of comfort and satisfaction with living in the city. The top 4 most influential drivers include air pollution, recycling, basic amenities, and health services. Therefore, the inhabitants of smart cities first all value a safe natural environment, comfortable living conditions, and safety for their health. This fact can be explained by the fact that most smart cities are metropolises with a high level of air pollution, which is 5th in the list of important to self-government. The majority of respondents want to take a direct part in solving important problems in their city. None of the top 5 drivers of sustainable development of a smart city is related to digitalization. Therefore, the hypothesis that the concept of a smart city is based exclusively or mainly on the application of information technologies to improve the quality of life of residents is confirmed to be false.
The top 20 most important drivers affecting the city HDI included only 5 associated with technologies: the current internet speed and reliability fulfill the connectivity requirements, public online access to city finances has contributed to a decrease in corruption, a website or App that makes it easier for residents to give away unwanted items, the presence of CCTV cameras has instilled a sense of safety among residents, a website or App that enables residents to monitor air pollution effectively. Moreover, the last 3 of them relate to the field of health and safety. Residents of modern cities prefer residential security over IT innovation.
However, artificial intelligence and IoT technologies can radically transform social justice in urban environments, creating both new opportunities and hidden risks of inequality. Algorithms may automatically reinforce discriminatory patterns in the distribution of urban resources, allocation of social services, or urban infrastructure planning, leading to deepening social gaps between different population groups. IoT technologies can create a total surveillance space where residents' data becomes a commodity, and privacy becomes conditional, which is particularly critical for marginalized communities with fewer opportunities to resist technological monitoring. At the same time, these same technologies can provide more equitable access to urban services, optimize resource distribution, and create more transparent communication mechanisms between authorities and residents, but only under conditions of ethical and balanced implementation.
The following indicators turned out to be the least important for determining the city HDI: accessing information about local government decisions is easy (governance, structures), the implementation of online scheduling and ticket sales has simplified the use of public transport (mobility, technologies), corruption (priority area), the ability to purchase tickets to shows and museums online has simplified the attendance process (activities, technologies), green spaces correspond to satisfaction (activities, structures). This list includes two drivers from the “technologies” category, which once again confirms that the level of IT implementation is not a determining factor for the life satisfaction of residents of smart cities. An interesting fact is that corruption is the third from the bottom in the ranking of significant drivers of the city HDI. Residents of smart cities do not feel threatened by this phenomenon for the sustainable development of their cities.
Besides, cultural, economic, and political differences between the studied cities can create unique contexts that influence residents' perception of quality of life and the effectiveness of urban technologies. Different socio-economic conditions, such as income levels, employment structures, and social inequalities, can shape urban residents' expectations about the urban environment in various ways. Political systems and the level of democratic participation in different countries can significantly impact how people evaluate governance and opportunities to influence urban processes. Cultural features, including attitudes toward technology, collective interaction, and development priorities, can explain the variability in the perception of different aspects of a “smart city.” Moreover, cities with a more developed culture of technological innovation might evaluate the role of digital solutions differently compared to cities with a more traditional way of life.
Thus, city planners and policymakers should focus on addressing the core issues residents face in urban life. While technological innovations are important, they are secondary to the fundamental aspects of quality of life. In particular, leaders should prioritize reducing air pollution, improving waste recycling systems, ensuring access to basic services, and enhancing healthcare. Citizen engagement is crucial, as residents seek active participation in local decision-making processes. This means that policymakers should develop more transparent and interactive governance models that enable citizens to directly influence urban development strategies. Although smart city technologies can be beneficial, they should be implemented as supportive tools to meet real human needs rather than as an end in themselves. Our research highlights the importance of a comprehensive approach to urban development that prioritizes human experience and environmental quality over purely technological solutions. City leaders should view technology as a means to enhance quality of life, not as the primary goal of urban transformation.
This result can be the subject of our further research. In the future, we plan to investigate the relationship between city HDI and country HDI for the analyzed cities. Also, a promising direction is the development of applied models for the study of the impact of measuring devices of various security aspects of the countries of the world (Kovalchuk et al., 2023a,b, 2022; Kovalchuk and Berezka, 2022; Berezka and Kovalchuk, 2019) on the sustainable development of smart cities.
The results obtained in this work they can provide important relevant information to decision-makers regarding important drivers of residents' perception of comfort and quality of living in smart cities. Also, the obtained conclusions can become the basis for the development of effective strategies for the sustainable development of smart cities and digitalization policy.
6 Conclusions
Based on the study of 141 smart cities from 73 countries around the world, it was established that the main drivers influencing the feeling of comfort and quality of life among smart city residents are primarily environmental factors, basic amenities, and healthcare services, rather than technological solutions. The hypothesis about the exclusive influence of information technologies on forming the concept of a “smart city” was not confirmed, as among the 20 most important factors, only 5 are related to technologies, with most of them concerning the field of security and health. The assumption about the dependence of a smart city's development level on its population was also disproven.
Using the Fast Large Margin model with 97.5% accuracy made it possible to determine that air pollution (0.132), waste recycling (0.108), basic amenities (0.105), healthcare services (0.074), and residents' ability to participate in decision-making processes (0.072) have the greatest impact on the city development index (HDI-city). Meanwhile, corruption, the ability to purchase tickets online, and access to information about local government decisions proved to be the least important factors.
The research results have important practical significance for city planners and policymakers, who should focus on addressing the basic problems of urban life, viewing technology as a tool for improving quality of life rather than as an end in itself. Involving citizens in decision-making processes and ensuring environmental safety should become priority areas for modern city development. The proposed model can be used to predict the development level of cities not included in the 2023 rating and to develop optimal sustainable development strategies. A promising direction for further research is studying the relationship between city HDI and country HDI, as well as analyzing the impact of various security aspects on the sustainable development of smart cities.
Statements
Data availability statement
The original contributions presented in the study are included in the article/supplementary material, further inquiries can be directed to the corresponding author.
Author contributions
OB: Conceptualization, Funding acquisition, Investigation, Supervision, Validation, Writing – review & editing. OK: Conceptualization, Investigation, Methodology, Resources, Software, Writing – original draft. KB: Data curation, Formal analysis, Methodology, Writing – original draft. RI: Formal analysis, Software, Validation, Writing – original draft.
Funding
The author(s) declare that no financial support was received for the research and/or publication of this article.
Acknowledgments
The authors express their gratitude to the reviewers for their valuable suggestions that will contribute to the improvement of the article.
Conflict of interest
The authors declare that the research was conducted in the absence of any commercial or financial relationships that could be construed as a potential conflict of interest.
Publisher’s note
All claims expressed in this article are solely those of the authors and do not necessarily represent those of their affiliated organizations, or those of the publisher, the editors and the reviewers. Any product that may be evaluated in this article, or claim that may be made by its manufacturer, is not guaranteed or endorsed by the publisher.
References
1
Addas A. (2023). The concept of smart cities: a sustainability aspect for future urban development based on different cities. Front. Environ. Sci. 11:1241593. 10.3389/fenvs.2023.1241593
2
Appio F. P. Lima M. Paroutis S. (2019). Understanding smart cities: innovation ecosystems, technological advancements, and societal challenges. Technol. Forecast. Soc. Change142, 1–14. 10.1016/j.techfore.2018.12.018
3
Azevedo Guedes A. L. Carvalho Alvarenga J. Dos Santos Sgarbi Goulart M. Rodriguez y Rodriguez M. V. Pereira Soares C. A. (2018). Smart cities: the main drivers for increasing the intelligence of cities. Sustainability10:3121. 10.3390/su10093121
4
Batra N. (2025). Top 10 Largest Cities in the World by Population [October 2023]. Available online at: https://www.jagranjosh.com/general-knowledge/largest-cities-in-the-world-by-population-1697031444-1 (accessed January 2, 2024).
5
Berezka K. Kovalchuk O. (2019). Modelling factors connected with the effect of international migration for security and economy. Econometr. Adv. Appl. Data Anal. 23, 30–42. 10.15611/eada.2019.4.03
6
Bibri S. E. (2019). On the sustainability of smart and smarter cities in the era of big data: an interdisciplinary and transdisciplinary literature review. J. Big Data6:25. 10.1186/s40537-019-0182-7
7
Boreiko O. Teslyuk V. Zelinskyy A. Berezsky O. (2017). Development of models and means of the server part of the system for passenger traffic registration of public transport in the “smart” city. Eastern Euro. J. Enterprise Technol. 1, 40–47. 10.15587/1729-4061.2017.92831
8
Breytenbach J. Kariem I. (2020). “A living labs approach to manage co-created design knowledge through ideation artefacts,” in Proceedings of the 2020 6th IEEE International Conference on Information Management, ICIM 2020, London, UK, 27–29 March 2020, 343–349. 10.1109/ICIM49319.2020.245373
9
Camboim G. F. Zawislak P. A. Pufal N. A. (2019). Driving elements to make cities smarter: evidences from European projects. Technol. Forecast. Soc. Change142, 154–167. 10.1016/j.techfore.2018.09.014
10
Camero A. Alba E. (2019). Smart city and information technology: a review. Cities93, 84–94. 10.1016/j.cities.2019.04.014
11
Campisi T. Severino A. Al-Rashid M. A. Pau G. (2021). The development of the smart cities in the connected and autonomous vehicles (CAVs) era: from mobility patterns to scaling in cities. Infrastructures6:100. 10.3390/infrastructures6070100
12
Chang S. Smith M. K. (2023). Residents' quality of life in smart cities: a systematic literature review. Land12:876. 10.3390/land12040876
13
Chen C.-W. (2023). Can smart cities bring happiness to promote sustainable development? Contexts and clues of subjective well-being and urban livability. Dev. Built Environ. 13:100108. 10.1016/j.dibe.2022.100108
14
Correia D. Teixeira L. Marques J. L. (2022). Study and analysis of the relationship between smart cities and Industry 4.0: a systematic literature review. Int. J. Technol. Manag. Sustain. Dev. 21, 37–66. 10.1386/tmsd_00051_1
15
De Marco A. Mangano G. (2021). Evolutionary trends in smart city initiatives. Sustain. Futures3:100052. 10.1016/j.sftr.2021.100052
16
Human Development Index . (n.d.). Human Development Report 2023-24. Available online at: https://hdr.undp.org/content/human-development-report-2023-24 (accessed June 28, 2024).
17
IMD Smart City (2023). Index Report 2023. Available online at: https://imd.cld.bz/IMD-Smart-City-Index-Report-2023 (accessed December 26, 2023).
18
Ismagilova E. Hughes L. Dwivedi Y. K. Raman K. R. (2019). Smart cities: advances in research—an information systems perspective. Int. J. Inf. Manag. 47, 88–100. 10.1016/j.ijinfomgt.2019.01.004
19
José R. Rodrigues H. A. (2024). Review on key innovation challenges for smart city initiatives. Smart Cities7, 141–162. 10.3390/smartcities7010006
20
Kazarian A. Teslyuk V. Tsmots I. Greguš J. (2019). Development of a ≪smart≫ home system based on the modular structure and architectural data flow pattern Redux. Procedia Comput. Sci. 155, 35–42. 10.1016/j.procs.2019.08.009
21
Kim S.-C. Hong P. Lee T. Lee A. Park S.-H. (2022). Determining strategic priorities for smart city development: case studies of South Korean and international smart cities. Sustainability14:10001. 10.3390/su141610001
22
Kirimtat A. Krejcar O. Kertesz A. Tasgetiren M. F. (2020). Future trends and current state of smart city concepts: a survey. IEEE Access8, 86448–86467. 10.1109/ACCESS.2020.2992441
23
Kolokotsa D. Lilli A. Tsekeri E. Gobakis K. Katsiokalis M. Mania A. et al . (2024). The intersection of the green and the smart city: a data platform for health and well-being through nature-based solutions. Smart Cities7, 1–32. 10.3390/smartcities7010001
24
Kovalchuk O. Berezka K. (2022). Discriminant analysis of nation brands 2022 in terms of military invasion of Russian federation in Ukraine. J. Euro. Econ. 21, 232–255. 10.35774/jee2022.03.242
25
Kovalchuk O. Karpinski M. Babala L. Kasianchuk M. Shevchuk R. (2023a). The canonical discriminant model of the environmental security threats. Complexity2023:5584750. 10.1155/2023/5584750
26
Kovalchuk O. Kasianchuk M. Karpinski M. Shevchuk R. (2023b). Decision-making supporting models concerning the internal security of the state. Int. J. Electron. Telecommun. 69, 301–307. 10.24425/ijet.2023.144365
27
Kovalchuk O. Shynkaryk M. Berezka K. Babala L. Chopyk P. Basistyi P. (2022). “Data mining tools for analysis of dependence of gas consuption of the gas price for housholds of the EU memberd-states,” in 12th International Conference on Advanced Computer Information Technologies (ACIT), Ruzomberok, Slovakia, 26–28 September 2022, 267–271. 10.1109/ACIT54803.2022.9913139
28
Kummitha R. K. R. Crutzen N. (2017). How do we understand smart cities? An evolutionary perspective. Cities67, 43–52. 10.1016/j.cities.2017.04.010
29
Kutty A. A. Wakjira T. G. Kucukvar M. Abdellaa G. M. Onat N. C. (2022). Urban resilience and livability performance of European smart cities: a novel machine learning approach. J. Cleaner Prod. 378:134203. 10.1016/j.jclepro.2022.134203
30
Lim Y. Edelenbos J. Gianoli A. (2019). Identifying the results of smart city development: findings from systematic literature review. Cities95:102397. 10.1016/j.cities.2019.102397
31
Lipianina-Honcharenko K. Komar M. Osolinskyi O. Shymanskyi V. Havryliuk M. Semaniuk V. (2024). Intelligent waste-volume management method in the smart city concept. Smart Cities7, 78–98. 10.3390/smartcities7010004
32
Meijer A. Bolívar M. P. R. (2016). Governing the smart city: a review of the literature on smart urban governance. Int. Rev. Adm. Sci. 82, 392–408. 10.1177/0020852314564308
33
Mora L. Deakin M. Reid A. (2019). Combining co-citation clustering and text-based analysis to reveal the main development paths of smart cities. Technol. Forecast. Soc. Change142, 56–69. 10.1016/j.techfore.2018.07.019
34
Noy K. Givoni M. (2018). Is ‘smart mobility' sustainable? Examining the views and beliefs of transport's technological entrepreneurs. Sustainability10:422. 10.3390/su10020422
35
Parygin D. Sadovnikova N. Gamidullaeva L. Finogeev A. Rashevskiy N. (2022). Tools and technologies for sustainable territorial development in the context of a quadruple innovation helix. Sustainability14:9086. 10.3390/su14159086
36
Popova S. Izonin I. (2023). Application of the smart house system for reconstruction of residential buildings from an obsolete housing stock. Smart Cities6, 57–71. 10.3390/smartcities6010004
37
Poucke S. V. (2020). RapidMiner automated model Ops, model deployment and management. Method. 10.13140/RG.2.2.14292.14724
38
Ramaswami A. Russell A. G. Culligan P. J. Rahul Sharma K. Kumar E. (2016). Meta-principles for developing smart, sustainable, and healthy cities. Science352, 940–943. 10.1126/science.aaf7160
39
RapidMiner Documentation . (n.d.). Available online at: https://docs.rapidminer.com (accessed June 13, 2024).
40
Shayan S. Kim K. P. Ma T. Nguyen T. H. D. (2020). The first two decades of smart city research from a risk perspective. Sustainability12:9280. 10.3390/su12219280
41
Sheikh H. Mitchell P. Foth M. (2023). More-than-human smart urban governance: a research agenda. Digit. Geogr. Soc. 4:100045. 10.1016/j.diggeo.2022.100045
42
Szczepańska A. Kazmierczak R. Myszkowska M. (2023). Smart city solutions from a societal perspective—a case study. Int. J. Environ. Res. Public Health20:5136. 10.3390/ijerph20065136
43
The Global Data Lab (2022). Global partnership for sustainable development data. Available online at: https://www.data4sdgs.org/partner/global-data-lab (accessed December 27, 2023).
44
Trindade E. P. Hinnig M. P. F. da Costa E. M. Marques J. S. Bastos R. C. Yigitcanlar T. (2017). Sustainable development of smart cities: a systematic review of the literature. J. Open Innov. Technol. Market Complex. 3, 1–14. 10.1186/s40852-017-0063-2
45
Tutak M. Brodny J. (2023). A smart city is a safe city: analysis and evaluation of the state of crime and safety in polish cities. Smart Cities6, 3359–3392. 10.3390/smartcities6060149
46
United 4 (2017). Collection Methodology for Key Performance Indicators for Smart Sustainable Cities. Smart Sustainable Cities. Geneva. Available online at: https://unece.org/DAM/hlm/documents/Publications/U4SSC-CollectionMethodologyforKPIfoSSC-2017.pdf (accessed December 24, 2023).
47
United Nations Economic Commission for Europe (UNECE) (2020). Smart Sustainable Cities. Geneva: United Nations, 78 p. Available online at: https://unece.org/sites/default/files/2021-01/SSC%20nexus_web_opt_ENG_0.pdf (accessed December 22, 2023).
48
Verrest H. Pfeffer K. (2019). Elaborating the urbanism in smart urbanism: distilling relevant dimensions for a comprehensive analysis of smart city approaches. Inf. Commun. Soc. 22, 1328–1342. 10.1080/1369118X.2018.1424921
49
World Population Review (2024). World City Populations. Available online at: https://worldpopulationreview.com/world-cities (accessed January 2, 2024).
50
Yadav G. Mangla S. K. Luthra S. Rai D. P. (2019). Developing a sustainable smart city framework for developing economies: an Indian context Sustain. Cities Soc. 47:101462. 10.1016/j.scs.2019.101462
51
Yigitcanlar T. Kamruzzaman M. Buys L. Ioppolo G. Sabatini-Marques J. da Costa E. M. et al . (2018). Understanding ‘smart cities': intertwining development drivers with desired outcomes in a multidimensional framework. Cities81, 145–160. 10.1016/j.cities.2018.04.003
52
Yildirim S. (2021). 15 Must-Know Machine Learning Algorithms. A Comprehensive Guide for Machine Learning. Towards Data Science. Available online at: https://towardsdatascience.com/15-must-know-machine-learning-algorithms-44faf6bc758e (accessed November 21, 2023).
53
Zheng C. Yuan J. Zhu L. Zhang Y. Shao Q. (2020). From digital to sustainable: a scientometric review of smart city literature between 1990 and 2019. J. Clean. Prod. 258:120689. 10.1016/j.jclepro.2020.120689
54
Żywiołek J. Schiavone F. (2021). Perception of the quality of smart city solutions as a sense of residents' safety. Energies14:5511. 10.3390/en14175511
Summary
Keywords
smart city, sustainable development, performance evaluation, decision-making, machine learning, Fast Large Margin model
Citation
Berezsky O, Kovalchuk O, Berezka K and Ivanytskyy R (2025) Assessing smart cities' effectiveness: machine learning approaches. Front. Sustain. Cities 7:1400917. doi: 10.3389/frsc.2025.1400917
Received
14 March 2024
Accepted
30 April 2025
Published
22 May 2025
Volume
7 - 2025
Edited by
Nitin Goyal, Central University of Haryana, India
Reviewed by
Ivan Izonin, Lviv Polytechnic National University, Ukraine
Thomas W. Sanchez, Texas A and M University, United States
Updates
Copyright
© 2025 Berezsky, Kovalchuk, Berezka and Ivanytskyy.
This is an open-access article distributed under the terms of the Creative Commons Attribution License (CC BY). The use, distribution or reproduction in other forums is permitted, provided the original author(s) and the copyright owner(s) are credited and that the original publication in this journal is cited, in accordance with accepted academic practice. No use, distribution or reproduction is permitted which does not comply with these terms.
*Correspondence: Oleh Berezsky ob@wunu.edu.ua
Disclaimer
All claims expressed in this article are solely those of the authors and do not necessarily represent those of their affiliated organizations, or those of the publisher, the editors and the reviewers. Any product that may be evaluated in this article or claim that may be made by its manufacturer is not guaranteed or endorsed by the publisher.