 Retsepile Kalaoane
 Trynos Gumbo
- Department of Urban and Regional Planning, University of Johannesburg, Johannesburg, South Africa
Globally, transportation systems are under pressure to adopt and ensure more sustainable, inclusive, and efficient systems as cities become more complex and connected. Consequently, in the quest to develop a functional, sustainable, and inclusive transportation system, it is mandatory to first determine the key characteristics that set apart various public transportation options. Distinguishing between modes of transportation enables a detailed examination beyond superficial characteristics, resulting in better system optimization, evidence-based, and better-informed decision-making. Moreover, accurate classification of public transportation data is essential for comprehending mobility trends, achieving more guided urban planning. In this paper, an SVM model was trained and evaluated for the classification of minibus taxis, buses, and ride-hailing using data collected from the survey, to find the main attributes that distinguish the two modes of transport from each other based on users’ evaluation of their performance. The overarching objective is to enable policymakers to identify best practices across modes. By understanding what works well in one transport mode, lessons can be drawn and adapted to improve the performance and integration of others. The SVM model achieved a high accuracy of 90% in validation, demonstrating the effectiveness of the adopted approach. The findings reveal underlying factors that influence mobility trends, patterns, and behaviours. Overall, the SVM informs a user-centered approach to transport policy, enabling the design of interventions that respond directly to the factors that matter most to commuters. Ultimately, the insights derived from the SVM model provide evidence-based recommendations for the development of future sustainable public transport in African cities. They also inform better practices that empower planners to design a customer-centric transportation system that is better suited to fulfil the desires and requirements of the community.
1 Introduction
Public transport is critical in facilitating the functioning of cities (Hernandez, 2018; Kalaoane et al., 2024). The need for quality, effective, and efficient public transport systems gained traction toward the turn of the 21st century, thus the adoption and popularity of the sustainable public transport discourse that made its way into urban strategies and policies in African cities (Sam et al., 2018; Oqubay, 2025). Ochoa-Covarrubias et al. (2021) state that sustainable transport provision refers to “access to safe, affordable, accessible and sustainable transport systems for all, improving road safety, notably by expanding public transport, with special attention to the needs of those in vulnerable situations. The Sustainable Development Goals (SDGs) provide a global framework for addressing various challenges facing cities, including inequality, poverty, and climate change (Tazzie et al., 2024). Transport classification often aids SDGs by monitoring and enhancing transportation systems, particularly Goal 11, which involves promoting sustainable cities and communities (Almulhim et al., 2024). Furthermore, the classification of transportation modes facilitates the creation of an intelligent, robust transportation infrastructure. Additionally, classification aids in climate monitoring and mitigation strategies that address Goal 13 on Climate Change (Owusu-Sekyere et al., 2024).
Nevertheless, the state of public transport services and infrastructure is seemingly declining across the African continent (Yankson, 2022), thus affecting people who depend solely on public transport to take part in economic life (Borker, 2022). The poor state of public transport systems undermines the strive for sustainable cities and communities. Díez-Mesa et al. (2018) and Stokenberga et al. (2025) acknowledge that existing mass transit is unable to give full user satisfaction. Consequently, in Johannesburg, the quality of transport services in Johannesburg is marked by both efforts at modernization and persistent systemic challenges. While services like Metrobus and the Rea Vaya Bus Rapid Transit (BRT) system have improved access and reduced carbon emissions (Matubatuba and De Meyer-Heydenrych, 2022; Almassawa et al., 2025; Yildirim and Akin, 2025), more efficient vehicles, users still face significant issues such as long travel times, inconsistent service, and overcrowding. According to the 2019/20 Gauteng Household Travel Survey (GHTS), nearly 60% of households in Gauteng spent more than the recommended 10% of their income on public transport, up from 55% in 2014. This trend is particularly burdensome for lower-income households, who are disproportionately affected by rising transport costs. The survey highlights that transport continues to contribute significantly to the increased cost of living in Gauteng, with poorer households being the most impacted. These findings underscore the need for improved and affordable public transport options given the African context.
In this study, the objective of the classification model is to find the main attributes that distinguish two modes of transport from each other based on users’ evaluation of their performance. Ultimately, establish a user-centric transportation system that is sustainable, inclusive, adaptive, and data-driven for the creation of sustainable cities. The paper is structured as follows: Section 1 presents an introduction, and Section 2 discusses related works and contributions. In Section 3, methodological consideration is presented, including data acquisition process, in addition to the methodology for developing the classification algorithm, including the selection of relevant features and the implementation of SVM. In Section 4, the results obtained from evaluating the performance of the SVM algorithm are presented. Discussions and implications of the findings are discussed, and potential future directions are explored in Sections 5 and 6, respectively. Finally, conclusions are presented in Section 7, and limitations of the study are discussed in Section 8.
2 Related works and contribution
The application of Machine Learning (ML) to transportation systems has been increasingly popular in recent years. ML models are becoming essential in transport analytics, from demand forecasting (Demissie et al., 2016; Profillidis and Botzoris, 2018; Nguyen et al., 2020; Ghorbani et al., 2025) and mode detection to traffic prediction and route optimization (Nagy and Simon, 2018; Boukerche and Wang, 2020; Liu et al., 2025; Priya and Francis, 2025). Subsequently, models such as SVM, Random Forests, Decision Trees, K-Nearest Neighbor (K-NN), and Neural Networks have been used in transportation mode classification (Kabiri et al., 2023). The intricacy, data needs, interpretability, and generalizability of these models vary. For example, Fang et al. (2016) used SVM, Decision Trees, and K-Nearest Neighbor algorithms to classify transportation and vehicle modes using accelerometer, magnetometer, and gyroscope data from smartphones. SVM demonstrated the best accuracy compared to other ML models. In the context of developing countries, Tamirat et al. (2023) utilized SVM, which proved to be suited for complex rural–urban landscape change and pattern analysis.
In most of these studies, SVM demonstrates the most promising among these in the classification of transport modes, Roy et al. (2020) particularly in cases when the data is nonlinear, sparse, or derived from multiple sources. Kristiyanti et al. (2022) applied SVM in a study that collected data on Light Rail Transit and Mass Rapid Transit from tweets. SVM in this study achieved high accuracy and provided insights into public opinion, guiding improvement in service within the transportation mode. Similarly, AlKhereibi et al. (2022) utilized an SVM-based approach to urban and transport planners in forecasting transit demand and planning land use around metro stations, supporting Transit-Oriented Development (TOD) strategies in Qatar. SVM offers a comparative advantage over other classification algorithms in this study on the efficacy of SVM in categorizing public transportation modes.
Recent studies, such as Hagenauer and Helbich (2017) and Ghorbani et al. (2025), have demonstrated that classifiers like Random Forest, XGBoost, and CatBoost, frequently outperform other classification models across various domains. Although comparative evaluation across multiple algorithms is a valuable approach, the present study focused specifically on assessing the performance of Support Vector Machines (SVM) within the context of classification of different modes of public transport. SVM was ultimately selected based on both theoretical and empirical considerations. SVM is particularly well-suited for high-dimensional spaces and demonstrates strong generalization capabilities. In this study, SVM outperformed other models during the validation phase, achieving a high accuracy of 90%. This performance, combined with SVM’s robustness to overfitting and its effectiveness in handling non-linear decision boundaries, justified its selection as the optimal classifier for this study. This holistic approach allows a better understanding of the consumer’s perspective on the current public transport system.
3 Methodological considerations
A structured survey was conducted with 300 commuters from March to April 2023 using a cluster sampling technique. Cluster sampling divides the population of interest into groups and allows random selection from each cluster to represent the sample of the study. This can be done in two ways; single-stage (Wu et al., 2020) and multi-stage cluster sampling (Fawzy et al., 2021). This study followed a multi-stage sampling technique, which did not require a sampling frame (Sharma, 2017). When a thorough sampling frame is lacking or challenging to establish, multi-stage sampling is a useful strategy because it allows a researcher to utilize locations or other groupings as the primary sampling units (Brown, 2010). Data was collected in Braamfontein, an inner-city educational and commercial precinct in the city of Johannesburg. In this study, all public transport stations and stops in Braamfontein were clustered, and participants were selected randomly from those clusters. According to Taherdoost et al. (2022), a sample size of 100 or greater is sufficient for SVM because the greatest significance lies in the data’s ability to generate impactful and robust results.
Consequently, this study utilized data from 300 surveys to ensure robustness. The purpose of the survey instrument was to collect detailed information from users regarding the quality of different modes of transport services. 300 surveys collected in this study reduced the risk of overfitting and improved the robustness and accuracy of the model, ensuring that the results were more representative. The survey consisted of the use of a Likert scale requesting respondents to gauge their satisfaction level from 1 (dissatisfied) to 10 (extremely satisfied) for the level of services provided by different modes of public transport systems (see Table 1), and consent was sought from commuters before probing. In addition, Ethics approval was obtained from the Higher Education Ethics Committee to ensure the study adhered to ethical research standards. The survey was conducted with informed consent from all participants. Data were then analyzed using Support Vector Machine (SVM), a supervised machine learning method that can be applied to regression and classification (Jain et al., 2020).
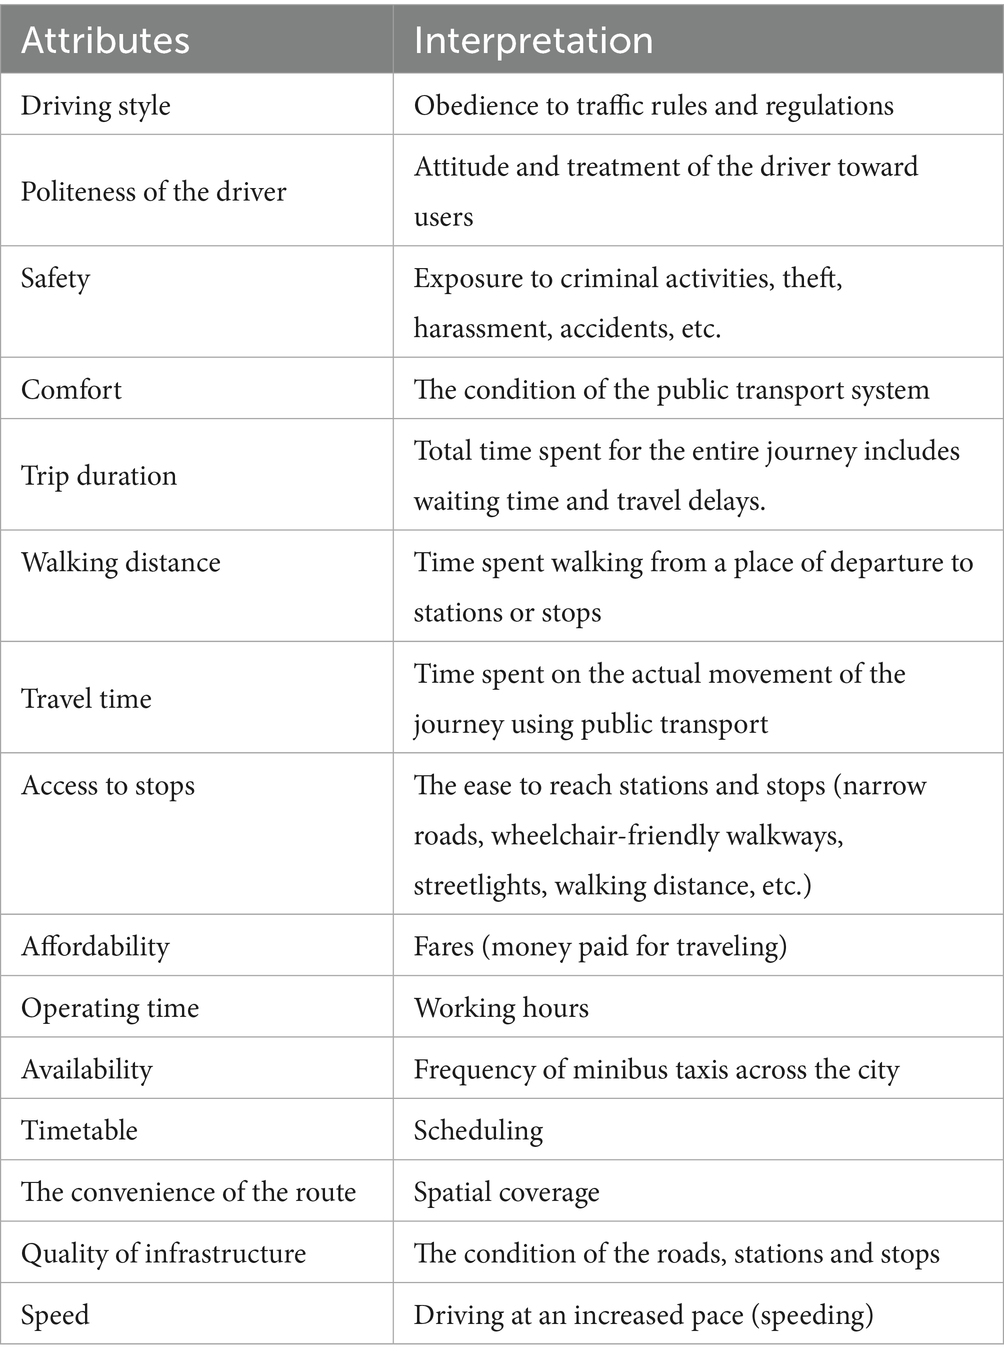
Table 1. Evaluated attributes.
3.1 Building a classification model
The analysis of the perception of public transport users on the mode of public transportation was further enhanced by classification analysis. In classification analysis, data is categorized into predefined classes or groups using classification analysis (Chen et al., 2020), depending on specific features or attributes. To predict the class labels of new, unseen data, classification creates a model or algorithm that can recognize patterns in labeled training data (García-Mendoza et al., 2020). It is a subset of supervised learning, which is more broadly defined as training an algorithm on a labeled dataset with known outcomes (Bi et al., 2019).
In this work, the classification model was performed to find the main attributes that distinguish two modes of transport from each other, based on users’ evaluation of their performance. Firstly, the features that characterize the quality of service in public transportation were selected (Table 1). Therefore, it was equally important to characterize the modes of public transport based on the user feedback. This is because user perspectives offer a clear, user-focused viewpoint on the effectiveness and performance of various public transport options.
3.1.1 Feature selection
Attributes selected for classification are presented in Table 1. In this analysis, the respondents were asked to rate, from 1 to 10, their level of satisfaction with minibus taxi, bus, and ride-hailing on the attributes listed in Table 1. These features were chosen based on their relevance to user satisfaction and their potential to distinguish between different modes of transport.
Based on the user-rated feedback on the listed attributes, the subsequent step was finding a classifier.
3.1.2 Algorithm
Given the classifier, it is imperative to find the minimum set of attributes that maximizes the accuracy of the classification. Overall, the SVM model was trained to identify the main attributes that distinguish public transport modes based on the evaluated attributes by the commuters from the survey. On the validation set, approximately 90% accuracy was achieved, indicating the model was performing well. The following steps are then followed to find a suitable algorithm:
Step 1: Let Ω be the set of optimal attributes and | Ω | its size.
Step 2: An is the n-th attributes, n = 1,2,…, N.
Step 3: F(∑) is the accuracy of the classification with the set of attributes ∑.
Step 4: Compute F (An), n = 1,2,…, N.
Step 5: Select the attribute that gives the maximum accuracy, add it to Ω.
Step 6: Compute F (ΩUAn).
Step 7: Select the attribute that gives the maximum accuracy, add it to Ω.
Step 8: Repeat the scheme until accuracy reaches the maximum value.
Step 9: Return Ω.
Step 10: Find a function f (x) that separates the two classes with Minimum error. In machine learning, a separation hyperplane (Figure 1) is a hyperplane that serves as a decision boundary or divider between classes in a dataset. It is frequently used in relation to Support Vector Machines (SVM). Deciding which hyperplane best divides the feature space’s classes maximally is the main objective of an SVM (García-Mendoza et al., 2020).
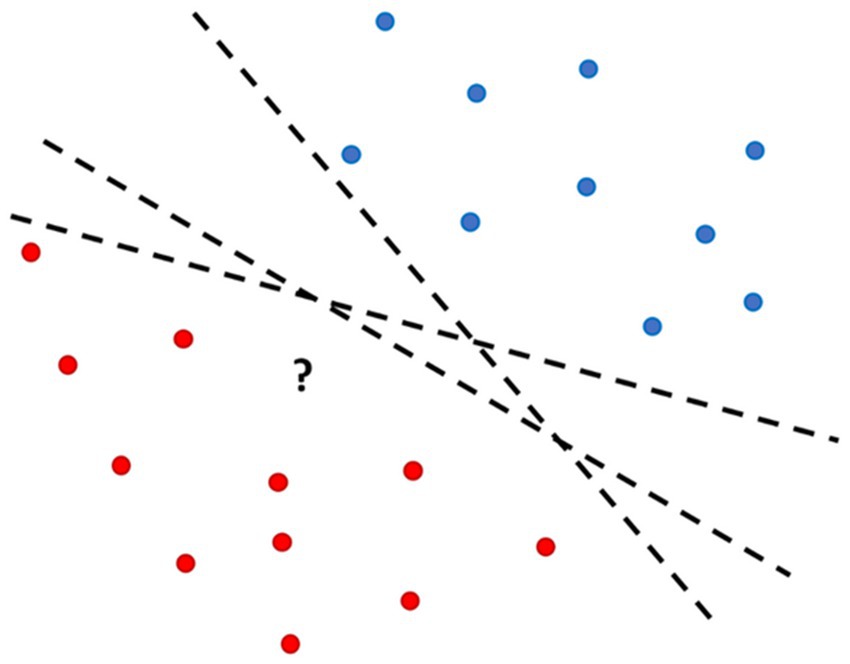
Figure 1. Separation hyperplanes.
3.1.3 Support vector machine
SVM learns from a trained data set to make predictions and generalizations on a novel set (Campbell and Ying, 2011). The tool has been used in various domains, including transportation. For example, SVMs can capture complex patterns in situations where traffic and weather conditions are non-linear (Bachu et al., 2021). Additionally, linear SVM attempts to categorize data by finding suitable hyperplane that maximally separates distinct classes in the feature space is found to yield the optimal classifier (Figure 2).
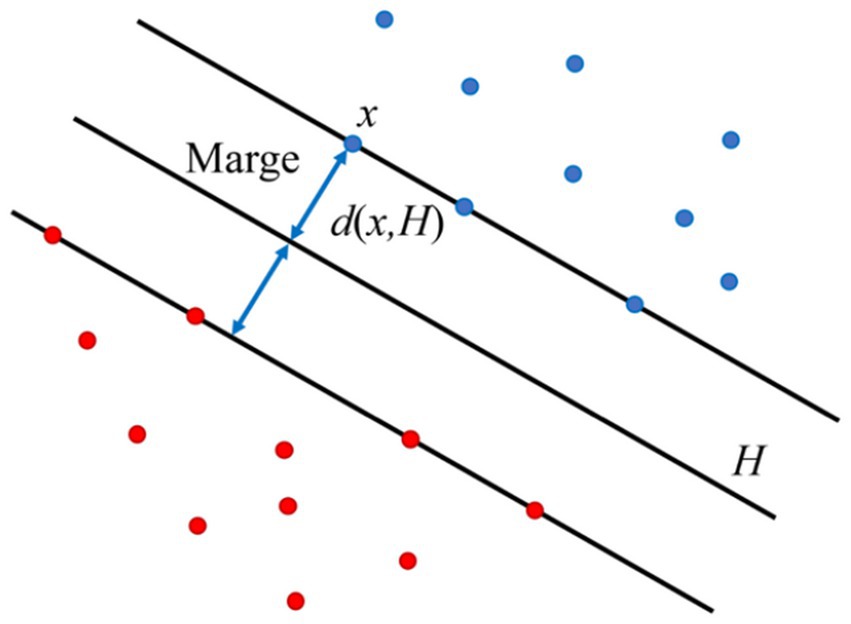
Figure 2. Optimal classifier.
Linear SVMs are designed to find the separator (the separating hyperplane) that maximizes the margin. This is known as a “wide-margin separator.” The ideal hyperplane is arranged to maximize the margin, which is the separation between the hyperplane and the closest data point from each class. Achieving the best possible classification performance on the given dataset requires selecting the optimal classifier, which is determined by the support vectors. In this case, the SVM seeks to determine the ideal hyperplane based on selected attributes or features that efficiently differentiates between various modes of transportation.
Consequently, the system’s response enabled models to learn what decision boundary separates various transport modes. The model with the highest accuracy for this data was the Support Vector Machine (SVM) Model. The SVM model was trained to identify the main attributes that distinguish public transport modes based on the evaluated attributes. On the validation set, approximately 90% accuracy was achieved, indicating the model was performing well.
4 Findings
Developing a well-functional, sustainable, and inclusive transportation system firstly requires to determining the key characteristics that set apart various public transportation options. Identifying a classify to distinguish between modes of transportation enables a detailed examination that goes beyond superficial characteristics, resulting in better system optimization and more informed decision-making. SVM was employed because it effectively classifies modes of public transport based on rated attributes by the users, with a strong accuracy rate.
4.1 Assessing SVM performance
The classification matrix and F1 score were computed to assess the performance of the SVM.
4.1.1 Confusion matrix
In the assessment of a classification model, the confusion matrix serves as an essential tool providing a complete and specific description of the model’s predictions (Xu et al., 2020). It categorizes instances into four essential components: True positives, true negatives, false positives, and false negatives. High true positive and true negative rates indicate good accuracy. Such granularity allows for a more detailed assessment of the model’s accuracy, delineating between correct and incorrect decisions made by it. Hence, within this study, the confusion matrix is summarized in.
Table 2 illustrates the effectiveness of the SVM model in distinguishing between taxis, buses, and ride-hailing services based on commuter evaluations.
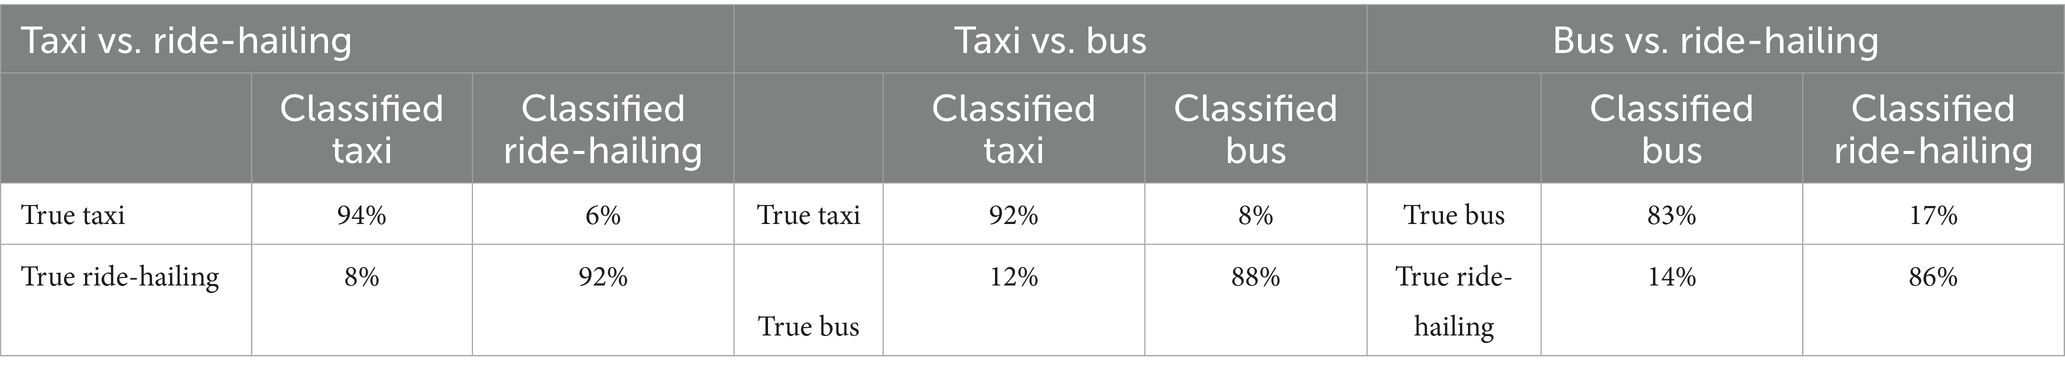
Table 2. Classification matrix.
To improve transparency and interpretability, both percentages and absolute numbers for each transport mode category are provided. Although there were 300 participants overall, some selected more than one mode, resulting in cumulative counts exceeding 100%. Specifically, 150 participants (50.0%) selected bus, 191 (63.7%) selected ride-hailing, and 220 (73.3%) selected minibus taxi. The SVM model employed in this study proved to be very efficient in classifying transport modalities according to customer-rated attributes, yielding good performance indexes. This is based on its precision and accuracy.
4.1.2 Calculating the F1 score
The F1 score is used to measure the accuracy of a model (Yacouby and Axman, 2020). It provides a thorough evaluation of the performance of a model than accuracy alone. The F1 score is calculated using the following formula:
Precision: It is the ratio of correctly predicted positive observations to the total predicted positives. It is expressed as:
Recall: It is the ratio of correctly predicted positive observations to all actual positives. It is expressed as:
Based on user evaluations, the model is good especially where minibus taxis are involved (Table 3).
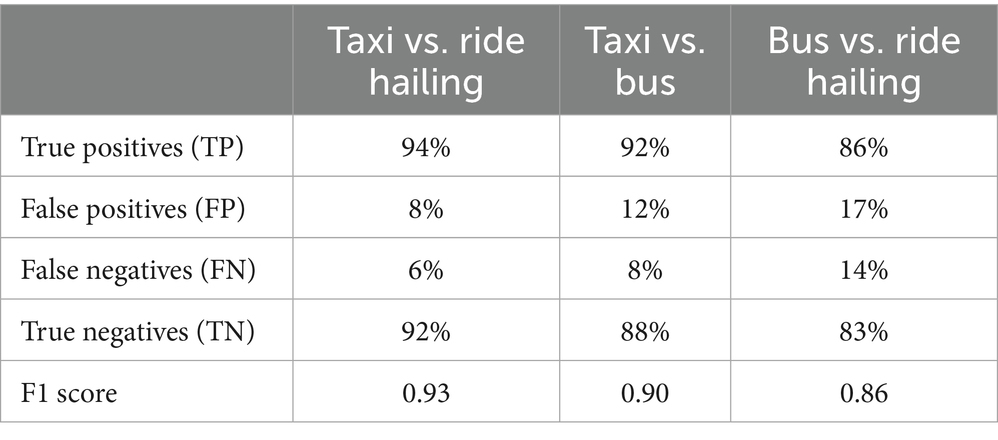
Table 3. Calculating the F1 score.
Based on users’ assessments, the SVM model appears to be generally effective at differentiating between various modes of transportation. The model is good in differentiating between the two modes of transportation; the Taxi vs. Ride-hailing comparison yields the highest F1 score. Taxi vs. Bus exhibits a commendable performance as well, albeit with a marginally lower F1 score. Out of the three pairs, Bus vs. Ride-hailing has the lowest F1 score, suggesting that the model may find it more difficult to distinguish between the two situations. This concludes that, in essence, F1 score comparison gives us an insight into how the SVM model works in differentiating between various modes of public transport. The scores are equally effective since they provide useful indicators of the different levels of complexity, which the model experiences when differentiating modes of public transport.
5 Discussion
5.1 Main attributes distinguishing public transport modes
The main attributes selected for evaluation are driving style, politeness of a driver, safety, comfort, trip duration, walking distance, travel time, access to stops, affordability, operating time, availability, the convenience of the route, quality of infrastructure and speed. The SVM results are presented in this section.
5.1.1 Minibus taxi vs. ride hailing
The main attributes distinguishing a minibus taxi from ride-hailing services are comfort, affordability, politeness, access to stops, driving style, speed, and trip duration (Figure 3).
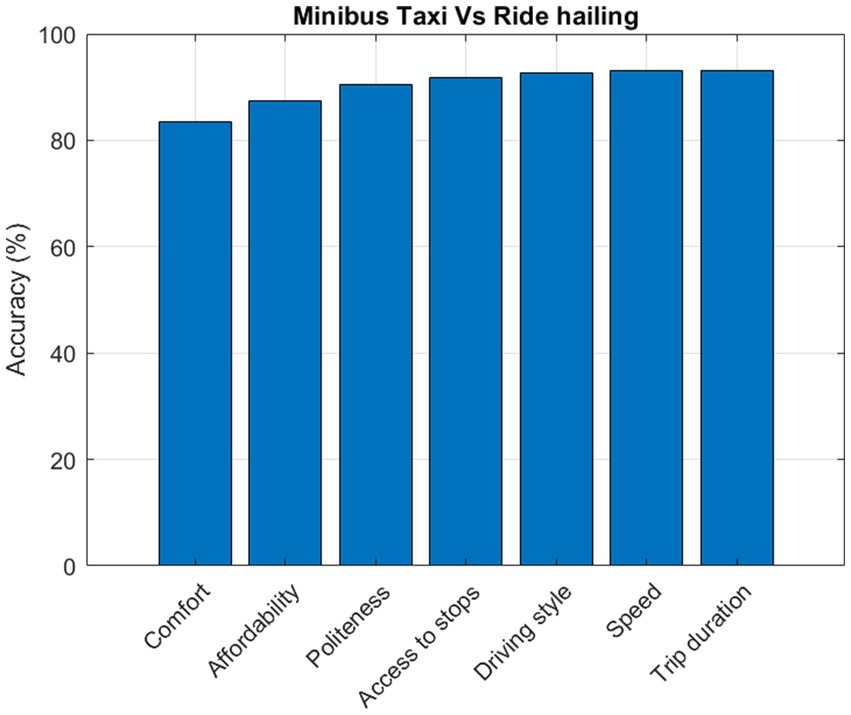
Figure 3. Minibus taxi vs. ride hailing.
This study highlights comfort as a key factor, and the Support Vector Machine (SVM) has demonstrated its ability to discern differences in comfort levels between minibuses and ride-hailing services. Ride-hailing services, known for their comfortable rides and flexible availability, are generally considered more comfortable than minibus taxis, which often lack proper maintenance and can only access locations close to roads. Additionally, SVM was effective in distinguishing between minibuses and ride-hailing services based on pricing structures, with minibuses offering lower fares, enhancing affordability compared to ride-hailing options. Politeness emerged as another significant factor, particularly in terms of minibus drivers and operators’ behavior, including their attitudes toward users and their driving style, Tchanche (2018), often characterized by recklessness and speeding.
5.1.2 Minibus taxi vs. bus
The main attributes distinguishing a minibus taxi from a bus are schedule, politeness, travel time, safety, infrastructure, and availability (Figure 4).
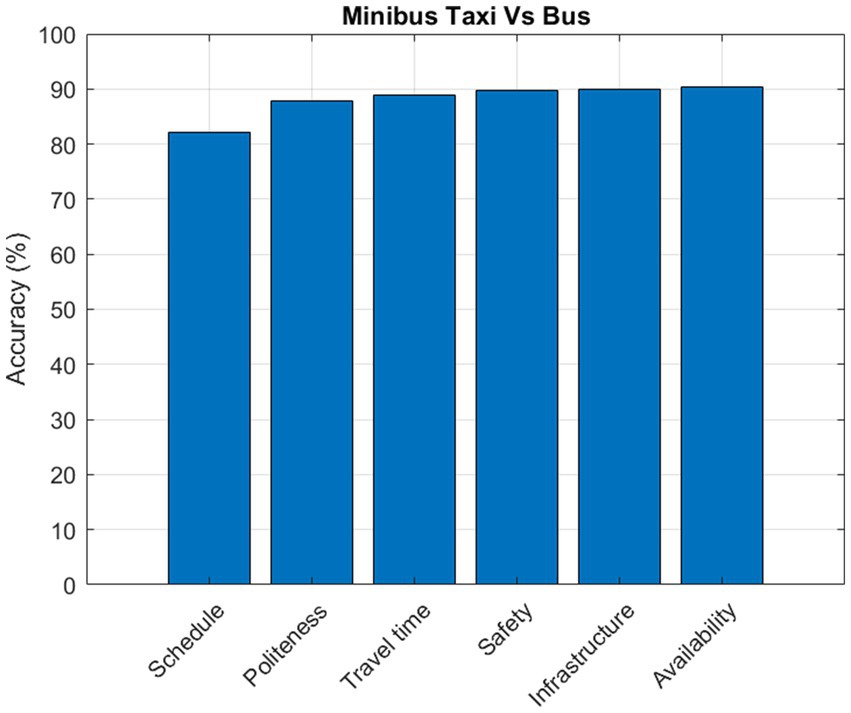
Figure 4. Minibus taxi vs.
The algorithm identified schedule flexibility as a key differentiator for minibus taxis, highlighting their more flexible schedule compliance. Furthermore, by designating politeness as a differentiating characteristic, the significance of user experiences and interpersonal interactions is emphasized, highlighting the influence of customer service on the impressions of drivers of minibus taxis who adhere to a particular code of conduct versus those who do not. The fact that travel time has been identified as a significant factor highlights the greater flexibility of minibuses over buses in terms of how trip duration affects classification.
The finding that safety is a differentiating factor highlights the influence of user preferences that are influenced by infrastructure safety features and safety perceptions. Furthermore, admitting infrastructure as a component emphasizes how the external environment affects how minibuses, which are frequently categorized as lacking infrastructure and buses are distinguished from one another. Lastly, recognizing availability emphasizes the importance of accessibility and service frequency in the categorization process, with minibus taxis typically more available in terms of time and space, while buses are constrained to specific routes.
5.1.3 Bus vs. ride hailing
The main attributes distinguishing a minibus taxi from a bus are schedule, politeness, travel time, safety, infrastructure, and availability (Figure 5). The first important consideration is walking distance. Based on the closeness of stops or stations, unlike buses, ride-hailing services are advantageous because they do not have designated stops. It is implied by SVM’s recognition of walking distance that users value accessibility and departure times and ride-hailing services offer door-to-door service. In transportation planning, last-mile connectivity is crucial, and short walking distances can positively impact a mode’s classification.
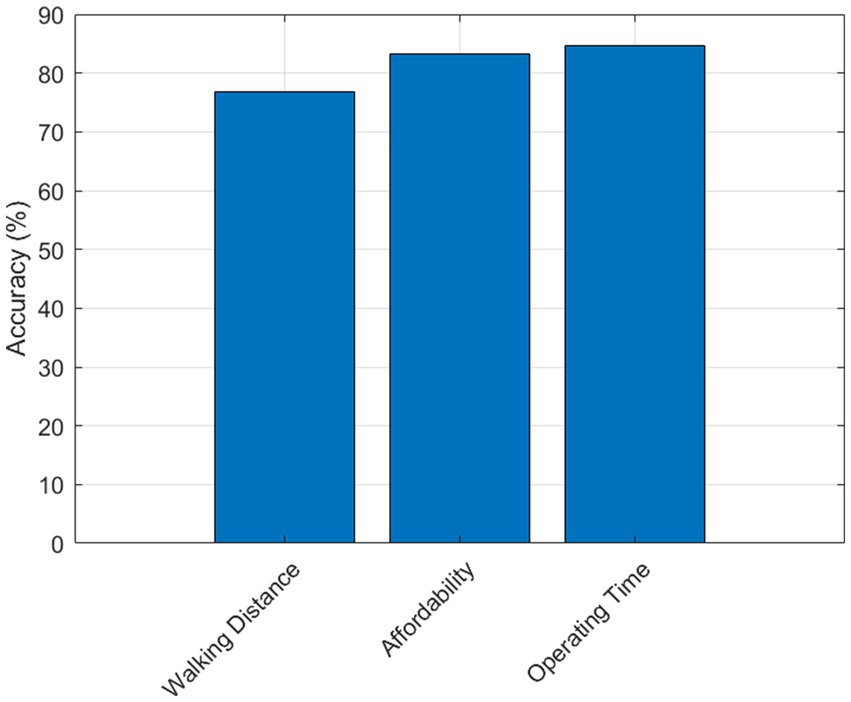
Figure 5. Bus vs. ride-hailing services.
Affordability is also identified as a classifying factor. This is consistent with the idea that mode selection is heavily influenced by cost considerations. Therefore, buses are more affordable than ride-hailing services. The third factor that was found provides insight into the temporal dimensions of transport services: operating time. SVM acknowledges operating time suggesting that users differentiate between modes according to when they are available, often ride-hailing service is frequently available. Overall, the SVM analysis emphasizes how crucial walking distance, cost, and operating time are in differentiating between different types of transportation.
6 Implications for policy and practice
The classification model serves as a valuable tool for identifying the key attributes that distinguish between two modes of transport; minibus taxis, buses and ride-hailing based on users’ evaluations of their performance. By highlighting the most influential factors that drive user preferences, the model provides evidence-based guidance for transport policy and planning. The primary attributes differentiating minibus taxis and ride-hailing are comfort, affordability, politeness, access to stops, driving styles, speed, and trip duration thus policymakers need to prioritize interventions, and investment should go toward the defining attributes. Upgrading minibus taxis and improving station environments can enhance its effectiveness. Moreover, another key attribute is driver behavior in determining the overall quality of services. Concerns regarding risky driving practices highlights the necessity of focused driver behavior training programs to advance safety on the roads. Although the study acknowledges South Africa’s attempts to transition certain minibus taxis to electric cars, it also points out that driver behavior and the underlying infrastructure have not yet kept pace with these developments including other factors. Lessons can be learnt to enhance the performance and integration of other modes of transportation by analyzing what functions well in one.
7 Conclusion and further research
Support Vector Machines are a strong and dependable technique for categorizing public transport modes based on travel behavior data, as this study has presented. Each mode of transport examined in the study presents unique strengths, however, the overarching objective is to enable policymakers to identify best practices across modes. By understanding what works well in one transport mode, lessons can be drawn and adapted to improve the performance and integration of others to respond better to consumer needs while maintaining the goal for sustainable transportation.
8 Limitations of the study
In this study, the sample size and study area may not have captured a sufficiently large or diverse sample of users, which could impact the generalizability of the findings. Additionally, the reliance on self-reported data introduces potential bias, as respondents may not always accurately reflect their experiences or perceptions. For example, users might overestimate their satisfaction or reduce negative aspects of the service.
Data availability statement
The raw data supporting the conclusions of this article will be made available by the authors, without undue reservation.
Author contributions
RK: Formal analysis, Writing – review & editing, Resources, Project administration, Methodology, Data curation, Writing – original draft, Supervision, Visualization, Investigation, Conceptualization, Software, Validation, Funding acquisition. TG: Conceptualization, Supervision, Writing – review & editing, Methodology, Investigation, Software, Project administration, Visualization, Funding acquisition, Writing – original draft, Resources, Validation, Formal analysis, Data curation.
Funding
The author(s) declare that no financial support was received for the research and/or publication of this article.
Conflict of interest
The authors declare that the research was conducted in the absence of any commercial or financial relationships that could be construed as a potential conflict of interest.
Generative AI statement
The author(s) declare that no Generative AI was used in the creation of this manuscript.
Publisher’s note
All claims expressed in this article are solely those of the authors and do not necessarily represent those of their affiliated organizations, or those of the publisher, the editors and the reviewers. Any product that may be evaluated in this article, or claim that may be made by its manufacturer, is not guaranteed or endorsed by the publisher.
References
AlKhereibi, A. H., Kucukvar, M., Onat, N., and Mustafa, J. M. S. (2022). Synergistic urban-transport prediction model using support vector machine; in support of sustainable development goals achievement: a case of state of Qatar. In: Proceedings of the international conference on industrial engineering and operations management. Istanbul, Turkey.
Almassawa, S. F., Rustiadi, E., Fauzi, A., and Sutriadi, R. (2025). The relationship between regional development, smart mobility and transportation planning: a bibliometric analysis. Front. Sustain. Cities 7:1424859. doi: 10.3389/frsc.2025.1424859
Almulhim, A. I., Sharifi, A., Aina, Y. A., Ahmad, S., Mora, L., Filho, W. L., et al. (2024). Charting sustainable urban development through a systematic review of SDG11 research. Nat. Cities 1, 677–685. doi: 10.1038/s44284-024-00117-6
Bachu, A. K., Reddy, K. K., and Vanajakshi, L. (2021). Bus travel time prediction using support vector machines for high variance conditions. Transport. 36, 221–234. doi: 10.3846/transport.2021.15220
Bi, Q., Goodman, K. E., Kaminsky, J., and Lessler, J. (2019). What is machine learning? A primer for the epidemiologist. Am. J. Epidemiol. 188, 2222–2239. doi: 10.1093/aje/kwz189
Borker, G. (2022). Constraints to women’s use of public transport in developing countries, part I: High costs, limited access, and lack of comfort. Washington, DC: World Bank.
Boukerche, A., and Wang, J. (2020). Machine learning-based traffic prediction models for intelligent transportation systems. Comput. Netw. 181, 107530–107521. doi: 10.1016/j.comnet.2020.107530
Brown, R. S. (2010). “Sampling” in International Encyclopedia of Education (Third Edition), 142–146. doi: 10.1016/B978-0-08-044894-7.00294-3
Campbell, C., and Ying, Y. (2011). Support vector machines for classification. In: Learning with support vector machines. synthesis lectures on artificial intelligence and machine learning. Cham.: Springer. doi: 10.1007/978-3-031-01552-6_1
Chen, R. C., Dewi, C., Huang, S. W., and Caraka, R. E. (2020). Selecting critical features for data classification based on machine learning methods. J. Big Data. 7, 1–26. doi: 10.1186/s40537-020-00327-4
Demissie, M. G., Phithakkitnukoon, S., Sukhvibul, T., Antunes, F., Gomes, R., and Bento, C. (2016). Inferring passenger travel demand to improve urban mobility in developing countries using cell phone data: a case study of Senegal. IEEE Trans. Intell. Transp. Syst. 17, 2466–2478. doi: 10.1109/TITS.2016.2521830
Díez-Mesa, F., Oña, R., and de Oña, J. (2018). Bayesian networks and structural equation modelling to develop service quality models: metro of Seville case study. Transp. Res. Part A Policy Pract. 118, 1–13. doi: 10.1016/j.tra.2018.08.012
Fang, S. H., Liao, H. H., Fei, Y. X., Chen, K. H., Huang, J. W., and Tsao, Y. (2016). Transportation modes classification using sensors on smartphones. Sensors. 16:1324.
Fawzy, D., Moussa, S., and Badr, N. (2021). The spatiotemporal data fusion (STDF) approach: IoT-based data fusion using big data analytics. Sensors 21, 1–30. doi: 10.3390/s21217035
García-Mendoza, C. V., Gambino, O. J., Villarreal-Cervantes, M. G., and Calvo, H. (2020). Evolutionary optimization of ensemble learning to determine sentiment polarity in an unbalanced multiclass corpus. Entropy. 22:1020.
Ghorbani, A., Nassir, N., Lavieri, P. S., Beeramoole, P. B., and Paz, A. (2025). Enhanced utility estimation algorithm for discrete choice models in travel demand forecasting. Transportation, 1–28. doi: 10.1007/s11116-024-10579-1
Hagenauer, J., and Helbich, M. (2017). A comparative study of machine learning classifiers for modeling travel mode choice. Expert Syst. Appl. 78, 273–282. doi: 10.1016/j.eswa.2017.01.057
Hernandez, D. (2018). Uneven mobilities, uneven opportunities: social distribution of public transport accessibility to jobs and education in Montevideo. J. Transp. Geogr. 67, 119–125. doi: 10.1016/j.jtrangeo.2017.08.017
Jain, M., Narayan, S., Balaji, P., Bhowmick, A., and Muthu, R. K. (2020). Speech emotion recognition using support vector machine. Cornell University, 1–6.
Kabiri, H., Ghanou, Y., Khalifi, H., and Casalino, G. (2023). Enhancing transportation mode prediction from GPS trajectories using machine learning and feature engineering. In: 2023 IEEE International Conference on Technology Management, Operations and Decisions (ICTMOD). 1–6.
Kalaoane, R. C., Musakwa, W., Kibangou, A., Gumbo, T., Musonda, I., and Matamanda, A. R. (2024). Bibliometric analysis of quality of service in public transportation: current and future trends. Scientific Afric 23, e02059–e02013. doi: 10.1016/j.sciaf.2024.e02059
Kristiyanti, D. A., Aulianita, R., Putri, D. A., Utami, L. A., Agustini, F., and Alfianti, Z. I. (2022). Sentiment classification twitter of LRT, MRT, and Transjakarta transportation using support vector machine. In 2022 international conference of science and information Technology in Smart Administration (ICSINTESA) (143–148). IEEE.
Liu, S., He, Q., Chen, Y., and Zhang, F. (2025). Wavelet and VMD enhanced traffic forecasting and scheduling method for edge cloud networks. Comput. Electr. Eng. 121, 109862–109812. doi: 10.1016/j.compeleceng.2024.109862
Matubatuba, R., and De Meyer-Heydenrych, C. F. (2022). Developing an intention to use amongst non-users of the bus rapid transit (BRT) system: an emerging market perspective. Res. Transp. Bus. Manag. 45, 100858–100859. doi: 10.1016/j.rtbm.2022.100858
Nagy, A. M., and Simon, V. (2018). Survey on traffic prediction in smart cities. Pervasive Mob. Comput. 50, 148–163. doi: 10.1016/j.pmcj.2018.07.004
Nguyen, N. T., Miwa, T., and Morikawa, T. (2020). Demand forecast of public transportation considering positive and negative mass effects. Transp. Res. Part D: Transp. Environ. 85, 102466–102412. doi: 10.1016/j.trd.2020.102466
Ochoa-Covarrubias, G., Grindlay, A. L., and Lizarraga, C. (2021). Does the mass public transport system cover the social transport needs? Targeting SDG 11.2 in Guadalajara, Mexico. Appl. Sci. 11:7709. doi: 10.3390/app11167709
Oqubay, A. (2025). Sustainable and productive cities and urban sustainable development: A developing countries perspective (no. 2435). Rabat, Morocco: Policy Center for the New South.
Owusu-Sekyere, E., Nyam, Y. S., Selelo, O. T., and Torsu, D. A. (2024). “Sustainable development goal 13: urgent action to combat climate change and its impacts” in Handbook on public policy and food security. eds. S. L. Hendriks and S. C. Babu (UK: Edward Elgar Publishing), 311–321.
Priya, C. S., and Francis, F. S. (2025). Optimizing traffic speed prediction using a multi-objective genetic algorithm-enhanced RNN for intelligent transportation systems. IEEE Access 13, 35688–35706. doi: 10.1109/ACCESS.2025.3544864
Profillidis, V. A., and Botzoris, G. N. (2018). Modeling of transport demand: Analyzing, calculating, and forecasting transport demand. Amsterdam, Netherlands: Elsevier.
Roy, A., Fuller, D., Stanley, K., and Nelson, T. (2020). Classifying transport mode from global positioning systems and accelerometer data: a machine learning approach. Findings. 1–8. doi: 10.32866/001c.14520
Sam, E. F., Hamidu, O., and Daniels, S. (2018). Servqual analysis of public bus transport services in Kumasi metropolis, Ghana: core user perspectives. Case Stud. Transp. Policy 6, 25–31. doi: 10.1016/j.cstp.2017.12.004
Stokenberga, A., Saïsset, E., Kerzhner, T., and Espinet Alegre, X. (2025). Connecting through public transport: accessibility to health and education in major African cities. Area Dev. Policy 10, 1–18. doi: 10.1080/23792949.2024.2364619
Taherdoost, H., Sahibuddin, S., and Jalaliyoon, N. (2022). Exploratory factor analysis; concepts and theory. Adv. Appl. Pure Math. 27, 375–382.
Tamirat, H., Argaw, M., and Tekalign, M. (2023). Support vector machine-based spatiotemporal land use land cover change analysis in a complex urban and rural landscape of Akaki river catchment, a suburb of Addis Ababa, Ethiopia. Heliyon 9, 1–17. doi: 10.1016/j.heliyon.2023.e22510
Tazzie, Y. D., Adugna, D., Woldetensae, B., Fryd, O., and Ingvardson, J. B. (2024). Exploring the factors hindering the intention to adopt sustainable transportation options in Addis Ababa, Ethiopia: using structural equation modeling. Front. Sustain. Cities 6, 1–21. doi: 10.3389/frsc.2024.1435705
Tchanche, B. F. (2018). Road transport in Africa: Analysis and appeal for innovation. Casaman Sun. Proceedings, VIth Edition, Senegal 3–5 May 2018. Ziguinchor: Asamansun.
Wu, C., Thompson, M. E., Wu, C., and Thompson, M. E. (2020). Stratified sampling and cluster sampling. Sampling theory and practice, Springer, 33–56. doi: 10.1007/978-3-030-44246-0
Xu, J., Zhang, Y., and Miao, D. (2020). Three-way confusion matrix for classification: A measure view. Information. doi: 10.1016/j.ins.2019.06.064
Yacouby, R., and Axman, D. (2020). Probabilistic extension of precision, recall, and F1 score for more thorough evaluation of classification models. In Proceedings of the first workshop on evaluation and comparison of NLP systems (79–91).
Yankson, E. (2022). Conceptualising an urban transport framework for enhanced quality of life in sub-Saharan Africa: Case studies of Ghana and Namibia. Transport and mobility futures in urban Africa. Cham: Springer International Publishing, 151–171.
Keywords: public transportation systems, support vector machine, transport analytics, SDGs, policy
Citation: Kalaoane R and Gumbo T (2025) Enhancing public transportation through user feedback: the case of Braamfontein, Johannesburg. Front. Sustain. Cities. 7:1605594. doi: 10.3389/frsc.2025.1605594
Edited by:
Salvador García-Ayllón Veintimilla, Polytechnic University of Cartagena, SpainReviewed by:
Muhammad Faisal Habib, Toltz King Duvall Anderson and Associates Inc, United StatesSüleyman Nurullah Adahi Şahin, Sakarya University of Applied Sciences, Türkiye
Selma Bulut, Kırklareli University, Türkiye
Copyright © 2025 Kalaoane and Gumbo. This is an open-access article distributed under the terms of the Creative Commons Attribution License (CC BY). The use, distribution or reproduction in other forums is permitted, provided the original author(s) and the copyright owner(s) are credited and that the original publication in this journal is cited, in accordance with accepted academic practice. No use, distribution or reproduction is permitted which does not comply with these terms.
*Correspondence: Retsepile Kalaoane, cmV0c2VwaWxla0B1ai5hYy56YQ==