Abstract
It's an important basis to clarify the coordination between the spatiotemporal evolution of tourism destination competitiveness (TDC) and the ecological environment for promoting the sustainable development of tourist destinations. This study used the entropy weight method, spatial analysis method and the center of gravity model to evaluate the spatiotemporal evolution characteristics of tourism competitiveness and ecological environment in China's coastal areas from 2005 to 2020. It also used the coupled coordination model to analyze the coordination relationship between the two. The results show that the overall level of tourism competitiveness along China's coastal areas is on the rise, with significant spatial differences between different provinces, and the center of gravity of tourism competitiveness shifting to the south. The ecological environment of China's coastal areas tends to improve as a whole, and gradually changes from relative balance to north-south divergence. The increasing rate of tourism competitiveness of China's coastal areas is faster than the progress of ecological environment improvement, and the two have not yet shown benign coupling characteristics but rather have reached a synchronous state.
1 Introduction
The study of TDC is an important topic in tourism research. This line of research helps destinations identify their shortcomings and constraining elements and is considered to play a key role in tourism marketing (Lopes et al., 2018). Most of the studies on TDC are based on Porter's work (Cronjé and du Plessis, 2020). One of the earliest studies on TDC was proposed by Poon (1993), which found that tourism competitiveness strategies should adhere to four principles—namely, customer focus, continuous quality improvement, environmental friendliness, and aggressive innovation (Poon, 1993). Ritchie and Crouch (2003), and Dwyer and Kim (2003) were early scholars who studied the elements and components of TDC in depth (Ritchie and Crouch, 2003; Dwyer and Kim, 2003). The former constructed a conceptual model of TDC that includes five major elements, namely, core resources and attractions, supporting resources and facilities, destination policy planning and development, destination management, and limiting and amplifying factors (Ritchie and Crouch, 2003). The model provided a research paradigm for the subsequent evaluation of TDC. The current international studies around TDC broadly include creating definitions and theoretical models (Cronjé and du Plessis, 2020; Croes et al., 2020), designing indicator systems and evaluation (Lopes et al., 2018; Bazargani and Kiliç, 2021; Sánchez, 2015), identifying influential factors (Lopes et al., 2018), and developing competitive strategies (Poon, 1993; Croes et al., 2020). China's research on TDC began in the late 1990s and focused on how to improve China's tourism competitiveness in the international market (Wang, 1998; Li and Zhao, 1999). Since entering the 21st century, China's scholars' research on TDC has increased significantly, showing the following characteristics: First, the research object presents the characteristics of multiple spatial scale types, including national level (Liu et al., 2018; Ye and Chen, 2013), provincial level (Fu et al., 2012), county level (Zhang et al., 2012), city level (Zhou and Jiang, 2015; Cheng and Fang, 2015), and some special geographical units, such as national full-area tourism demonstration zones (Lin et al., 2018), and land border areas (Shi et al., 2014). Second, early theoretical research has shifted to focus on empirical research. The studies discuss China's tourism competitiveness practices and compare it with other different types of countries (Ye and Chen, 2013; Wan et al., 2011). Third, the research methods are complex and diverse. They include the design and evaluation of a tourism competitiveness index system using hierarchical analysis (Shi et al., 2014), improved entropy weight method (Liu et al., 2018; Wang and Zhu, 2019), ecological niche theory (Cheng and Fang, 2015), backpropagation neural network model (Huang et al., 2017), and the spatial autocorrelation method to discuss the spatial differentiation of regional tourism competitiveness (Lin et al., 2018); and the obstacle factor model to diagnose tourism competitiveness constraints (Wang and Zhu, 2019).
To summarize the existing studies, the measurement and evaluation of TDC is one of the major areas of interest for scholars. Fewer research results have been found, however, in the spatiotemporal interaction between the TDC and the ecological environment. The existing studies have focused mainly on the ecological environmental problems that arise during the development of the tourism industry and the impact that the former exerts on the latter (Amelung et al., 2016). For example, tourism increases carbon dioxide emissions and exacerbates global climate change (Amelung et al., 2016; Zhang and Liu, 2019); it also has an impact on water and forest resources, biodiversity and habitats, and traditional lifestyles, which in turn reduces the quality of tourism resources and the environment (Sevilla-Sevilla et al., 2019). The decline in ecological quality, in turn, has an impact on the development of different types of tourism destinations. For example, Wang and Zhu (2019) found that the rapid development of polar tourism has accelerated environmental changes in the polar region and that tourism conflicts with ecological conservation are intensifying, affecting its sustainable development (Shijin et al., 2020). Lange (2015) showed that the outflow of benefit distribution from coastal tourism in developing countries will have a disincentive effect on the sustainable management of local oceans, which in turn affects the entire coastal ecosystems and local livelihoods. Steiger and Abegg (2013) studied the sensitivity of Austrian ski areas to climate change, and they found that artificial snowmaking can somewhat mitigate the impact of rising global temperatures on natural ice and snow tourism sites, but it also has certain technical-physical limits. Mutana and Mukwada (2018) explored how current sustainable tourism management in developing countries affects tourism practices in mountain tourism areas, arguing that mountain tourism may have poverty-reducing effects depending on the level of community participation, while potentially undermining the mountain environments and increasing the cultural vulnerability.
In summary, scholars have reached consensus that tourism and the ecological environment interact. The research on the interaction between the two is relatively mature. Few studies, however, have examined the spatiotemporal relationship between TDC and ecological environment, and predictive research on the relationship between the two is lacking. The ecological environment as a tourism resource in tourism destinations is an external representation of regional tourism competitiveness, and it will affect the sustainable development of tourism, which in turn will influence the adjustment of tourism competitiveness strategies. Therefore, it is important to study the spatiotemporal interaction between TDC and ecological environment, especially the coordination relationship, for adjusting competitive strategies, improving tourism competitiveness, protecting regional ecological environment, and improving community life. On this basis, 11 provinces and cities in the most developed coastal area of China's tourism economy have been used as research objects to construct an evaluation index system of TDC and ecological environment, to study the evolution characteristics of their spatiotemporal patterns, and to conduct quantitative research on the spatiotemporal processes of the coupled coordination relationship based on the coupling coordination model.
2 Coupling coordination model for TDC and ecological environment
The concept of TDC has been controversial because it is complex, multidimensional, and difficult to measure (Bazargani and Kiliç, 2021). Ritchie and Crouch (2003) proposed that TDC should include core resources and attractions, supporting resources and facilities, destination policy planning and development, and destination management. Other scholars and industry professionals have endorsed the Travel and Tourism Competitiveness Index published in the World Economic Forum's Travel and Tourism Competitiveness Report. The index includes four sub-indicators, namely, tourism environment, tourism policy conditions, infrastructure, and natural and cultural resources (Lopes et al., 2018). China's scholars have designed an evaluation index system from the dimensions of tourism resources and products, tourism market, tourism management, socioeconomic base, and environmental quality (Zhang et al., 2012; Ma and Cao, 2013; Fang et al., 2013; Li et al., 2017).
Considering these relevant studies, tourism competitiveness evaluation is a complex and systematic project that should be measured according to the following five perspectives: tourism performance scale, tourism resource endowment, tourism service and reception capacity, tourism talent endowment, and tourism internationalization. The tourism performance scale reflects the scale competitiveness of the tourism industry, the tourism resource endowment reflects the attractiveness of tourism resources, the tourism service and reception capacity reflects the soft power of tourism industry, the tourism talent endowment reflects the competitiveness of human resources of tourism industry, and tourism internationalization characterizes the influence of tourism destinations in the international market. The TDC system influences the ecosystem through these five dimensions. The ecosystem provides the material base conditions for tourism development and gives feedback to tourism development through three stages: bearing development pressure, changing the environmental state, and responding to decisions. These stages, in turn, affect the TDC system. Bearing development pressure refers to the pressure exerted by human tourism activities on natural resources and the ecological environment, including constructive and productive pollution damage generated in the process of tourism development, as well as living and experiential pollution damage generated in the process of community life and tourist experience, which cause changes in the ecosystem. Changing the environmental state refers to the new state of the natural ecosystem as a result of tourism activities, including changes in the resource environment, such as water, land, atmosphere, and biodiversity. State change also looks at what specific changes have occurred in the ecosystem. Responding to decisions refers to the actions that society and individuals take in response to the negative impacts of tourism activities on the environment. These responses may include improving tourism environmental protection laws and regulations, establishing corresponding organizations, investing in environmental management, setting emission standards for tourism enterprises, and restraining tourism behavior.
The mechanism of interaction between TDC system and the ecological environment system is concerned with achieving the overall coordination between tourism competitiveness enhancement and natural environment improvement. At its core, the mechanism is to drive the growth of the whole national economy through tourism development and to enhance people's tourism experiences while continuously improving the ecological environment. In the mechanism of interaction between tourism competitiveness and ecological environment, human society is the dominant force in regulating the interaction mechanism. Tourism acts on the ecological environment and influences the ecological environment system. Additionally, tourism constantly adapts to the ecological environment in which it is located. The ecological environment provides the material basis and space for tourism development, and at the same time, it restricts the scale and type of tourism development. In the process of interaction between TDC and the ecological environment, government agencies, enterprises, and residents as perceivers and receivers can feel the discordant and irrational aspects of the interaction process. Furthermore, government agencies, tourism enterprises, and community residents, as the makers and implementers of relevant tourism environmental policies, can respond through their behavior (Liu and Hu, 2020). On the basis of these interaction effects between tourism competitiveness system and ecological environment system, and drawing on the Pressure-State-Response (PSR) framework, we constructed a coupled association model of these two systems (Figure 1).
Figure 1
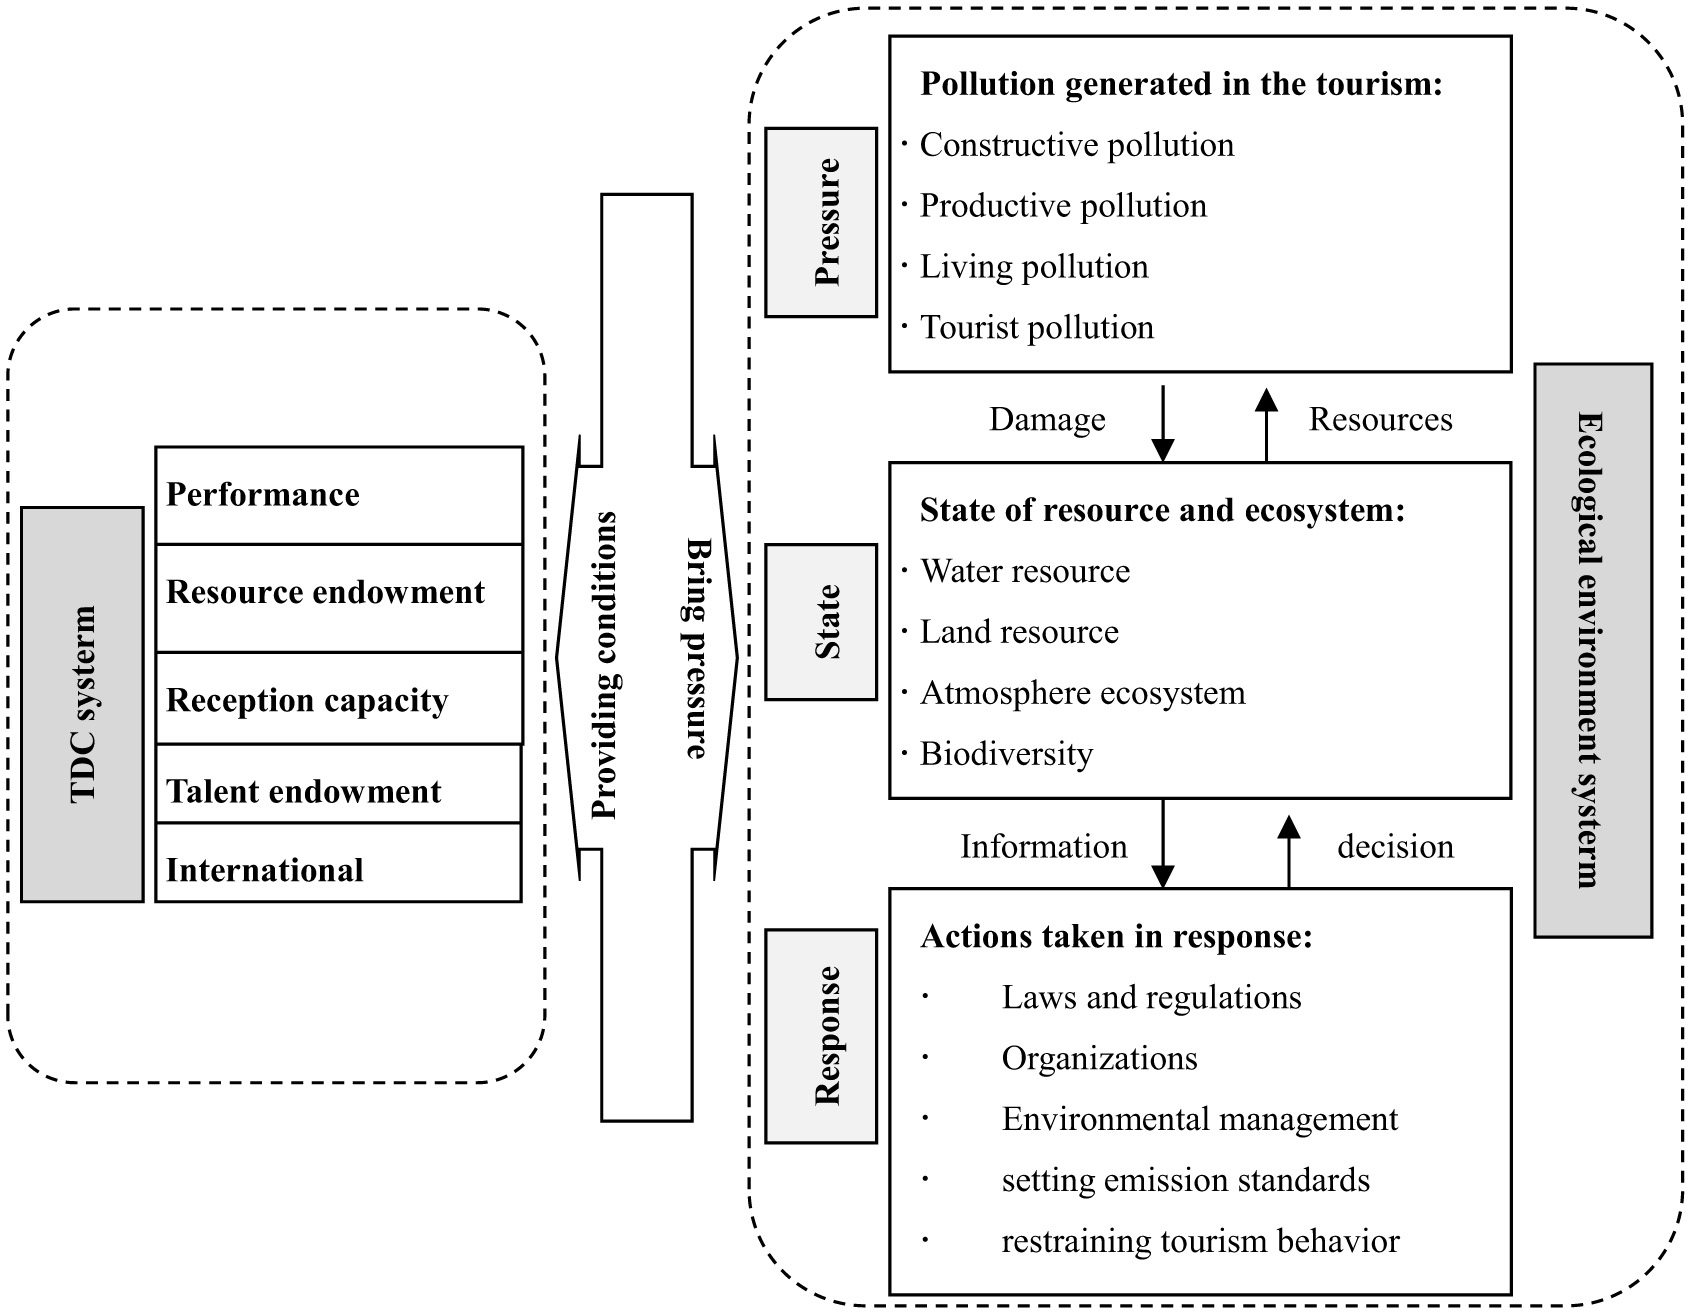
Coupling coordination model for TDC and ecological environment.
3 Study area, methods, and data
3.1 Overview of study area
The coastal region of China was used as the study area (because of data limitations, Hong Kong, Macao, and Taiwan are not included), as shown in Figure 2. This region includes 11 provincial administrative units, including Liaoning, Tianjin, Hebei, Shandong, Jiangsu, Shanghai, Zhejiang, Fujian, Guangdong, Guangxi, and Hainan, and accounts for about 13.6% of the national land area. The total gross domestic product (GDP) of the coastal region in 2023 was 66.57 trillion yuan, and the population reached 636 million people, accounting for 52.5% and 45.1% of the country's GDP and population, respectively. This region is an important economic functional area and population concentration area in China.
Figure 2
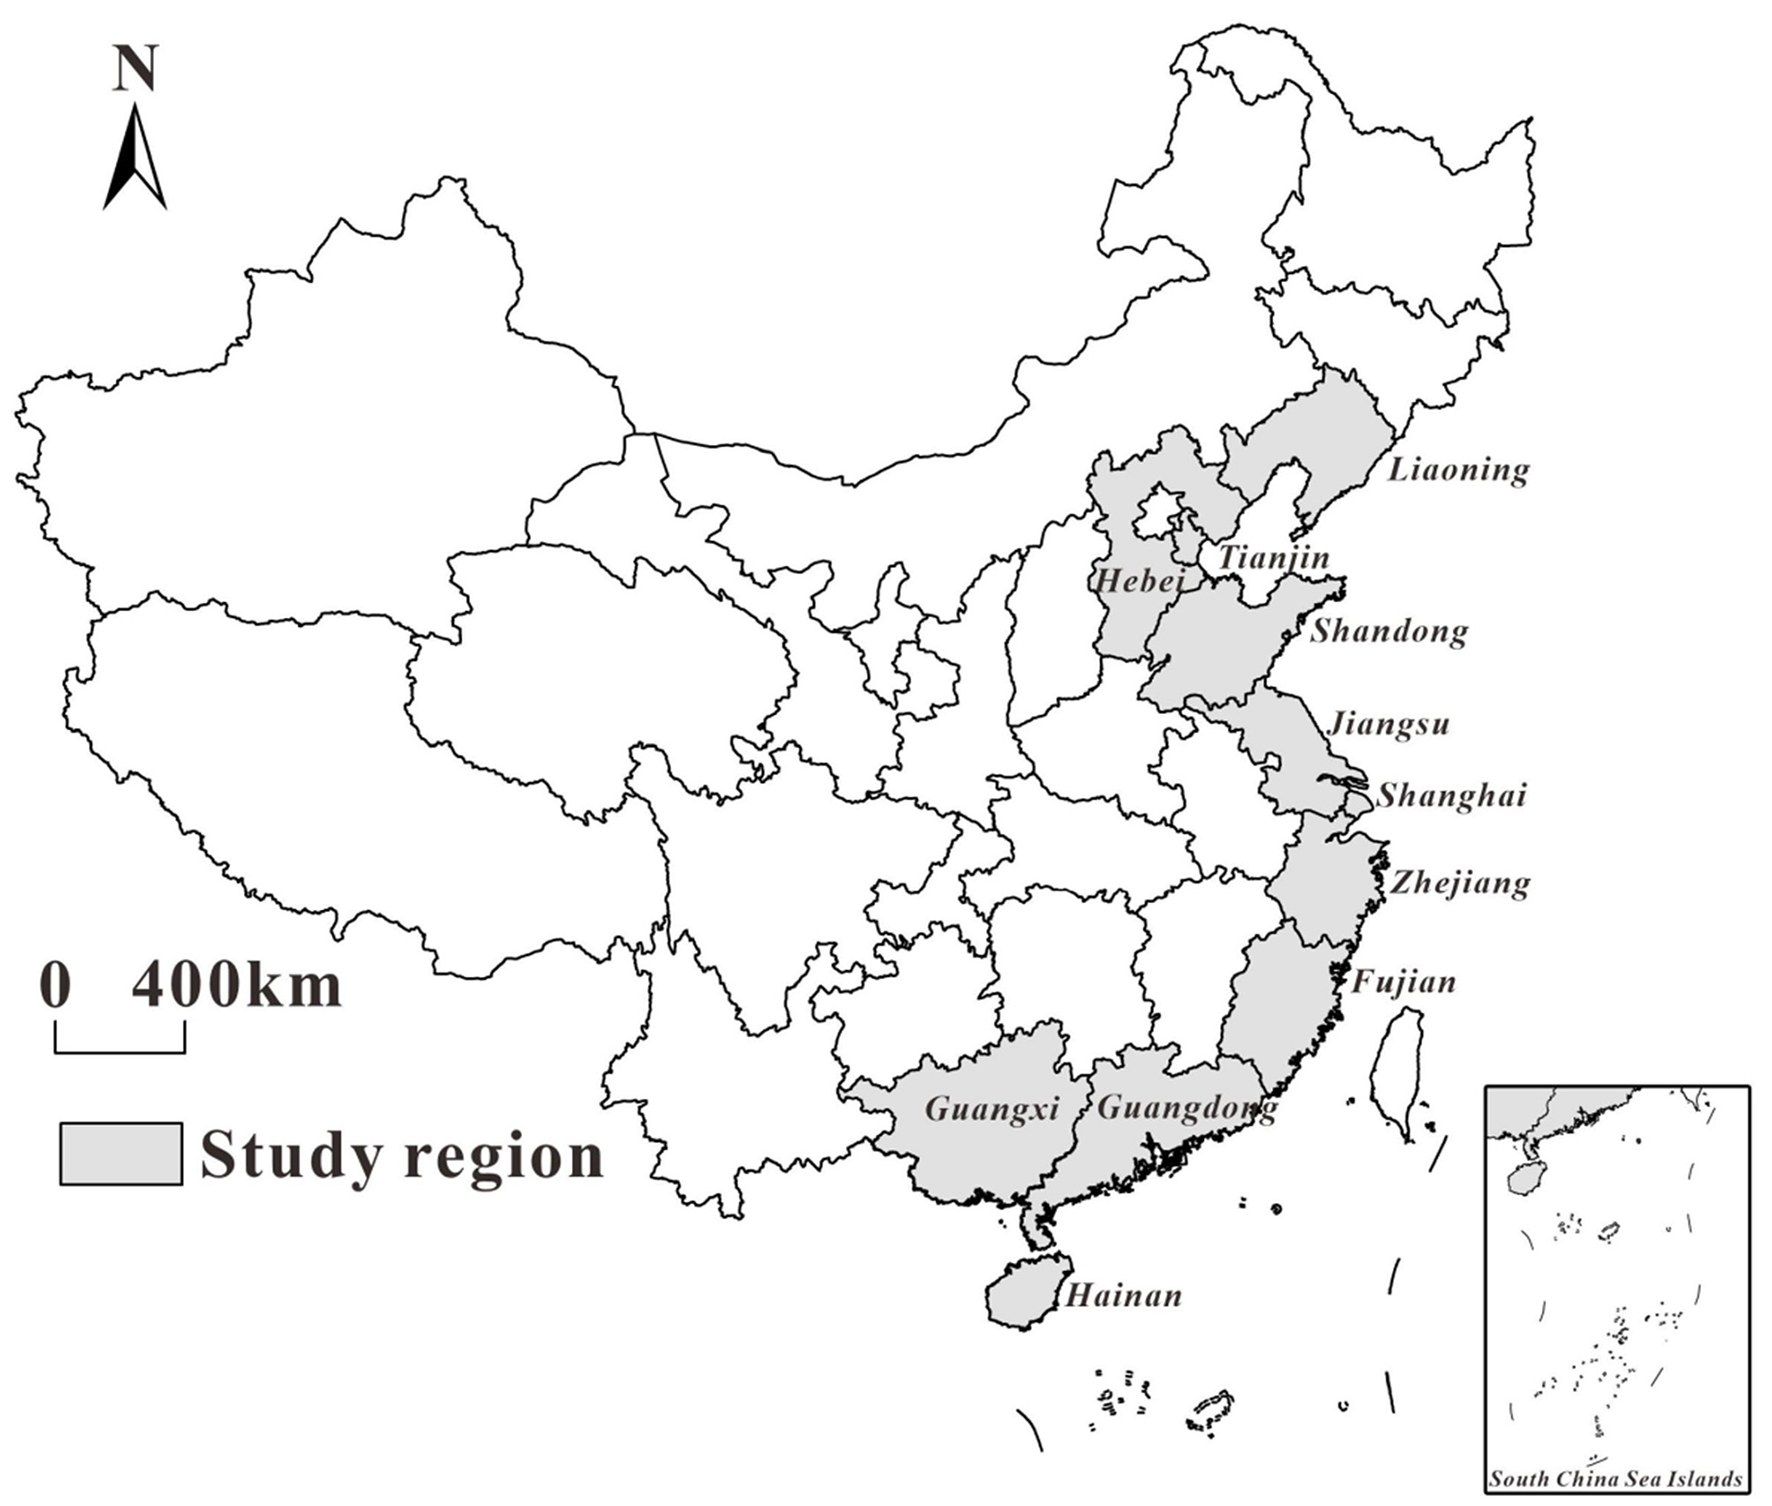
Spatial distribution of China's coastal region.
With the advantage of being located near the sea and given its convenient foreign economic connections, China's coastal region is both the most economically developed region and the fastest growing region in terms of tourism in China. With rich tourism resources, humid climate, high vegetation coverage, good natural ecological landscape and rich historical and humanistic landscape, the coastal region has 123 national nature reserves with an area of 3.035 million hectares in 2023. It received 6.319 billion domestic tourists in 2023, with domestic tourism revenue reaching 8.24 trillion yuan. It also received 75.17 million inbound tourists, generating foreign exchange revenue of US$51.133 billion.
3.2 Indicator system and data sources
3.2.1 Construction of indicator system
Considering the connotation of TDC and related research literature, we constructed an evaluation index system of tourism competitiveness of China's coastal region according to the following five perspectives: tourism performance scale, tourism resource endowment, tourism reception capacity, tourism talent endowment, and tourism internationalization. On the basis of the mechanism of the PSR framework of ecological environment, we divided the ecological environment system into three subsystems and into 12 ecological environment measurement indexes. The indicators system are shown in Table 1.
Table 1
| System | Subsystem | Index | Code | Weight |
|---|---|---|---|---|
| TDC | Tourism performance scale | Number of domestic tourists | TP1 | 0.067 |
| Domestic tourism revenue | TP2 | 0.072 | ||
| Total tourism revenue | TP3 | 0.066 | ||
| Number of total tourists | TP4 | 0.067 | ||
| Tourism resource endowment | Proportion of senior scenic spota | TR1 | 0.041 | |
| Resource densityb | TR2 | 0.053 | ||
| Average tourist number in the scenic spots | TR3 | 0.060 | ||
| Average revenue in the scenic spots | TR4 | 0.033 | ||
| Tourism reception capacity | Number of star-rated hotels | TS1 | 0.040 | |
| Average employees in star-rated hotels | TS2 | 0.041 | ||
| Rental rate of star-rated hotel rooms | TS3 | 0.035 | ||
| Number of tourists received by travel agencies | TS4 | 0.028 | ||
| Number of employees in travel agencies | TS5 | 0.056 | ||
| Tourism talent | Number of tourism colleges | TT1 | 0.060 | |
| Number of students in tourism colleges | TT2 | 0.049 | ||
| Tourism internationalization | Number of inbound tourists | TI1 | 0.049 | |
| Foreign exchange earnings | TI2 | 0.072 | ||
| Number of top 100 international travel agencies | TI3 | 0.068 | ||
| Number of foreign-funded star-rated hotels | TI4 | 0.041 | ||
| Ecological environmental system | Ecological environment pressure | Volume of Sulfur dioxide discharged per 10,000 yuan | EP1 | 0.032 |
| Volume of waste water discharged per 10,000 yuan | EP2 | 0.028 | ||
| Per capita water consumption | EP3 | 0.087 | ||
| density of population | EP4 | 0.058 | ||
| Ecological environment state | Per capita park green area | ES1 | 0.094 | |
| Per capita amount of water resource | ES2 | 0.131 | ||
| Per capita forest area | ES3 | 0.134 | ||
| Area proportion of nature reserves | ES4 | 0.117 | ||
| Ecological environment response | Per capita investment in the treatment of environmental pollution | ER1 | 0.081 | |
| Per capita treatment capacity for wastes treatment | ER2 | 0.066 | ||
| Per capita investment completed in the treatment of waste water | ER3 | 0.085 | ||
| Investment completed in the treatment of industrial pollution | ER4 | 0.087 |
The indicator system and weight of tourism competitiveness and ecological environment.
aSenior scenic spots includes 3 A-grade, 4 A-grade and 5 A-grade scenic spots, which adopted the standards set by China.
bResource abundance is expressed by the number of senior scenic spots per 104 Km2.
3.2.2 Data sources
The selected study population included 11 provinces along the coastal region of China, and the sample years were 2005, 2010, 2015, and 2020. Most of the data came from the provincial statistical yearbooks and the official website of the National Bureau of Statistics database (https://data.stats.gov.cn/index.htm); the tourism industry competitiveness data came from the China Tourism Industry Statistical Yearbook (National Bureau of Statistics of China, 2006/2011/2016/2021a); and environmental data came from the China Environmental Statistical Yearbook (National Bureau of Statistics of China, 2006/2011/2016/2021b) and the China Energy Statistical Yearbook (National Bureau of Statistics of China, 2006/2011/2016/2021c). Some of the missing data were completed by linear regression fitting.
3.3 Methods and models
3.3.1 Entropy weight method
The entropy weight method is an objective assignment of evaluation method. The weight of an evaluation index depends on the degree of variability of the index value, which eliminates artificial factors and subjectivity in evaluation to a certain extent (Li et al., 2021). The greater the degree of variability, the greater the weight, reflecting the relative importance among the indicators. In this paper, the entropy weight method was used to measure the tourism competitiveness and ecological environment level of China's coastal region from 2005 to 2020, and the specific weights of each indicator are shown in Table 1.
3.3.2 Center of gravity (CG) analysis model
We studied the spatiotemporal evolutionary path of tourism competitiveness using the CG analysis. The CG in geography refers to the equilibrium point of the value of a certain attribute within a certain region (Li et al., 2014; Bui et al., 2020). Assuming that a region consists of n subregions i, the CG of an attribute of the region can be calculated according to the following equation:
where X' and Y' denote the latitude and longitude of the CG of a specific attribute in a specific region; Xi and Yidenote the latitude and longitude of the CG of the ith subregion; and Wi is the value taken for the specific attribute corresponding to region i, which in this study, is the tourism competitiveness index of each province. The latitude and longitude of each province are based on the latitude and longitude of the provincial capital city, and the data of this latitude and longitude were obtained using Google Maps queries.
3.3.3 Coupled coordination degree (CCD) model
CCD, which is an indicator to measure the coordination between systems, is widely used in social sustainable development studies, such as the degree of interaction and coordination between different systems and their elements (Shao et al., 2021; Zhang et al., 2022; Qiang et al., 2022). Drawing on the studies from the related literature (Wang et al., 2015; Cheng et al., 2020), this study constructed a CCD model of TDC system and ecological environment system to examine the spatiotemporal evolution characteristics of the coupled coordination development of tourism competitiveness and ecological environment in the coastal region of China. The specific model equation is as follows:
where C is the coupling degree of TDC system and ecological environment system. Its value range is between 0 and 1, which is proportional to the degree of interaction between the two systems. U1 and U2 are TDC system and ecological environment system, respectively. To avoid the situation in which TDC system and ecological environment system values are low at the same time, but the coupling degree is high, the CCD model is introduced, which is the letter D. The value range is [0,1]. The higher the value, the more closely tourism competitiveness and ecological environment system promote each other and coordinate with each other; conversely, the lower value means the system coordination is poor. T is the comprehensive coordination index of tourism competitiveness and ecological environment, reflecting the impact of the overall development of the two on coordination degree; α and β are coefficients to be determined. Because the degree of mutual promotion and relative importance of the two systems are different, the development of tourism certainly will have an impact on the ecological environment. Changes in the ecological environment, however, are the result of many social and economic activities combined. Therefore, on the basis of communication with several experts, α and β were assigned to 0.4 and 0.6, respectively.
Referring to the related research results (Zhang et al., 2013; Vuković, 2022) and in the context of the reality of this study, we classified the coupling degree and CCD into six types. We also compared the development indices (U1/U2) of the two subsystems to establish the relationship determination characteristics of the two subsystems. The final results are shown in Table 2.
Table 2
| Coupling degree | Coupling level | CCD | Level |
|---|---|---|---|
| C = 0 | Disordered stage | 0 ≤ D ≤ 0.2 | Severe dis-coordination |
| 0 < C ≤ 0.3 | Low coupling stage | 0.2 < D ≤ 0.3 | Moderate dis-coordination |
| 0.3 < C ≤ 0.5 | Antagonic stage | 0.3 < D ≤ 0.4 | Mild dis-coordination |
| 0.5 < C ≤ 0.8 | Running-in stage | 0.4 < D ≤ 0.5 | Primary coordination |
| 0.8 < C < 1 | High coupling stage | 0.5 < D ≤ 0.7 | Intermediate coordination |
| C=1 | Extreme coupling stage | 0.7 < D ≤ 1 | High-quality coordination |
| Development indices | Relationship determination characteristics | ||
| 0 < U1/U2 ≤ 0.3 | TDC lags seriously | ||
| 0.3 < U1/U2 ≤ 0.6 | TDC lags moderately | ||
| 0.6 < U1/U2 ≤ 0.9 | TDC lags slightly | ||
| 0.9 < U1/U2 ≤ 1.2 | Basically synchronous | ||
| 1.2 < U1/U2 ≤ 1.5 | TDC slightly ahead | ||
| 1.5 < U1/U2 ≤ 1.8 | TDC far ahead | ||
Classification and discrimination criteria of CCD.
4 Analysis of results
4.1 Spatiotemporal evolutionary characteristics of tourism competitiveness in coastal region of China
The level of tourism competitiveness of China's coastal region from 2005 to 2020 has demonstrated the following evolutionary characteristics (Figure 3)
-
The overall tourism competitiveness of China's coastal region is on the rise. As can be seen from Figure 3, the average value of the coastal region tourism competitiveness index increased from 0.21 in 2005 to 0.39 in 2020, indicating that in recent years, with the economical development of China's coastal region, the provinces have improved the overall level of the tourism economy by integrating regional tourism resources, improving regional supporting facilities, innovating tourism products and formats, cultivating regional tourism brands, and broadening the market scope. The deepening of China's openness to the outside world, especially the successive Beijing Olympic Games, Shanghai World Expo, and Guangzhou Asian Games, showcased China's new image and promoted the growth of more inbound tourists. China's GDP per capita exceeded US$10,000 in 2020, which greatly enhanced the share of China's domestic tourism market and outbound tourism market. In addition, the domestic tourism market has diversified from a single focus on sightseeing and visiting relatives to include folklore tourism, ecotourism, sports tourism, photography tourism, and meditation tourism (Fu et al., 2019). This diversification, in turn, has promoted the transformation and upgrading of tourism destinations and triggered structural changes on the supply side of tourism. In short, tourism has entered a new normal characterized by new demand, new supply, and new business models (Zhang et al., 2019; Huang and Lu, 2015).
-
The tourism competitiveness of different provinces shows their variable characteristics, and the overall gap is widening. The coefficient of variation of tourism competitiveness in the coastal region has increased year by year, indicating that the overall dispersion is expanding, and the gap of tourism competitiveness between different provinces is widening. The difference between the highest and lowest provinces in the tourism competitiveness index increased from 0.32 in 2005 to 0.5 in 2020. With reference to the changes in the tourism competitiveness ranking of each province, the provinces can be divided into three types: (1) Robust type, including Guangdong, Zhejiang and Hainan, whose ranking remains basically unchanged; (2) Growth type, including Hebei, Shandong, Jiangsu, Fujian, and Guangxi, whose provinces have rich tourism resources, or faster economic growth levels, thus guaranteeing tourism infrastructure investment, which is the reason for the faster increase in tourism competitiveness of these provinces; and (3) Lagging type, including Liaoning, Tianjin, and Shanghai, among which the overall economic growth of Liaoning Province is slowing down, and the latter provinces are relatively less rich in tourism resources because of their smaller administrative scope and limited tourism reception scale, which has limited further improvements in the tourism competitiveness of these provinces.
-
Comparison of the dimensions of tourism competitiveness in different provinces (
Table 3):
① In terms of tourism performance competitiveness, all of the provinces have shown different degrees of improvement. Among them, Jiangsu, Shandong, Guangxi, Guangdong, and Zhejiang witnessed fastest increase in tourism performance competitiveness, all more than 0.2; followed by Fujian, Hebei, and Liaoning, with the value exceeding 0.1; and Tianjin, Shanghai, and Hainan have a smaller administrative and a limited tourism carrying capacity, so their tourism scale has been slow to improve, with the value of < 0.1.
② In terms of tourism resources competitiveness, Shanghai, Jiangsu, and Hainan have witnessed the most obvious improvement, all more than 0.1. Among them, Shanghai mainly has higher indicators of tourism resources grade and tourism resources abundance than other provinces and cities, that is, the proportion of Shanghai has an advantage over other provinces and cities in terms of high-grade tourism scenic spots and the coverage rate of A-class scenic spots; and Jiangsu and Hainan mainly have higher indicators of average tourist reception of A-class scenic spots and average business income of A-class scenic spots than other provinces and cities.
③ In terms of the competitiveness of tourism service and reception, the provinces have followed a trend of polarization. As for Jiangsu and Shanghai in the Yangtze River Delta region and Guangdong, the core area of the Pearl River Delta region, and Fujian and Hainan, the values are on the rise, whereas the values of tourism service and reception competitiveness in the northern coastal region have all decreased. With improvements in the market economy level and the extensive opening up of China's southeastern coastal region to the outside world, the tourism service and reception capacity has made significant progress, and the gap between the tourism modernization level in China's southeastern coastal region and that in the northern coastal region gradually has widened.
④ In terms of tourism technical personnel competitiveness, Guangdong, Jiangsu, and Zhejiang have witnessed significant growth, and numerous tourism colleges and universities have provided abundant high-level talent resources for tourism development. Liaoning is the only province with negative growth in talent competitiveness index. Along with the slowdown of economic growth in the northeast, educational resources have been affected, and brain-drain has increased (Qi et al., 2017). These effects have limited the long-term sustainable development of tourism and have become important reasons for the continuous backward movement of Liaoning's tourism competitiveness ranking.
⑤ In terms of tourism international competitiveness, Guangdong, Shandong, and Fujian are the fastest growing provinces. Another notable phenomenon is that the eastern coastal region, with the exception of Tianjin, generally shows positive growth in the tourism international competitiveness index. Because of the continuous promotion of the Belt and Road, the areas along this route have become hotspots for Sino-foreign trade and economic development. Along with the increase in trade and commerce, the scale of inbound tourism, mainly business tourism and casual tourists, is becoming higher and higher (Fu et al., 2019).
-
The spatial pattern of tourism competitiveness in China's coastal region is becoming more prominently “high in the south and low in the north.” The spatial analysis of the tourism competitiveness of China's coastal region was completed using ArcGIS software to generate Figure 4. The figure shows that the spatial structure of tourism competitiveness in coastal provinces follows two patterns. One structural characteristic is the conversion from “single nucleus” to “dual nuclei.” In 2005, the tourism competitiveness of Guangdong Province was higher than that of other provinces and cities and was in the first level. Other provinces and cities belong to the second to the fifth levels of tourism competitiveness. This single-nucleus structure has tilted the entire development CG toward the south-central region, which has not neem conducive to the spatially balanced development of tourism competitiveness in the coastal region. In 2020, the tourism competitiveness of Guangdong Province maintained an obvious advantage, and the tourism industry of Jiangsu Province developed rapidly, and its tourism competitiveness was upgraded to the first level, forming a north-south dual-nuclei structure with the Guangdong. This structure has been conducive to improvements in the tourism competitiveness in the northern region and to the formation of a more balanced spatial pattern. The second structural characteristic is the further strengthening of the overall “strong in the south and weak in the north” in terms of tourism competitiveness. As shown in Figure 4, tourism competitiveness among the southern provinces and cities has increased to the third level or higher, whereas the northern areas (except for Shandong) have remained below the fourth level. Liaoning Province has even seen a decreasing trend of tourism competitiveness since 2015. The coastal region has shown obvious characteristics of the north-south divergence pattern. As shown in Figure 5, the CG of tourism competitiveness in the coastal region as a whole has shifted to the southwest.
Figure 3
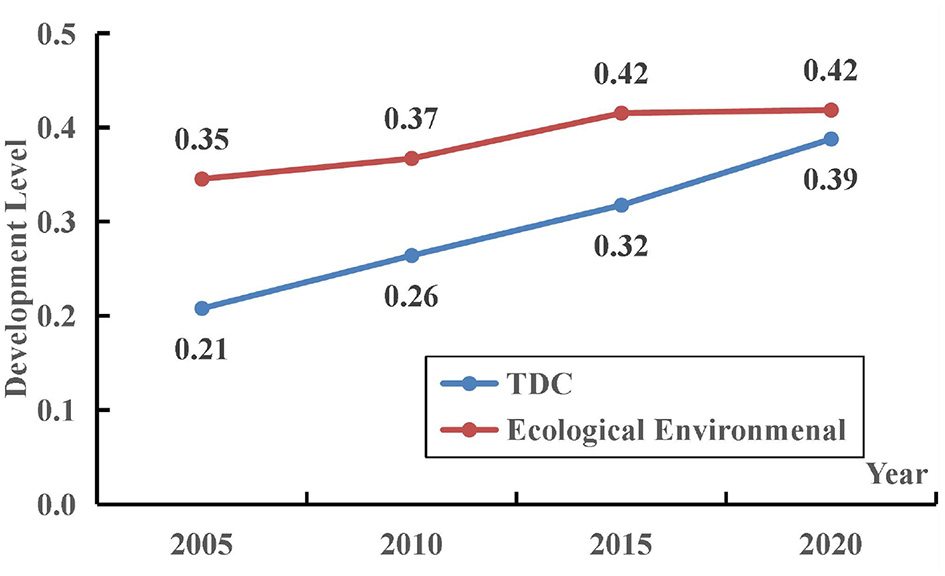
Dynamic evolution of the development level in TDC and ecological environment in coastal areas of China.
Table 3
| Region | Performance scale | Resource endowment | Reception capacity | Talent endowment | Internationalization | |||||
|---|---|---|---|---|---|---|---|---|---|---|
| 2005 | 2020 | 2005 | 2020 | 2005 | 2020 | 2005 | 2020 | 2005 | 2020 | |
| Liaoning | 0.018 | 0.122 | 0.044 | 0.040 | 0.060 | 0.035 | 0.042 | 0.026 | 0.012 | 0.038 |
| Hebei | 0.013 | 0.140 | 0.007 | 0.035 | 0.058 | 0.043 | 0.023 | 0.035 | 0.002 | 0.008 |
| Tianjin | 0.014 | 0.074 | 0.063 | 0.082 | 0.054 | 0.019 | 0.001 | 0.007 | 0.007 | 0.003 |
| Shandong | 0.027 | 0.241 | 0.055 | 0.063 | 0.080 | 0.069 | 0.051 | 0.054 | 0.021 | 0.064 |
| Jiangsu | 0.014 | 0.263 | 0.077 | 0.113 | 0.077 | 0.105 | 0.040 | 0.058 | 0.031 | 0.044 |
| Shanghai | 0.026 | 0.066 | 0.108 | 0.147 | 0.097 | 0.099 | 0.013 | 0.016 | 0.059 | 0.074 |
| Zhejiang | 0.028 | 0.209 | 0.076 | 0.075 | 0.082 | 0.077 | 0.025 | 0.046 | 0.038 | 0.049 |
| Fujian | 0.011 | 0.148 | 0.050 | 0.074 | 0.053 | 0.057 | 0.023 | 0.029 | 0.023 | 0.060 |
| Guangdong | 0.028 | 0.213 | 0.077 | 0.096 | 0.115 | 0.127 | 0.051 | 0.070 | 0.147 | 0.172 |
| Guangxi | 0.009 | 0.224 | 0.040 | 0.052 | 0.052 | 0.036 | 0.020 | 0.031 | 0.014 | 0.020 |
| Hainan | 0.005 | 0.019 | 0.075 | 0.110 | 0.040 | 0.057 | 0.014 | 0.023 | 0.003 | 0.009 |
Evaluation of tourism competitiveness in coastal areas of China by dimension.
Figure 4
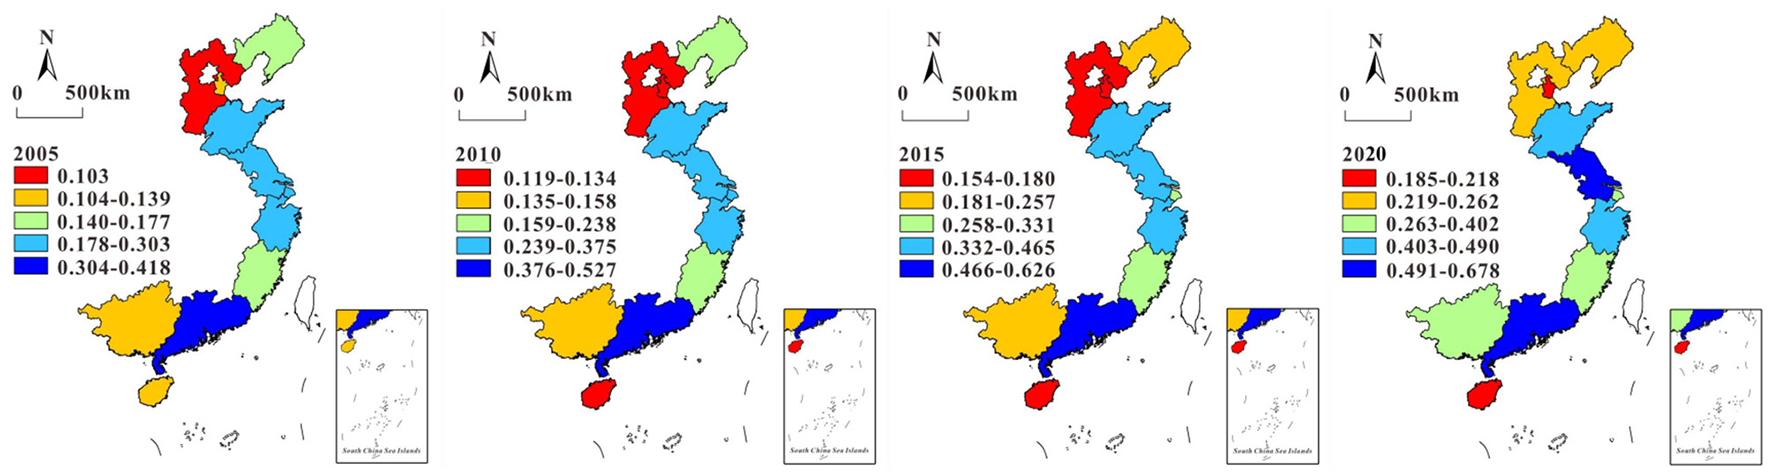
The spatial pattern of tourism competitiveness in China's coastal region.
Figure 5
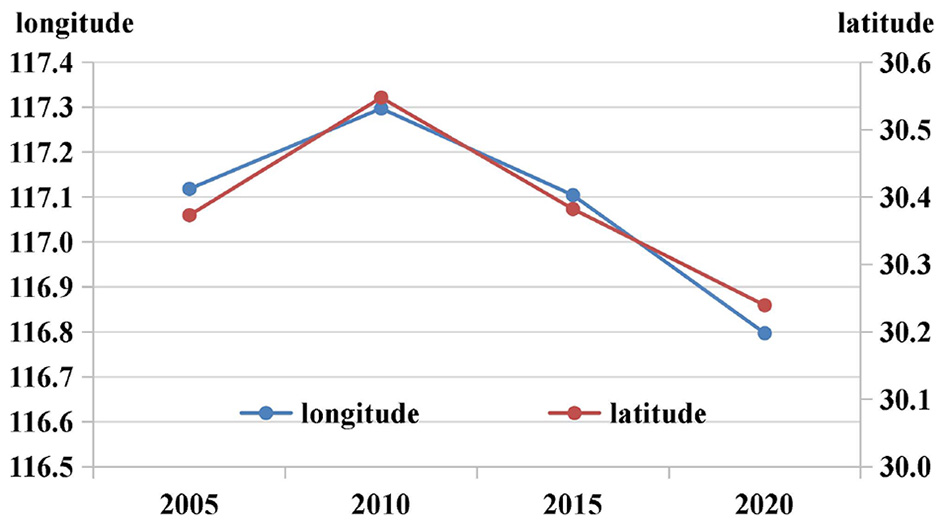
Evolution of the gravity center of tourism competitiveness in coastal areas of China.
4.2 Ecosystem evolutionary characteristics of China's coastal region
The ecological environment of China's coastal region from 2005 to 2020 has demonstrated the following evolutionary characteristics:
-
The overall ecological environment of coastal region has tended to improve.
According to Table 4, the average value of the ecological environment index in the coastal region is basically increasing year by year, and the coefficient of variation is decreasing. This trend shows that the overall ecological environment in the coastal region has gradually become better, and the gap between provinces is also becoming smaller. As the most developed economic zone in China, the coastal region has begun to explore the circular economy model while growing economically. It has gradually reduced the negative impact of the economy on the environment (i.e., reducing the consumption of resources and energy) and has increased its investment in environmental management, thus improving the urban habitat and gradually realizing the high-quality development of the region. As shown in Figure 6, the ecological response index and ecological state index of the coastal region both increased after 2010, indicating that the per capita investment in environmental management and management capacity have been significantly improved, and obvious results have been achieved. For instance, the indicators characterizing the habitat environment, such as the per capita park green space, water resources, forest area, and the proportion of nature reserve areas have improved significantly.
-
The spatial evolution pattern of the ecological environment in the coastal region is “high in the south and low in the north” (Figure 7). The spatial pattern of the ecological environment in coastal region has gradually changed from the initial low level of relative equilibrium to a high level of north-south divergence. In 2020, taking the Yangtze River as the boundary, the ecological environment indicators in the southern coastal region were above 0.35, whereas the ecological environment quality in the northern region was < 0.35. From the decomposition of the ecological environment pressure, state, and response indexes in 2005 and 2020 (Figure 8), the pressure indexes of all coastal areas in China increased, which indicated that the overall ecological environment remained under continuous pressure. The pressure indexes in all China's coastal areas have increased, indicating that the overall ecological environment remained under continuous pressure. In addition, the pressure index is high across the northern area. One of the important stress factors is the severe shortage of water resources. The industrial structure type of heavy chemical industries in the north has intensified the consumption of water resources and increased wastewater emissions. As for the status index, the value of this index is generally higher in the southern coastal region than in the northern region, and the amount of water resources per capita and forest area per capita generally are better than those in the northern coastal region. As for the response index, the coastal region basically follows a balanced pattern, with increased values in Shanghai, Jiangsu, Zhejiang, Guangdong, Shandong, and Hainan, whereas the response index of Liaoning, Hebei, and Tianjin in the northern area has decreased. Overall, the southern area is better than the northern area in terms of investment in environmental management and improvements in the human living environment.
Table 4
| Region | 2005 | 2010 | 2015 | 2020 |
|---|---|---|---|---|
| Liaoning | 0.397 | 0.376 | 0.396 | 0.416 |
| Hebei | 0.249 | 0.293 | 0.355 | 0.343 |
| Tianjin | 0.432 | 0.363 | 0.392 | 0.346 |
| Shandong | 0.300 | 0.344 | 0.392 | 0.412 |
| Jiangsu | 0.246 | 0.267 | 0.326 | 0.323 |
| Shanghai | 0.203 | 0.224 | 0.314 | 0.378 |
| Zhejiang | 0.331 | 0.366 | 0.467 | 0.467 |
| Fujian | 0.482 | 0.435 | 0.487 | 0.466 |
| Guangdong | 0.340 | 0.383 | 0.424 | 0.465 |
| Guangxi | 0.345 | 0.446 | 0.509 | 0.480 |
| Hainan | 0.476 | 0.542 | 0.506 | 0.507 |
| Standard deviation | 0.089 | 0.084 | 0.066 | 0.060 |
Ecological environment index of coastal areas.
Figure 6
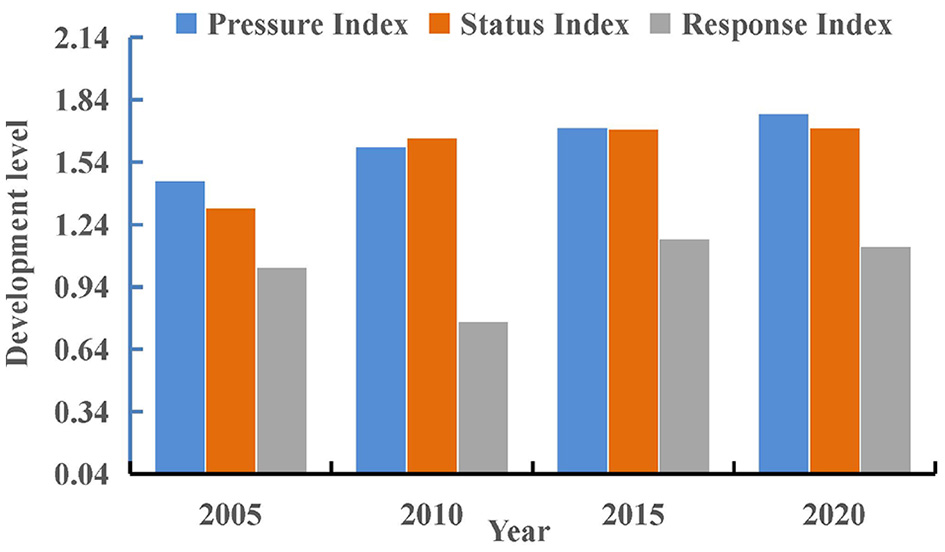
Evolution of ecological environmental PSR indices in coastal areas.
Figure 7
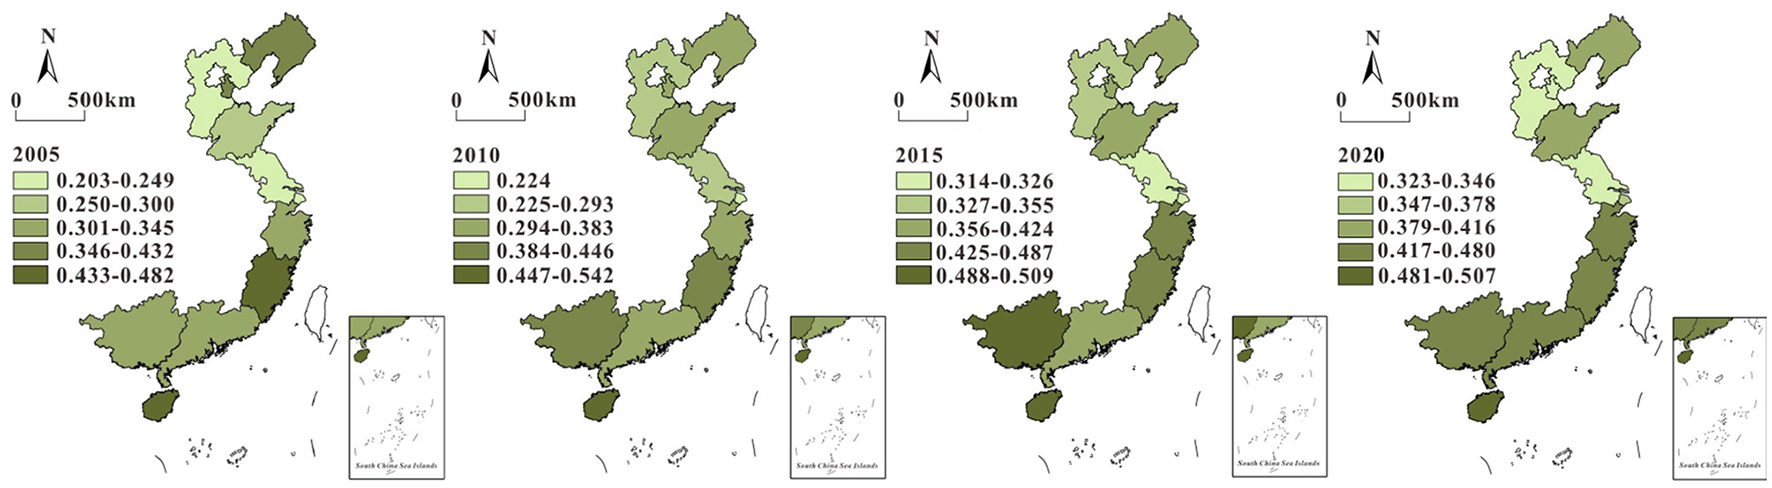
Spatial pattern evolution of ecological environment in China's coastal areas.
Figure 8

Evolution of PSR index of ecological environment in coastal areas of China.
4.3 Spatiotemporal characteristics of coupled coordination relationship between tourism competitiveness and ecological environment in coastal region of China
4.3.1 Timing characteristics of coupled coordination relationship
According to Table 5, the coupling degree from 2005 to 2020 was antagonistic. Although the value gradually increased, the coupling degree increased very little (only 0.016). This result shows that the interaction between the tourism competitiveness system and the ecological environment system was strengthened continuously, but the effect has been limited and has not yet shown benign coupling characteristics. At the same time, the CCD also increased, with 2010 being the turning point, changing from the stage of mild dis-coordination to the stage of low coordination. The numerical characteristics of U1 and U2show that the tourism competitiveness and the level of ecological environment in the coastal region both improved gradually, and the coordination degree between the two systems increased and began moving to a state of coordination based on higher numerical values. By comparing the determination characteristics of the relationship between U1 and U2, we found that the development level of tourism competitiveness in the coastal region lagged behind the ecological environment level, but the former developed significantly faster than the latter. In addition, the gap between the two gradually decreased and reached a state of basic synchronization in 2020.
Table 5
| Year | U 1 | U 2 | C | D | CCD level | U 1/U2 | Relationship determination |
|---|---|---|---|---|---|---|---|
| 2005 | 0.208 | 0.345 | 0.484 | 0.375 | Mild disorder | 0.602 | TDC lags moderately |
| 2010 | 0.264 | 0.367 | 0.493 | 0.401 | Primary coordination | 0.720 | TDC lags slightly |
| 2015 | 0.318 | 0.415 | 0.496 | 0.432 | Primary coordination | 0.765 | TDC lags slightly |
| 2020 | 0.388 | 0.419 | 0.500 | 0.451 | Primary coordination | 0.927 | Basically synchronous |
The coupling and coordination between TDC and ecological environment in China's coastal areas.
4.3.2 Spatial evolution of coupled coordination relationship
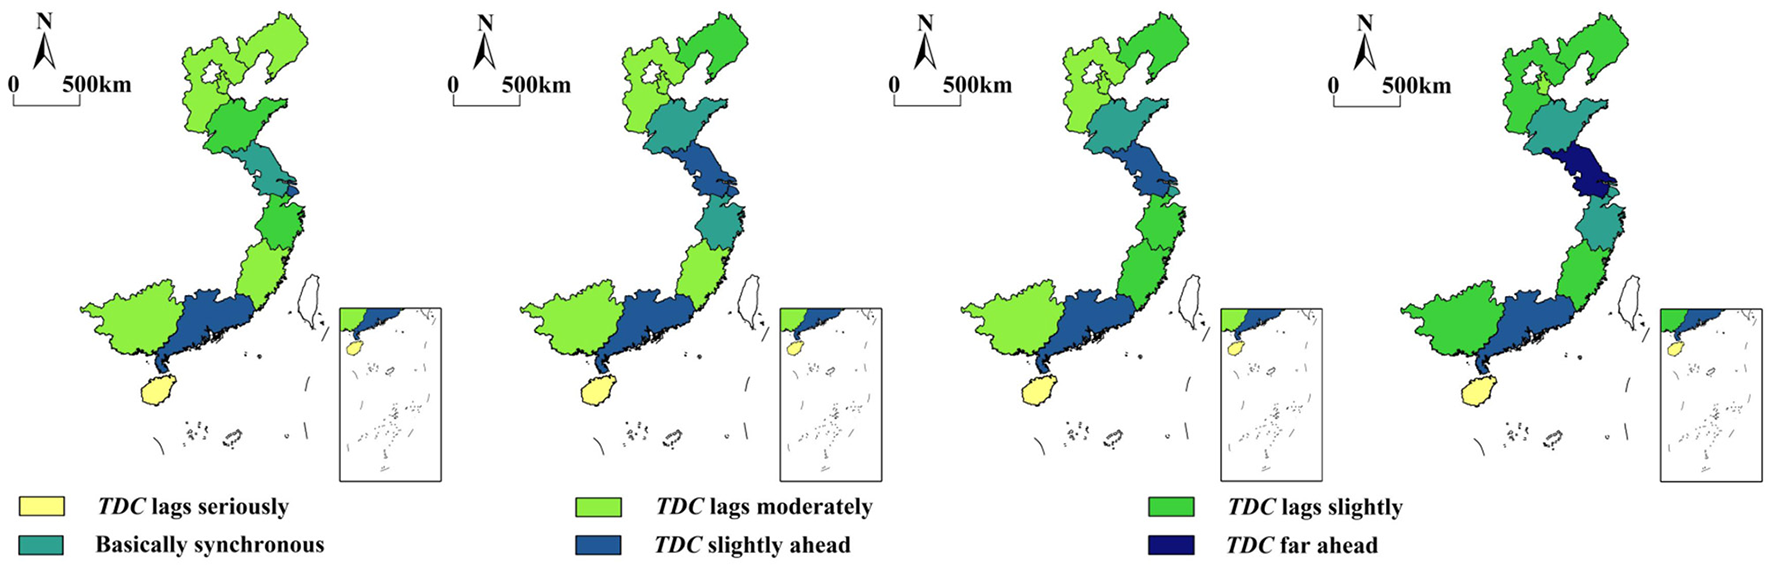
The coupling degree and CCD of tourism competitiveness and ecological environment in the coastal areas of China revealed some spatial differences, and the overall trend followed a steady increase (Figure 9). The coupling degree values ranged from 0.413 to 0.500, which were all antagonistic. Shandong and Zhejiang are the areas with high values of coupling degree, and the growth has been stable, which indicated that the degree of mutual influence and interaction between tourism competitiveness and ecological environment of the two areas gradually increased. The CCD values ranged from 0.295 to 0.520, including four levels of moderate dis-coordination, mild dis-coordination, primary coordination, intermediate coordination. The CCD in each area has increased gradually. Specifically, in 2005, nine provinces and cities in the coastal areas had a coupled coordination level of mild dis-coordination, Hebei had a moderate dis-coordination, and Guangdong had a primary coordination. In 2020, only two provinces and cities in the coastal region had a coupled coordination level of mild dis-coordination, nine provinces and cities rose to primary coordination, and Guangdong Province was upgraded to an intermediate coordination level. According to these results, the TDC system and ecological environment system of each area have promoted each other and have coordinated with each other to an increasing degree. Spatially, the CCD followed a pattern characteristic of tending to be obviously high in the south and low in the north, with the CCD in the southern coastal areas above the fourth level, whereas in the north, Liaoning, Hebei, and Tianjin below the third level. To summarize the previous analysis, the level of tourism competitiveness and ecological environment in the northern coastal region is also lower than that in the southern coastal region, belonging to the low level of system development and low level of coupled coordination, and the two systems are far from achieving benign coupling. The numerical comparison between the two systems in Figure 10 shows that the areas where the development of tourism competitiveness is ahead of that of the ecological environment have increased from three in 2005 to five in 2020. The development of tourism competitiveness in Jiangsu is significantly ahead of the ecological environment, and Guangdong is mildly ahead, which has indicated that the two areas belong to the tourism industry-driven type in the process of mutual promotion and coordinated development of the system (i.e., the development of tourism leads to further improvements in the ecological environment).
Figure 9
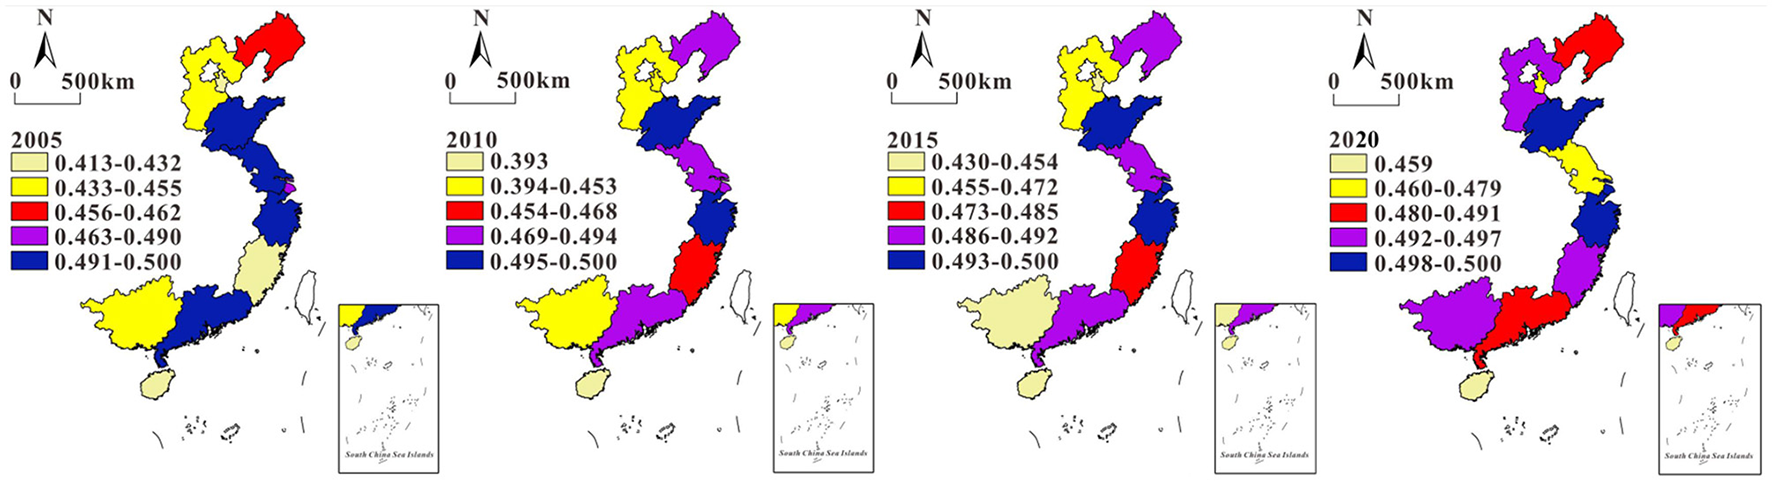
Temporal and spatial evolution characteristics of the CCD between TDC and ecological environment in coastal areas of China.
Figure 10
The numerical comparison relationship between the two systems.
5 Conclusions
This study is based on the panel data of 11 provinces and cities along the coast of China from 2005 to 2020. Through the entropy weight method, the gravity center analysis model, and the CCD model, it systematically reveals the spatiotemporal evolution characteristics and interaction relationships between tourism competitiveness and the ecological environment. The main conclusions are as follows:
-
(1) The temporal and spatial differentiation of tourism competitiveness is remarkable, presenting a pattern of “higher in the south and lower in the north, led by a dual-core.” The tourism competitiveness of China's coastal areas as a whole shows an upward trend, but the regional differences are significant, and the polarization between the north and the south has intensified. In the south, the TDC of Guangdong and Jiangsu lead the country, forming a “dual-core”; in the north, only Shandong stands out, and the TDC of Liaoning, Tianjin and other places lags behind. The spatial center of gravity continues to shift to the southwest, indicating that the advantages of southern provinces in dimensions such as the scale of tourism performance and the degree of internationalization are constantly being strengthened, while the north is gradually falling behind in aspects such as service reception capacity and talent endowment.
-
(2) The overall quality of the ecological environment has improved, and the pattern of polarization between the north and the south has become more prominent. By increasing investment in environmental governance, the coastal areas have achieved remarkable results in improving the living environment. The spatial pattern of the ecological environment has gradually changed from a relatively balanced state at a low initial level to a pattern of polarization between the north and the south at a high level. Southern provinces (such as Zhejiang and Fujian) generally have a high ecological status index due to their abundant water resources and the lightening of the industrial structure. The north is limited by the pollution from heavy and chemical industries and the shortage of water resources, and faces greater ecological pressure. The response index in Liaoning, Hebei and other places has even declined. Overall, the southern region is superior to the northern region in terms of investment in environmental governance and the improvement of the living environment.
-
(3) The CCD between TDC and the ecological environment has been steadily increasing, but a benign interaction has not yet been achieved. The coupling degree has been in the “antagonistic” stage for a long time, indicating that the interaction between the two systems is limited. The CCD has been upgraded from mild dis-coordination to primary coordination, and TDC has shifted from “moderate lag” to “basically synchronous,” but it still has not reached the “high-quality coordination.” Spatially, the southern coastal areas (such as Guangdong and Jiangsu) have a relatively high CCD (reaching moderate coordination), presenting the characteristic of “mildly leading in tourism competitiveness,” which reflects the driving effect of the tourism industry on the ecological environment. Most northern provinces are in a state of moderate dis-coordination or mild dis-coordination, reflecting the non-benign interaction between the two systems at a low level.
6 Discussion
-
(1) The driving mechanism of TDC and implications for regional coordination.
The “higher in the south and lower in the north” pattern of TDC in the coastal areas is influenced not only by resource endowments (such as the coastal resources of Hainan and Guangdong, and the cultural resources of Jiangsu), but also closely related to the economic foundation and policy orientation. Southern provinces rely on the economic radiation of the Yangtze River Delta and the Pearl River Delta, and have significant advantages in tourism infrastructure and international operation (such as top 100 travel agencies and foreign-funded hotels). In contrast, Liaoning and Tianjin in the north are limited by the lag in industrial transformation and the outflow of talents, and their competitiveness improvement is weak. In the future, it is necessary to narrow the north-south gap through cross-regional cooperation (such as the integration of tourism in Beijing, Tianjin and Hebei) and the development of differentiated products (such as ice and snow tourism in Northeast China and coastal ecological tourism), and build a coastal tourism pattern of “diversified coordination.”
-
(2) The causes of the north-south differentiation in the ecological environment and the path to sustainable development.
The north-south differences in the ecological environment are essentially differences in development models and governance effectiveness. The south promotes the coordinated development of ecotourism and environmental governance under the guidance of the concept that “lucid waters and lush mountains are invaluable assets.” The north is affected by the dependence on the traditional industrial path, and the environmental pressure continues to increase. It is recommended that Northern provinces accelerate the green transformation of industries and increase investment in ecological protection (such as the joint prevention and control of air pollution in Beijing, Tianjin and Hebei). The south needs to be alert to the ecological load caused by over-development of tourism (such as the control of coastline development), and build a PSR dynamic monitoring system to ensure the two-way promotion of ecological environment quality and tourism development.
-
(3) The deep-seated contradictions in the coupling coordination relationship and optimization strategies.
The current unbalanced state where “the growth rate of TDC is faster than the improvement of the ecological environment” reflects that the expansion of the tourism industry in the coastal areas still relies on resource consumption. Although the CCD has increased to some extent, the benign interaction mechanism still needs to be improved. It is necessary to optimize through the following paths: ① Establishing a tourism ecological compensation mechanism to feedback tourism income into ecological protection; ② Promoting green tourism technologies (such as low-carbon hotels and new energy transportation) to reduce environmental pressure; ③ Strengthening policy coordination, incorporating ecological indicators into the tourism competitiveness evaluation system, and guide local governments to balance development and protection.
-
(4) Research value and future prospects.
This study expands the empirical research on the relationship between tourism competitiveness and the ecological environment, providing theoretical support for the coastal areas to formulate tourism development strategies. In the future, it is possible to further explore: ① Introduce panel data models to quantify the contribution of driving factors; ② Combine remote sensing data for refined spatial analysis of the ecological environment; ③ Predict the potential impact of climate change on the coastal tourism ecosystem, and provide more accurate policy recommendations for regional sustainable development.
The research conclusions have clear policy implications for China's coastal areas. It is necessary to base on the realistic pattern of “higher in the south and lower in the north.” Southern provinces should focus on improving the quality of ecotourism and international development, while northern provinces need to strengthen ecological restoration and make up for the shortcomings of tourism infrastructure. At the same time, all provinces need to promote the evolution of tourism competitiveness and the ecological environment from “low-level coordination” to “benign resonance” through cross-system collaboration (such as the connection between tourism planning and ecological red lines) and cross-regional cooperation (such as the co-construction of tourism ecology in the Guangdong-Hong Kong-Macao Greater Bay Area), and finally achieve high-quality development of the tourism industry.
Statements
Data availability statement
The original contributions presented in the study are included in the article/supplementary material, further inquiries can be directed to the corresponding author.
Author contributions
LL: Conceptualization, Data curation, Formal analysis, Funding acquisition, Methodology, Project administration, Software, Supervision, Validation, Visualization, Writing – original draft, Writing – review & editing. WL: Investigation, Resources, Writing – review & editing.
Funding
The authors declare that financial support was received for the research and publication of this article. This research was supported by the Shandong Social Science Planning Project (22CLYJ23) and High-Level Cultivation Project Fund (2022GSPSJ04).
Conflict of interest
The authors declare that the research was conducted in the absence of any commercial or financial relationships that could be construed as a potential conflict of interest.
Generative AI statement
The author(s) declare that no Gen AI was used in the creation of this manuscript.
Any alternative text (alt text) provided alongside figures in this article has been generated by Frontiers with the support of artificial intelligence and reasonable efforts have been made to ensure accuracy, including review by the authors wherever possible. If you identify any issues, please contact us.
Publisher’s note
All claims expressed in this article are solely those of the authors and do not necessarily represent those of their affiliated organizations, or those of the publisher, the editors and the reviewers. Any product that may be evaluated in this article, or claim that may be made by its manufacturer, is not guaranteed or endorsed by the publisher.
References
1
Amelung B. Student J. Nicholls S. (2016). The value of agent-based modelling for assessing tourism–environment interactions in the Anthropocene. Curr. Opin. Environ. Sust.23, 46–53. doi: 10.1016/j.cosust.2016.11.015
2
Bazargani R. H. Z. Kiliç H. (2021). Tourism competitiveness and tourism sector performance: empirical insights from new data. J. Hosp. Tour. Manag.46, 73–82. doi: 10.1016/j.jhtm.2020.11.011
3
Bui H. T. Jones T. E. Weaver D. B. Le A. (2020). The adaptive resilience of living cultural heritage in a tourism destination. J. Sust. Tour.28, 1022–1040. doi: 10.1080/09669582.2020.1717503
4
Cheng Q. Fang L. (2015). Competitiveness evaluation model and empirical research of cultural tourism creative industry in Yangtze River Delta based on ecological niche. Econ. Geogr.35, 183–189. doi: 10.15957/j.cnki.jjdl.2015.07.027
5
Cheng Y. Li X. T. Sun Y. X. (2020). Evolution characteristics and its influencing factors of industrial ecologicalization in the Coastal Areas of China. Econ. Geogr.40, 133–144. doi: 10.15957/j.cnki.jjdl.2020.09.014
6
Croes R. Ridderstaat J. Shapoval V. (2020). Extending tourism competitiveness to human development. Ann. Tour. Res.80, 1–15. doi: 10.1016/j.annals.2019.102825
7
Cronjé D. F. du Plessis E. (2020). A review on tourism destination competitiveness. J. Hosp. Tour. Manag.45, 256–265. doi: 10.1016/j.jhtm.2020.06.012
8
Dwyer L. Kim C. (2003). Destination competitiveness: determinants and indicators. Curr. Issues Tour.6, 369–414. doi: 10.1080/13683500308667962
9
Fang F. L. Yin L. J. Zhang C. (2013). Construction and empirical analysis of city tourism comprehensive competitiveness assessment model: a case study of sixteen cities in Yangtze River Delta region. Areal Res. Dev.32, 92–97. doi: 10.3969/j.issn.1003-2363.2013.01.018
10
Fu L. Xiong K. N. Gao Y. (2019). Quantitative study on coupling relationship between tourism industry and ecological environment in Karst Area: a case study of Guizhou Province. Ecol. Econ.35, 125–130.
11
Fu Y. X. Hu B. Wang Y. (2012). Research on spatial-temporal evolution of tourism competitiveness in 31 provinces of China. Econ. Geogr.32, 144–149. doi: 10.15957/j.cnki.jjdl.2012.06.024
12
Huang J. F. Lu L. (2015). Production and reconstruction of space of tourism industry in the new normal of economic development. Soc. Sci. Nanjing6, 39–44. doi: 10.15937/j.cnki.issn1001-8263.2015.06.006
13
Huang S. Li Y. L. Dai P. J. (2017). Evaluation of tourism competitiveness of Chinese smart tourism city. Acta Geogr. Sin.72, 242–255. doi: 10.11821/dlxb201702005
14
Lange G. (2015). Tourism in Zanzibar: incentives for sustainable management of the coastal environment. Ecosyst. Serv.11, 5–11. doi: 10.1016/j.ecoser.2014.11.009
15
Li J. Zhao X. P. (1999). Comment on international tourism competitiveness. J. Business Econ.4, 63–65, 68. doi: 10.3969/j.issn.1000-2154.1999.04.019
16
Li L. S. Yang Q. S. Liu H. H. (2014). Relationship between the city location and regional balanced development of Jilin central urban agglomeration. Areal Res. and Dev.33, 25–29+66.
17
Li L. S. Zhao H. B. Guo F. Y. (2021). High-quality development spatio-temporal evolution of industry in urban agglomeration of the Yellow River Basin. Sci. Geogr. Sin.41, 1751–1762. doi: 10.13249/j.cnki.sgs.2021.10.007
18
Li S. J. Wang X. Sui Y. Z. (2017). Evaluation and spatial pattern of urban tourism competitiveness in Shandong Province based on ecological niche theory. Areal Res. Dev.36, 104–109. doi: 10.3969/j.issn.1003-2363.2017.05.019
19
Lin M. S. Liao M. L. Wang K. B. (2018). Evaluation of the competitiveness of national comprehensive tourism destinations. China Popul. Resour. Environ.28, 83–90. doi: 10.12062/cpre.20180520
20
Liu D. L. Wang X. Wu X. G. He J. Duan Z. Y. (2018). Coupling coordination between tourism competitiveness and economic development in global poverty stricken countries and spatiotemporal changes. Progr. Geogr.37, 1381–1391.
21
Liu Y. Z. Hu Z. Y. (2020). Research on the coordination of tourism development and protection coupling of ecological environment based on PSR model: the empirical evidence from Guizhou Province. Ecol. Econ.6, 132–136.
22
Lopes A. P. F. Muñoz M. M. Alarcón-Urbistondo P. (2018). Regional tourism competitiveness using the Promethee approach. Ann. Tour. Res.73, 1–13. doi: 10.1016/j.annals.2018.07.003
23
Ma X. L. Cao X. J. (2013). A study on spatial pattern and formation mechanism of provincial tourism competitiveness. Tour. Sci.27, 14–23. doi: 10.3969/j.issn.1006-575X.2013.02.002
24
Mutana S. Mukwada G. (2018). Mountain-route tourism and sustainability. A discourse analysis of literature and possible future research. J. Outdoor Recreat. Tour.24, 59–65. doi: 10.1016/j.jort.2018.08.003
25
National Bureau of Statistics of China (2006/2011/2016/2021a). The Yearbook of China Tourism Statistics. Beijing: China Statistics Press.
26
National Bureau of Statistics of China (2006/2011/2016/2021b). China Statistical Yearbook on Environment. Beijing: China Statistics Press.
27
National Bureau of Statistics of China (2006/2011/2016/2021c). China Energy Statistical Yearbook. Beijing: China Statistics Press.
28
Poon A. (1993). Tourism, Technology and Competitive Strategies. Wallingford: C.A.B. International. doi: 10.1079/9780851989501.0000
29
Qi W. Liu S. Jin F. J. (2017). Calculation and spatial evolution of population loss in Northeast China. Sci. Geogr. Sin.37, 1795–1804. doi: 10.13249/j.cnki.sgs.2017.12.002
30
Qiang N. Canhe Z. Lei W. Junbo Z. (2022). Using coupled people-gravity coordination as a measurement method and optimization strategy for urban integration: use the Wuhan metropolitan area as an illustration. Trans. Urban Data Sci. Technol.2, 39–55. doi: 10.1177/27541231221140714
31
Ritchie J. R. B. Crouch G. I. (2003). The Competitive Destination: A Tourism Perspective. Wallingford: CABI Publishing. doi: 10.1079/9780851996646.0000
32
Sánchez A. G. (2015). Tourism destination competitiveness: the Spanish Mediterranean case. Tour. Econ.21, 1235–1254. doi: 10.5367/te.2014.0405
33
Sevilla-Sevilla C. Navío-Marco J. Ruiz-Gómez L. (2019). Environment, tourism and satellite technology: exploring fruitful interlinkages. Ann. Tour. Res.83:102841. doi: 10.1016/j.annals.2019.102841
34
Shao H. Q. Wu W. Wang Z. F. (2021). Temporal and spatial coupling coordination of green utilization efficiency of tourism resources and new urbanization in the Yangtze River Economic Belt. Econ. Geogr.41, 204–213. doi: 10.15957/j.cnki.jjdl.2021.08.024
35
Shi Y. Q. Zhong L. S. Chen T. (2014). Evaluation of border tourism competitiveness at the county level in China. Resour. Sci.36, 1133–1141.
36
Shijin W. Yaqiong M. Xueyan Z. Jia X. (2020). Polar tourism and environment change: opportunity, impact and adaptation. Polar Sci.25:100544. doi: 10.1016/j.polar.2020.100544
37
Steiger R. Abegg B. (2013). The sensitivity of austrian ski areas to climate change. Tour. Plann. Dev.10, 480–493. doi: 10.1080/21568316.2013.804431
38
Vuković M. (2022). The application of GIS in sustainable tourism management. Econ. Sust. Dev.6, 53–62. doi: 10.5937/ESD2202053V
39
Wan X. C. Zhong J. Ding M. (2011). On the theory and practice of potential competitiveness evaluation in international tour-ism on the basis of resources and distance. Geogr. Res.30, 827–834. doi: 10.11821/yj2011050006
40
Wang X. Y. Zhu W. L. (2019). Analysis of rural tourism competitiveness and obstacle factors in Shandong Province. Sci. Geogr. Sin.39, 147–155. doi: 10.13249/j.cnki.sgs.2019.01.017
41
Wang Y. (1998). Countermeasures to improve the international tourism competitiveness of China. J. Business Econ.3, 61–63.
42
Wang Y. Ding Z. S. Yu M. J. Shang Z. Y. Song X. Y. Chang X. J. (2015). Quantitative analysis of the coordination relation between modern service industry and urbanization based on coupling model: a case study of Changshu. Geogr. Res.34, 97–108. doi: 10.11821/dlyj201501009
43
Ye L. Chen X. Q. (2013). Analysis on interaction of tourism trade between China and ASEAN countries based on evaluation on tourism competitiveness. Econ. Geogr.33, 177–181. doi: 10.15957/j.cnki.jjdl.2013.12.031
44
Zhang B. Yin J. Jiang H. Qiu Y. (2022). Spatial–temporal pattern evolution and influencing factors of coupled coordination between carbon emission and economic development along the Pearl River Basin in China. Environ. Sci. Poll. Res.30, 6875–6890. doi: 10.1007/s11356-022-22685-7
45
Zhang C. M. Weng S. X. Bao J. G. (2019). The geographical pattern of China's tourism development since the reform and opening-up in 1978. Acta Geogr. Sin.74, 1980–2000. doi: 10.11821/dlxb201910003
46
Zhang H. Q. He Y. F. Tian X. H. (2012). Study on the evaluation system for county tourism competitiveness in Guangdong Province. Econ. Geogr.32, 172–176. doi: 10.15957/j.cnki.jjdl.2012.09.031
47
Zhang S. Liu X. (2019). The roles of international tourism and renewable energy in environment: new evidence from Asian countries. Renew. Energy139, 385–394. doi: 10.1016/j.renene.2019.02.046
48
Zhang W. Zhou Y. Y. Hu G. (2013). Coupling mechanism and space-time coordination of new-approach urbanization, new-approach industrialization and service industry modernization in Megacity Behemoths: acase study of ten cities in China. Sci. Geogr. Sin.33, 562–569. doi: 10.13249/j.cnki.sgs.2013.05.007
49
Zhou L. Jiang J. L. (2015). Comprehensive evaluation of tourism competitiveness and spatial differentiation of cities in the Yangtze River Delta. Econ. Geogr.35, 173–179. doi: 10.15957/j.cnki.jjdl.2015.01.025
Summary
Keywords
TDC, ecological environment, coordination relationship, coupled coordination model, China's coastal areas
Citation
Li L and Li W (2025) Spatial temporal evolution of tourism destination competitiveness and its coordination with ecological environment in coastal areas of China. Front. Sustain. Cities 7:1629222. doi: 10.3389/frsc.2025.1629222
Received
15 May 2025
Accepted
30 October 2025
Published
17 December 2025
Volume
7 - 2025
Edited by
Daniel Olsen, Brigham Young University, United States
Reviewed by
Lóránt Dénes Dávid, John von Neumann University, Hungary
Willem Coetzee, Western Sydney University, Australia
Updates
Copyright
© 2025 Li and Li.
This is an open-access article distributed under the terms of the Creative Commons Attribution License (CC BY). The use, distribution or reproduction in other forums is permitted, provided the original author(s) and the copyright owner(s) are credited and that the original publication in this journal is cited, in accordance with accepted academic practice. No use, distribution or reproduction is permitted which does not comply with these terms.
*Correspondence: Wei Li, 32043@sdwu.edu.cn
Disclaimer
All claims expressed in this article are solely those of the authors and do not necessarily represent those of their affiliated organizations, or those of the publisher, the editors and the reviewers. Any product that may be evaluated in this article or claim that may be made by its manufacturer is not guaranteed or endorsed by the publisher.