Abstract
Introduction:
This study investigates the mechanisms through which the internal network structures of urban agglomerations influence economic growth.
Methods:
Based on panel data from 50 cities in Northeast China, spanning the period 2000 to 2019, a gravity model is employed to quantify economic spatial correlations between cities. From this model and Social Network Analysis, three core network structure indicators are derived, namely degree centrality, closeness centrality, and betweenness centrality. By then incorporating network centrality as a threshold variable in panel regression models, this study examines the nonlinear relationship between network structure and economic growth.
Results and Discussion:
The results show that: First, urban agglomerations exhibit a core-periphery structure; only a few nodes possess high centrality. Second, all centrality measures display significant single or multiple threshold effects. When betweenness centrality crosses the first threshold, both degree and closeness centrality exert strong positive effects. This enhances industrial linkages and resource integration without bearing the full costs of core-city congestion. Third, optimizing the spatial network structure and removing barriers to factor mobility (especially human capital and technology) are two key pathways for promoting coordinated development between the Harbin-Changchun and central and southern Liaoning urban agglomerations and reducing inter-city disparities.
1 Introduction
Urban agglomerations are not merely collections of cities; they are also complex networks defined by intricate spatial interdependencies. A cornerstone of regional science, derived from studies of successful agglomerations—like the American BosWash (American cities that stretch from Boston to Washington, D.C.)—is that robust, multi-faceted inter-city linkages, facilitated by knowledge spillovers, trade, and labor mobility, foster convergent, synergistic growth. In these networks, a polycentric structure often correlates with higher overall resilience and innovation (Camagni et al., 2015).
However, this paradigm faces a critical test in regions that are undergoing profound structural transition. In “rust belt” areas or old industrial bases, such as Germany’s Ruhr Valley or America’s Great Lakes region, the very structure of an urban network may be a legacy of a past economic era. In such places, the network can perpetuate core-periphery disparities, rather than synergy. The benefits of agglomeration are contingent upon crossing critical thresholds in network connectivity itself (e.g., Dettmann et al., 2016). This presents a pivotal question: Does the internal network structure of a transitioning agglomeration act as an engine of coordinated growth or as a mechanism of polarization? Also, under what conditions can this effect change?
Northeast China, a classic old industrial base shaped by a planned economy, offers a critical context within which this question can be investigated. The area’s Ha-Chang urban agglomeration and the central and southern Liaoning urban agglomeration are designated as components of a policy-led initiative aimed at revitalization. Preliminary data reveal a highly uneven economic landscape. Specifically, in 2016, core cities like Harbin and Changchun contributed 38 and 39%, respectively, to their respective provincial GDP, suggesting a potentially monocentric and polarized spatial structure. This historical path dependency, characterized by dominant state-owned enterprises and a reliance on heavy industry, makes these cities an ideal “laboratory” in which to study how network structures function in non-archetypal agglomerations.
Most existing studies on China’s urban agglomerations stop at identifying the presence of spatial spillovers. This study moves beyond that and argues that the economic effect of a city’s position within the spatial network is not linear but is instead governed by threshold effects. This research posits that a city must occupy a position of sufficient strategic importance within the network before that city can effectively translate that position into robust economic growth.
To test this assumption, a novel two-stage methodology is employed. First, to quantify the real economic links between cities, this study sets up a gravity model based on economic scale and distance. From this model, three core measures of a city’s network power are derived: degree centrality, betweenness centrality, and closeness centrality. Second, these centrality measures are used not as mere correlates but as threshold variables in a panel regression model. This is an efficient way to empirically test whether the relationship between a city’s fundamental factors and the city’s economic growth changes dramatically once the city achieves a critical level of network centrality.
Based on this framework, the following hypotheses are proposed and tested:
H1: The spatial network of the Ha-Chang urban agglomeration and the Central and Southern Liaoning urban agglomeration exhibits structural characteristics with high centrality concentrated in a few core cities and weak, hierarchical linkages to peripheries.
H2: The effect of a city’s factor endowments on that city’s economic growth is contingent upon the city’s network position. Specifically, a statistically significant threshold exists for each centrality measure, below which a city’s growth is largely driven by internal factors. Above that threshold, the returns to these factors are significantly amplified, due to enhanced access to the agglomeration's resources.
H3: The type of network power means that different centrality will have different threshold effects in this policy-driven, transitioning context, as network power allows cities to mediate flows and capture value in a fragmented network.
An analysis of economic scale confirms these cities’ significant role in regional growth. For the sample selection, this study follows the officially defined city scope, considering data availability and sample size, and therefore excludes the Yanbian Korean Autonomous Prefecture (Figure 1).
Figure 1
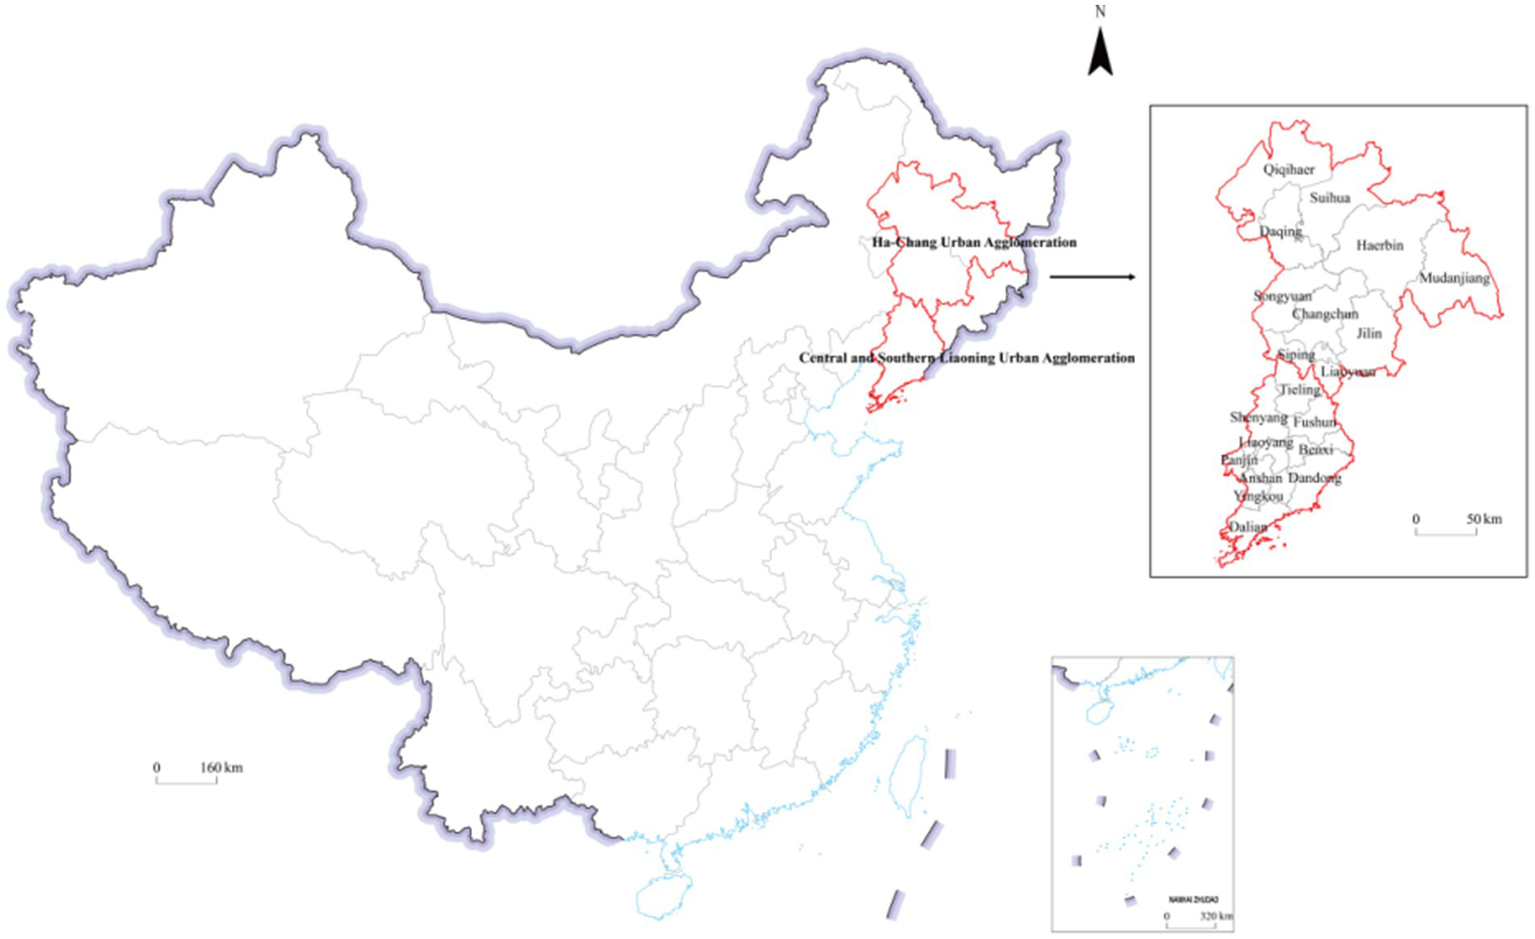
Research area.
2 Literature review
Research on regional spatial economic linkages can be traced back to the 1940s, evolving through theoretical advancements, methodological innovations, and shifting conceptualizations of urban and regional structure. Early scholarly work laid the groundwork for future research by applying foundational theories and quantitative models. For example, Taffe (1962) pioneered the use of gravity models with air passenger data to reveal the hierarchical structures and the dominance of large centers in inter-city transport networks in the United States. Meyer (1980) subsequently advanced a dynamic model of urban systems. The study posited that metropolitan areas are shaped by dual processes, namely the control over stocks of economic exchange and their spatial movement. The application of gravity models continued to be a central methodology for quantifying interactions. This was seen in Djankov and Freund’s (2002) empirical analysis of changing trade flows in post-Soviet regions and Shen’s (2004) estimation of inter-city attractiveness. Concurrently, theoretical perspectives expanded, with Glaeser (1999) leveraging Marshallian theory to construct a knowledge spillover model to analyze the spatial flow of knowledge-based populations within urban agglomerations.
A pivotal shift in this field of research has been the transition from monocentric to polycentric and network-based conceptions of urban regions. The intellectual foundation for this shift was established early on by Harris and Ullman (1945), who proposed the multi-nuclei model of urban development. From the 1980s onwards, this perspective gained prominence, as the traditional single-center model increasingly became to be seen as inadequate. Scholars like Batten (1993) argued that polycentric network cities foster greater regional freedom and creativity. This was complemented by Castells (1996) influential theory of the “space of flows,” which reconceptualized cities as pivotal nodes in global networks, fundamentally altering traditional geographical layouts. This theoretical turn spurred empirical and conceptual research on transnational urban networks (Kunzmann and Wegener, 1991), the integration of transport infrastructure with urban agglomerations (Scott et al., 1989), and the identification of specific hub-network structures. Such research was often centered on port cities. By the late 1990s, European scholarship in particular produced a flourishing body of empirical work on polycentric development (Dieleman and Faludi, 1998). In turn, this gave rise to related concepts, like network cities and information cities (Kobayashi et al., 1997).
The development and application of spatial econometrics marked a significant breakthrough, particularly by enabling a more rigorous empirical identification of spatial spillover effects. This methodology allowed researchers to move beyond measuring simple linkages to modeling interdependencies. For instance, Viladecans-Marsal (2004) employed spatial econometric techniques to demonstrate that agglomeration economies in Spanish cities were significantly reinforced by the population and employment size of neighboring cities. The analytical framework of that study was further refined by Ke (2010), who used a spatial simultaneous equation model to verify a mutual causal relationship between industrial agglomeration and productivity in Chinese cities. Ke’s study also identified significant spatial stickiness and the negative effects of employment density. At a broader regional scale, Henry et al. (1999) constructed a spatial econometric model to meticulously estimate the diffusion and backwash effects of urban influence on hinterlands in the United States.
This focus on spillovers has also had a strong tradition in international economics. The groundwork for analyzing cross-border economic interdependencies was laid by scholars like Ellison and Glaeser (1997) and Douven and Peeters (1998), who modeled how one nation’s policies affect other nations’ economic variables. This research framework has been extensively deepened through studies that have examined international trade, investment, migration, and technology transfer.
Recent scholarly work has increasingly focused on the spatial correlation structure of economic growth in China, examining that structure’s characteristics, evolutionary patterns, and underlying influencing factors (Gao et al., 2017; Zong-Yi and Ming-Yue, 2018). A primary approach involves measuring spatial correlation itself (Zhang and Song, 2003). Studies have frequently utilized modified gravity models or spatial autocorrelation indices (e.g., Moran’s I) to quantify these inter-city relationships. For instance, researchers have applied these methods to map the economic spatial correlations within key regions. Examples include the Beijing-Tianjin-Hebei region and Northeast China (Gang and Jiadong, 2017). Parallel to this, the “space of flows” perspective analyzes tangible and intangible interactions. This approach has been widely adopted to explore spatial relationships, as evidenced by research on the Yangtze River Delta urban agglomeration (Bin et al., 2015; Jiao et al., 2017; Chen et al., 2015; Jianzhao and Suying, 2013). In tandem with analyzing correlation, a significant body of research has investigated the evolution of spatial structure (Gao, 2023; Yang, 2020), largely through social network analysis (SNA). Scholars use SNA to construct urban network structures and identify key features, such as network centrality and cohesive subgroups. The rapid development of China’s high-speed rail (HSR) network has been a particular catalyst for such studies. Researchers have examined how the HSR is reconstructing the spatial structure of city clusters (Jinli et al., 2018), a theme also explored in the context of regional tourism flows (Wang Degen, as cited in Jinli et al., 2018). Mature urban agglomerations, such as the Yangtze River Delta and the Pearl River Delta, remain central subjects of inquiry, with studies tracking their evolving spatial structures. A growing body of literature has suggested that, within a mobile spatial context, cities can enhance their economic performance by integrating into regional connectivity networks (Shaobo et al., 2021; Wang and Liu, 2022; Zhang, 2020). A study by Camagni and Salone (1993) was among the first to introduce the concept of “urban network externality,” characterizing that externality as a club good that yields benefits exclusively to cities embedded within such networks. Capello (2000) further conceptualized urban network externalities as constitutive elements of those networks, arguing that participation enables cities to harness economies of scale through complementary relationships and synergies derived from cooperative activities. Boix and Trullen (2007) contended (Burger, 2016) that the network effect within urban agglomerations serves as a critical driver of regional economic growth. The study emphasized that the developmental trajectory of individual cities is influenced not only by internal conditions but also by the tightly-knit economic networks within the agglomeration. With the introduction and evolution of the “borrowing size” theory, scholars have increasingly examined urban network externalities through this theoretical lens. The empirical study by Meijers et al. (2016) provides robust support for this phenomenon, demonstrating that cities within the Randstad, a polycentric urban region in the Netherlands, indeed generate a “borrowed size” effect through urban networks, thereby mitigating the constraints of their limited individual size. In North America, the concept of “borrowed size,” initially proposed by Alonso (1973), has been revisited by contemporary scholars. For instance, the research by Lee and Gordon (2007) on U. S. metropolitan areas indicates that employment growth in small cities located on the periphery of metropolitan areas is positively correlated with their proximity to the core city. This finding supplies evidence for the “borrowed size” effect within the American context. Against this backdrop, a series of scholarly discussions on network externalities has emerged, both domestically and internationally. Notably, the journal Geographic Research has published a special issue entitled “Urban Network Externalities,” which features a collection of studies dedicated to this theme.
While much of the extant literature provides qualitative descriptions of spatial structure, a methodological advance can be found in the use of the quadratic assignment procedure (QAP) regression Jun and Jie (2017). This method is particularly suited for analyzing relational data and has been employed to quantitatively identify the factors that influence the spatial correlation structure of regional tourism economies (Jun and Jiechang, 2018), as well as regional economic growth (Robert-Nicoud and Thompson, 2014; Jing et al., 2014).
Despite these advancements, critical gaps can be revealed in existing literature. The aim of this study is not merely to describe the spatial distribution of economic activities but also to uncover and quantify the direct mechanism through which regional spatial economic network structures influence economic growth. Moving beyond existing literature, which predominantly focuses on “describing associative structures” or “identifying influencing factors,” this research addresses two core issues: ① This study examines how regional spatial economic network structures—such as the centrality and betweenness of cities—serve as pivotal factors that directly drive or constrain urban economic performance. ② The study also investigates whether the impact of these network structures on economic growth exhibits complex nonlinearities. Innovations of this study are as followings: First, it moves beyond merely describing the spatial patterns of economic activities or identifying correlative factors, to explicitly uncovering and quantifying the direct causal mechanisms through which regional spatial-economic network structures influence economic growth. Second, it examines specific network properties—such as city centrality and betweenness—not just as structural features, but as pivotal factors that directly drive or constrain urban economic performance. Third, it investigates whether the effects of these network structures on economic growth are characterized by complex nonlinear relationships, adding sophistication to conventional linear assumptions in existing literature.
3 Research method and data source
3.1 Research method
3.1.1 Modified gravity model
The modified gravity model, which is used to test for correlation (Liu and Liu, 2008; Yan, 2018; Xinyue, 2022), is applied to construct the spatial network relationship between the Ha-Chang urban agglomeration and the central and southern Liaoning urban agglomeration, as specified in Equation (1). Here, i and j refer to two distinct cities, and Fij denotes the gravitational force between them. That force is calculated based on each city’s year-end population and regional production output (e.g., GDP). The geographical distance between i and j is measured using ArcGIS11.0. Additionally, the contribution rate of city i to the bilateral economic interaction is incorporated into the model.
From this formulation, a gravitational matrix representing intercity economic linkages is constructed, and the row-wise average of this matrix serves as a critical threshold. If the gravitational force Fij exceeds this threshold, the value is set to 1, indicating an active economic growth linkage between the two cities. Otherwise, the value is set to 0, reflecting the absence of any significant spatial correlation in economic growth.
Robustness checks are performed using MATLAB to evaluate the sensitivity of the results to alternative gravity model specifications. A total of 125 distinct spatial weight matrices are examined by varying: (i) the distance friction coefficients (from D^1.0 to D^3.0), (ii) the binarization thresholds (ranging from 0.5 to 1.5 times the row mean), and (iii) the functional forms of the k parameter. The coefficient of variation (CV) is employed to assess robustness, where a CV below 5% indicates highly robust results (Table 1).
Table 1
| Specification | Beta_X | Rho_WY | Beta_WX | R2 |
|---|---|---|---|---|
| D^1.5,t = 1.00, k = baseline | 1.3051 | 0.5221 | −0.7194 | 0.6203 |
| D^2.0, t = 0.75, k = baseline | 1.3057 | 0.5218 | −0.7205 | 0.6203 |
| D^2.0, t = 1.00, k = baseline | 1.3053 | 0.522 | −0.7200 | 0.6203 |
| D^2.0, t = 1.25, k = baseline | 1.3048 | 0.5221 | −0.7205 | 0.6205 |
| D^2.5, t = 1.00, k = baseline | 1.3056 | 0.5219 | −0.7232 | 0.6205 |
| D^3.0, t = 1.00, k = equal | 1.3082 | 0.5198 | −0.7225 | 0.6193 |
| D^3.0, t = 1.00, k = log_ratio | 1.3082 | 0.5198 | −0.7225 | 0.6193 |
Robustness test result.
Beta_X: mean = 1.3061, std = 0.0014, and CV = 0.11%. Rho_WY: mean = 0.5213, std = 0.0011, and CV = 0.21%. R-squared: mean = 0.6201, and range = [0.6193, 0.6205].
3.1.2 Social network analysis
In social network analysis, the structural properties of a network depend on that network’s individual nodes. To characterize these nodes, centrality indices—such as degree centrality, betweenness centrality, and closeness centrality—are widely used to assess the status and function of each node within the network.
The degree centrality of a node is defined as the number of direct connections that node maintains with other nodes. This metric reflects the node’s relative position in the spatial correlation network. A higher value implies stronger connectivity and a more central role. Since the networks examined in this study are directed graphs, each node’s degree can be further classified into in-degree and out-degree centralities. Specifically, in-degree refers to the number of connections received from other nodes, whereas out-degree indicates the number of relationships initiated by the node. To enable cross-network comparisons, Freeman introduced the concept of relative degree centrality, which expresses a node’s degree centrality as a proportion of the maximum possible degree within the network.
As measures of positional significance, within a network, centrality indices serve as proxies for power, prestige, influence, prominence, and importance (Brass, 1984; Sparrowe et al., 2001). Betweenness centrality in particular captures a node’s control over interactions between other nodes. Betweenness centrality also reflects the extent to which a node, by lying on the shortest paths between other nodes, can influence relationships across the network. A node that occurs on many of the shortest paths acts as a critical intermediary or bridge; higher betweenness is associated with greater potential influence over connected nodes.
Consider two nodes, X and Y, connected via multiple shortest paths that pass through a third node, Z. The betweenness of Z with respect to X and Y reflects Z’s control over the connection between X and Y. The degree is computed by letting Gxy denote the total number of shortest paths between X and Y, and Gxy(z) denotes the number of those paths passing through Z. The influence of Z on the interaction between X and Y, denoted as Bxy(z), is then defined as the probability that Z lies on a randomly selected shortest path between X and Y, given by Equation (2):
The following formula is used to obtain Z’s absolute betweenness degree as Equation (3):
When comparing different time periods or networks of varying scales, betweenness centrality must be standardized into a relative measure. The formula is as follows by Equation (4):
A node with a betweenness value of 0 is located at the periphery of the network and has no control over other nodes. The relative betweenness value ranges from 0 to 1, and a value of 1 indicates that the node occupies the most central position in the network and possesses the greatest influence over all other nodes.
Closeness centrality reflects the extent to which a node is independent of others via short paths. The more closely a node is connected to others, the more directly that node is positioned within the network. The closeness centrality of a node is defined as follows by Equation (5):
Here, represents the shortest path distance between nodes i and j, which is measured by the number of edges in the path. Similar to betweenness centrality, relative closeness centrality is used in practice to compare nodes across different networks. In a network with n nodes, the maximum possible closeness is n − 1, which leads to the following relative closeness formula as Equation (6):
3.1.3 Threshold regression model
The functional form of a relationship can potentially be influenced by changes in a threshold variable; economic relationships are also often nonlinear. Traditional approaches that subjectively split samples based on arbitrary threshold values lack proper parameter estimation and statistically valid hypothesis testing. This results in unreliable results. To address these limitations, Hansen (2000) proposed a threshold regression model, which employs rigorous statistical methods to estimate parameters and conduct hypothesis tests on threshold values.
Suppose the sample data are as ; is defined as the threshold variable, and could also be part of the dependent variables. The model is as follows by Equation (7):
Here, is the estimated threshold value, and is the dependent variable and not related to the . The above-mentioned segmentation functions can be described as Equation (8):
Here, is the explicit function; that is, if the expression in parentheses is true, the value is 1, and if the expression in parentheses is false, the value is 0. The above equation is obviously a nonlinear regression, so it is necessary to estimate by nonlinear least squares (NLS). That is, the sum of squared residuals must be minimized.
When the data are expanded to panel data, Hansen (1999) set up the panel data threshold modes as in Equation (9):
Here, is the “threshold variable” used to define the sample, and is the threshold value to be estimated. The disturbance term is independent and identically distributed, is not related to the disturbance term, and is the individual intercept term, indicating that the setting is a fixed effect model. For the test of whether a “threshold effect” exists, the following hypothesis is made:
If this hypothesis is accepted, no threshold effect exists. In this case, the model is simplified to Equation (10):
Similarly, a panel regression model with multiple thresholds can be considered, with two threshold values, as in Equation (11):
Network characteristics such as centrality, proximity, and degree may not follow a linear pattern in influencing economic levels. To examine the relationship between network structure and economic growth, this study adopts a threshold model. The model is tested, and the nonlinear relationship is explained by considering both univariate and multivariate thresholds. Upon confirming the significance of the univariate threshold, double and triple threshold effects are further analyzed. The model is specified as in Equation (12):
3.2 Data description
This study employs GDP as the dependent variable to represent regional economic growth. A spatial economic correlation model is constructed; based on the calculation of network characteristics, degree centrality, closeness centrality, and betweenness centrality are selected as the core explanatory variables.
The control variables are as follows: ① fixed asset investment (lninvest). A long-term, stable, and balanced relationship exists between fixed asset investment and economic growth. Relevant studies have confirmed that fixed asset investment significantly promotes economic growth. ② Government expenditure (lngov): Higher government public expenditure increases the marginal returns on capital and labor, thereby enhancing household savings and labor motivation, which directly promotes economic growth. This study uses the logarithm of each city’s total annual fiscal expenditure as a proxy variable for government expenditure. ③ Consumption level (lnconsum): Consumption effectively promotes regional economic growth; the new demand generated by consumption also plays a crucial guiding role in production adjustment and upgrading. This study employs the logarithm of the total retail sales of consumer goods in each city as a proxy variable. ④ Foreign investment (lnfdi): Foreign investment serves as an important source of funding for urban economic growth, contributing to the formation of high-quality new assets and improving the quality of existing assets. This study uses the logarithm of the actual utilized foreign direct investment in each city as a proxy variable. ⑤ Human capital (lnedu): Different labor structures have varying impacts on economic growth, with the role of high-quality human capital being particularly important and becoming increasingly prominent. This study selects the logarithm of the number of undergraduate students per 10,000 people as a proxy variable for human capital.
The data on actual utilized foreign direct investment, the total retail sales of consumer goods, government fiscal expenditure, the number of undergraduate students per 10,000 people, and fixed asset investment are sourced from the China City Statistical Yearbook.
4 Results
Based on Equation (1), a modified gravity model incorporating regional GDP and year-end total population was applied to construct a spatial network. That network reflects the economic linkages within the Ha-Chang urban agglomeration and the central and southern Liaoning urban agglomeration, from 2000 to 2019. Then, Ucinet 6.0 software was used to analyze the spatial correlations of economic growth across different time periods (Figure 2). The strength of connections between members in this network was evaluated by comparing the actual number of ties with the theoretically maximum possible number of ties. This primarily reflects the connection density between urban nodes in the major urban agglomerations of Northeast China. Since intra-city connections (self-loops) are excluded from the analysis, the density of the spatial association network is computed based solely on inter-city connections. This approach omits any closed-loop relationships.
Figure 2
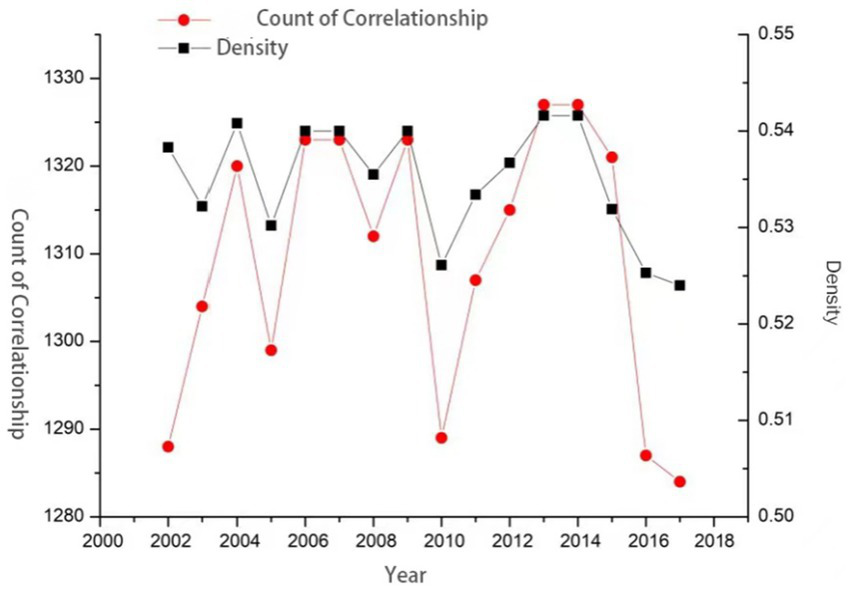
The spatial correlation of economic growth in different periods.
Between 2000 and 2019, the density of the spatial correlation network for economic growth in Northeast China’s urban agglomerations remained relatively stable, only fluctuating within a narrow range of 0.52 to 0.54. This indicates that the network was in a generally weakly connected state throughout the entire period. Using a binarization approach—where spatial correlations between cities are assigned a value of 1 if present and 0 otherwise—the resulting network density consistently exceeded 0.5. This finding implies that more than half of the cities studied exhibited correlated economic growth. Network density peaked at 0.5416 in both 2011 and 2012; this was after notable fluctuations between 2000 and 2011. However, a marked decline occurred after 2013, reflecting a gradual weakening of economic linkages and illustrating the evolving spatial structure of the urban agglomerations. Urban interdependencies have grown increasingly complex. The suggestion is made that strengthened inter-city linkages between 2008 and 2011 contributed positively to regional economic resilience, underscoring the need to further reinforce connections between these urban agglomerations.
Using a modified gravity model, this study derived a gravitational matrix representing the intensity of economic linkages over time among urban agglomerations in Northeast China. The years 2005, 2010, and 2015 have been selected as representative periods to construct three-dimensional surface maps that visually illustrate the spatial dynamics of economic growth (Figure 3). Macroscopically, the intensity of economic linkages within the study area increased year on year.
Figure 3
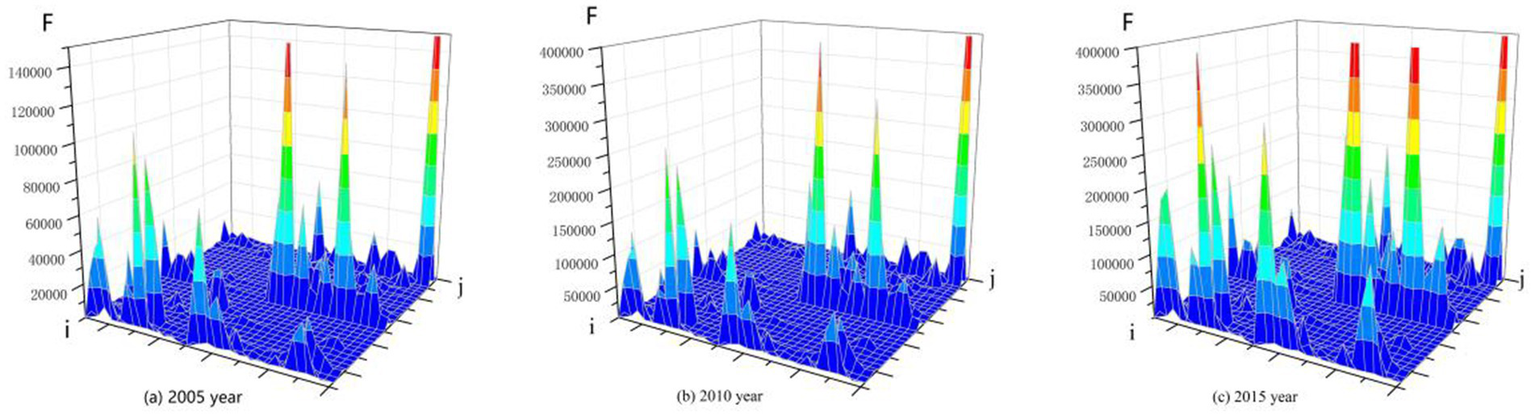
Curve of economic growth gravitation in urban agglomerations in Northeast China.
Spatially, two core economic growth areas were identified in 2005. One area centered on Shenyang and the surrounding cities; the other was in the northern region and centered on Harbin. Strong correlations were observed between cities in the Ha-Chang urban agglomeration and those in central-southern Liaoning urban agglomeration. After 2005, the number of core economic areas increased, showing a trend toward multi-centered development and greater spatial aggregation. This shift can be attributed to several factors: First, as sub-provincial cities, Harbin and Shenyang serve as pivotal hubs with substantial resource attraction. Government policies have further enhanced resource allocation efficiency and fostered equipment manufacturing sectors that underpin industrial reliance across Northeast China. Second, infrastructure development progressed rapidly. This improved transportation accessibility and facilitated labor concentration, which in turn enhanced economic efficiency in adjacent regions. By 2015, large-scale iron-based urban agglomeration construction had significantly reduced temporal costs and accelerated factor mobility. This led to sustained improvements in inter-city economic linkages. Data reveal both increases in peak linkage values and also the expansion of high-intensity zones, where economically vibrant cities exert a radiating influence on neighboring areas. That effect remains pronounced, even as the pull from core regions diminishes with distance. This result validates Hypothesis 1, which was mentioned in the introduction.
4.1 Threshold characteristics of spatial correlation structure
Within the threshold model framework, the analysis must first determine whether a threshold effect exists, and the preceding test confirmed a threshold effect in the relationship involving the network structure. Once confirmed, the specific threshold value must be identified. For instance, degree centrality might exhibit a significant threshold effect on economic growth. Therefore, after establishing a single threshold, the examination should extend to potential double or triple thresholds. If a double-threshold test proves insignificant, one can conclude that only one threshold characterizes the relationship between degree centrality and economic growth, thereby guiding the specification of an appropriate model.
The results demonstrate a statistically significant single-threshold effect for degree centrality, with an F-statistic of 16.62 and a p-value of 0.000. This finding supported the construction of a double-threshold model, which is also significant (F = 21.721, p = 0.000). Further testing confirmed a triple-threshold effect. Specifically, the single-threshold test for centrality yielded an F-statistic of 9.672 (p = 0.01), and the double-threshold test produced an F-statistic of 12.089 (p = 0.001). For betweenness centrality, the single-threshold model was significant (F = 3.704), and the double-threshold model remained robust (F = 18.957, p = 0.001).
The estimated threshold values for degree centrality were approximately 0.607 (first threshold), 0.799 (second threshold), and 0.953 (third threshold), respectively. Similarly, the thresholds for closeness centrality were identified at about 4.019, with subsequent thresholds exceeding this value. This finding indicates a consistent multi-threshold pattern across centrality measures.
Across the three models, all control variables—lninvest, lngov, lnconsum, lnfdi, and lnedu—exerted a positive influence on economic growth. Among them, lninvest and lnconsum are statistically significant at the 1% level.
The study area comprises major heavy industrial bases in China, where substantial investment has long been essential for fostering industrial development. Since the launch of the Northeast China Revitalization Strategy in 2003, investment has served as a critical driver of regional economic growth, akin to a “troika.” Investment has also effectively advanced the construction and modernization of infrastructure. However, since 2011, fixed-asset investment in this region has shown a declining trend. Against the backdrop of China’s macroeconomic transformation, industrial upgrading, and capacity policies, fixed-asset investment has significantly decreased. Nevertheless, investment’s role remains fundamental in supporting the long-term growth trajectory of Northeast China. Continued reliance on such investment will provide crucial support for economic restructuring and the broader reform agenda, which is aimed at revitalizing and upgrading these traditional industrial bases (Table 2).
Table 2
| Variable | Model 1 | T-value | Model 2 | T-value | Model 3 | T-value |
|---|---|---|---|---|---|---|
| LnINV | 0.349*** | 14.059 | 0.3622*** | 12.123 | 0.363*** | 12.119 |
| Lngov | 0.049* | 1.841 | 0.043 | 1.301 | 0.041 | 1.220 |
| Lnconsum | 0.316*** | 9.736 | 0.305*** | 9.184 | 0.306*** | 9.136 |
| Lnfdi | 0.034 | 0.328 | 0.002 | 0.199 | 0.002 | 0.210 |
| Lnedu | 1.007 | 0.857 | 0.025** | 1.869 | 0.234** | 2.874 |
| DEG first interval | −0.533*** | −3.165 | 0.021** | 1.655 | ||
| DEG second interval | −0.063*** | −3.805 | 0.182** | 2.356 | ||
| DEG third interval | −0.477*** | −2.924 | 0.046*** | 3.566 | ||
| DEG fourth interval | 0.155 | 1.083 | 0.175** | 2.309 | ||
| CLN first interval | 0.021** | 1.655 | 0.139 | −0.954 | ||
| CLN second interval | −0.182** | −2.357 | 0.150*** | 1.675 | ||
| CLN third interval | −0.048*** | −3.566 | 1.118 | 1.781 | ||
| CLN fourth interval | −0.175** | −2.309 | 0.084 | 0.087 | ||
| BET first interval | 0.138 | 0.954 | −0.053*** | −3.805 | ||
| BET second interval | −0.048*** | −3.592 | −0.477*** | −2.924 | ||
| BET third interval | −0.175* | −2.045 | 0.155 | 1.082 | ||
| BET fourth interval | 0.139 | 1.309 | −0.464*** | −2.997 | ||
Estimated result of economic growth threshold regression.
***, **, and * indicate passing significance tests at the 1, 5, and 10% levels, respectively.
4.2 Threshold effect of economic growth spatial association network structure degree centrality
Table 3 presents the threshold effect estimation results of three network characteristic variables on the spatial correlation of economic growth. The findings reveal that the influence of network centrality is not linear but rather is governed by complex threshold mechanisms, which can be powerfully interpreted through the lens of economic geography theory.
Table 3
| Threshold variable | Threshold number | F statistic | p value | Critical value 10% | Critical value 5% | Critical value 1% |
|---|---|---|---|---|---|---|
| Degree centrality | Unique threshold | 16.62*** | 0.000 | 4.656 | 6.254 | 10.157 |
| Double threshold | 11.682*** | 0.004 | 4.543 | 5.985 | 9.707 | |
| Closeness centrality | Unique threshold | 9.672** | 0.01 | 5.158 | 6.185 | 9.707 |
| Double threshold | 12.089*** | 0.001 | 4.650 | 6.029 | 9.661 | |
| Betweenness centrality | Unique threshold | 3.704** | 0.005 | 2.661 | 3.969 | 8.908 |
| Double threshold | 18.957*** | 0.001 | 4.285 | 4.564 | 10.121 |
Threshold effect and significance test of individual network structure characteristics in economic quantity growth.
***, **, and * indicate passing significance tests at the 1, 5, and 10% levels, respectively.
When degree centrality is the threshold variable, the results delineate how a city’s developmental stage, defined by that city’s number of direct connections, shapes the economic value of other network positions.
At low levels of degree centrality (below 0.607), the positive effect of closeness centrality suggests that peripheral cities benefit from being efficiently accessible to the core. This is a classic feature of a hub-and-spoke system. However, the statistically insignificant effect of betweenness centrality reveals a critical insight. Specifically, in an underdeveloped network, the coordination costs and resource constraints associated with maintaining bridging positions outweigh the potential “brokerage rents,” thereby preventing these cities from capitalizing on their intermediary potential.
As degree centrality crosses the first threshold (0.607–0.799), the sign of closeness centrality turns significantly negative. This pivotal shift aligns with the theory of agglomeration shadows and congestion effects. As cities transition from the periphery towards the core, their reduced “closeness” (i.e., greater independence) becomes an asset. This indicates that the cities are no longer merely satellites but are beginning to exert their own radiating influence. They are potentially entering a phase of competitive pressure with the established core, where proximity leads to competition for resources, rather than cooperation.
The persistent insignificance of betweenness centrality across most degree centrality intervals underscores that, in this transitioning agglomeration, economic growth is primarily driven by the core-periphery dynamics and the building of direct ties, rather than through the sophisticated, brokerage-based resource allocation that characterizes more mature, integrated networks.
4.3 The threshold of economic growth, spatial correlation network structure close to centrality
When closeness centrality is the threshold variable, the analysis captures how a node’s overall independence within the network conditions the returns on that node’s direct and bridging connections.
The significantly negative impact of degree centrality when closeness is low can be interpreted as evidence of congestion and cut-throat competition in the densely connected core. Despite their abundant connections, core cities may suffer from aggregate diseconomies, such as homogenized industrial structures, intense investment competition, and excessive urban burdens. These factors lead to diminishing marginal returns on each new connection.
However, once closeness centrality surpasses the highest threshold (>4.525)—indicating a mature, well-integrated network, where all cities are relatively “close”—both degree and betweenness centrality regain strong, positive significance. This finding suggests that the negative externalities of agglomeration have been overcome. The network has evolved to a stage where both direct connectivity and the efficient, brokerage-based allocation of resources across the entire system can effectively drive synergistic growth.
4.4 Threshold effect of the intermediary degree of spatial association network structure
When betweenness centrality is the threshold variable, the model elucidates the conditions under which the role of an intermediary becomes economically valuable.
At the lowest level of betweenness (<0.454), the network is likely to be dominated by a few core hubs, leaving little room for brokerage. Here, the positive effect of degree centrality simply reflects the advantage of being directly connected to these powerful hubs.
The most revealing finding emerges when betweenness centrality crosses the first threshold (0.454–1.862), where both degree and closeness centrality exert strong positive effects. This regime represents the “sweet spot” for network intermediation. Cities like Yingkou and Daqing, which are not cores but which are critically positioned as bridges, can exploit “structural holes” in the network. The cities benefit from the “information gap” and “control advantages” by facilitating flows between major cores (e.g., Shenyang-Dalian and Harbin-Changchun). Thus, they enhance industrial linkages and resource integration without bearing the full costs of core-city congestion.
Finally, at the highest level of betweenness (>3.549), the influence of direct and closeness-based measures becomes insignificant. This finding implies that a handful of ultra-powerful intermediary nodes have emerged. The function of these nodes shifts from mere facilitation to a higher order of strategic control and orchestration of regional value chains. At this stage, the nodes’ economic value is derived from their unique positioning power, which operates independently of the conventional core-periphery metrics.
In summary, this study demonstrates that the spatial correlation of economic growth in Northeast China’s urban agglomerations is a tapestry of non-linear and interdependent network effects. These results validate Hypothesis 2 and 3, which are put forward mentioned in this study’s Introduction. The findings vividly illustrate a theoretical journey, starting from initial core-periphery dependence, through a phase of competitive congestion and the emerging value of brokerage, towards a potential future state of a mature, polycentric network where multiple forms of centrality synergistically drive development. This study’s nuanced, threshold-based interpretation provides a more refined theoretical framework for understanding the evolution of urban agglomerations in transitioning economies.
5 Conclusion
By constructing a gravity model, this study quantifies the spatial correlation between the Ha-Chang urban agglomeration in Northeast China and the central and southern Liaoning urban agglomeration. Using social network analysis, nodal metrics (degree centrality, betweenness centrality, and closeness centrality) are calculated for cities within the network. The influence of these three spatial structural attributes on economic growth is further evaluated through nonlinear threshold regression, with each attribute serving as a threshold variable. The main findings are as follows:
First, gravitational values among urban agglomerations in Northeast China have shown an upward trend since 2000. This finding indicates increasingly close economic spatial linkages within the region. Also, the spatial correlation exhibits a north–south gradient of intensification, with both the Ha-Chang and central and southern Liaoning urban agglomerations displaying clear core-periphery structures.
Second, from a network structure perspective, degree centrality and betweenness centrality among cities fluctuated significantly, particularly between 2000 and 2010. This finding suggests that the underlying network structure supporting regional economic growth remained in an unstable state during this period.
Core cities, such as Harbin, Changchun, and Shenyang, leverage their locational advantages, resource endowments, and industrial structures through agglomeration and spillover effects. In contrast, peripheral cities are mainly influenced by radiation effects. These cities can enhance spatial correlation and network intensity to overcome barriers in factor and commodity markets. These cities can enhance spatial correlation and network intensity to overcome barriers in factor and commodity markets due to self-reinforcing cycle of structural inertia and institutional rigidity. The region’s outdated industrial network structure is upheld by administrative practices and weak market institutions, which together severely hinder the mobility of the very factors—especially human capital and technology—required to break this cycle and optimize the spatial economic network. By doing so, the cities facilitate the flow of capital—especially human capital—and technology across cities of varying sizes, thereby maximizing market scale effects within the urban agglomeration. To narrow development gaps and to foster long-term intercity competition and cooperation, the emphasis should be on an innovation-driven approach.
For cities on the network periphery, establishing basic connections is a priority. Each additional direct linkage offers significant opportunities for resource acquisition, which helps to mitigate information asymmetry and resource scarcity. Resource-based cities, such as Daqing and Qiqihar, have long depended on traditional industrial paths. These cities should increase their direct industrial ties with Harbin and Changchun. Such connections can provide transformational opportunities and facilitate a shift from traditional industrial networks toward innovation-driven networks.
For both urban agglomerations covered in this study, emphasizing not only their current structures but also their developmental trajectories is essential, with innovation promoted as a replacement for traditional drivers of regional growth. Optimizing the spatial network structure of economic growth and enhancing the spatial allocation efficiency of capital factors will foster coordinated development between the Ha-Chang and central and southern Liaoning urban agglomerations. Despite these agglomerations’ clear geographical proximity, cross-regional synergies remain underutilized. The economic spatial correlation within these agglomerations manifests as a complex network structure, offering a new mechanism and perspective for inter-provincial coordination.
To strengthen this network, government macroeconomic regulation should be enhanced to foster economic spatial ties. In line with the second phase of the “Revitalizing Northeast China’s Old Industrial Bases” strategy and China’s “Belt and Road” initiative, efforts should be made to facilitate optimal spatial allocation and connectivity. This will improve economic integration within and between the two abovementioned urban agglomerations. At the same time, it is important to recognize these urban agglomerations’ distinct economic development modes and industrial structures. Market mechanisms such as pricing, competition, and supply–demand dynamics should play a decisive role in factor allocation. Reducing government intervention will help strengthen the relationships among cities and urban agglomerations.
Despite incorporating variables such as investment, government expenditure, and human capital, this study acknowledges certain limitations. Specifically, key structural and institutional variables, most notably industrial structure upgrading, institutional quality (e.g., market fairness, contract enforcement), and a more detailed analysis of fiscal structure, were beyond the scope of this paper. The absence of these variables may mean that critical mechanisms that either facilitate or hinder the formation of positive spatial correlations have been overlooked. For instance, a city’s ability to benefit from its network position might be contingent upon the city’s institutional capacity to absorb and efficiently deploy external resources. To develop a more holistic understanding of the drivers and barriers to synergistic growth in transitioning regions like Northeast China, future research should explicitly incorporate these dimensions. Exploring the interaction between network position and these omitted variables would be a particularly fruitful avenue for further study.
Statements
Data availability statement
The original contributions presented in the study are included in the article/supplementary material, further inquiries can be directed to the corresponding authors.
Author contributions
QL: Data curation, Funding acquisition, Methodology, Writing – original draft. YZ: Software, Visualization, Writing – original draft. ZQ: Data curation, Writing – original draft. JL: Visualization, Writing – original draft.
Funding
The author(s) declared that financial support was received for this work and/or its publication. This work was supported by Science and Technology Development Plan Project of Jilin Province, China, grant number YDZJ202201ZYTS493.
Conflict of interest
The author(s) declared that this work was conducted in the absence of any commercial or financial relationships that could be construed as a potential conflict of interest.
Generative AI statement
The author(s) declared that Generative AI was not used in the creation of this manuscript.
Any alternative text (alt text) provided alongside figures in this article has been generated by Frontiers with the support of artificial intelligence and reasonable efforts have been made to ensure accuracy, including review by the authors wherever possible. If you identify any issues, please contact us.
Publisher’s note
All claims expressed in this article are solely those of the authors and do not necessarily represent those of their affiliated organizations, or those of the publisher, the editors and the reviewers. Any product that may be evaluated in this article, or claim that may be made by its manufacturer, is not guaranteed or endorsed by the publisher.
References
1
Alonso W. (1973). Urban zero population growth. Daedalus102, 191–206.
2
Batten D. F. (1993). Network cities versus central place cities: building a cosmo-creative constellation. In The cosmo-creative society, eds. AnderssonA., BattenD. F., and KarlssonC.. (pp. 137–150). Springer.
3
Bin L. Tao D. Z. (2015). Analysis on the evolution of spatial structure to tourism economy of the urban agglomeration in the middle reaches of Yangtze River. Econ. Probl.9, 125–128. doi: 10.16011/j.cnki.jjwt.2015.09.023
4
Boix R. Trullen J. (2007). Knowledge, networks of cities and growth in regional urban systems. Pap. Reg. Sci.86, 551–574. doi: 10.1111/j.1435-5957.2007.00139.x
5
Brass D. J. (1984). Being in the right place: A structural analysis of individual influence in an organization. Admin Sci Quart.29, 518–539.
6
Burger M. J. Meijers E. J. (2016). Agglomerations and the rise of urban network externalities. Reg. Sci.95, 5–15. doi: 10.1111/pirs.12223
7
Camagni R. P. Salone C. (1993). Network urban structures in northern Italy: elements for a theoretical framework. Urban Stud.30, 1053–1064. doi: 10.1080/00420989320080941
8
Camagni R. P. Capello R. Caragliu A. (2015). The rise of second-rank cities: what role for agglomeration economies?Eur. Plan. Stud.23, 1069–1089. doi: 10.1080/09654313.2014.904999
9
Capello R. (2000). The city network paradigm: measuring urban network externalities. Urban Stud.37, 1925–1945. doi: 10.1080/713707232
10
Castells M. (1996). Rise of the network society: The information age: Economy, society and culture. Oxford: Blackwell Publishers.
11
Chen W. Xiu C. Ke W. Yu Z. Wei Y. J. (2015). Hierarchical structures of China's city network from the perspective of multiple traffic flows. Geogr. Res.34, 2073–2083. doi: 10.11821/dlyj201511001
12
Dettmann A. Dimos C. Schwiebacher F. (2016). The role of geographical proximity for project collaboration: distance and innovation in the former West and East Germany. J. Technol. Transf.41, 1363–1387. doi: 10.1007/s10961-015-9438-3
13
Dieleman F. M. Faludi A. (1998). Polynucleated metropolitan regions in Northwest Europe: theme of the special issue. Eur. Plan. Stud.6, 365–377. doi: 10.1080/09654319808720468
14
Djankov S. Freund C. J. (2002). Trade flows in the former Soviet Union. J. Comp. Econ.30, 76–90. doi: 10.1006/jcec.2001.1763
15
Douven R. Peeters M. (1998). GDP-spillovers in multi-country models. Econ. Model.15, 163–195. doi: 10.1016/S0264-9993(97)00026-6
16
Ellison G. Glaeser E. L. (1997). Geographic concentration in U.S. manufacturing industries: a dartboard approach. J. Polit. Econ.105, 889–927. doi: 10.1086/262098
17
Gang H. Jiadong Y. (2017). Distribution of urban compactness and spatial Association in the Three Provinces of the Northeast China. Areal Res. Dev.36, 62–67.
18
Gao X. L. Xu Z. N. Niu F. Q. Long Y . (2017). An evaluation of China's urban agglomeration development from the spatial perspective. Spatial Stats., 475–491. doi: 10.1016/j.spasta.2017.02.008
19
Gao Y. Zhao Y. Li K. Qi X. Li P . (2023). Analysis of the spatial correlation network structure of agricultural water use efficiency in Northwest China. Agron13. doi: 10.3390/agronomy13102509
20
Glaeser E. L. (1999). Learning in cities. J Monet Econ.44, 251–274.
21
Hansen B. E. (2000). Sample splitting and threshold estimation. Econometrica68, 575–603.
22
Hansen M. T. (1999). The search-transfer problem: The role of weak ties in sharing knowledge across organization subunits. Admin Sci Quart.44, 82–111.
23
Harris C. D. Ullman E. L . (1945). “The nature of cities.” Ann American Acad Polit Soc Sci.242, 7–17.
24
Henry M. S. Schmitt B. Kristensen K. Barkley D. L. Bao S . (1999). Extending Carlino-Mills models to examine urban size and growth impacts on proximate rural areas. Growth Chang.30, 526–548. doi: 10.1111/j.1468-2257.1999.tb00044.x
25
Jianzhao L. Suying G. (2013). The research of Beijing-Tianjin-Hebei urban agglomerations'spatial connection based on urban relation intensity and urban flow. Areal Res. Dev. 32, 57–61.
26
Jiao L. Tang X. Liu X. (2017). Spatial linkage and urban expansion: an urban agglomeration perspective. Landscape Urban Plan. 162, 26–39. doi: 10.1016/j.landurbplan.2017.02.004
27
Jing L. Shu C. Guanghua W. Chenmei F . (2014). Study on the spatial correlation and explanation of regional economic growth in China: based on analytic network process. Econ. Res. J.49, 4–16.
28
Jinli Z. Lulu Z. Jinping S. (2018). Spatial structure of urban system and its evolution in Jing-Jin-Ji urban agglomeration. Areal Res. Dev.37, 58–63.
29
Jun W. Jiechang X. (2018). Study on the spatial network structure of the tourism economy in China and its influencing factors: investigation of QAP method. Tour. Trib.33, 13–25.
30
Jun W. Jinhai X. U. Jiechang X. (2017). Study on the spatial correlation structure of China's tourism economic and its effect: based on social network analysis. Tour. Trib.32, 15–26.
31
Ke S. (2010). Agglomeration, productivity, and spatial spillovers across Chinese cities. Ann. Reg. Sci.45, 157–179. doi: 10.1007/s00168-008-0285-0
32
Kobayashi K. Okumura M. Kondo K . (1997). The growth of city systems with high-speed railway systems. Ann. Reg. Sci.31, 39–56. doi: 10.1007/s001680050038
33
Kunzmann K. R. Wegener M. (1991). The pattern of urbanization in Western Europe. Ekistics Rev. Probl. Sci. Hum. Settlements58:282,
34
Lee B. Gordon P. (2007). “Urban spatial structure and economic growth in US metropolitan areas. “In 46th Annual Meeting of the Western Regional Science Association.
35
Liu H. B. Liu Z. L. (2008). Spatial economic interaction of urban agglomeration: Gravity and intercity flow modeling & empirical study. In Proceedings of the 2008 International Conference on Management Science & Engineering (ICMSE). IEEE. doi: 10.1109/ICMSE.2008
36
Meijers E. J. Burger M. J. Hoogerbrugge M. M. (2016). Borrowing size in networks of cities: towards a network model of urban growth. Reg. Stud.50, 725–742. doi: 10.1080/00343404.2015.1026919
37
Meyer D. R. J. E. G. (1980). A dynamic model of the integration of frontier urban places into the United States system of cities. Econ. Geogr.56, 120–140. doi: 10.2307/142931
38
Robert-Nicoud F. Thompson P. (2014). A network-based view of regional growth. J. Econ. Geogr.14, 687–711. doi: 10.1093/jeg/lbu001
39
Scott R. V. Keeling D. J. Drummond D. Churella A. Desiderio F. Hibbs J. et al . (1989). Review of transportation and world development. J. Transp. Hist.10, 88–90.
40
Shaobo W. Jianke G. Xiaolong L. (2021). Passenger and cargo flow temporal and spatial evolution and its spatial association with economic development in China. Asia Res. Dev.41, 45–60.
41
Shen G. J. (2004). Reverse-fitting the gravity model to inter-city airline passenger flows by an algebraic simplification. J. Transp. Geogr.12, 219–234. doi: 10.1016/j.jtrangeo.2003.12.006
42
Sparrowe R. T. Liden R. C. Wayne S. J. Kraimer M. L. (2001). Social networks and the performance of individuals and groups. J Acad Manage.44, 316–325.
43
Taffe E. J. (1962). The urban hierarchy: an air passenger definition. Econ. Geogr.37, 1–14.
44
Viladecans-Marsal E. (2004). Agglomeration economies and industrial location: city-level evidence. J. Econ. Geogr.4, 565–582. doi: 10.1093/jnlecg/lbh040
45
Wang X. Y. Liu X. Y. (2022). Evolution and optimization of tourism economic network structure in the Yellow River Basin under the influence of high-speed rail. Econ. Geogr.42, 211–218. doi: 10.15957/j.cnki.jjdl.2022.09.024
46
Xinyue W. Xiaoyan L. (2022). Development and evolution of urban tourism economic network structure and its optimization under the influence of high-speed rail in the yellow river basin. Eco Geo.42, 211–218.
47
Yan D. Wang Y. Li S. Qiu W. (2018). Urban logistics connection and spatial pattern of Shandong Province based on gravity model. J. Land Use33, 123–145.
48
Yang Y. Yang H. Cheng Y. (2020). Why is it crucial to evaluate the fairness of natural capital consumption in urban agglomerations in terms of ecosystem services and economic contribution?Sustain. Cities Soc.65:102644. doi: 10.1016/j.scs.2020.102644
49
Zhang K. H. Song S. (2003). Rural-urban migration and urbanization in China: evidence from time-series and cross-section analyses. China Econ. Rev.14, 386–400. doi: 10.1016/j.chieco.2003.09.018
50
Zhang P. Zhao Y. Zhu X. Cai Z. Shi S. J. (2020). Spatial structure of urban agglomeration under the impact of high-speed railway construction: based on the social network analysis. Society62:102404. doi: 10.1016/j.scs.2020.102404
51
Zong-Yi H. U. Ming-Yue L. I. (2018). Spatial correlation and spillover effects of inclusive finance development: an empirical analysis based on the social network. J. Econ., Commer. Manag.6, 78–92.
Summary
Keywords
network structure, Northeast China, spatial correlation, threshold characteristics, urban agglomeration
Citation
Li Q, Zong Y, Quan Z and Li J (2026) Research on the spatial correlation structure of urban agglomeration economic growth and its threshold effects in Northeast China. Front. Sustain. Cities 7:1640137. doi: 10.3389/frsc.2025.1640137
Received
03 June 2025
Revised
15 December 2025
Accepted
17 December 2025
Published
27 January 2026
Volume
7 - 2025
Edited by
Safwan Altarazi, German Jordanian University, Jordan
Reviewed by
Laura Varela Candamio, University of A Coruña, Spain
Wei Liu, Northeast Forestry University, China
Zuopeng Ma, Chinese Academy of Sciences, China
Updates
Copyright
© 2026 Li, Zong, Quan and Li.
This is an open-access article distributed under the terms of the Creative Commons Attribution License (CC BY). The use, distribution or reproduction in other forums is permitted, provided the original author(s) and the copyright owner(s) are credited and that the original publication in this journal is cited, in accordance with accepted academic practice. No use, distribution or reproduction is permitted which does not comply with these terms.
*Correspondence: Qiao Li, liq869@nenu.edu.cnYan Zong, 1119210175@qq.com
Disclaimer
All claims expressed in this article are solely those of the authors and do not necessarily represent those of their affiliated organizations, or those of the publisher, the editors and the reviewers. Any product that may be evaluated in this article or claim that may be made by its manufacturer is not guaranteed or endorsed by the publisher.