Abstract
Mobility as a Service (MaaS) revolutionizes urban mobility by integrating diverse transportation modes into a unified platform, boosting user convenience, optimizing resource use, and reducing environmental impact. This has attracted numerous participants eager to tap into its potential. However, existing research has largely neglected the impact of cooperation network attributes on the benefit distribution mechanism and their pivotal role in the evolution of MaaS tourism logistics service supply chains. To bridge this gap, our study constructed a game-theoretic model involving MaaS service integration platforms, scenic areas, and tourism service integrators. We analyzed the interest games under two dominant structures—scenic area-led and MaaS platform-led—and dissected the benefit distribution outcomes based on three cooperation network types. Our research reveals three key insights. First, cooperative alliances outperform independent decision-making in profit optimization and supply chain resilience. Second, vertical suppression-dependent structures tend to spark conflicts, while horizontal balance-mutual assistance structures enable partial resource sharing, and strategic cooperation alliances maximize synergy for enhanced efficiency. Third, fostering close-knit cooperation networks and multi-stakeholder collaboration is essential for the development of MaaS tourism logistics service supply chains.
1 Introduction
With the development of global tourism and the increase in carbon emissions from urban transportation, establishing a low-carbon tourism logistics system has become an important issue that society urgently needs to solve, which is related to the sustainable development of tourism and the improvement of the urban ecological environment (Jittrapirom et al., 2020; Cao R. et al., 2023; Zhu et al., 2025). Mobility-as-a-Service (MaaS) is now a crucial solution by connecting different transport modes, scenic area transfers, and smart logistics (Ho and Tirachini, 2024). MaaS (Mobility-as-a-Service), as a new service model integrating transportation resources, has received extensive attention worldwide in recent years. Studies show that MaaS can optimize transportation resources, reduce empty running and carbon emissions through platform collaboration (Golbabaei et al., 2021). However, in actual promotion, there are difficulties in coordinating interests among different participants. For example, when dynamic algorithms balance the passenger flow (Bucchiarone et al., 2021), traditional enterprises and platforms often have disputes over data ownership; Although blockchain technology improves the efficiency of multimodal transport (Chinaei et al., 2023), the division of responsibilities among all parties still relies on manual negotiation. This is because the roles of entities such as public transportation departments, private car operators, and technology providers in the transportation network are positioned differently, making it difficult for MaaS to form a unified collaboration mechanism (Polydoropoulou et al., 2020; Lopez-Carreiro et al., 2023). Therefore, it is necessary to focus on the relationship attributes of each subject in the cooperative network in the MaaS tourism logistics scenario, reveal its influence mechanism on the evolution of the supply chain, and provide management inspirations for constructing a supply chain optimization path that balances multiple interests.
Against this background, the spatio-temporal heterogeneity of tourism scenarios leads to the formation of a complex symbiotic network of interests among transportation operators, logistics service providers and scenic area operators. The relationship attributes among the various entities in the chain directly constitute the core characteristics of the supply chain cooperation network (Kim et al., 2011), and determine the collaborative efficiency of the service chain and the evolution direction of the supply chain (Villena et al., 2011). The European MaaS platform Whim, while integrating public transport, bicycles, and scenic services, saw significant service connection delays due to early data privacy conflicts in coordinating members' transport schedules, bike deployment density, and scenic visitor flow, highlighting how member relations constrained network collaboration (Cottrill, 2020). Some studies have also verified that the key to reconstructing the subject relationship between the platform and suppliers through the data sharing mechanism to enhance the efficiency of the supply chain is not the technical optimization of the data sharing algorithm, but the establishment of an optimized cooperative network attribute through trust (Qi et al., 2023). The real-time carpooling platform Avego refused to share the real-time location data of passengers with the public transportation system, resulting in a significant delay in the connection of intermodal services. This case confirmed the fundamental impact of the trust relationship among members on the collaborative attributes of the transportation network (Amey et al., 2011; Han et al., 2021). Based on these practices, it can be seen that the evolution of the supply chain not only depends on technical solutions, but is also subject to the attributes of the cooperative network derived from membership.
In general, this study focuses on the cooperative relationship between supply chain members and the interest interaction among MaaS service integrators, scenic spots and tourism service providers, and focuses on analyzing the profit distribution logic under the two supply chain structures dominated by scenic spots and MaaS platforms. In the MaaS tourism logistics supply chain, the collaborative network relationships significantly influence profit allocation due to the numerous participants. Mohebbi and Li (2015) noted that cooperative relationships among supply chain members are not inherently stable, and their closeness and coordination effectiveness play a decisive role in profit allocation mechanisms. When scenic spots, MaaS service integrators, and tourism service providers lack efficient collaboration, information flow is hindered, resources cannot be allocated rationally, and optimal profit distribution becomes difficult (Cisterna et al., 2023). Moreover, according to Li and Meng (2023), supply chain structure is crucial in cooperative games, and different collaborative network attributes give rise to diverse profit allocation models. In the MaaS tourism logistics supply chain, collaborative network attributes not only directly affect profit allocation but also influence the supply chain's evolutionary process through resource allocation and coordination mechanisms (Montoya-Torres and Ortiz-Vargas, 2014; Ramanathan, 2014). Neglecting these influences reduces the supply chain's resilience to internal and external shocks, making it difficult to adjust strategies flexibly in the face of significant fluctuations in tourism market demand, policy changes, etc. It may also lead to poor environmental performance due to resource mismatches, such as transportation resource waste and increased energy consumption (Gruchmann et al., 2022; Senyo and Osabutey, 2023; Singh et al., 2025). Therefore, it is essential to study how collaboration network attributes drive MaaS tourism logistics supply chain evolution. This paper identifies three typical network types: vertical suppression, horizontal balance-mutual aid, and strategic alliances. It analyzes how these attributes influence supply chain evolution paths. The study focuses on three key questions:
-
How do collaboration network relationships affect profit distribution in scenic area-led vs. MaaS platform-led supply chain structures?
-
What are the differences in profit distribution patterns across different network structures?
-
How do collaboration network attributes drive the evolution of MaaS tourism logistics supply chains?
In order to solve the above key problems, this study first builds a multi-stakeholder MaaS tourism logistics supply chain game model to provide basic tools for quantitative analysis. Secondly, based on the model, the constitutive characteristics and operation mechanism of the collaboration network in the two types of dominant structures were systematically investigated. Finally, by comparing the profit distribution differences of different network structures across scenarios, the influence of network attributes on the evolution path of MaaS tourism logistics supply chain is explored.
This study makes three contributions to existing literature. First, it develops a multi-agent game theory model. This model reveals how collaboration network attributes drive profit distribution and supply chain evolution paths. It fills gaps in current MaaS research on network structure dynamics while providing theoretical guidance for policymakers to improve multi-party collaboration mechanisms. Second, based on the game model, the study shows how vertical suppression, horizontal balance-mutual aid, and strategic alliance networks affect profit distribution differently. It simulates supply chain members' behavioral strategies and long-term evolution trends under various network attributes. Third, the paper proposes a theoretical framework linking network attributes to supply chain evolution paths. This offers new perspectives for MaaS ecosystem governance and lays foundations for future research on network-structure relationships.
The structure of this article is as follows. First, we determined the core research questions through practical and theoretical backgrounds. The second section describes the model, including problem formulation and notation. The fourth section builds and solves the game theory model. The fifth part analyzes the influence of the attributes of the cooperative network. The last part presents the discussion and conclusion.
2 Literature review
2.1 Mobility as a Service
Mobility as a Service (MaaS) is a new model of mobility management and service delivery. Its core idea is to integrate various transportation modes into a single information platform. Through this platform, users can receive personalized and comprehensive travel solutions to meet their diverse mobility needs (Calderón and Miller, 2020). It simplifies the user experience and supports the efficient and sustainable development of transportation systems. This has attracted attention from many scholars worldwide (Duan et al., 2022; J. Zhu et al., 2023; Daou and Leurent, 2024). Existing studies on MaaS mainly focus on conceptual development (Liu and Ceder, 2015; Agatz et al., 2024), system framework design (Liu et al., 2019; Shibayama and Laa, 2024), and practical case analysis (Esztergár-Kiss and Kerényi, 2020; Wybraniec et al., 2024).
In terms of concept development, current literature mostly defines MaaS as a new form of transport organization and supply method. It emphasizes the integration and on-demand delivery of mobility services. Shao et al. (2019) describe MaaS as an innovative transportation system based on digital platforms. It combines multiple transport modes and uses big data for decision-making to meet diverse travel needs. Mubiru and Westerholt (2024) use a cross-disciplinary review to clarify the concept and features of MaaS. They also examine how MaaS and similar services shape the mobility landscape, offering a comprehensive understanding of emerging mobility models. Regarding system framework design, existing studies have explored MaaS from the perspectives of technical architecture, operation models, and stakeholder roles. For example, Wang et al. (2024) propose a three-dimensional analytical framework that considers social background, development goals, and economic environment. This helps compare global MaaS practices. Lajas and Macário (2020) build a two-stage public policy framework based on MaaS characteristics. They explore its role as a traffic management tool in urban systems and identify implementation challenges for stakeholders. In practical case analysis, recent studies examine real-world MaaS implementations around the world. They highlight the impacts of key elements and features. For instance, Li et al. (2023) focus on data openness in MaaS platforms. They propose a method to assess urban transport carbon footprints under MaaS. This provides a useful reference for low-carbon urban mobility planning. Wong et al. (2020) analyze how MaaS is applied in cities. They explore its implementation methods and effects on transport efficiency. A government-led MaaS model is proposed to optimize transportation by considering road pricing, time, and location factors.
Overall, existing research provides a solid foundation for the theoretical and practical development of MaaS. It clarifies its concept, system structure, and applications across fields. These studies show the potential of MaaS in resource integration and service optimization. They also offer valuable insights for studying profit distribution and industrial development paths in tourism and logistics supply chains. Although more work is needed to explore specific applications and integration strategies in tourism logistics, these findings open new perspectives and enrich our understanding of MaaS as a new mobility service model.
2.2 MaaS tourism logistics service supply chain
Tourism logistics service supply chain, as a subdivision application of the logistics field in the tourism scenario, shares the basic link of personnel space displacement with transportation logistics. Although there are links crossing between the two under the integrated application scenario of MaaS, the core characteristics and objectives are significantly different.
From the perspective of core objectives, transportation logistics focuses on the efficiency improvement, cost control, and time-effectiveness guarantee of personnel space displacement, and only focuses on the optimal solution of the single link of displacement. The core goal of the tourism logistics service supply chain is to meet the needs of the whole process of tourists‘ travel and experience. It not only relies on the MaaS platform to integrate the displacement service under the tourism scenario, but also needs to link the supply of tourism resources and service delivery to ensure the tourists' experience.
From the perspective of service objects, transportation logistics is oriented to the main body of general personnel transportation demand, and the demand only focuses on the displacement itself, without the scene-based tourism experience demand. The service object of tourism logistics is tourists, whose demand has the dual attributes of spatial displacement, tourism consumption and experience, and MaaS platform is needed to meet the personalized travel-tourism integration demand. From the perspective of supply chain structure, transportation logistics takes the transportation link as the core, and the supply chain is relatively single, only forming cooperation around the displacement link. The tourism logistics service supply chain is a complex and changeable multi-agent participation network system, interwoven by multiple independent entities, aiming to meet the diverse needs of tourists (Fong et al., 2021). Its vertical extension: The upstream is the original supply end of tourism resources and services (such as hotels, scenic spots, and transportation service providers), the midstream is the tourism service integration platform (such as travel agencies), and the downstream directly serves tourists (Guo et al., 2019). The core mechanism is the close collaboration and efficient integration of each node, relying on advanced coordination strategies and management techniques to ensure the smooth delivery and quality maintenance of services (Zhao and Chen, 2018). This process promotes the optimal allocation of resources, enhances tourists' satisfaction and loyalty, and is the key to the sustainable development and competitiveness improvement of the tourism industry (Gao et al., 2016).
In recent years, research on tourism service supply chains has attracted growing attention from scholars around the world. Most studies have focused on supply chain optimization (Li et al., 2019; Li P. et al., 2022), consumer behavior and demand analysis (Zhao and Chen, 2018; Zhang et al., 2022), operational models (Yan and Liu, 2019; Sun et al., 2022), and technological innovation and application (Zhu and Wang, 2021; Ma and He, 2023). Regarding supply chain optimization, existing studies mainly examine how to improve supply chain performance through better management strategies and technical tools. Ma et al. (2023) used game theory to study the impact of vertical and horizontal cooperation on tourism service supply chains. They found that tourists' low-carbon preferences can enhance environmental performance of tourism products. However, competition among scenic spots may reduce this effect. On consumer behavior and demand analysis, current literature focuses on understanding tourist behavior, preference patterns, and factors influencing their choices. Shi et al. (2024) studied how brand manufacturers choose OSC strategies under differentiated branding in tourism service supply chains. They revealed how these strategies affect consumer brand selection and related decisions. In terms of supply chain operations, Chiwaridzo (2024) conducted quantitative analysis to identify key factors that influence how tourism service supply chains operate and shape consumer decisions. The study also highlighted the role of these factors in promoting sustainable energy transition in Zimbabwe's tourism sector. Erol et al. (2024) explored the drivers and challenges of building resilience in tourism and hospitality supply chains. They discussed how these factors affect the way supply chains function. With rapid technological advancement, new technologies such as big data, cloud computing, Internet of Things, and artificial intelligence are increasingly applied in tourism service supply chains. Piya et al. (2023) used four metaheuristic algorithms to address innovation challenges in customized tour package design. Their method helps service providers generate optimal travel plans based on individual preferences. This improves service efficiency through technology.
Overall, both domestic and international scholars have conducted extensive and in-depth research on tourism service supply chains. These studies cover complex business models and emerging technologies. They provide a solid theoretical foundation for this study's exploration of interest bargaining in MaaS-based tourism logistics service supply chains. However, while these works offer valuable insights, there is still limited direct research focusing specifically on MaaS-based tourism logistics service supply chains. Although some studies (Sun et al., 2021; Li W. et al., 2022) have examined cruise logistics supply chains and MaaS-based tourism logistics service supply chains, research on the development of such supply chains, especially on profit distribution and industrial development paths, remains insufficient.
2.3 Attributes of the supply chain cooperation network
Supply chain cooperation network attributes refer to the structural characteristics formed by participants in a supply chain system through mechanisms such as resource complementarity, information sharing, and interest coordination (Joshi, 2022; Rashid et al., 2024). These attributes not only determine the collaboration efficiency among supply chain members but also significantly influence overall performance, risk distribution, and profit allocation patterns (Chang et al., 2012; Wiedmer and Griffis, 2021). As supply chain structures become increasingly complex and multi-agent collaboration becomes more critical, research on cooperation network attributes has gained prominence in the field of supply chain management. This concept originates from studies on inter-firm relational networks, which emphasize how the connections between firms affect resource allocation efficiency.
Research on the attributes of supply chain cooperation networks mainly focuses on three dimensions: network structure types, power structures, and resource integration levels. In terms of network structure types, Lotfi and Larmour (2022) categorized networks into horizontal collaboration (cooperation among enterprises at the same level) and vertical collaboration (cooperation between upstream and downstream enterprises). They found that both types of collaboration can enhance supply chain resilience by improving its capabilities in prediction, adaptation, response, recovery, and learning. This classification lays a theoretical foundation for subsequent research on the evolution of cooperation networks. Regarding power structures, Wang et al. (2023) focused on a supply chain system composed of two competing manufacturers and a retail platform. They analyzed how enterprises choose and implement collaborative logistics strategies under different power structures, and explored how power structure as a network attribute influences profit distribution, member decision-making, and evolutionary processes through resource allocation and coordination mechanisms. In the aspect of resource integration, Du and Gong (2018) reviewed the research status of cross-border logistics supply chain alliances in terms of formation patterns, structural analysis, operational mechanisms, value creation, profit distribution, stability, and operational risks, indicating that such alliances can integrate resources to improve efficiency. Liu et al. (2024) constructed a supply chain network from a social network analysis perspective, using degree centrality and betweenness centrality to measure enterprises' network positions. They empirically found that the advantage of a central position in the supply chain network can promote collaborative innovation, optimize resource allocation, and reduce operational costs.
Against the above research background, this study classifies the cooperation network structures of MaaS tourism logistics service supply chains into three types: vertical dependency (z), horizontal balance (h), and strategic alliance (u). This classification aims to systematically analyze the evolutionary paths of supply chains. The vertical dependency structure is characterized by core enterprises' strong control over upstream and downstream members (Pishchulov et al., 2023), typically manifesting as a one-way flow of information and resources. The horizontal balance structure emphasizes resource sharing and collaboration among peer enterprises (Hosseinnezhad et al., 2023), commonly seen in cooperative operations between competitors or regional industrial clusters (Liu et al., 2011). This structure helps reduce collaboration risks and enhance local operational efficiency, though it has limitations in cross-level integration. The strategic alliance structure highlights deep cross-level and cross-functional collaboration, usually supported by long-term contracts, joint technology development, and shared risk mechanisms. It effectively promotes optimal resource allocation and enhances adaptability to market changes (Cao X. et al., 2023). In summary, this classification of supply chain cooperation network structures is intended to better understand how different attributes influence the evolution of supply chain systems. It provides insights into identifying the strengths and limitations of each structure. This framework also offers theoretical guidance for the practical development of MaaS tourism logistics service supply chains in complex environments.
3 Model statement
3.1 Model construction and notations
In this paper, we consider a MaaS tourism and logistics service supply chain consisting of a MaaS service integration platform, scenic spots, travel service integrators, tourism service operators, and logistics service integrators. The MaaS service integration platform integrates multi-source heterogeneous data and uses big data analysis and AI algorithms to match travel demand, scenic capacity, and logistics resources. It is responsible for forecasting demand and coordinating resource allocation. Scenic spots manage visitor flows and provide tourism experiences. Travel service integrators offer customized transportation solutions by integrating different travel modes. Tourism service operators develop full-chain tourism products, while logistics service integrators build smart warehousing and delivery systems to ensure efficient material flow.
This paper analyzes the strategic interactions and profit competition among members under two types of supply chain structures: scenic-spot-led and MaaS-platform-led, as shown in Figure 1. In the non-cooperation scenario, each member makes decisions independently to maximize its own profit, and the key decision variable is the pricing of services or products offered by one level to the next lower level in the supply chain. In the scenic-spot-led structure, the scenic spot and the travel service integrator (upstream members) first set the prices for entrance tickets and passenger transfer services. Then, the MaaS service integration platform (middle stream) sets the bundled price of tickets and tourism-logistics services for tourists, and releases service demands internally. Finally, the tourism service operator and the logistics service integrator (downstream members) determine their service prices based on the platform's pricing. In the MaaS-platform-led structure, the MaaS service integration platform takes the lead in setting the overall price for tourism and logistics services. Based on this, the scenic spot and the travel service integrator decide their respective service prices. Then, the downstream members set their service prices according to the pricing from the upstream or middle stream. When cooperation strategies are considered, all parties work together, aiming to maximize the overall profit of the alliance rather than individual profits.
Figure 1
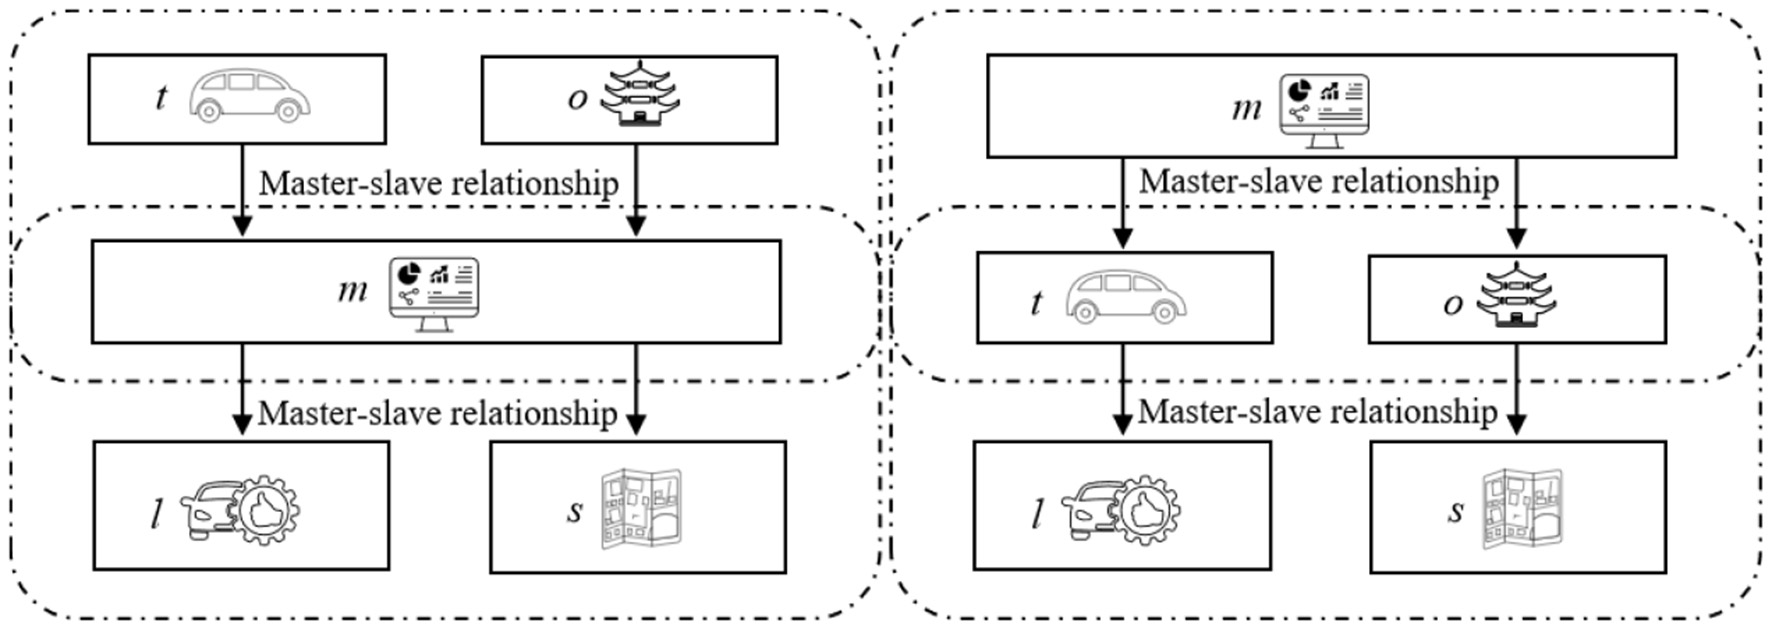
Two structures of the MaaS tourism logistics service supply chain.
This paper establishes a game-theoretic model to characterize the strategic decisions and interactions among supply chain members under different leadership structures. The notations used in the model are presented in Table 1.
Table 1
| Notations | Definitions |
|---|---|
| Q j | Tourism market service demand |
| p ji | The revenue of a unit of tourism products or services |
| c ji | The cost of a unit of tourism product or service |
| πji | The profits of the participating entities |
| i types of supply chain cooperation network structures in case j | |
| j = {1, 2} | i = 1 indicates the supply chain structure dominated by scenic spots; j = 2 represents the supply chain structure dominated by the MaaS service integration platform |
| i = {m, o, t, s, l} | The participating entities in the chain they respectively represent are MaaS service integration platforms, scenic spots, travel service integrators, tourism service operators and logistics service integrators. |
Notations and definitions.
3.2 Hypothesis
-
Hypothesis 1. All participants in the MaaS tourism and logistics service supply chain are assumed to be rational economic agents who make strategic decisions based on self-interest maximization or coalition-based profit optimization. In alignment with game-theoretic principles, each participant is expected to act in accordance with dominant strategies when coordinating interests and making pricing or operational decisions within either non-cooperative or cooperative frameworks.
-
Hypothesis 2. The service capabilities of all supply chain members are sufficient to meet the market demand without capacity constraints. In order to focus on the core influence of “supply chain power structure” and “collaboration network type” on profit distribution, capacity fluctuation factors such as seasonal peak of tourism industry, physical carrying capacity of scenic spots and vehicle availability are temporarily excluded, so as to eliminate the interference of complex reality variables and ensure the clear identification of the core influence mechanism.
-
Hypothesis 3. Throughout the collaborative operations of the supply chain, full information symmetry is assumed among all participating entities. That is, all parties have access to the same level of relevant market and operational information, which eliminates potential inefficiencies caused by asymmetric information. Furthermore, moral hazard behaviors—such as opportunistic decision-making or hidden actions—are not considered in this model and are therefore excluded from the decision-making process.
-
Hypothesis 4. Following Sun et al. (2021), the tourism service demand function is formulated as Q = a − b ∑ pi, where a operationalizes aggregate market demand and b represents the price elasticity coefficient. This study uses linear demand and symmetrical cost assumption, which is a common method to establish analysis benchmark in theoretical modeling. This choice aims to create a highly simplified analysis environment to clearly reveal the basic impact of “supply chain power structure” and cooperation network type on profit distribution without being disturbed by complex parameter interactions.
4 Model construction and solving
4.1 Decentralized decision-making
4.1.1 The Model under destination-led tourism supply chains
Equations 1–5 define the profit functions for the scenic spot, mobility service integrator, MaaS service integration platform, tourism service operator, and logistics service integrator, respectively. In the upstream supply chain, the scenic spot and mobility service integrator set prices for attraction tickets and tourist transfer services. The midstream MaaS service integration platform uses these prices to determine bundled pricing for combined ticket and tourism logistics packages, while issuing service demand notifications through its internal platform. Downstream tourism service operators and logistics integrators then align their service fees with the platform's pricing structure to ensure cross-tier coordination.
Conclusion 1. Under non-cooperative decision-making in the scenic-spot-led supply chain structure, the optimal benefit allocation ratio among upstream, midstream, and downstream participants is 6:6:3:1:1.
According to Conclusion 1, the optimal profit distribution ratio among participants in the scenic area-led MaaS tourism logistics supply chain follows a 6:6:3:1:1 hierarchy (This ratio is a standardized result, merely reflecting the relative relationship of profit distribution. The specific solution procedure for the optimal allocation ratio is shown in the Appendix). This structure reflects the distinct roles and decision-making power across supply chain tiers. Upstream entities including scenic areas and transportation integrators, which control core tourism resources and mobility networks, dominate pricing and resource allocation decisions, securing 60% of total profits through their strategic market positioning. Midstream MaaS platforms act as digital coordinators, integrating tourism and logistics services via data-driven optimization. While lacking physical assets, they enhance system efficiency through dynamic service bundling, earning 30% of profits. Downstream tourism operators and logistics providers, constrained by upstream pricing rules and limited autonomy, receive only 10% of total profits. This tiered distribution underscores the “upstream dominance-midstream coordination-downstream dependency” governance pattern, where resource controllers capture maximum value, digital coordinators extract systemic efficiency gains, and service executors operate under constrained margins.
Management Implications. The hierarchical profit distribution in scenic area-led MaaS supply chains highlights the need for strategic governance adjustments. Upstream entities with resource control (e.g., scenic areas, transportation integrators) should establish collaborative mechanisms like transparent data sharing or performance incentives to align downstream partners, even as downstream operators receive smaller profit shares. Midstream MaaS platforms must strengthen their role by adopting advanced analytics and predictive demand tools, converting coordination into a competitive edge. Downstream operators need to develop specialized services such as premium tourism packages or responsive logistics to improve profitability while advocating for fairer profit rebalancing through cross-tier discussions.
4.1.2 The model under MaaS service integration platform-led supply chains
Equations 6–10 define the profit functions for the MaaS service integration platform, scenic spots, mobility service integrators, tourism service operators, and logistics service integrators, respectively. As illustrated in Figures 1, 2 under the MaaS-platform-led supply chain structure, the platform first determines pricing for tourism and logistics service packages. Cooperative upstream entities—specifically mobility service integrators and scenic spots—then set their service prices based on the platform's pricing strategy. Downstream tourism and logistics providers subsequently adjust their service fees according to the established pricing framework from upstream and midstream tiers, ensuring coordinated decision-making across the supply chain.
Figure 2
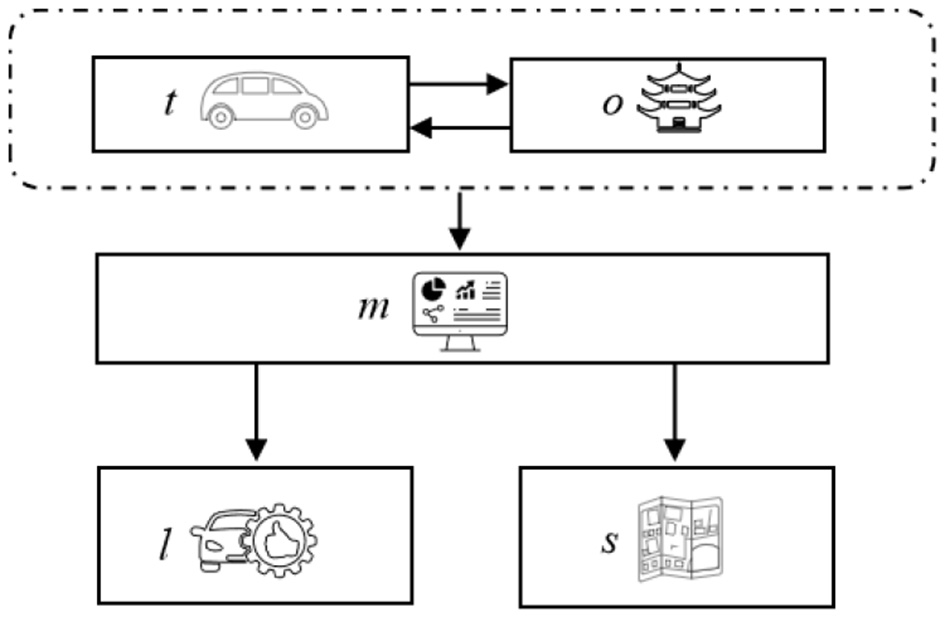
The destination-led supply chain structure with collaboration between o and t.
Conclusion 2. Under non-cooperative decision-making conditions within MaaS service-integrated platform-dominated supply chains, the optimal benefit distribution ratio among upstream, midstream, and downstream participants is determined as 9:3:3:1:1.
Under non-cooperative decision-making frameworks in MaaS tourism-logistics service supply chains, Conclusion 2 reveals a 9:3:3:1:1 benefit distribution ratio within platform-dominated structures (This ratio is a standardized result, merely reflecting the relative relationship of profit distribution. The specific solution procedure is shown in the Appendix). This imbalance highlights sharp hierarchical disparities: the upstream MaaS service integration platform commands the largest share by consolidating resources and leveraging technological superiority to reshape value networks. Midstream entities, such as destination operators, and mobility integrators, face reduced profit margins due to their operational reliance on upstream partners. Downstream tourism service providers and logistics integrators, constrained by controls from both upstream and midstream layers, occupy subordinate roles. This creates a clear “upstream governance–midstream coordination–downstream execution” dynamic. Compared with the ratio of 6:6:3:1:1 given in conclusion 1, it can be seen that although the platform under the dominant scenario of scenic spots strengthens the bargaining power, the dominant subject may weaken the collective efficiency due to excessive rent-seeking. Corporate roles and supply chain configurations directly shape distribution outcomes, with hierarchical advantages solidifying stratification across tiers. To mitigate fragmentation, cross-tier collaboration must be prioritized to establish equitable mechanisms that balance operational autonomy with shared value creation.
Management Implications. The skewed profit distribution in platform-dominated MaaS supply chains demands targeted interventions. Upstream platforms should avoid over centralization by reinvesting profits into collaborative tools, such as open-access data portals or joint innovation funds, to incentivize midstream and downstream participation. Midstream entities must diversify service portfolios and invest in digital capabilities to reduce dependency on upstream platforms. Downstream providers need to focus on niche offerings, such as curated tourism experiences or eco-friendly logistics, to differentiate themselves and negotiate better terms. All tiers should establish periodic forums to renegotiate profit-sharing agreements, incorporating metrics like customer satisfaction, innovation adoption, and carbon footprint reduction. This proactive governance model ensures fairness, prevents monopolistic behaviors, and fosters sustainable supply chain growth.
Furthermore, in the absence of cooperative strategies, it can be observed that regardless of the structure, MaaS tourism and logistics service supply chains tend to encounter profit distribution issues when participants operate independently. In practice, stakeholders often form collaborative alliances to improve revenue outcomes. Based on real-world collaboration patterns and theoretical frameworks from supply chain management literature, cooperative structures can be categorized into three types: vertically suppressed-dependent (z), horizontally balanced-mutual (h), and strategically allied (u) (Leng and Parlar, 2005; Govindan et al., 2013; Wang et al., 2021). The vertically suppressed-dependent (z) structure is characterized by a dominant upstream or downstream entity exerting control over pricing and resource allocation, while other members remain dependent with limited decision-making autonomy. This type of relationship aligns with traditional vertical integration models where power asymmetry leads to imbalanced benefit distribution. In contrast, the horizontally balanced-mutual (h) structure involves peers at the same level collaborating to enhance joint performance, such as through cost-sharing or demand pooling. These partnerships are typically based on mutual trust and equal bargaining power, often seen in horizontal cooperation among logistics providers or tourism operators. Finally, the strategically allied (u) structure refers to cross-tier collaborations aimed at long-term value creation, where participants share resources, risks, and benefits to achieve common strategic goals. This type of alliance is commonly studied in the context of strategic partnerships, joint ventures, and innovation ecosystems.
Based on these well-established typologies, the following analysis will focus on the profit distribution dynamics under both scenic area-led and MaaS platform-led supply chain structures when cooperation strategies are considered.
4.2 Centralized decision-making
4.2.1 The model under destination-led tourism supply chains
In destination-led supply chain configurations, 21 empirically observed collaboration networks exist among upstream, midstream, and downstream participants, designated as . scenario demonstrates benefit game interactions where destination operator “o” collaborates with mobility integrator “t”, with the corresponding supply chain structure detailed in Figure 2.
At this point, the total service demand is Q1ot = a − b (p1ot + p1m + p1s + p1l). The profit functions for each member of the supply chain are as follows:
Similarly, using backward induction to solve Equations 13 and 14, we find the first-order partial derivatives of π1s with respect to p1s and π1l with respect to p1l, setting them equal to 0. This yields: , . Substituting and into Equation 12, we solve for the first-order partial derivative of π1m with respect to p1m and set it equal to 0, resulting in: . Then substituting back into and , and further into Equation 11, we solve for the first-order partial derivative of π1ot with respect to p1ot and set it equal to 0, yielding: . The optimal decision variables for other members can then be solved as:
The optimal profits for upstream, midstream, and downstream participants are:
The overall profit of the supply chain is given by: .
The remaining 20 collaborative network scenarios are analyzed using the established method to calculate their respective benefit distribution ratios, with full results illustrated in Figure 3. In Figure 3, the horizontal axis represents different cooperation network situations, and the vertical axis represents the proportion of benefit distribution.
Figure 3
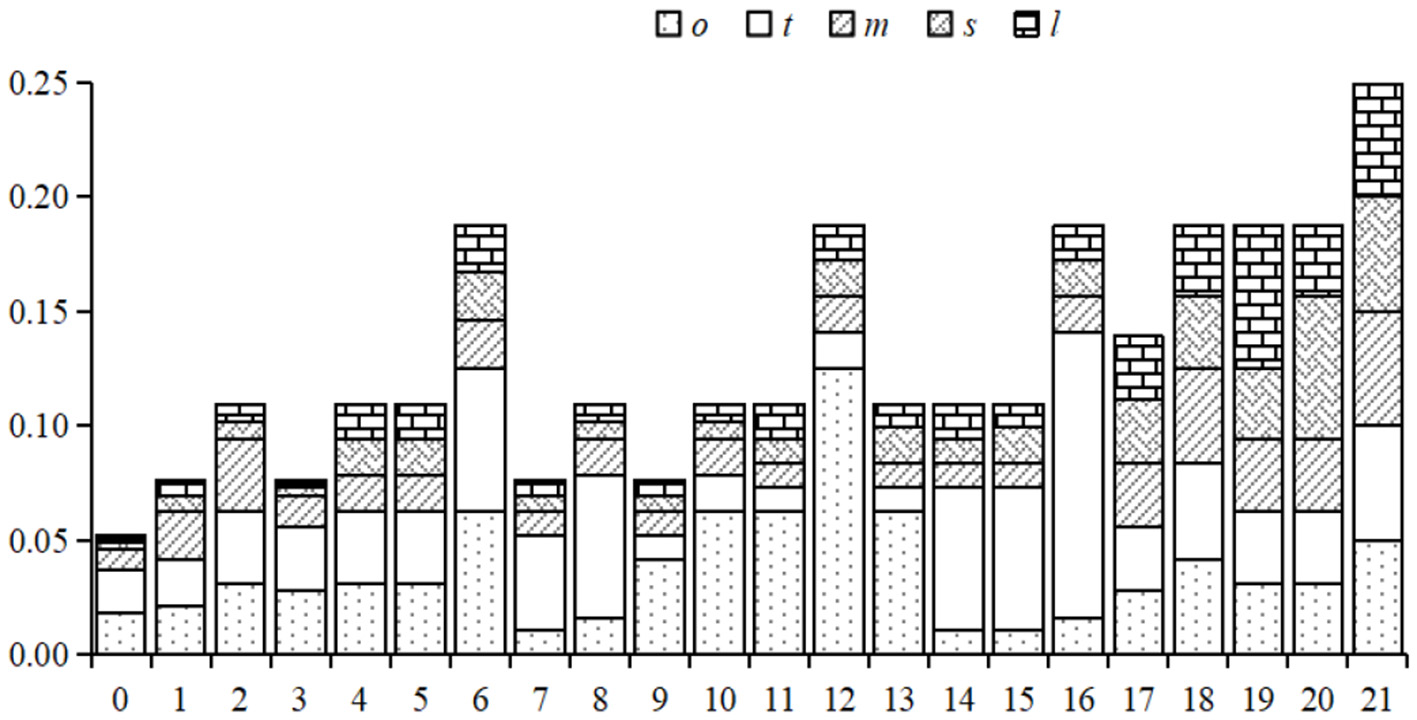
The benefit distribution across collaborative networks in destination-led supply chains.
Figure 3 reveals significant disparities in maximum benefit shares among entities within destination-led supply chains: upstream destinations and mobility platforms attain up to 1/8, midstream MaaS platforms 1/4, and downstream service providers 1/16. Certain collaborative networks prioritize single-entity profit maximization at the expense of others, creating imbalanced allocations that weaken supply chain coordination, reduce market adaptability, and hinder sustainable development. Full upstream-downstream alliances demonstrate more equitable benefit distributions with minimized individual deviations from peak gains while achieving collective optimization. This demonstrates that multi-entity collaboration optimizes resource allocation, enhances supply chain resilience, and promotes coordinated industrial development.
Conclusion 3. In destination-led MaaS tourism-logistics supply chains, hierarchical profit disparities arise from upstream entities' unilateral maximization strategies, though full cross-tier alliances achieve more equitable distributions and systemic resilience through balanced resource optimization.
In a destination-driven supply chain, through the analysis of 20 cooperative network scenarios, it can be found that decentralized decision-making leads to a severely uneven distribution of profits, with the upstream scenic areas and MaaS platforms occupying a larger share, while the profit shares of the middle and downstream service providers are smaller. This unbalanced distribution weakens the coordination of the supply chain, reduces market adaptability, and hinders sustainable development. In contrast, under centralized decision-making, supply chain members achieve overall profit maximization through cooperation, with a more equitable profit distribution and minimized deviation between individual and peak earnings. This cooperation optimizes resource allocation, enhances the resilience of the supply chain, and promotes coordinated development of the industry.
Management Implications. To address the unequal profit distribution, stakeholders must shift from single-group dominance to collaborative partnerships. First, adopt transparent profit-sharing systems, such as blockchain-based platforms, to ensure fairness and reduce reliance on powerful upstream players. Second, design incentive structures that reward collective performance metrics, like customer satisfaction or environmental impact, instead of individual sales targets. This encourages all groups to prioritize shared success. Third, regulators should enforce profit-sharing transparency rules to curb monopolistic practices by dominant players. Fourth, governments can offer tax incentives or subsidies to encourage cross-tier partnerships, such as integrated tourism-logistics bundles, which unlock systemic value and enhance supply chain resilience. By embedding equity and interdependence into governance frameworks, the industry can transition from fragmented competition to cooperative ecosystems that balance profitability with sustainability.
Further, the distribution of the three types of cooperation structures specifically involved in these 21 cooperation situations was statistically analyzed, and the results are shown in Table 2.
Table 2
| The situation of the cooperative network | z | h | u | |
|---|---|---|---|---|
| [o, t, m, s, l] | 4 | 2 | 0 | |
| [(o, t), m, s, l] | 3 | 1 | 1 | |
| [(o, t), m, (s, l)] | 2 | 0 | 2 | |
| [o, t, m, (s, l)] | 3 | 1 | 1 | |
| [(o, t), (m, s), l] | 2 | 0 | 2 | |
| [(o, t), (m, l), s] | 2 | 0 | 2 | |
| [(o, t), (m, s, l)] | 1 | 0 | 5 | |
| [(o, m), t, s, l] | 3 | 1 | 1 | |
| [(o, m), t, (s, l)] | 2 | 0 | 2 | |
| [(t, m), o, s, l] | 3 | 1 | 1 | |
| [(t, m), o, (s, l)] | 2 | 0 | 2 | |
| [o, (t, m, s), l] | 2 | 0 | 4 | |
| [o, (t, m, s, l)] | 1 | 0 | 4 | |
| [o, (t, m, l), s] | 2 | 0 | 4 | |
| [t, (o, m, s), l] | 2 | 0 | 4 | |
| [t, (o, m, l), s] | 2 | 0 | 4 | |
| [t, (o, m, s, l)] | 1 | 0 | 4 | |
| [(o, t, m), s, l] | 2 | 1 | 4 | |
| [(o, t, m), (s, l)] | 1 | 0 | 5 | |
| [(o, t, m, s), l] | 1 | 0 | 4 | |
| [(o, t, m, l), s] | 1 | 0 | 4 | |
| [(o, t, m, l, s)] | 0 | 0 | 6 | |
Distribution of collaboration structures in destination-led supply chain networks.
4.2.2 The model under MaaS service integration platform-led supply chains
In MaaS platform-dominated supply chain architectures, 24 empirically viable collaboration networks exist among upstream, midstream, and downstream participants: . The backward induction method, consistent with the analytical approach applied to destination-led supply chains under cooperative strategies, determines corresponding benefit allocation ratios, with complete computational outcomes visualized in Figure 4. In Figure 4, the horizontal axis represents different cooperation network situations, and the vertical axis represents the proportion of benefit distribution.
Figure 4
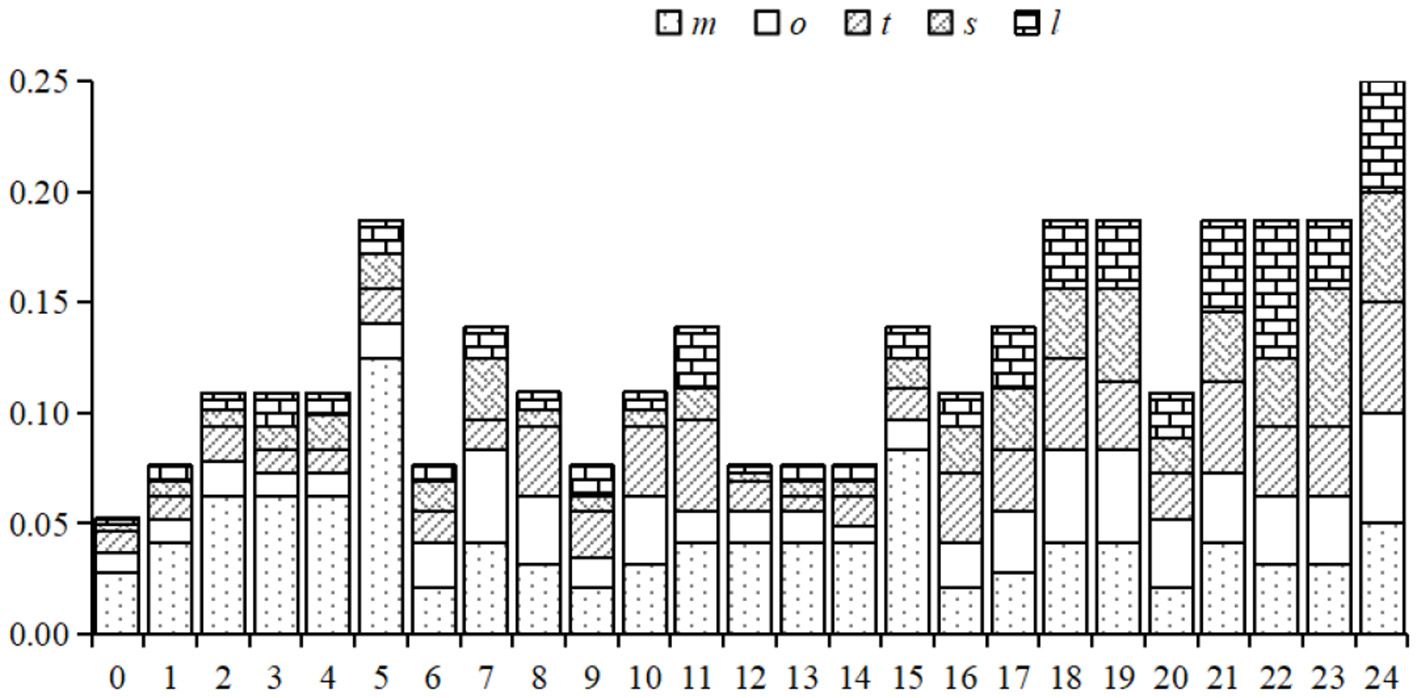
Benefit distribution across collaborative networks in MaaS platform-dominated supply chains.
Figure 4 reveals prevalent imbalanced benefit distributions across most collaborative networks in MaaS platform-dominated supply chains. In platform-centric structures, the MaaS integrator secures 1/8 of total benefits, while midstream destinations and mobility providers receive 1/20 each, and downstream service providers 1/16. This single-entity benefit concentration creates systemic fragility, limiting risk buffering capacities and undermining long-term supply chain resilience. However, when the MaaS platform initiates full-chain alliances, benefit allocations optimize toward individual peak gains (approximating 1/8-1/16 range) while maximizing collective outputs. Such models strengthen cross-tier incentive alignment, enhance coordinated responses to market shifts, and validate multi-level collaboration as the critical pathway for resilience-building and industrial transformation.
Conclusion 4. In MaaS platform-dominated supply chains, unequal benefit distribution undermines resilience, but full-chain collaboration among all tiers ensures fairer profit shares and strengthens long-term sustainability.
In the supply chain dominated by MaaS platform, decentralized decision-making also leads to uneven profit distribution. MaaS platform, as the leading Party, has obtained a larger share of profits, while midstream and downstream partners have a smaller share of profits. This concentration of interests of a single entity causes the vulnerability of the system, limits the risk buffer capacity, and weakens the long-term elasticity of the supply chain. However, under the centralized decision-making, the Maas platform cooperates closely with all levels to achieve a more equitable profit distribution. This cooperation not only optimizes the allocation of resources, but also enhances the adaptability of the supply chain to market changes, and verifies that multi-level cooperation is the key path of resilience construction and industrial transformation.
Management Implications. To address this imbalance, MaaS platforms should prioritize forming inclusive partnerships that involve all supply chain tiers. This requires adopting transparent profit-sharing models, such as blockchain-based systems, to ensure fairness and reduce dependency on the platform integrator. Additionally, stakeholders should invest in joint training programs or shared data platforms to improve coordination and trust across tiers. Regulatory bodies can also play a role by enforcing rules that prevent monopolistic behavior and encourage collaborative practices. By embedding equity and interdependence into governance frameworks, the industry can build stronger, more cohesive ecosystems that balance profitability with long-term resilience.
Statistical analysis of the 24 collaboration scenarios against the three structural types confirms their distribution patterns, with detailed results in Table 3.
Table 3
| The situation of the cooperative network | z | h | u | |
|---|---|---|---|---|
| [m, o, t, s, l] | 4 | 2 | 0 | |
| [m, (o, t), s, l] | 3 | 1 | 1 | |
| [m, (o, t), (s, l)] | 2 | 0 | 2 | |
| [m, (o, t, s), l] | 2 | 1 | 3 | |
| [m, (o, t, l), s] | 2 | 1 | 3 | |
| [m, (o, t, s, l)] | 1 | 0 | 4 | |
| [(m, o), t, s, l] | 3 | 1 | 1 | |
| [(m, o), s, (t, l)] | 2 | 0 | 2 | |
| [(m, o), t, (s, l)] | 2 | 0 | 2 | |
| [(m, t), o, s, l] | 3 | 1 | 1 | |
| [(m, t), o, (s, l)] | 2 | 0 | 2 | |
| [(m, t), (o, s), l] | 2 | 0 | 2 | |
| [m, o, t, (s, l)] | 4 | 1 | 1 | |
| [m, o, (t, l), s] | 3 | 0 | 1 | |
| [m, (o, s), t, l] | 3 | 0 | 1 | |
| [m, (o, s), (t, l)] | 2 | 0 | 2 | |
| [(m, o, s), t, l] | 2 | 1 | 3 | |
| [(m, o, t), s, l] | 2 | 0 | 4 | |
| [(m, o, t), (s, l)] | 1 | 0 | 5 | |
| [(m, o, s), (t, l)] | 1 | 0 | 4 | |
| [(m, t, l), o, s] | 2 | 1 | 3 | |
| [(m, t, l), (o, s)] | 1 | 0 | 4 | |
| [(m, o, t, s), l] | 1 | 0 | 4 | |
| [(m, o, t, l), s] | 1 | 0 | 4 | |
| [(m, o, t, s, l)] | 0 | 0 | 8 | |
Distribution of collaboration structures in MaaS platform-dominated supply chain networks.
5 Impact analysis of cooperative network attributes
5.1 The characteristics of benefit distribution
According to Figure 3 and Table 2, and Figure 4 and Table 3, the relationships among participants and overall profits under the scenic-spot-dominated and MaaS service integration platform-dominated supply chain cooperation networks can be obtained respectively. The results are shown in Tables 4, 5.
Table 4
| Cooperative network | z | h | u | Proportion of total revenue |
|---|---|---|---|---|
| 4 | 2 | 0 | 17/324 | |
| 3 | 1 | 1 | 11/144 | |
| 2 | 0 | 2 | 7/64 | |
| 2 | 0 | 4 | 7/64 | |
| 2 | 1 | 4 | 5/36 | |
| 1 | 0 | 4 | 3/16 | |
| 1 | 0 | 5 | 3/16 | |
| 0 | 0 | 6 | 1/4 |
Member Relationships and Total Benefits in Destination-Led Supply Chain Networks.
Table 5
| Cooperative network | z | h | u | Proportion of total revenue |
|---|---|---|---|---|
| 4 | 2 | 0 | 17/324 | |
| 4 | 1 | 1 | 11/144 | |
| 3 | 1 | 1 | 11/144 | |
| 3 | 0 | 1 | 11/144 | |
| 3 | 1 | 1 | 11/144 | |
| 2 | 0 | 2 | 7/64 | |
| 2 | 1 | 3 | 7/64 | |
| 2 | 0 | 2 | 5/36 | |
| 2 | 0 | 4 | 5/36 | |
| 1 | 0 | 4 | 3/16 | |
| 1 | 0 | 5 | 3/16 | |
| 0 | 0 | 8 | 1/4 |
Member relationships and total benefits in MaaS platform-dominated supply chain networks.
The analysis in Tables 4, 5 reveals the core trends of profit distribution in the supply chain dominated by scenic areas or MaaS service integration platforms under different cooperation structures: the higher the proportion of strategic alliance-type (u) structure in the cooperation network, the greater the total proportion of overall benefits in the supply chain; the higher the proportion of vertical dependency-type (z) structure, the smaller the total proportion of overall benefits. From the perspective of game theory logic, the performance differences of different network types stem from the strategy choices and equilibrium states of the participating entities.
Under the vertical dependency-type (z) structure, power is concentrated in the core entities at the vertical level, and all supply chain participants are in a non-cooperative game state. The leading entity aims to maximize individual profits and controls pricing and resource allocation rights. Upstream or downstream dependent entities, due to limited decision-making autonomy, can only passively adapt to the strategy of the leading party, ultimately forming a non-cooperative Nash equilibrium. This individual rational strategy choice, due to the lack of cross-level strategic coordination, leads to low resource allocation efficiency, and thus manifests as a decline in the overall performance of the supply chain; at the same time, the imbalance in profit distribution caused by the asymmetry of power also makes small participating entities lack the motivation for reinvestment and innovation, further weakening the long-term competitiveness of the supply chain.
In contrast, the horizontal balance-type (h) structure breaks the decision-making constraints of a single entity through horizontal collaboration among entities at the same level (such as cost sharing and demand aggregation), and participants form a collaborative game strategy based on equal bargaining power. To a certain extent, this achieves an increase in value creation and profit distribution balance. The cross-level cooperation of the strategic alliance-type (u) structure further breaks the limitations of individual rationality, and the participating entities build cooperation strategies with the goal of maximizing the overall profit of the alliance, achieving the alliance equilibrium of cooperative game. Under this model, the cross-level resource sharing, risk sharing, and benefit sharing mechanism not only optimizes resource allocation efficiency but also fully stimulates the innovation motivation of each entity (such as the collaboration between the MaaS platform's transportation data and the scenic area's tourism package design), ultimately promoting the overall sum of supply chain benefits to the optimal level.
From the perspective of game theory, the advantage of the strategic alliance-type structure essentially lies in the Pareto improvement of cooperative game over non-cooperative game: by designing fair profit distribution mechanisms and collaborative incentive rules, the vertical-level power asymmetry is weakened, and the individual strategies of each participant and the overall benefits of the supply chain tend to be consistent. This also provides an inspiration for the optimization of the MaaS tourism logistics supply chain: supply chain stakeholders should prioritize the construction of strategic alliance-type cooperation networks, through clear profit sharing rules and cross-level collaborative incentive mechanisms, replacing the traditional vertical control model, in order to achieve the improvement of overall profitability and risk resistance capacity.
5.2 The influence of cooperative network attributes
By analyzing the operational logic and development trajectory of the MaaS tourism logistics service supply chain, five key evolution patterns have been identified: First, as the integration between logistics and tourism deepens, the MaaS service integration platform gradually moves from the periphery to the core of the supply chain, reflecting its growing capabilities in resource integration and innovation. Second, profit distribution shows clear stage characteristics. In the early stages, it is guided by hierarchical position and basic contribution, while in later mature stages, the distribution system is restructured around new development goals and value creation. Third, economic performance continues to grow. Optimization of supply chain collaboration efficiency promotes simultaneous increases in overall revenue and individual enterprise profits, forming a virtuous cycle of development. Fourth, the mode of participant collaboration undergoes structural change. Traditional vertical suppression and superficial horizontal cooperation are gradually replaced by deep strategic partnerships, indicating a shift from conventional hierarchical-driven coordination to innovation-driven collaboration. Fifth, the supply chain network structure continuously improves. The frequency of interaction and depth of cooperation among participants keep increasing, laying a solid and closely connected foundation for sustainable industry development.
Based on these patterns, combined with the profit distribution data and member relationship characteristics of both scenic-spot-dominated and MaaS service integration platform-dominated supply chains, a complete development path has been systematically constructed and presented in Figure 5. The study finds that during the evolution of both dominant models, the relational structure of the supply chain undergoes significant changes: vertical suppression-dependent relationships continue to weaken, indicating that traditional one-way profit extraction can no longer meet the needs of modern collaborative development. Although balanced equal relationships decrease in number, this actually reflects a shift toward more flexible and efficient collaboration modes better suited to dynamic market demands. Among these patterns, the steady growth of cooperative alliance relationships is particularly critical, indicating that in response to complex and changing market environments, supply chain participants are more inclined to enhance overall risk resistance and adaptability through alliance mechanisms involving resource integration and shared risk. As the relational structure improves, total supply chain benefits continue to rise, and network relationships become increasingly complex, confirming the positive impact of deep collaboration on resource integration efficiency. This reveals that regardless of their position in the supply chain, optimizing cooperation and promoting industrial coordination are essential strategies for addressing market challenges.
Figure 5
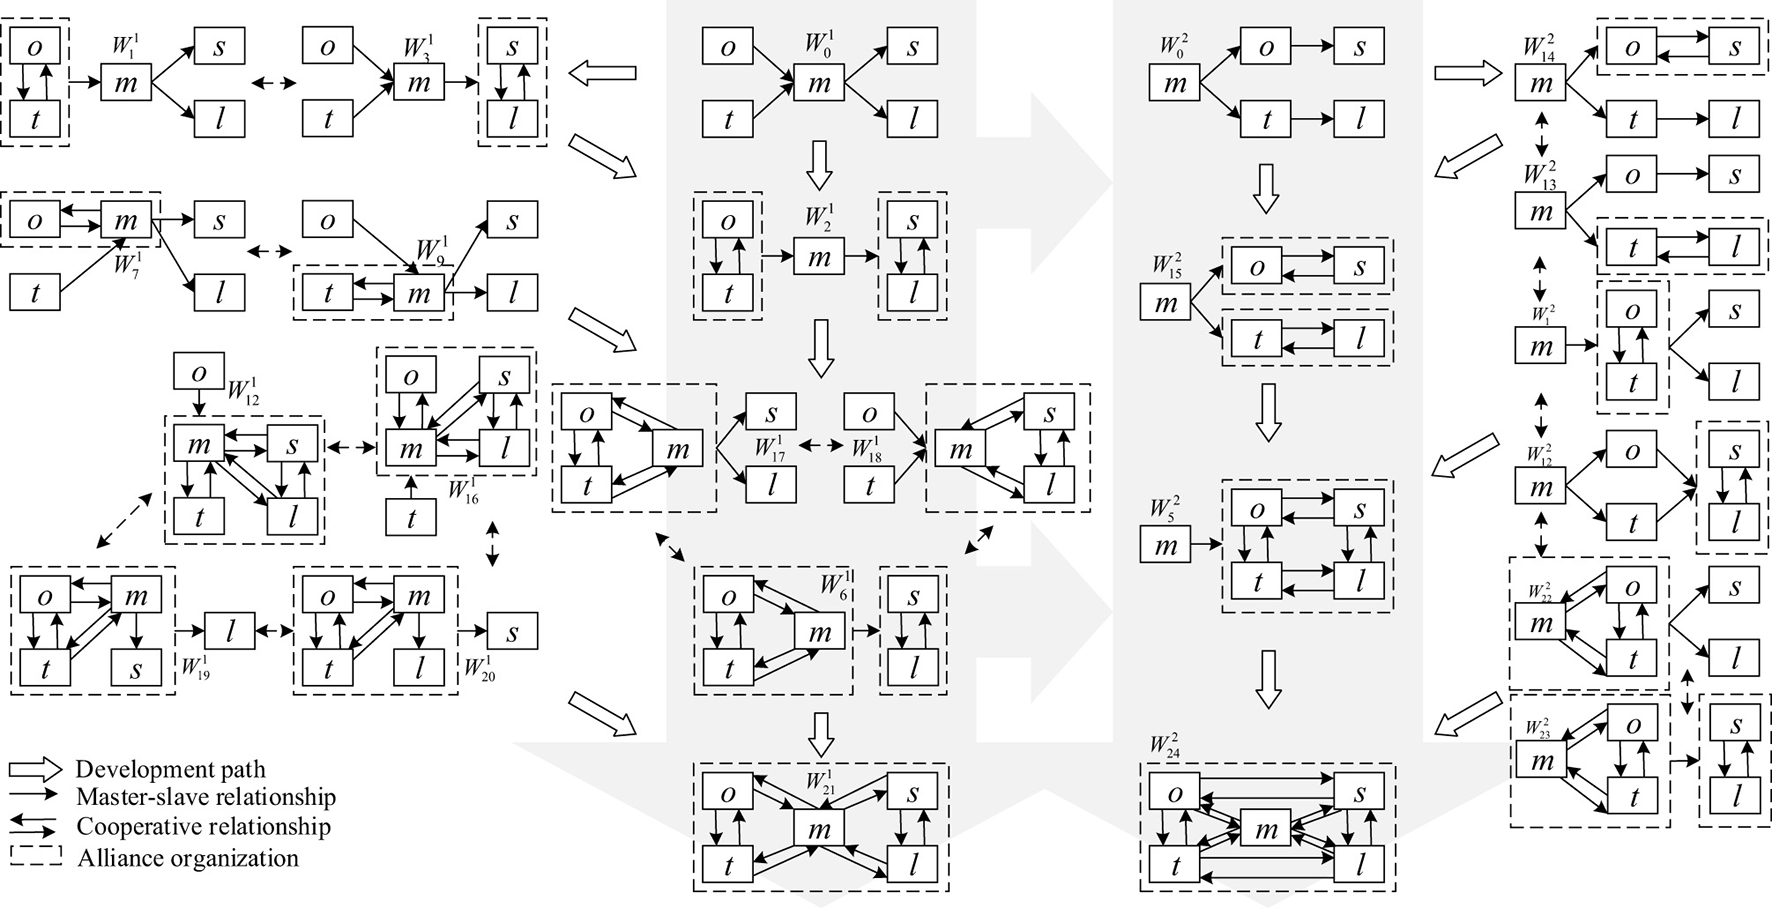
Development pathways for MaaS tourism-logistics service supply chains.
According to Figure 5, in the development path where the MaaS platform acts as a follower, the evolution from the 1st to the 12th cooperation structure has typical demonstration significance. In the initial stage, independent operations of each participant lead to slow market response and insufficient resilience of the supply chain. With gradual cooperation, the MaaS platform first establishes direct connections with scenic spots and travel platforms, breaking information barriers and achieving preliminary resource integration. Later, through bilateral alliances in multiple intermediate stages, it eventually forms a grouped collaboration pattern of (m, o, t) and (s, l). This process promotes specialization in tourism services, allowing each participant to play its role based on expertise. When niche tourism demand suddenly increases, these group alliances can quickly allocate resources, significantly improving the supply chain's responsiveness and resilience.
The evolution from the 0th to the 16th cooperation structure demonstrates innovative exploration under resource constraints. In the 16th structure, the multi-party cooperation model achieves efficient integration of tourism and logistics services by combining resources from scenic spots, service providers, and logistics enterprises, offering customized solutions for niche markets such as business travel and senior tourism. This service model not only meets diverse demands but also reduces risks from market fluctuations by diversifying business types. For example, during off-season periods, customized services maintain stable customer groups and ensure continuous supply chain operation, effectively enhancing risk resistance.
When the MaaS platform takes a dominant position, the evolution from the 0th to the 16th cooperation structure highlights its integration advantage. In the 16th structure, the grouped collaboration of (m, o, s) and (t, l) focuses on deep integration of tourism and logistics services. The MaaS platform, leveraging its leadership, drives technological innovation—such as developing smart booking systems and optimizing route planning—to improve service integration and personalization, enhancing supply chain resilience in technology competition. The deepening of cooperation from the 0th to the 22nd structure further achieves service and model innovation through key collaborations between (m, o, t, s) and l. The application of big data forecasting and IoT tracking not only improves service intelligence but also builds a comprehensive risk warning and emergency response system, significantly enhancing the supply chain's ability to cope with unexpected events.
At the optimal development path level, as a follower, the MaaS platform starts from a loose non-cooperation state, builds a foundation of resource sharing through bilateral cooperation, gradually expands into a multi-party network, and finally reaches full strategic alliance at the twenty first structure. During this process, vertical suppression relationships are replaced by equal collaboration, significantly improving the supply chain's coordinated response capability in the face of demand changes and competitive pressure, achieving simultaneous improvements in efficiency, profit, and resilience. As a leader, the MaaS platform begins by establishing pricing power, deepens cooperation through multi-level coordination, and sets unified standards to optimize operations. Finally, at the 24th structure, a full-scale alliance is formed, achieving optimal resource allocation and intelligent scheduling, greatly enhancing the supply chain's adaptability to sudden market changes.
6 Discussion and conclusion
The existing MaaS research mainly focuses on concept development, system framework design and actual case analysis, which verifies the core value of MaaS in resource integration and service optimization. However, it has not yet explored the subject decision-making and profit distribution of MaaS tourism logistics supply chain from the perspective of multi-agent system analysis. Although the tourism logistics service supply chain research has applied game theory to the vertical and horizontal cooperation optimization analysis, there are still gaps in the research on the dynamic pricing decisions of different dominant structures under the MaaS scenario and the profit distribution characteristics under the multi-scenario cooperative game.
Different from the previous studies focusing on data sharing or resource integration of MaaS platform, this paper focuses on the cooperative network relationship between supply chain members, constructs a multi-agent game model including MaaS service integration platform, scenic area, tourism service integrator and logistics service integrator, and brings the dynamic pricing decision of adjacent levels of supply chain into the analysis framework. This paper systematically discusses the profit distribution mechanism under the two supply chain structures of scenic area leading and MaaS platform leading. Furthermore, by systematically enumerated a total of 45 cooperation scenarios under the two structures, and compared the distribution and profit distribution characteristics of the three network structures of vertical pressure type, horizontal balance type and strategic alliance type, this study revealed the path of cooperation network attributes driving the evolution of MaaS tourism logistics supply chain. This “evolution path” is based on the structural trend identified by multi-scenario static analysis, and theoretically elucidates the evolution direction of supply chain cooperation mode with the change of dominance and network relationship. It makes up for the lack of profit distribution and cooperative network evolution analysis in the existing MaaS research, and the insufficiency of tourism supply chain research to fully adapt to the dynamic pricing and multi-agent game characteristics of MaaS. The main conclusions are as follows:
-
(1) The two dominant supply chain structures exhibit distinct profit distribution mechanisms. In the scenic spot-led MaaS tourism logistics supply chain, non-cooperative decisions result in a hierarchical profit distribution pattern. Upstream scenic spots and tourism service integrators occupy the majority of profits due to their control over key resources, while midstream MaaS platforms gain efficiency advantages through data integration. In contrast, downstream tourism service operators and logistics providers only obtain a small share of profits due to weak bargaining power. This “upstream dominance–midstream coordination–downstream dependence” model undermines system resilience and long-term cooperative potential. In the MaaS platform-led structure, the platform reshapes the value network by leveraging its technological and data integration advantages, leading to concentrated profit distribution at the upstream level and compressed profits for midstream and downstream members. While the platform's leading position improves short-term resource allocation, it may increase system vulnerability over time. Additionally, regardless of the structure, the lack of cooperation leads to inefficient resource utilization, unfair profit distribution, and instability. A full-chain alliance is an effective path to balance profit distribution, enhance participants' enthusiasm, and improve overall responsiveness.
-
(2) Cooperative network structures exert significant heterogeneous impacts on the fairness and efficiency of profit distribution. The vertical suppression structure strengthens the dominant party's control, leading to high profit concentration and minimal profit shares for midstream and downstream members. The horizontal balance structure promotes resource sharing and cost-sharing among peers at the same level, improving partial efficiency despite limited cross-level coordination effectiveness. The strategic alliance structure achieves maximum overall profits and system resilience through cross-level resource integration and risk-sharing, while also establishing a more reasonable profit distribution mechanism. These differences indicate that the choice of cooperative structure directly affects the fairness and efficiency of profit distribution, and in-depth cooperation is crucial for the coordinated development of the industry.
-
(3) The evolution of MaaS tourism logistics supply chains is driven by the attributes of collaborative networks, presenting a structural change trend from “vertical suppression → horizontal balance → strategic alliance.” This evolutionary process involves the fundamental restructuring of the supply chain's relationship framework: weakened vertical control, enhanced horizontal trust, and a shift from hierarchy-driven to innovation-driven cooperation. It facilitates in-depth resource integration, improved coordination mechanisms, and the construction of more complex network structures, laying an institutional foundation for the sustainable development of the industry. This evolution not only enhances the system's adaptability to external shocks but also strengthens internal cohesion and sustainable development capacity, emerging as a core force driving the continuous optimization of MaaS-based tourism logistics supply chains.
The implications of this study for practice are as follows.
-
(1) Optimize the cooperation network relationship. Both firms and policy makers should aim to improve collaborative networks to achieve a more equitable distribution of profits. In the scenic area as the core model, midstream and downstream participants should be encouraged to enhance their competitiveness through technological innovation and service improvement, thereby reducing their dependence on upstream entities. For example, scenic spots can work with local technology companies to introduce intelligent navigation systems to enhance the visitor experience while reducing operating costs. In the MaaS platform as the core model, policy intervention or market mechanism should be used to limit the excessive rent-seeking behavior of the platform, which will help improve the balance of profit distribution. For example, the government could require MaaS platforms to share part of their data with tourism service providers by developing data sharing contracts to promote cooperation and level the playing field.
-
(2) Choose the appropriate network structure. Enterprises should choose the appropriate network structure according to their own resources and market position. For enterprises with strong resource control ability, the scenic area-oriented model may be more conducive to maximizing profits. For enterprises with strong technology integration capabilities, the MaaS platform-oriented model may be more advantageous. In addition, enterprises should actively seek cross-level cooperation to enhance their overall competitiveness by sharing resources and risks. For example, in the governance of MaaS at the city level, the government can promote cooperation between scenic spots, MaaS platforms and logistics service providers to optimize resource allocation and improve overall operational efficiency by establishing joint operation centers.
-
(3) Promote deep collaboration of all parts of the supply chain. Policymakers should encourage deeper collaboration among supply chain players. Strategic alliances or joint ventures help create long-term value. For example, tax incentives or financial support could be provided to promote cooperation between upstream and downstream enterprises. This can drive technological innovation and service upgrading. Efforts should also be made to develop industry standards and increase transparency and standardization across the supply chain. For example, through the establishment of a unified data sharing platform to promote the flow of information among all participants, improve the scientific nature and transparency of decision-making.
This study has some limitations, but it also points the way for future research. First, this paper builds a multi-agent game model based on assumptions such as information symmetry, complete rationality, and stable demand. These simplifications help clearly identify the impact mechanisms of power structure and collaborative networks on profit distribution at the theoretical level, providing a benchmark analysis framework for related research. However, in real-world scenarios with highly asymmetric information, significant decision-making biases, or severe market fluctuations, the applicability of the model's conclusions may be limited. Future research can gradually introduce asymmetric information games, behavioral decision-making theories, and stochastic demand models to enhance the model's explanatory power for complex real-world situations. Second, the evolutionary path based on static comparison in this study reveals the trend of structural change. Follow-up work can use evolutionary game theory or multi-agent simulation methods to examine how supply chain members achieve dynamic transitions in cooperation patterns through long-term learning and strategic interaction, thereby providing a process-oriented validation and refinement of the path proposed in this paper.
In addition, this study reveals the macro impact of different collaborative network structures on profit through classification and comparison. Future research can build on this by introducing micro parameters such as trust levels and information sharing, to explore how these variables affect the formation and stability of collaborative networks. This will further reveal the micro mechanisms underlying the macro patterns discovered in this study. In terms of empirical research, this paper focuses on theoretical derivation. Future work can combine case studies or industry data, especially in MaaS systems dominated by scenic spots and platforms, to empirically test the theory and enhance its operability and guiding value. Furthermore, given that institutional frameworks, regulatory policies, and cultural characteristics across different jurisdictions may exert a moderating effect on the collaborative logic of MaaS supply chains, future research can focus specifically on this dimension to verify and extend the cross-contextual applicability of the study's core conclusions. Finally, the benchmark model established in this study lays the foundation for exploring more complex real-world situations. Future research can relax relevant constraints, introduce non-linear relationships, cost differences, and stochastic disturbances, and use sensitivity analysis to test the robustness of the conclusions. This can be extended to the study of dynamic cooperation patterns in supply chains under different market environments and cost structures.
Statements
Data availability statement
The raw data supporting the conclusions of this article will be made available by the authors, without undue reservation.
Author contributions
JZ: Conceptualization, Data curation, Formal analysis, Funding acquisition, Methodology, Software, Supervision, Validation, Writing – original draft. KL: Conceptualization, Investigation, Methodology, Software, Supervision, Writing – original draft, Writing – review & editing.
Funding
The author(s) declare that financial support was received for the research and/or publication of this article. This research was funded by the Special Project for Revolutionary Cultural Relics of the Federation of Social Sciences of Shanxi Province, grant number SXGMWW2024029 and financial subsidies for doctoral graduates to work in Shanxi.
Conflict of interest
JZ and KL were employed by Shanxi Culture and Tourism Industry Planning and Design Research Institute Co., Ltd.
Generative AI statement
The author(s) declared that generative AI was not used in the creation of this manuscript.
Any alternative text (alt text) provided alongside figures in this article has been generated by Frontiers with the support of artificial intelligence and reasonable efforts have been made to ensure accuracy, including review by the authors wherever possible. If you identify any issues, please contact us.
Publisher’s note
All claims expressed in this article are solely those of the authors and do not necessarily represent those of their affiliated organizations, or those of the publisher, the editors and the reviewers. Any product that may be evaluated in this article, or claim that may be made by its manufacturer, is not guaranteed or endorsed by the publisher.
Supplementary material
The Supplementary Material for this article can be found online at: https://www.frontiersin.org/articles/10.3389/frsc.2025.1703640/full#supplementary-material
References
1
Agatz N. Cho S.-H. Sun H. Wang H. (2024). Transportation-enabled services: concept, framework, and research opportunities. Serv. Sci.16, 1–21. doi: 10.1287/serv.2024.0116
2
Amey A. Attanucci J. Mishalani R. (2011). Real-time ridesharing. Transp. Res. Rec.2217, 103–110. doi: 10.3141/2217-13
3
Bucchiarone A. Battisti S. Marconi A. Maldacea R. Ponce D. C. (2021). Autonomous Shuttle-as-a-Service (ASaaS): challenges, opportunities, and social implications. IEEE Transact. Intell. Transp. Syst.22, 3790–3799. doi: 10.1109/TITS.2020.3025670
4
Calderón F. Miller E. J. (2020). A literature review of mobility services: definitions, modelling state-of-the-art, and key considerations for a conceptual modelling framework. Transp. Rev.40, 312–332. doi: 10.1080/01441647.2019.1704916
5
Cao R. Mo Y. Ma J. (2023). Carbon footprint analysis of tourism life cycle: the case of guilin from 2011 to 2022. Sustainability15:7124. doi: 10.3390/su15097124
6
Cao X. Hongguang B. Yongkui L. Liu X. (2023). Effects of different resource-sharing strategies in cloud manufacturing: a Stackelberg game-based approach. Int. J. Prod. Res.61, 520–540. doi: 10.1080/00207543.2021.2010824
7
Chang C.-W. Chiang D. M. Pai F.-Y. (2012). Cooperative strategy in supply chain networks. Indust. Market. Manag.41, 1114–1124. doi: 10.1016/j.indmarman.2012.04.011
8
Chinaei M. H. Taha H. R. Waller T. (2023). Digitally transferable ownership of mobility-as-a-service systems using blockchain and smart contracts. Transport. Lett.15, 54–61:2018556. doi: 10.1080/19427867.2021.2018556
9
Chiwaridzo O. T. (2024). Unleashing tomorrow's energy for sustainable development: pioneering green building technologies and green tourism supply chain management in Zimbabwe's tourism sector. Energy Sustain. Dev.78:101382. doi: 10.1016/j.esd.2024.101382
10
Cisterna C. Madani N. Bandiera C. Viti F. Cools M. (2023). MaaS modelling: a review of factors, customers' profiles, choices and business models. Eur. Transp. Res. Rev.15:37. doi: 10.1186/s12544-023-00597-y
11
Cottrill C. D. (2020). MaaS surveillance: privacy considerations in mobility as a service. Transport. Res. Part A Policy Pract.131, 50–57. doi: 10.1016/j.tra.2019.09.026
12
Daou S. Leurent F. (2024). Modelling mobility as a service: a literature review. Econ. Transport.39:100368. doi: 10.1016/j.ecotra.2024.100368
13
Du Z. Gong X. (2018). Current situation of research on the operation mechanism of domestic and overseas cross-border logistics alliance. China Bus. Market32, 37–49. doi: 10.14089/j.cnki.cn11-3664/f.2018.02.005
14
Duan S. X. Tay R. Molla A. Deng H. (2022). Predicting Mobility as a Service (MaaS) use for different trip categories: an artificial neural network analysis. Transport. Res. Part A Policy Pract.166, 135–149. doi: 10.1016/j.tra.2022.10.014
15
Erol I. Oztel A. Dogru T. Peker I. Neuhofer I. O. Benli T. (2024). Supply chain resilience in the tourism and hospitality industry: a comprehensive examination of driving and restraining forces. Int. J. Hosp. Manag.122:103851. doi: 10.1016/j.ijhm.2024.103851
16
Esztergár-Kiss D. Kerényi T. (2020). Creation of mobility packages based on the MaaS concept. Travel Behav. Soc.21, 307–317. doi: 10.1016/j.tbs.2019.05.007
17
Fong V. H. I. Hong J. F. L. Wong I. A. (2021). The evolution of triadic relationships in a tourism supply chain through coopetition. Tour. Manag.84:104274. doi: 10.1016/j.tourman.2020.104274
18
Gao S. Teng C. Sun J. (2016). Decision analysis of tourism supply chain based on bundling sales with different dominant power. China Soft Sci. Mag.7, 155–161.
19
Golbabaei F. Tan Y. Bunker J. (2021). The role of shared autonomous vehicle systems in delivering smart urban mobility: a systematic review of the literature. Int. J. Sustain. Transp.15, 731–748. doi: 10.1080/15568318.2020.1798571
20
Govindan K. Khodaverdi R. Jafarian A. (2013). A fuzzy multi criteria approach for measuring sustainability performance of a supplier based on triple bottom line approach. J. Clean. Prod.47, 345–354. doi: 10.1016/j.jclepro.2012.04.014
21
Gruchmann T. Maria T. Seeler S. (2022). Sustainable supply chain management in tourism: a systematic literature review. Supply Chain Forum Int. J.23, 329–346. doi: 10.1080/16258312.2022.2085504
22
Guo J. Zhou Y. Ren M. Hai B. (2019). Research on the operation strategy of dual-channel tourism supply chain based on fairness preference. J. Math. Pract. Theor.49, 109–119.
23
Han W. Huang Y. Hughes M. Zhang M. (2021). The trade-off between trust and distrust in supply chain collaboration. Indus. Market. Manag.98, 93–104. doi: 10.1016/j.indmarman.2021.08.005
24
Ho C. Q. Tirachini A. (2024). Mobility-as-a-Service and the role of multimodality in the sustainability of urban mobility in developing and developed countries. Transp. Policy145, 161–176. doi: 10.1016/j.tranpol.2023.10.013
25
Hosseinnezhad D. Nugroho Y. K. Heavey C. (2023). Horizontal collaboration between suppliers to mitigate supply chain disruption: a secure resource sharing strategy. Comput. Indus. Eng.177:109088. doi: 10.1016/j.cie.2023.109088
26
Jittrapirom P. Marchau V. van der Heijden R. Meurs H. (2020). Future implementation of mobility as a service (MaaS): results of an international Delphi study. Travel Behav. Soc.21, 281–294. doi: 10.1016/j.tbs.2018.12.004
27
Joshi S. (2022). A review on sustainable supply chain network design: dimensions, paradigms, concepts, framework and future directions. Sustain. Operat. Comput.3, 136–148. doi: 10.1016/j.susoc.2022.01.001
28
Kim Y. Choi T. Y. Yan T. Dooley K. (2011). Structural investigation of supply networks: a social network analysis approach. J. Operat. Manag.29, 194–211. doi: 10.1016/j.jom.2010.11.001
29
Lajas R. Macário R. (2020). Public policy framework supporting “mobility-as-a-service” implementation. Res. Transport. Econ.83:100905. doi: 10.1016/j.retrec.2020.100905
30
Leng M. Parlar M. (2005). Game theoretic applications in supply chain management: a review. INFOR43, 187–220. doi: 10.1080/03155986.2005.11732725
31
Li M. Suo L. Yao J. (2019). Research on supply chain scheduling optimization under TMC mode basedon multistage fuzzy scale effect quantification. Operat. Res. Manag. Sci.28, 59–68. doi: 10.12005/orms.2019.0175
32
Li P. Xu S. Liu L. (2022). Channel structure and greening in an omni-channel tourism supply chain. J. Clean. Prod.375:134136. doi: 10.1016/j.jclepro.2022.134136
33
Li W. Cheng J. Liu X. Mu K. Cai J. Liu W. (2023). Monitoring and assessing carbon footprint of individual trip chain in environment of mobility as a service. J. Transport. Syst. Eng. Inform. Technol.23, 22–31. doi: 10.16097/j.cnki.1009-6744.2023.02.003
34
Li W. Guan H. Han Y. Cao Y. (2022). Pricing game model of travel service chain under social preference view. J. Transport. Syst. Eng. Inform. Technol.22, 11–22. doi: 10.16097/j.cnki.1009-6744.2022.04.002
35
Li Z. Meng F. (2023). The potential and consistency of the Owen value for fuzzy cooperative games with a coalition structure. Fuzzy Optim. Decision Making22, 387–414. doi: 10.1007/s10700-022-09397-w
36
Liu C. Guo J. Li J. Yuan L. (2011). Technological innovation model and evolution pathway in cluster supply chain under horizontal cooperation. Res. Dev. Manag.23, 56–63. doi: 10.13581/j.cnki.rdm.2011.05.009
37
Liu S. Luo J. Wu L. (2024). Supply chain network location and enterprise production efficiency: perspective of social network analysis. Forward Position Econ.15, 21–44. doi: 10.14007/j.cnki.cjpl.2024.05.002
38
Liu T. Ceder A. (2015). Analysis of a new public-transport-service concept: Customized bus in China. Transp. Policy39, 63–76. doi: 10.1016/j.tranpol.2015.02.004
39
Liu Y. Bansal P. Daziano R. Samaranayake S. (2019). A framework to integrate mode choice in the design of mobility-on-demand systems. Transport. Res. Part C Emerg. Technol.105, 648–665. doi: 10.1016/j.trc.2018.09.022
40
Lopez-Carreiro I. Monzon A. Lopez E. (2023). MaaS Implications in the smart city: a multi-stakeholder approach. Sustainability15:su151410832. doi: 10.3390/su151410832
41
Lotfi M. Larmour A. (2022). Supply chain resilience in the face of uncertainty: how horizontal and vertical collaboration can help?Continuity Resil. Rev.4, 37–53. doi: 10.1108/CRR-04-2021-0016
42
Ma S. He Y. (2023). Investment of green technology in a tourism supply chain under competition. IEEE Trans. Eng. Manag.70, 1199–1214. doi: 10.1109/TEM.2022.3151349
43
Ma S. He Y. Gu R. (2023). Low-carbon tourism supply chain network optimisation with vertical and horizontal cooperations. Int. J. Prod. Res.61, 6251–6270. doi: 10.1080/00207543.2022.2063087
44
Mohebbi S. Li X. (2015). Coalitional game theory approach to modeling suppliers' collaboration in supply networks. Int. J. Prod. Econ.169, 333–342. doi: 10.1016/j.ijpe.2015.08.022
45
Montoya-Torres J. R. Ortiz-Vargas D. A. (2014). Collaboration and information sharing in dyadic supply chains: a literature review over the period 2000–2012. Estud. Gerenciales30, 343–354. doi: 10.1016/j.estger.2014.05.006
46
Mubiru I. Westerholt R. (2024). A scoping review on the conceptualisation and impacts of new mobility services. Eur. Transp. Res. Rev.16:12. doi: 10.1186/s12544-024-00633-5
47
Pishchulov G. Richter K. Golesorkhi S. (2023). Supply chain coordination under asymmetric information and partial vertical integration. Ann. Oper. Res.329, 1315–1356. doi: 10.1007/s10479-022-04705-4
48
Piya S. Triki C. Al Maimani A. Mokhtarzadeh M. (2023). Optimization model for designing personalized tourism packages. Comput. Indus. Eng.175:108839. doi: 10.1016/j.cie.2022.108839
49
Polydoropoulou A. Pagoni I. Tsirimpa A. Roumboutsos A. Kamargianni M. Tsouros I. (2020). Prototype business models for Mobility-as-a-Service. Transport. Res. Part A Policy Pract.131, 149–162. doi: 10.1016/j.tra.2019.09.035
50
Qi Y. Wang X. Zhang M. Wang Q. (2023). Developing supply chain resilience through integration: an empirical study on an e-commerce platform. J. Operat. Manag.69, 477–496. doi: 10.1002/joom.1226
51
Ramanathan U. (2014). Performance of supply chain collaboration – a simulation study. Expert Syst. Appl.41, 210–220. doi: 10.1016/j.eswa.2013.07.022
52
Rashid A. Rasheed R. Ngah A. H. Pradeepa Jayaratne M. D. R. Rahi S. Tunio M. N. (2024). Role of information processing and digital supply chain in supply chain resilience through supply chain risk management. J. Glob. Operat. Strat. Sourc.17, 429–447. doi: 10.1108/JGOSS-12-2023-0106
53
Senyo P. K. Osabutey E. L. C. (2023). Transdisciplinary perspective on sustainable multi-tier supply chains: a triple bottom line inspired framework and future research directions. Int. J. Prod. Res.61, 4918–4933. doi: 10.1080/00207543.2021.1946194
54
Shao Y. Li X. Yao L. (2019). Exploring the influence of MaaS on urban space. Urban Syud.26, 60–64.
55
Shi Y. Huang L. Chen M. Cai Y. Chu L.-K. (2024). Reselling or marketplace channel? A manufacturer's strategic decisions for differentiated brands considering channel's service level. Electron. Comm. Res. Appl.63:101353. doi: 10.1016/j.elerap.2023.101353
56
Shibayama T. Laa B. (2024). Sustainable Mobility Guarantee: developing the concept from a transport planning perspective. Transp. Policy155, 287–299. doi: 10.1016/j.tranpol.2024.07.003
57
Singh R. K. Mishra R. He Q. (2025). Sustainable supply chain and environmental collaboration in the supply chain management: agenda for future research and implications. Bus. Strategy Environ. 34, 5487–5513. doi: 10.1002/bse.4136
58
Sun L. Liu W. Zhang H. Jin Y. Zhuo G. (2021). Analysis of the effect of cruise service supply chain network properties on economic profits. Int. J. Ship. Trans. Log.13, 569–599. doi: 10.1504/IJSTL.2021.118525
59
Sun P. Kang W. Zhou X. (2022). Tourism supply chain integration, strategic choice and corporate growth of tourism listed companies: a fuzzy-set qualitative comparative analysis. Nankai Bus. Rev.25, 170–181.
60
Villena V. H. Revilla E. Choi T. Y. (2011). The dark side of buyer–supplier relationships: a social capital perspective. J. Operat. Manag.29, 561–576. doi: 10.1016/j.jom.2010.09.001
61
Wang N. Xu J. Wang M. (2023). The collaborative logistics investment strategy between manufacturer and retail platform: considering different power structures. Syst. Eng. Theor. Pract.43, 1156–1171. doi: 10.12011/SETP2022-1360
62
Wang W. Chen M. Lin W. Bian W. (2021). Pricing and Coordination in a dual-channel supply chain with product variety under the countervailing power of the retailer. IEEE Access9, 18817–18830. doi: 10.1109/ACCESS.2021.3054691
63
Wang X. Zhang M. Li J. Xu Y. Wang T. Zhang L. (2024). Theory and practices of mobility as a service: review and outlook. Acta Ecol. Sin.44, 2859–2872. doi: 10.20103/j.stxb.202301190122
64
Wiedmer R. Griffis S. E. (2021). Structural characteristics of complex supply chain networks. J. Bus. Logist.42, 264–290. doi: 10.1111/jbl.12283
65
Wong Y. Z. Hensher D. A. Mulley C. (2020). Mobility as a service (MaaS): charting a future context. Transport. Res. Part A Policy Pract.131, 5–19. doi: 10.1016/j.tra.2019.09.030
66
Wybraniec B. Roca E. Ortego M. I. Lazzarini B. (2024). Exploring the diversity of users of digital mobility services by developing personas – a case study of the Barcelona metropolitan area. Travel Behav. Soc.36:100818. doi: 10.1016/j.tbs.2024.100818
67
Yan Z. Liu L. (2019). Application of dual price name your own price with sales restriction intourism service supply chain. J. Indus. Eng. Eng. Manag.33, 131–139. doi: 10.13587/j.cnki.jieem.2019.02.015
68
Zhang L. Ma D. Hu J. (2022). Research on low carbon operation of tourism supply chain under corporate social responsibility. Operat. Res. Manag. Sci.31, 189–195. doi: 10.12005/orms.2022.0201
69
Zhao L. Chen Z. (2018). Vertical cooperative advertising in a tourism supply chain considering consuming preference. J. Syst. Manag.27, 753–760.
70
Zhu C. Wang H. (2021). Research on the countermeasures of rural tourism supply chain integration from the perspective of rural revitalization strategy. Econ. Prob.12, 75–81. doi: 10.16011/j.cnki.jjwt.2021.12.012
71
Zhu J. Jang J.-c. Zhu Y. Dong X. Wang S. Xing J. et al . (2025). Co-benefits of wind and solar power deployments for air pollutants and carbon emissions reduction in Guangdong province of China. Environ. Pollut.378:126485. doi: 10.1016/j.envpol.2025.126485
72
Zhu J. Xie N. Cai Z. Tang W. Chen X. (2023). A comprehensive review of shared mobility for sustainable transportation systems. Int. J. Sustain. Transp.17, 527–551. doi: 10.1080/15568318.2022.2054390
Summary
Keywords
benefit distribution mechanism, cooperative alliance, cooperative network attributes, mobility as a service, supply chain evolution path
Citation
Zhu J and Li K (2026) Research on the evolution path of the MaaS tourism logistics service supply chain given the influence of cooperative network attributes. Front. Sustain. Cities 7:1703640. doi: 10.3389/frsc.2025.1703640
Received
11 September 2025
Revised
04 December 2025
Accepted
12 December 2025
Published
20 January 2026
Volume
7 - 2025
Edited by
Mengqiu Cao, University College London, United Kingdom
Reviewed by
Ekinhan Eriskin, Suleyman Demirel University, Türkiye
I Gede Eko Putra Sri Sentanu, Brawijaya University Hospital, Indonesia
Updates
Copyright
© 2026 Zhu and Li.
This is an open-access article distributed under the terms of the Creative Commons Attribution License (CC BY). The use, distribution or reproduction in other forums is permitted, provided the original author(s) and the copyright owner(s) are credited and that the original publication in this journal is cited, in accordance with accepted academic practice. No use, distribution or reproduction is permitted which does not comply with these terms.
*Correspondence: Kang Li, lklk0719@163.com
Disclaimer
All claims expressed in this article are solely those of the authors and do not necessarily represent those of their affiliated organizations, or those of the publisher, the editors and the reviewers. Any product that may be evaluated in this article or claim that may be made by its manufacturer is not guaranteed or endorsed by the publisher.