Abstract
With the urbanization and transformation of consumption styles, the peer-to-peer accommodation (P2PA) industry has emerged to provide more convenient and efficient options for tourists and to inject new vitality into urban economies. This study investigates the spatiotemporal clustering and evolutionary drivers of P2PA in urban and rural areas of Shanghai. Spatial autocorrelation techniques and the Multi-scale Geographically Weighted Regression (MGWR) model are adopted to analyze the Airbnb data from 2016 to 2021 to identify the spatial characteristics of P2PA. The results indicate that high-value P2PA clusters in the city center are gradually breaking apart and shifting to rural areas especially in Pudong New Area. The shift from urban to rural areas makes great contributions to form an integrated urban–rural tourism system. Specifically, the spatial distribution of P2PA in Shanghai exhibits a vertical clustering pattern shaped by resource-oriented and demand-oriented mechanisms. Cultural tourism attractions significantly promote P2PA distribution, while business demands and transportation facilities have inhibiting effects. To support the sustainable growth of P2PA and tourism economy, the government should implement integrated Urban–Rural planning to build distinctive P2PA clusters based on local tourism resource, deepen local industrial linkages to develop new consumption formats and extend industrial chains, encourage practitioners to integrate intangible cultural heritage and folk customs with modern tourism needs, and establish a window for cultural display and inheritance with P2PA model.
1 Introduction
In the sharing economy era, Peer-to-Peer Accommodation (P2PA), as the business model for sharing properties between local hosts and tourists, has attracted the attention from practitioners and academics (Medina-Hernandez et al., 2024; Nur Muharam et al., 2024; Prayag and Ozanne, 2018; Fang et al., 2016; Guttentag, 2015; Heo, 2016; Zervas et al., 2021). The expansion of online platforms for renting P2PA has given rise to much controversy in society. Although P2PA may bring benefits to cities and increase the number of tourists, it could lead to serious conflict with the local population in some regions of heritage cities due to rising rents, gentrification processes (Gutierrez et al., 2016) and conflicts between different stakeholders (Martín et al., 2021).
P2PA holds a competitive advantage over traditional hotels due to its low initial investment and diverse suppliers. P2PA has led to the emergence of a competitive market and facilitated the clustering of the P2PA industry. Its inherent responsiveness to tourism demand leads to spatiotemporal clustering within popular tourism areas (Lee et al., 2020). Hence, the spatiotemporal cluster of P2PA offers spatial information on popular tourist attractions that can be utilized to investigate the advancement of regional tourism and economy to some extent.
Based on the geographical perspective, this research divides P2PA into urban regional P2PA (uP2PA) and rural regional P2PA (rP2PA). The coverage of uP2PA in the central areas of cities has social and economic benefits in revitalizing existing assets but generates disruptive impacts including driving up housing and residential rental prices (Rodríguez-Pérez de Arenaza et al., 2019), fostering the conflicts among residents and reducing the income of hotels employees (Martín et al., 2021; Wang and Nicolau, 2017; Tussyadiah and Pesonen, 2016; Guttentag, 2015; Sigala, 2015; Zhang, 2020). Conversely, rP2PA development aligns with China's rural revitalization policies and the growth of leisure tourism. It serves as an effective tool for optimizing rural resource allocation (Yang et al., 2018), creating high-quality rural tourism projects, promoting the employment of rural populations, revitalizing the rural social economy, resisting agricultural weakness and seasonality, attracting locals to return to their hometowns, and increasing the income of rural families.
This study conducts a detailed spatiotemporal analysis of peer-to-peer accommodation (P2PA) clustering in both urban and rural areas of Shanghai over six years (2016–2021). By employing spatial autocorrelation techniques and Multi-scale Geographically Weighted Regression (MGWR), the study reveals the gradual fragmentation of high-value P2PA clusters in urban areas and the emergence and expansion of new contiguous clusters in rural areas particularly in the Pudong New Area. In addition, the study provides empirical evidence of the transfer of P2PA from urban to rural areas contributing to the formation of an urban–rural tourism system. The study innovatively applies the MGWR model to examine the spatial non-stationarity of evolutionary drivers of P2PA clustering for the identification of varying relationships between dependent and independent variables at different spatial scales based on the spillover effect. Finally, the study offers practical implications for tourism policymakers and P2PA hosts by highlighting the importance of selecting location based on surrounding tourist attractions and the scarce resources to enrich the theory of urban–rural integration development.
2 Literature review
In recent years, researchers have begun to focus on the characteristics of the spatial pattern of P2PA and the drivers of this industry. For instance (Mei and Jiang, 2021; Hu et al., 2020; Ma et al., 2021) emphasize the differences and drivers of the spatial distribution of P2PA in different cities. Gutierrez et al. (2016) identified the spatial distribution patterns of Airbnb accommodations in Barcelona comparing with the accommodations offered by hotels and the places most visited by tourists. Analysis of bivariate spatial autocorrelation reveals a marked center-periphery pattern between the accommodation offered by Airbnb and the one offered by hotels. Tang, Kim (Tang et al., 2019) examined pricing determinants of P2P accommodations considering their spatial dependency. In 2021, through geo-spatial auto-correlation analysis and spatial econometric models, Lai (2021) indicated that Airbnb predominates in the areas around popular tourist attractions and the peripheral areas of the city, while in the downtown area Airbnb and hotels are in the state of coexistence. Moreover, Al-Saad et al. (2023) demonstrate that reputable accommodations tend to cluster in economically active urban districts.
In recent years, P2PA has seen substantial growth. However, the outbreak of the public health emergency COVID-19 led to a downturn in this thriving industry (Zenker and Kock, 2020). In light of these challenges, Petruzzi and Marques (2024) address the pertinent issue of safety in P2PA particularly focusing on the COVID-19 pandemic. They effectively categorize tourists based on their safety expectations, providing critical insights that enable providers to adapt their services more effectively during and post-health crises. This segmentation highlights the importance of a nuanced understanding of how health crises impact consumer behavior and service adaptation in the tourism and hospitality sectors. Amid the constraints imposed by the pandemic, the relative openness of rural areas and their perceived lower risk of contagion have potentially shifted consumer preferences toward rural accommodations. Notwithstanding the importance of these insights, there exists a notable research gap in understanding the spatial clustering and the factors influencing P2PA from an urban to rural perspective. This study aims to identify the factors that may be driving this shift contributing to a more profound understanding of how health crises can reshape consumer behavior in the tourism and hospitality sectors. Furthermore, the use of P2PA as indicators for the development of both urban and rural tourism remains underexplored (GAP1).
Clusters refer to geographic concentrations of interconnected companies, specialized suppliers and customers, and associated institutions (Porter, 1998). The tourism industry cluster comprises various service components different from the manufacturing industry cluster (Zhang et al., 2009). Furthermore, a tourism cluster is not structured by collocated tourism firms but is formed by relational dynamics between different industries within the cluster (Cole, 2009). P2PA clustering is a type of industrial cluster that emerges from a combination of resource endowment, market demand, and cost constraints (Lai, 2021). This cluster establishes a market game relationship with the traditional hospitality industry. Michael (2003) identified three forms of clustering activities, namely horizontal clustering, vertical clustering, and diagonal clustering, with P2PA belonging to the vertical clustering category from an intraregional content perspective. The current investigation endeavors to categorize P2PA clusters into three distinct typologies: Resource-Oriented, Demand-Oriented, and Accommodation-Oriented. The degree of industry clustering significantly impacts a tourism firm's pricing and other business decisions determining economic performance ultimately (Scherer and Ross, 1990). Therefore, it is crucial to explore the clustering types and influencing factors of P2PAs for developing the P2PA industry and future regional tourism construction (GAP2).
In China, P2PA has experienced significant growth (Adamiak, 2018; Hudik, 2020). Notably, China boasts over 100 million users and 3.5 million listings in the P2PA market, surpassing even the largest hotel chains (Zhang et al., 2021). Airbnb has focused its efforts on the Shanghai market, encompassing a diverse range of resource-oriented and demand-oriented types. As one of China's four municipalities, Shanghai serves as a hub for various industries, including technology, trade, information, finance, and shipping. Additionally, Deng et al. (2019) describe Shanghai as a globally renowned international metropolis and a popular tourist destination, boasting numerous iconic landmarks such as the Oriental Pearl, Nanjing East Road, and the Bund. As a central city for China's economic development, the evolution characteristics of P2PA clusters in urban and rural areas in Shanghai can serve as a model for the development direction of the P2PA industry in other regions (GAP3).
A detailed assessment is critical to identify the tourism hotspots and the key spatial clustering drivers for a more efficient regional tourism construction plan. This study aims to fill the gaps in earlier studies by conducting a comprehensive assessment of spatial dynamics of the P2PA in Shanghai at the scale of county-level administrative units. In addition, the utilization of spatial analysis has the potential to replicate the impact of diverse explanatory factors on the spatiotemporal clustering mechanism of P2PA (Mei and Jiang, 2021; Ma et al., 2021; Lagonigro et al., 2020; Zhang et al., 2019; Wu et al., 2020). Based on Exploratory Spatial Data Analysis (ESDA) and Multi-scale Geographically Weighted Regression (MGWR), the development characteristics of urban and rural organisms in Shanghai are analyzed in this research, providing a scientific basis for the spatial reconstruction of uP2PA and rP2PA.
Therefore, the objectives of this study are to (1) analyze the dynamic spatiotemporal evolution of the uP2PA and rP2PA in Shanghai during the 2016–2021 years with ESDA; (2) develop an analytical framework to quantify the drivers of the P2PA clustering-oriented types with MGWR; (3) identify the diverse socioeconomic factors that influence the spatial clustering of P2PA in the context of regional tourism promotion.
3 Method
3.1 Study area
Shanghai is a vital economic hub located at the forefront of the Yangtze River economic Belt with its rural areas playing a significant role in the city's landscape. The Shanghai Municipal Government and district governments have developed guiding opinions to facilitate the growth of P2PA in the region. However, Zhou (2018) has highlighted the lack of coordinated development between Shanghai's urban and rural areas as a significant challenge. Promoting and supporting rural P2PA in Shanghai has become a mainstream tool for diversifying rural household income. Therefore, Shanghai serves as a typical and exemplary research area for investigating the development of P2PA in urban–rural contexts. In 2019, Shanghai held the highest number of Airbnb listings in China (Wu and Qiu, 2019). Hence, with a thriving tourism economy and a burgeoning P2PA industry, using Shanghai as a case study to investigate the driving factors behind P2PA clusters is highly representative.
According to Basic Requirements and Evaluation of Tourist P2PA (LB/T 065-2019; Ministry of Culture and Tourism of the People's Republic of China, 2020) and the Shanghai Rural Revitalization Strategy Implementation Plan, this study categorizes the types of urban and rural P2PA based on locations along the Outer Ring Line. The P2PA are divided into urban regional P2PA (uP2PA) and rural regional P2PA (rP2PA) respectively. Figure 1 shows the map of the study area.
Figure 1
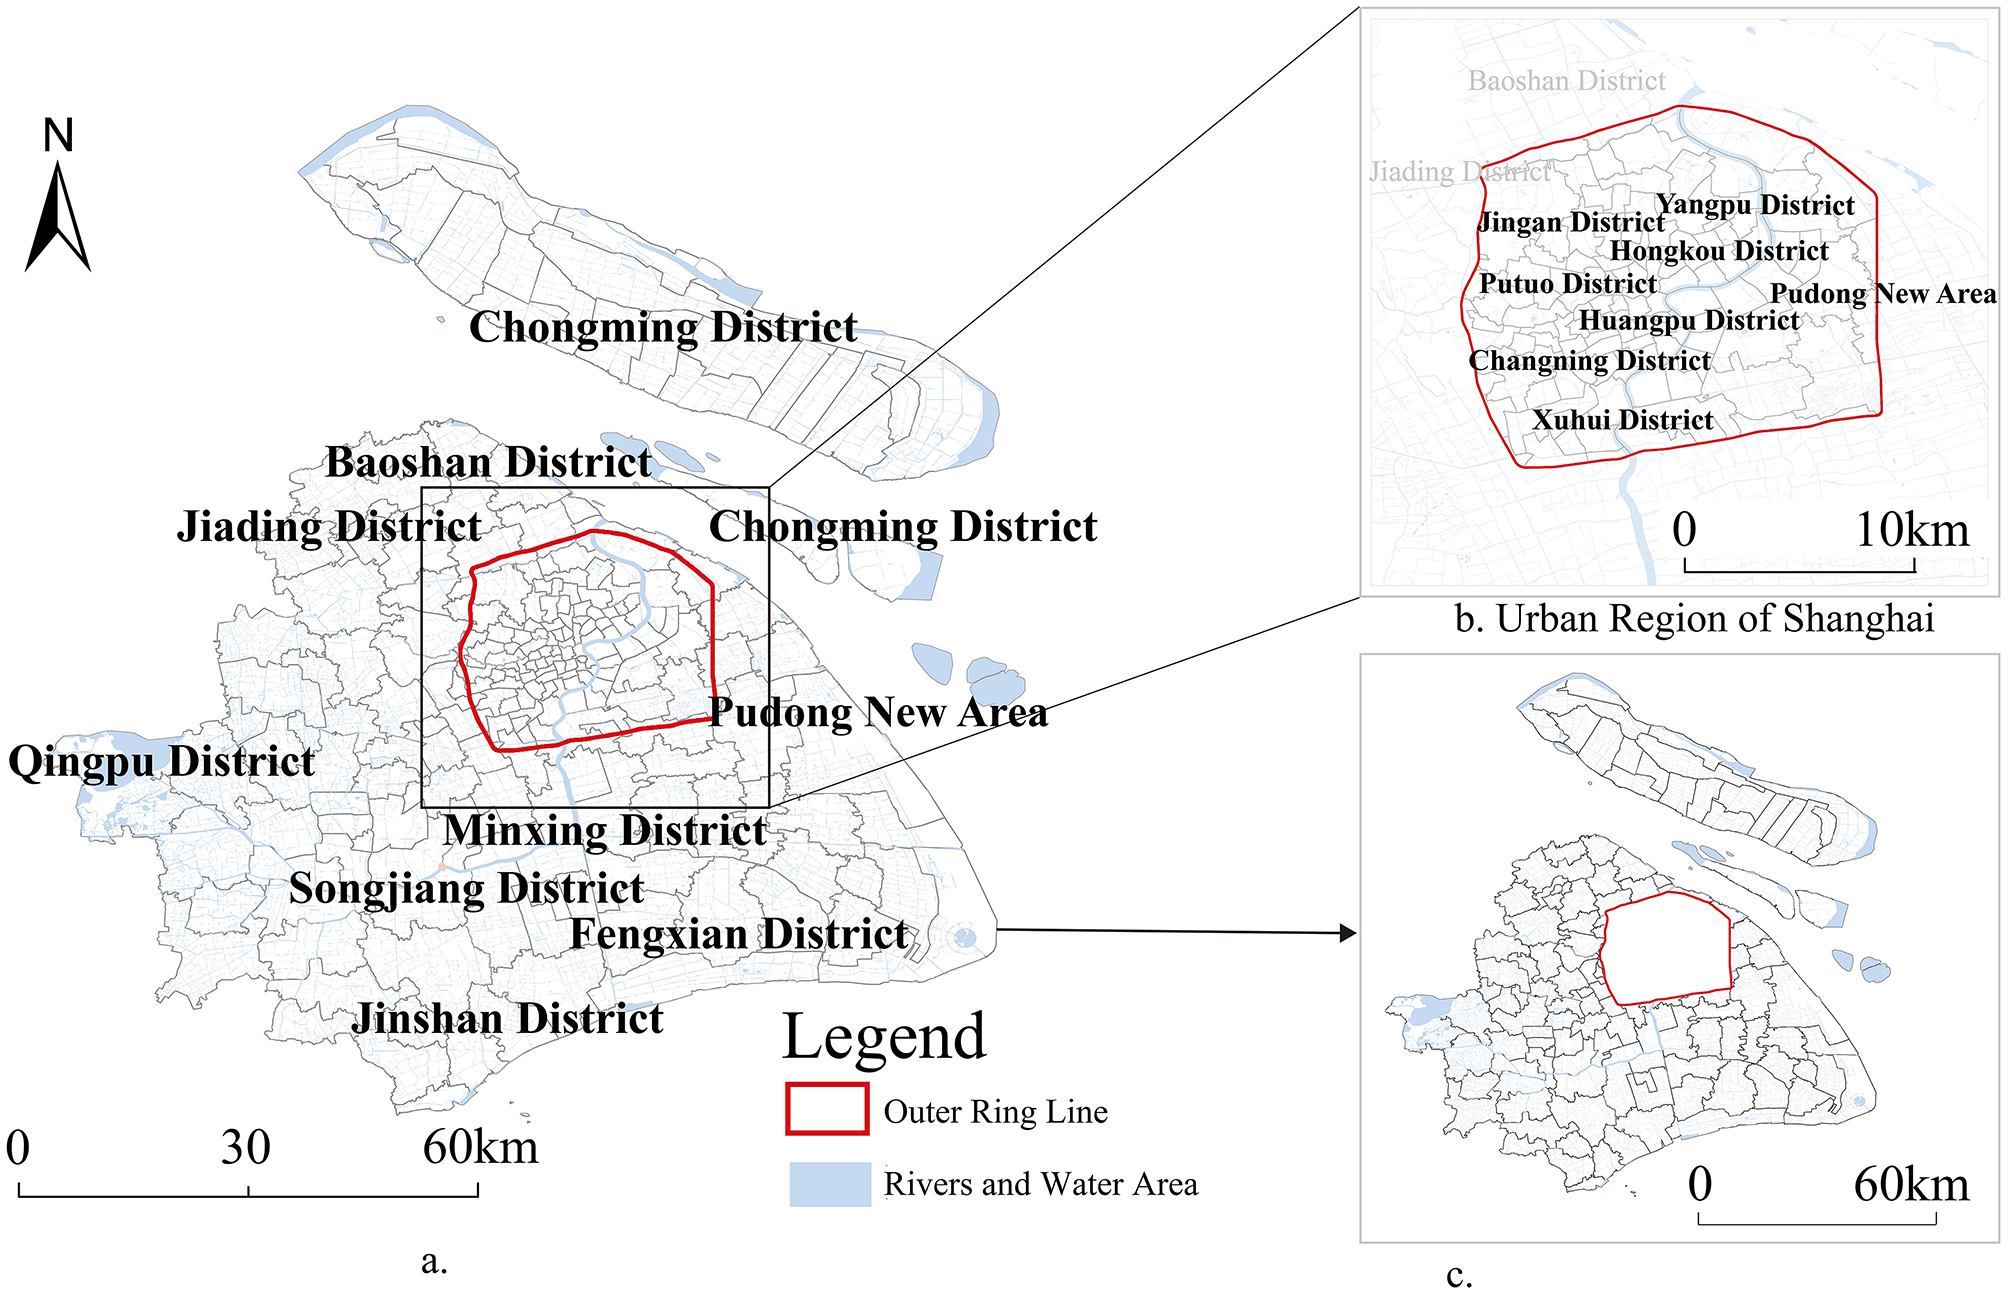
The overview map of the research area. (a) Location of Shanghai. (b) Urban region of Shanghai. (c) Rural region of Shanghai.
3.2 Data sources
Airbnb is a platform for obtaining P2PA data for spatial analysis. The number of Airbnb in China has shown explosive growth since 2015 (Wu and Qiu, 2019). Therefore, 2016–2021 is taken as the research period. The raster data were obtained from the AirDNA platform (https://www.airdna.co/), which is one of the most popular sources of short-term rental data. Since our focus is on valid P2PA, this study filters the raw datasets in the following steps after obtaining the initial dataset: (1) remove duplicate data, (2) eliminate the P2PA that has not been opened within six months. In detail, 2,618,093 valid listings of Shanghai P2PA are obtained from January 1, 2016 to March 31, 2021. Additionally, the latitude and longitude information of spatial geographic information data of Shanghai is obtained from Gaode Map which is a map and navigation services provider. Boundary and road map data of the research area is obtained from the National Geomatics Center of China (NGCC). All indicators listed in Table 1 are constructed from these data sources at the district level.
Table 1
| Clustering types | Drivers | Category | Factors/[unit] |
|---|---|---|---|
| Resource-oriented | Cultural-tourism attraction driving factors (ATD) | Cultural-tourism attractions | Number of parks/[PCE] |
| Number of tourist attractions/[PCE] | |||
| Number of tourist resorts/[PCE] | |||
| Number of exhibition halls/display halls/[PCE] | |||
| Number of ruins/[PCE] | |||
| Number of beautiful villages/[PCE] | |||
| Scarce resource driving factors (SRD) | Natural resources | Euclidean distance to nearest coastline/[-km] | |
| Number of wetlands/[PCE] | |||
| Number of nature reserves/[PCE] | |||
| Agro-pastoral resources | Number of farm villages/[PCE] | ||
| Number of farmlands/paddy fields/[PCE] | |||
| Number of pastures/[PCE] | |||
| Number of farms/[PCE] | |||
| Number of aquaculture areas/[PCE] | |||
| Demand-oriented | Business demand driving factors (BDD) | Business centers | Number of convention and exhibition centers/[PCE] |
| Number of shopping centers/[PCE] | |||
| Number of convenience stores/[PCE] | |||
| Number of office buildings/[PCE] | |||
| Number of catering facilities/[PCE] | |||
| Traffic facility driving factors (TFD) | Traffic facilities | Number of highways/[PCE] | |
| Number of metro lines/[PCE] | |||
| Number of metro stations/[PCE] | |||
| Number of ferries/[PCE] | |||
| Housing source-oriented | Construction cost driving factors (CCD) | Built-up houses | Number of commodity houses and commercial/residential dual-use houses/[PCE] |
| Supporting facilities for public services | Number of specialized hospitals/[PCE] | ||
| Number of general hospitals/[PCE] | |||
| Number of schools/[PCE] | |||
| Number of gymnasiums/[PCE] | |||
| Number of parking lots/[PCE] | |||
| Relationship between the P2PA industry and the hotel industry | Customer diversion driving factors (CDD) | Traditional hotels | Number of hotels/[PCE] |
Index system to assess the evolutionary drivers of the spatial pattern of P2PA in Shanghai.
Data sources Airbnb/AirDNA (P2PA listings), Gaode Map (AMap) points-of-interest (POI) data, Shanghai Statistical Yearbook (2016–2021), and administrative boundary data from the National Geomatics Center of China (NGCC).
3.3 Spatial autocorrelation and regression methods
Geospatial technology enables the analysis of socioeconomic and environmental drivers influencing P2PA clustering. Key techniques include Standard Deviational Ellipse (Mei and Jiang, 2021), Random Forests (Mei and Jiang, 2021), Density-based spatial clustering of applications with noise, DBSCAN (Ma et al., 2021), Multi-scale Geographically Weighted Regression, MGWR (Ma et al., 2021; Lagonigro et al., 2020) and Geodetector (Zhang et al., 2019; Wu et al., 2020). Building on this literature, this study mainly adopts Exploratory Spatial Data Analysis (ESDA) to identify whether there is a correlation between the spatial distribution of P2PA and its neighboring regions and to describe the magnitude of this correlation. Spatial autocorrelation analysis can analyze multiple geographical elements simultaneously and accurately reflect spatial distribution characteristics (Yang and Li, 2022; Zhang et al., 2022). The leading indicators for calculating spatial autocorrelation are Global Moran's I and Local Moran's I, which are used to analyze the global and local spatial clustering of P2PA.
Global Moran's I, originally proposed by Moran in 1950 as a global measure of spatial autocorrelation for areal data, is a classical spatial statistic used to evaluate the overall clustering pattern of a spatial variable (Zhang and Zhang, 2007). Since its introduction, Global Moran's I has become one of the most widely used and scientifically established indicators in spatial statistics and spatial econometrics, and is mainly used to describe the average degree of association between each spatial unit and its neighboring regions In this study, Global Moran's I is adopted to measure the global spatial autocorrelation of P2PA, and is defined as:
where xi and xj are the values of P2PA for spatial units i and j; is the mean value; wij is the spatial weight describing the adjacency relationship between spatial units i and j; and n is the total number of spatial units. Global spatial autocorrelation is used to measure the degree of aggregation or dispersion of attribute values of spatial features in the whole area (Zhang et al., 2022), and to evaluate whether the spatial distribution pattern of P2PA is discrete, clustered, or random. The value of Global Moran's I ranges between −1 and 1. Values closer to −1 indicate stronger negative spatial autocorrelation (dispersion), values closer to 1 indicate stronger positive spatial autocorrelation (clustering), and values around 0 indicate no significant spatial autocorrelation.
Local spatial autocorrelation (Local Moran's I) can further determine the locations of spatial clusters or isolated areas of attribute values, as well as the locations of outliers. As a local indicator of spatial association (LISA), Local Moran's I measures the degree of correlation between each spatial unit and its neighboring units and indicates the location of P2PA and the extent of its spatial aggregation or dispersion. It is defined as:
where , and xi, xj, and wij have the same meanings as in Equation (1). In this study, Local Moran's I and LISA clustering are combined to classify each district into four types: “High–High” (HH), “Low–Low” (LL), “High–Low” (HL) and “Low–High” (LH). A positive value of Ii indicates that the local area belongs to an HH or LL cluster, whereas a negative value indicates HL or LH types. On the LISA map, HH clusters appear as regions where high P2PA values are surrounded by high values, LL clusters represent regions where low values are surrounded by low values, and HL and LH clusters indicate that high (or low) values are surrounded by low (or high) values, respectively. This study delves into the spatiotemporal evolution pattern of P2PA by examining dissimilarities in spatial agglomeration across various years. In this study, “high-cluster” regions in Figure 3 correspond to High–High (HH) clusters, where districts with above-mean P2PA values are surrounded by neighboring districts with similarly high values and a positive Local Moran's I that is statistically significant at the 5% level. “Low-cluster” regions correspond to Low–Low (LL) clusters, where below-mean values are surrounded by similarly low neighboring values. For the ESDA, Global Moran's I and LISA are computed using a k-nearest neighbors spatial weight matrix at the district level.
Geographically Weighted Regression (GWR) is one of the most preferred local modeling techniques to analyze geographic variation, and the Multi-scale Geographically Weighted Regression (MGWR) technique has recently been used as an extension of GWR (Brunsdon et al., 1996; Fotheringham et al., 1998; Sisman and Aydinoglu, 2022). The conventional GWR method assumes that the geographic (local) relationships within each model vary at the same geographic scale, while MGWR permits geographic relationships at changing scales (Gu et al., 2020). Therefore, the MGWR method uses varying bandwidths instead of the same bandwidth for the whole study area (Fotheringham et al., 2017; Yu et al., 2020; Cui et al., 2019; Cupido et al., 2020). In this study, GWR and MGWR techniques are employed to investigate the drivers contributing to the spatial clustering of the P2PA industry in Shanghai.
The GWR model was developed from the global regression model, with its basic idea taken from non-parametric regression (Mei and Jiang, 2021). GWR assumes that non-stationary relationships exist between the response variable and the explanatory variables, and relaxes the assumption of spatial stationarity by allowing the parameters to vary spatially. Therefore, the model estimates a local parameter for each location separately (Brunsdon et al., 1996; Fotheringham et al., 1998; Charlton et al., 2009). The GWR mathematical model can be seen in Equation (3):
where (ui, vi) are the coordinates of location i, β0(ui, vi) and βk(ui, vi) are the location-specific intercept and coefficients at location i, xik is the value of the kth explanatory variable at location i, and εi is the random error term. GWR can be performed using fixed or adaptive kernel approaches, and the bandwidth can be optimized using Cross-Validation (CV) and the corrected Akaike Information Criterion (AICc). The output significance values and model diagnostics can then be compared to find the optimum models (da Silva and Mendes, 2018).
GWR provides advantages to the regression modeling process and accounts for spatial variations, but it still considers the spatial scale to be constant over space. However, in many cases, a fixed spatial scale is not valid, as the phenomena involve multiple spatial processes with different spatial scales. MGWR allows the relationship between the response variable and the explanatory variables to vary spatially and at different scales (Fotheringham et al., 2017; Yu et al., 2020; Chien et al., 2020; Mollalo et al., 2020a,b), by incorporating various bandwidths over the study area surface. The MGWR modeling technique develops local models for each location separately to explore the local associations between the dependent variable and independent variables at various spatial scales (Fotheringham et al., 2017). This technique can incorporate different bandwidths (local bandwidths) across the study area. Each bandwidth exhibits a unique scale for each process, and the model relies on a backfitting algorithm that derives a set of bandwidths for the k processes. Compared with GWR, the model has several advantages: it can accurately depict spatial heterogeneity, diminish collinearity, and lessen bias in the parameter estimates (Oshan et al., 2019; Wolf et al., 2018). The general form of this model is as follows (Mollalo et al., 2020b):
where all the parameters are the same as in the GWR model (Equation (3)), except that βk(bwk; ui, vi) denotes the coefficient estimated with the bandwidth bwk used for the kth relationship (Fotheringham et al., 2017). MGWR allows different regression processes to operate on different spatial scales by providing separate bandwidths for the conditional relationship between the response variable and different predictor variables. In this study, spatial relationships among districts are modeled using a k-nearest neighbors spatial weighting scheme. The MGWR model employs an adaptive kernel with variable-specific bandwidths, and each bandwidth is selected by minimizing the corrected AIC. All model computations are conducted with the MGWR 2.0 software, while spatial visualization and map production are carried out in ArcMap.
4 Construction of the driving factors index system for P2PA spatial distribution
This section utilized the system framework of the tourism and hospitality industry in conjunction with the P2PA clustering theory. An index system for drivers has been developed to assess the spatial distribution of P2PA within Shanghai. The development of this system has been guided by the principles of scientific rigor, comprehensiveness, regional specificity, and practicality, with due consideration given to the relevant literature. A spatial correlation has been established between the clustering of regional P2PA and a range of factors, including cultural-tourism attractions (Hu et al., 2020; Cao et al., 2021; Tang et al., 2021), natural resources (Mei and Jiang, 2021; Hao et al., 2018; Long et al., 2019), exhibition centers (Ma et al., 2021; Cao et al., 2021; Li et al., 2021), business centers (Cao et al., 2021; Li et al., 2021), traffic facilities (Mei and Jiang, 2021), and supporting facilities (Tang et al., 2021; Hao et al., 2018). Due to differences in research perspectives, previous studies on the driving factors of P2PA agglomeration have exhibited omissions and content repetition. To ensure the completeness and scientific validity of the data, this study compiled a scale of driving factors from previous research. It eliminated duplicate items while also summarizing and organizing the factors. A driving factors index system was established through expert discussions and iterative analysis. The system was classified into six indexes: ATD, SRD, BDD, TFD, CCD, and CDD, with thirty factors:
-
1) Cultural-tourism Attraction Driving Factors (ATD), which reflects the demand of P2PA users for accessibility of tourist attractions;
-
2) In the case of Scarce Resource Driving Factors (SRD), natural resources and agro-pastoral resources were taken as secondary indexes, with a view to include the planning of rural tourism and the demand of P2PA users for the exploration of scarce natural landscapes and field landscapes;
-
3) Business Demand Driving Factors (BDD), which reflects P2PA users' consideration of the convenience of daily life during their participation in conventions and exhibitions or trips;
-
4) Traffic Facility Driving Factors (TFD), which reflects the demand of P2PA users for travel convenience;
-
5) Construction Cost Driving Factors (CCD), which reflects the short-term transfer characteristics of the right of use of houses in the P2PA industry;
-
6) Because traditional hotels have a specific user base, Customer Diversion Driving Factors (CDD) were introduced to examine the customer diversion attributes of P2PA and traditional hotels and to identify the collaborative or competitive relationship between them.
Based on the analysis of driving factors and expert discussions, the current investigation endeavors to categorize P2PA clusters into three distinct typologies: Resource-Oriented, Demand-Oriented, and Accommodation-Oriented. More specifically, ATD and SRD were used to test whether P2PA in Shanghai conforms to the theory of Resource-Oriented clustering; BDD and TFD were used to test whether it conforms to the theory of Demand-Oriented clustering; and CCD was used to test whether it conforms to the theory of Accommodation-Oriented clustering (Table 1).
Statistics were generated of the 30 tertiary indexes by county using ArcGIS, and vector data were obtained for follow-up calculation and analysis. The factors were subjected to variance inflation factor (VIF) tests based on the OLS model. The results showed that the VIF value of each factor was considerably below ten and that explanatory variables had no redundancy or multicollinearity. Therefore, the MGWR model could be used for analysis. In addition, since the constant term (Intercept) in classical GWR and MGWR models characterizes the magnitude of the effect of different positions on the dependent variable when other independent variables are given (Shen et al., 2020), the constant term was introduced into analysis to show the influencing factor not included in the model and uniquely determined by locations.
5 Spatiotemporal evolve characteristics of the urban–rural P2PA in Shanghai
The developmental trajectory of P2PA has undergone a transformation from its initial role as a mere alternative to traditional lodging options to a burgeoning form of enterprise (Zhang et al., 2019). The P2PA industry exhibits traits akin to those of the tourism and hospitality industry, in addition to possessing regional social and cultural attributes. The spatial agglomeration of P2PA facilitates the agglomerated and specialized advancement of the P2PA industry in its entirety (Hu et al., 2020).
There are significant differences in the temporal evolution of the number of uP2PA and rP2PA in Shanghai (Figure 2). Between 2015 and 2018, the uP2PA market in Shanghai underwent a period of rapid growth. However, this expansion ultimately led to market saturation and a subsequent decline in uP2PA numbers since 2019, thereby impeding the progress of uP2PA development.
Figure 2
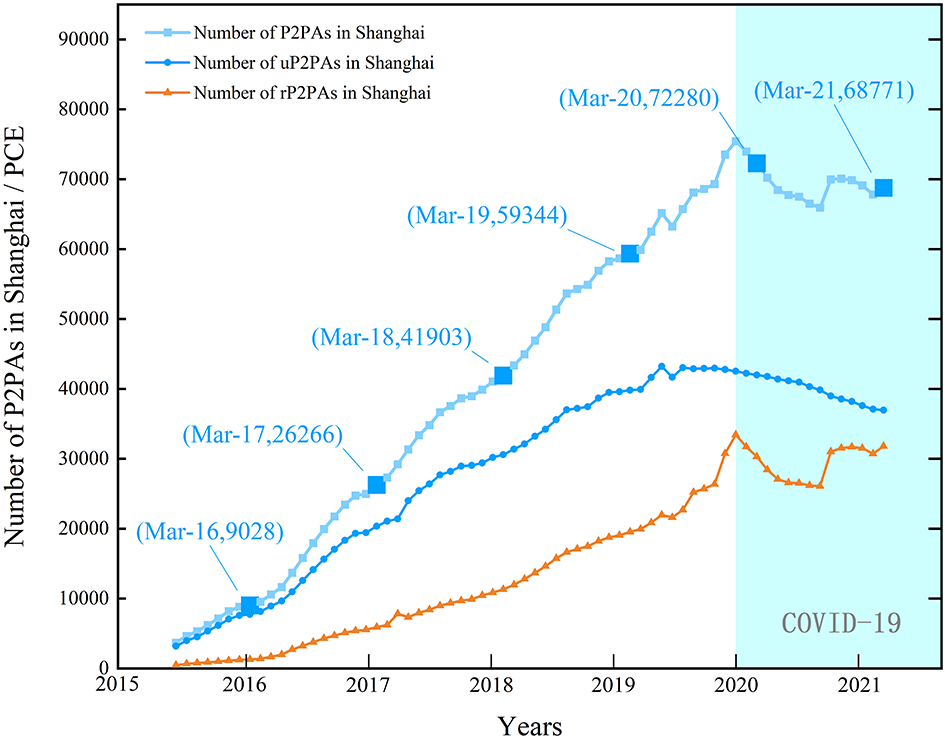
Temporal evolution of the number of uP2PAs and rP2PAs in Shanghai.
Furthermore, from 2015 to 2020, the number of rP2PAs in Shanghai underwent two distinct phases: consistent advancement from 2015 to 2016 and rapid expansion from 2017 to 2020. This growth was facilitated by the promotion of rural revitalization and bolstered by local policy support. By March 2021, the number of uP2PA in Shanghai gradually converged with that of rP2PA. In addition to the impact of the COVID-19, the number of P2PA gradually decreased after 2020. Analysis showed that the fluctuation trends in the number of P2PA were relatively consistent across various years. The data from March each year were selected for subsequent research on the spatiotemporal clustering characteristics of P2PA.
To assess the existence of a spatial correlation in P2PA distribution in Shanghai, the Global Moran's I, was calculated (Table 2) using the data on P2PA from six periods (i.e., March 2016–2021). The index of each area was positive for each year, and the model passed the significance test (p < 0.001), indicating that P2PA in Shanghai presented a clustered distribution pattern during the study period. Specifically, the Global Moran's I, of uP2PA in Shanghai exhibited cyclical fluctuations characterized by a down-up-down pattern. This phenomenon can be attributed to the degree of clustering of uP2PA in Shanghai, which underwent tension between robust market demand and intense social contradictions. By contrast, the Moran's I, of rP2PA presented a declining pattern, indicating a reduction in the spatial heterogeneity of rP2PA distribution.
Table 2
| Area | Index | 2016-03 | 2017-03 | 2018-03 | 2019-03 | 2020-03 | 2021-03 | 2016–2021 |
|---|---|---|---|---|---|---|---|---|
| P2PA in Shanghai | Global Moran's I | 0.509 | 0.427 | 0.401 | 0.289 | 0.187 | 0.11 | 0.235 |
| z-score | 44.12 | 36.943 | 34.42 | 25.43 | 17.3 | 11.013 | 21.229 | |
| uP2PA in Shanghai | Global Moran's I | 0.76 | 0.657 | 0.695 | 0.739 | 0.663 | 0.645 | 0.72 |
| z-score | 21.018 | 18.16 | 18.881 | 19.736 | 17.923 | 17.425 | 19.335 | |
| rP2PA in Shanghai | Global Moran's I | 0.3 | 0.178 | 0.112 | 0.068 | 0.051 | 0.039 | 0.056 |
| z-score | 10.493 | 6 | 4.876 | 3.92 | 3.686 | 3.315 | 3.79 |
Statistics of the Global Moran's I of P2PA in Shanghai from 2016 to 2021.
The model passed the significance test, with p < 0.001 for each area each year.
The LISA diagram of the spatiotemporal evolution of the clustering and distribution of P2PA in Shanghai was drawn based on local spatial autocorrelation (Local Moran's I) analysis (which passed the Z-value test, p < 0.05). According to Figures 3a–f, there was a significantly positive local spatial correlation in P2PA in Shanghai, together with the spillover of the high-value clusters of P2PA from urban to rural areas. In rural areas, the eastern part saw a rapid increase in the number of P2PAs, while the southwestern part became a subsidence area in the development of P2PA clustering.
Figure 3
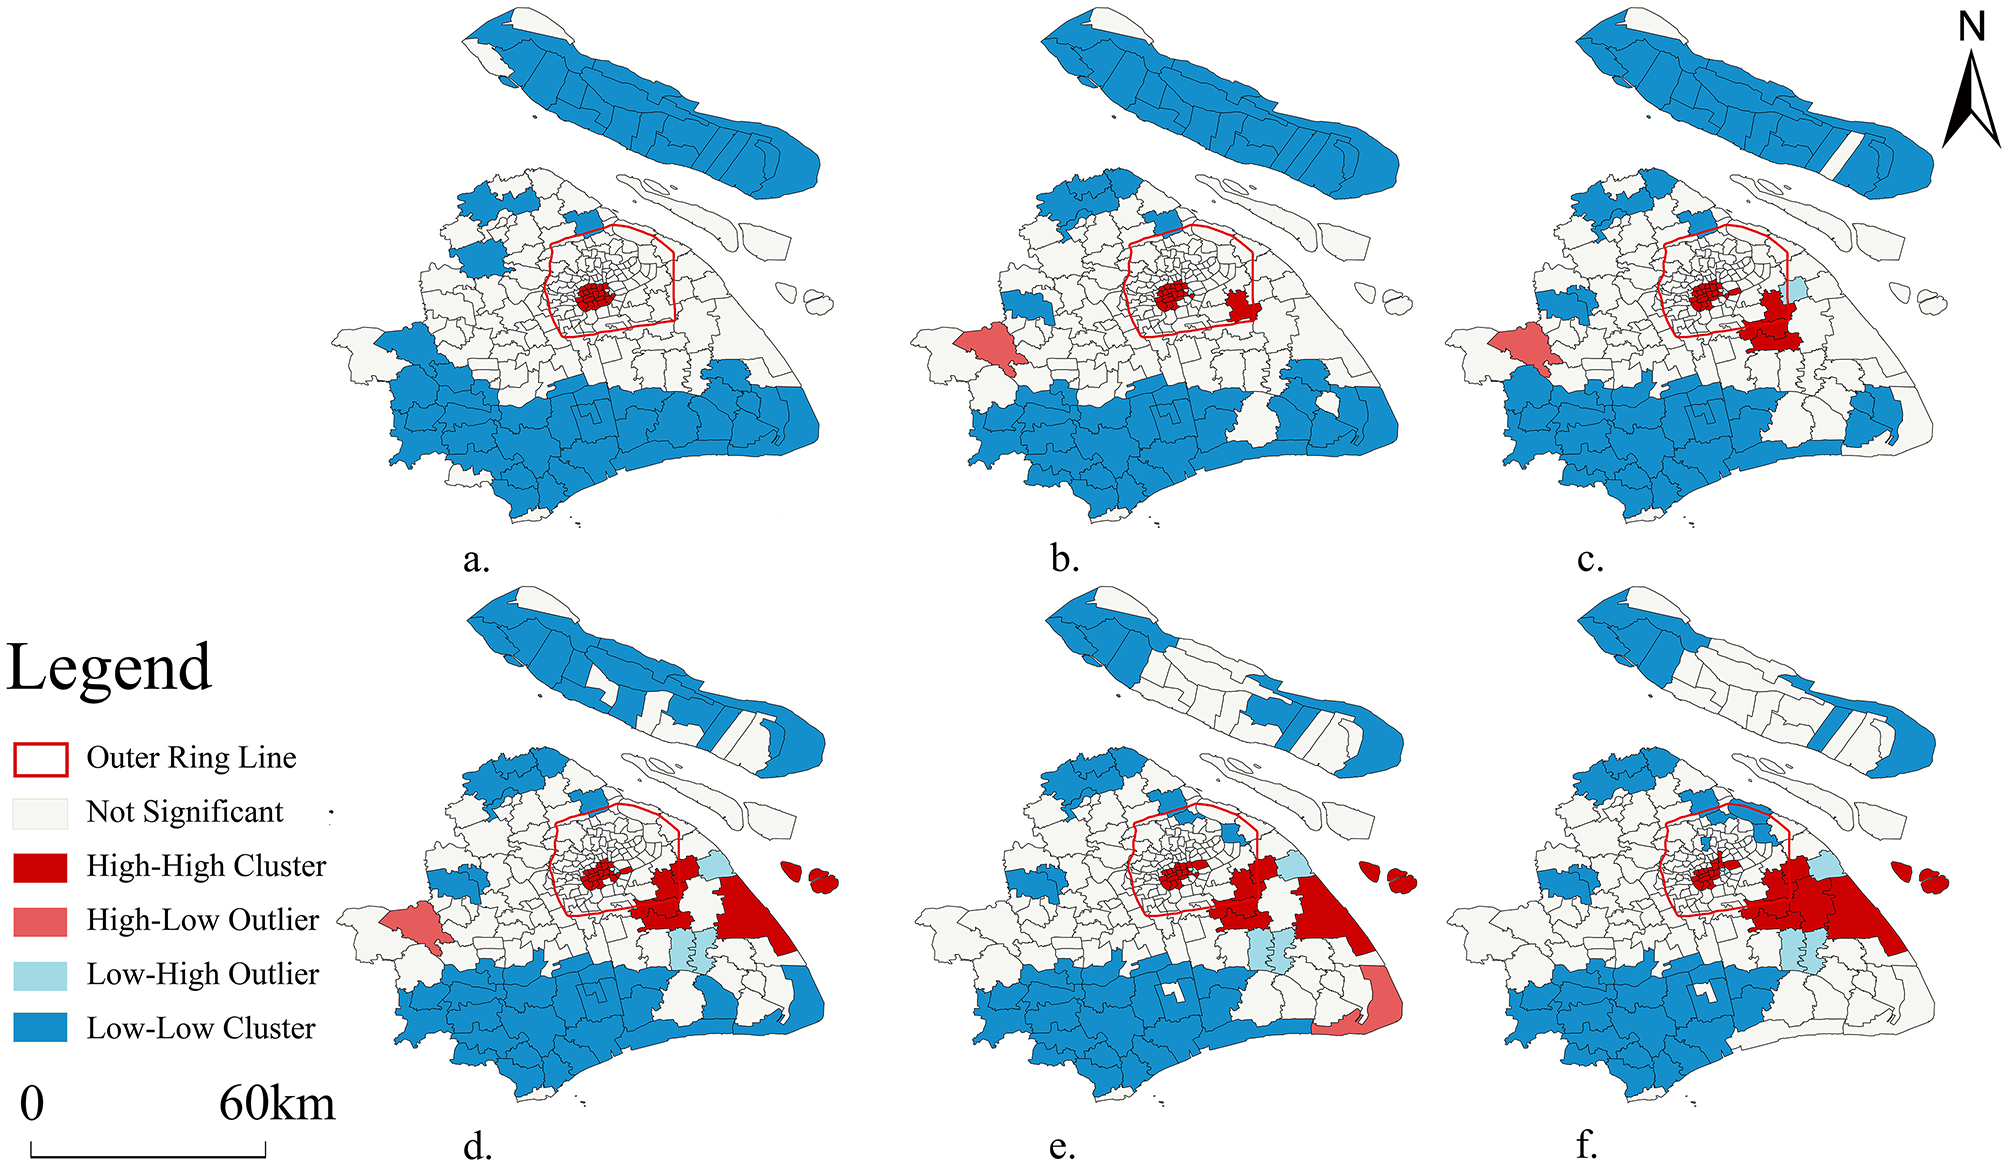
LISA diagram of the spatiotemporal evolution of the clustering and distribution of P2PA in Shanghai. (a) 2016 March. (b) 2017 March. (c) 2018 March. (d) 2019 March. (e) 2020 March. (f) 2021 March. Note High-cluster regions denote High–High (HH) clusters and low-cluster regions denote Low–Low (LL) clusters identified by Local Moran's I using a k-nearest-neighbors weights matrix (p < 0.05).
P2PA experienced a gradual shrinkage in the urban areas of Shanghai. In 2016, a downtown single-core high-high (HH) cluster was composed of Huangpu District, southern Jing'an District, eastern Changning District, and northern Xuhui District. In 2017, the downtown HH cluster narrowed down and formed a dual-core HH cluster with Zhangjiang Town of Pudong New Area. In 2018, the downtown HH cluster expanded slightly toward the east, while the HH cluster in Pudong New Area broke through the boundary of the Outer Ring Road and extended to rural areas. From 2019 to 2021, the downtown HH cluster experienced accelerated fragmentation.
By contrast, the development trend of P2PA in the rural areas of Shanghai was promising, and high-value clusters increased yearly. In 2016, two east-west low-low (LL) clusters appeared in the north and south of the rural areas of Shanghai. In 2017, Zhangjiang Town of Pudong New Area presented a HH clustering state; Zhujiajiao Town of Qingpu District in the north showed a local high-low (HL) cluster; and the LL clusters in Fengxian District and Pudong New Area in the south gradually shrank. In 2018, rP2PA in Shanghai recorded a period of rapid development. The high-value clusters of P2PA gradually spilled over from urban to rural areas. The HH cluster in the northern Pudong New Area broke through the boundary of the Outer Ring Road and extended to Zhangjiang Town, Kangqiao Town, and Zhoupu Town, forming a greater HH cluster. The adjacent Tang Town became a low-high (LH) cluster, while Zhujiajiao Town of northern Qingpu District remained a local HL cluster, and the coastal LL cluster in the southern Pudong New Area shrank at an accelerated pace. In 2019, the HH clusters of Shanghai rP2PA continued to expand, while the LL clusters continued to shrink.
Moreover, the coastal Zhuqiao Town of eastern Pudong New Area emerged as a new HH cluster. In 2020, there was no drastic change in rP2PA clustering in Shanghai. However, the coastal Nanhui New Town of southern Pudong New Area shifted to an HL clustering state, indicating that P2PA distribution in Pudong New Area had an evident clustering growth. In 2021, the HH cluster in Pudong New Area presented a continuous distribution in patches, and the LL clusters of P2PA in rural areas shrank and accelerated.
Hence, it is clear that the high-value clusters of uP2PA in the urban areas of Shanghai gradually fragmented during the study period and that the low-value clusters had a contiguous distribution. By contrast, in rural areas, the HH clusters of rP2PA presented a state of rapid spread and expansion. This was inseparable from the policy support for constructing the P2PA industry in Pudong New Area, the rise of new tourist attractions such as Disneyland, and the construction of beautiful villages in Chuansha New Town based on the promotion of P2PA development. Benefiting from these measures, P2PA in Pudong New Area has become a core carrier of P2PA in Shanghai. With the promotion of the urban–rural system composed of main urban areas-new urban areas-new towns-rural areas, following the Shanghai Master Plan (2017–2035), P2PA is transferring from urban to rural areas. The rural areas of Shanghai are undertaking tourist reception functions together with the urban areas, and urban–rural integration in tourism is gradually becoming a reality.
6 Evolutionary drivers of P2PA clusters in Shanghai
6.1 GWR, MGWR models and results
To explore the spatial non-stationarity of the evolutionary drivers of the spatial pattern of P2PA in Shanghai, a model was constructed by taking the number of P2PAs (787,817) in 216 county-level administrative units of Shanghai from March 2019 to March 2021 as the dependent variable and the number of the constant term (Intercept) and the six primary indexes (drivers) in each county-level administrative unit as the independent variable.
Regression coefficients were calculated using the classical GWR tool of ArcGIS, and bandwidth optimization was performed according to the modified AICc. The results showed that the classical GWR model had an explanatory power of 72.87% and an AICc value of 4,205.14, which was too high. Then, the MGWR model testing was conducted. The analysis results of the MGWR and the classical GWR are provided in Table 3. The AICc value of the MGWR was considerably lower than that of the classical GWR. The goodness of fit (R2) of the MGWR was 85.50%, meaning that it explained 85.50% of P2PA distribution in Shanghai; therefore, the performance of the MGWR was superior to that of the classical GWR. Moreover, the MGWR had fewer effective parameters and a smaller residual sum of squares, which indicates that it used fewer parameters to obtain regression results closer to valid values. Therefore, the MGWR model was adopted to explore the spatial non-stationarity of the evolutionary drivers of the spatial pattern of P2PA in Shanghai.
Table 3
| Model index | MGWR | GWR |
|---|---|---|
| R 2 | 0.891 | 0.789 |
| Goodness of fit (R2) | 0.855 | 0.729 |
| AICc | 282.568 | 4,205.142 |
| Number of effective parameters | 45.542 | 54.166 |
| Residual sum of squares | 23.460 | 3,640,064,664.765 |
Multi-scale geographically weighted regression (MGWR) and classical geographically weighted regression (GWR) model indexes.
6.2 Regression coefficients of factors and visualization analysis of data
The parameter estimates of the Evolutionary Drivers of P2PA Clusters in Shanghai were obtained using the MGWR model. Table 4 presents the statistical summary, including the estimated minimum, maximum, and mean of the variable coefficients of the primary indexes, the proportion of the effective influencing factors (p < 0.05) in the study units, and the proportion of the effective regression coefficients (>0 and < 0) in the study units.
Table 4
| Variable (drivers) | Regression coefficient of MGWR | Proportions in study units (based on t- test)/% | ||||
|---|---|---|---|---|---|---|
| Mean | Minimum | Maximum | p ≤ 0.05 | + | – | |
| Constant term (intercept) | −0.464 | −0.845 | −0.266 | 100.00 | 0 | 100.00 |
| ATD | 0.258 | −0.168 | 1.297 | 46.759 | 100.00 | 0 |
| SRD | −0.635 | −1.667 | 0.376 | 100.00 | 16.204 | 83.796 |
| BDD | −0.278 | −1.268 | 0.022 | 50.926 | 0 | 100.00 |
| TFD | −0.081 | −0.156 | −0.065 | 8.796 | 0 | 100.00 |
| CCD | 0.007 | −0.025 | 0.018 | 0 | – | – |
| CDD | 0.521 | 0.251 | 0.022 | 100.00 | 100.00 | 0 |
Regression coefficients and significance evaluation of each factor (MGWR).
As shown in Table 4, the constant term, SRD, and CDD exerted global effects, while CCD had no significant effect on P2PA distribution. Regarding the directions of action of the factors, ATD and CDD had significant positive effects on P2PA distribution in Shanghai. In contrast, the constant term (Intercept), BDD, and TFD had significant negative effects. Moreover, SRD exerted a spatially heterogeneous effect on P2PA distribution in Shanghai. To clarify the spatial characteristics of the evolutionary drivers of the distribution locations of P2PA in Shanghai, the effective coefficients (p < 0.05) of the MGWR model were equivalently partitioned and visualized (Figures 4a–f).
Figure 4
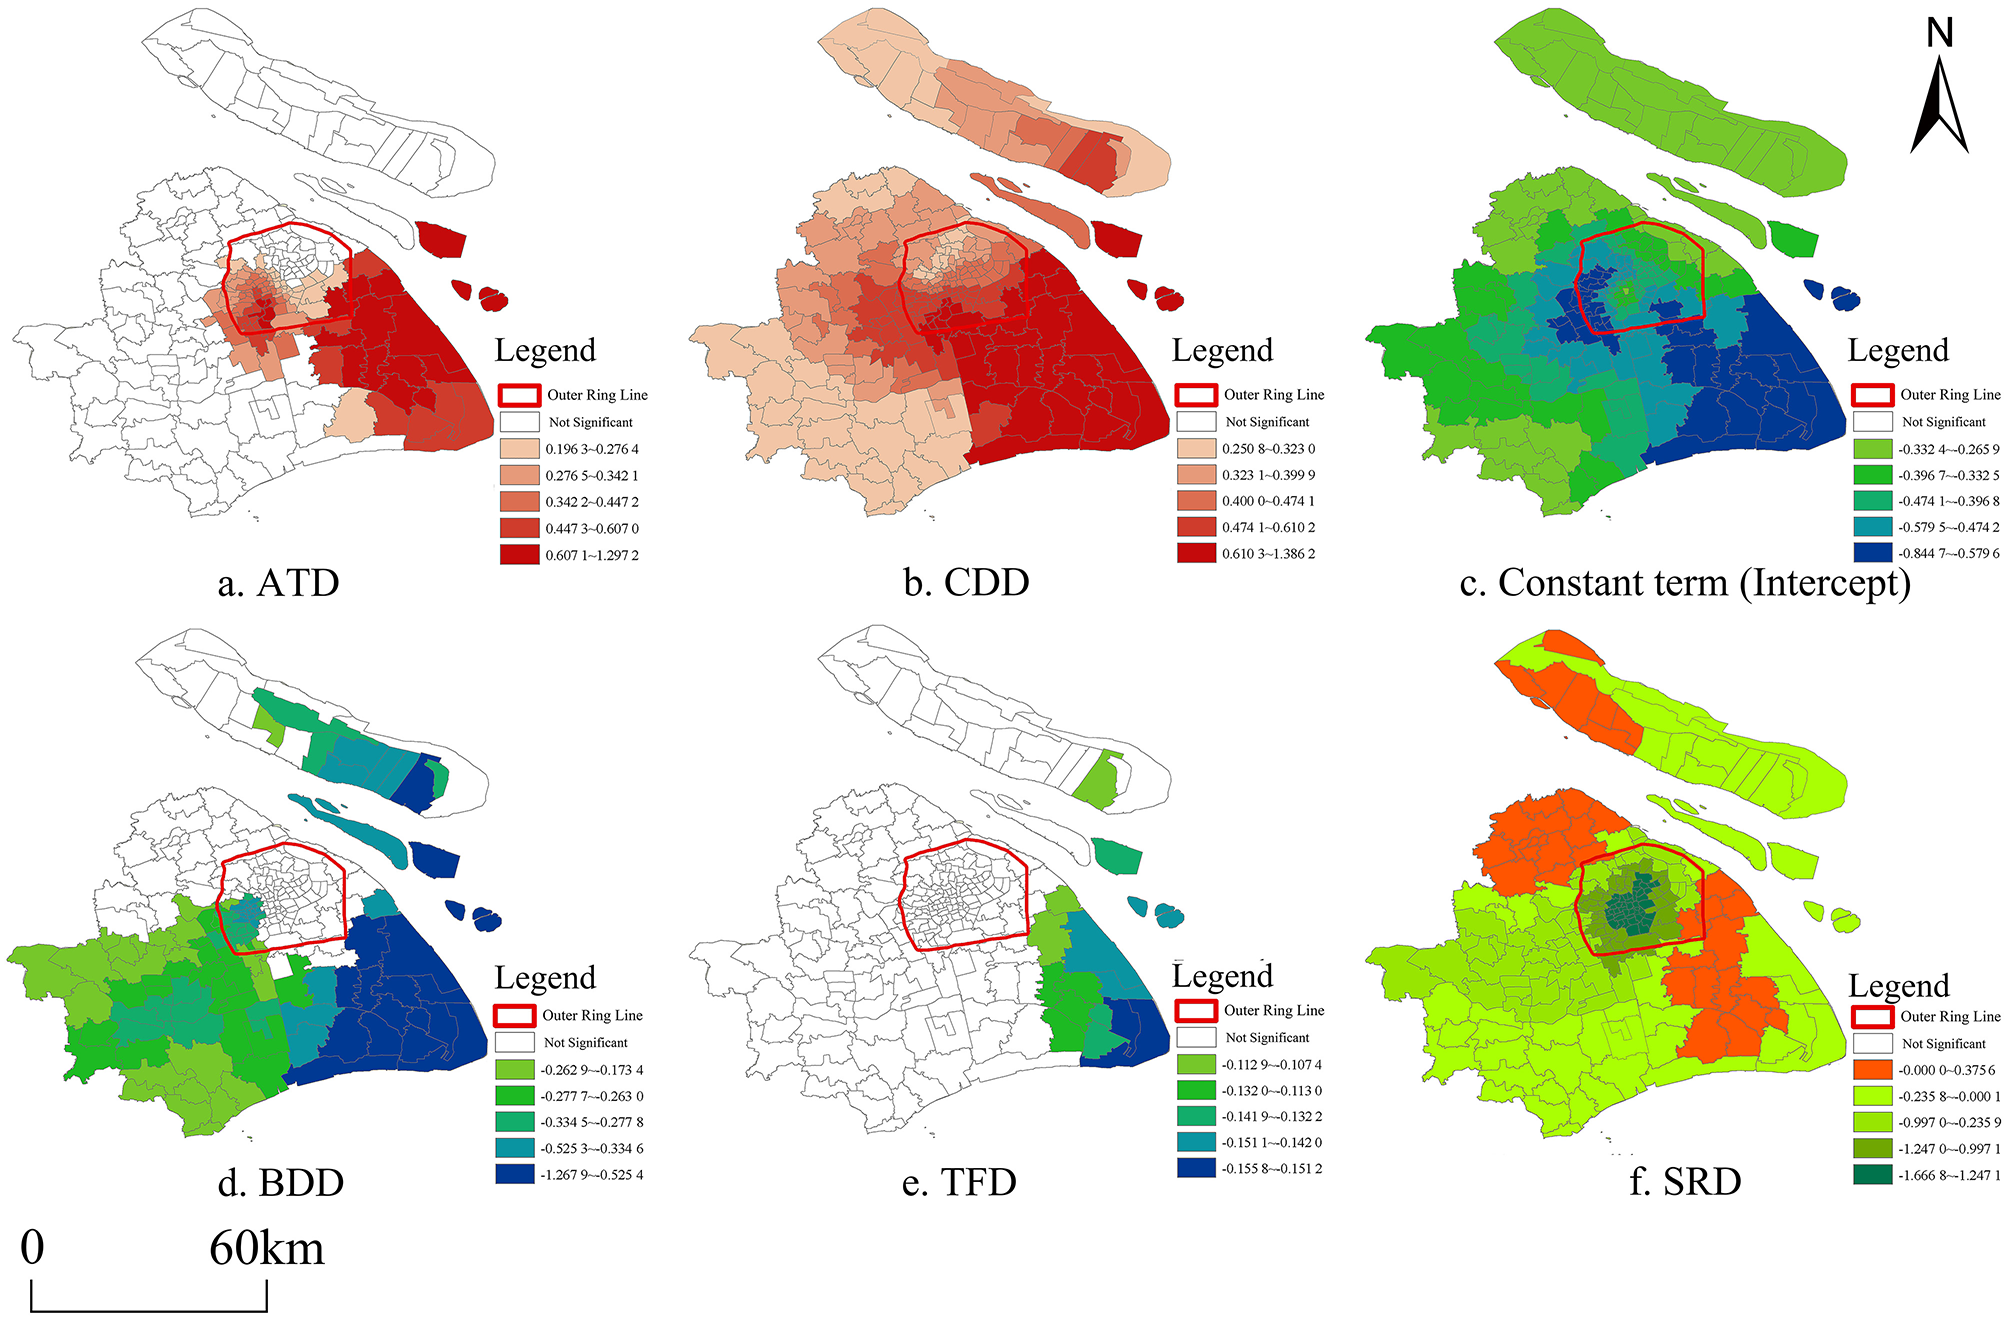
Spatial pattern of the effective coefficients of the MGWR. (a) ATD. (b) CDD. (c) Constant term (intercept). (d) BDD. (e) TFD. (f) SRD.
The results indicated that the density of cultural-tourism drivers (ATD) in Shanghai positively affected the number of P2PAs per unit area. This conclusion is consistent with previous research (Mei and Jiang, 2021; Ma et al., 2021; Zhang et al., 2019; Cao et al., 2021; Long et al., 2019; Li et al., 2021). In essence, the presence of tourism resources has the potential to entice tourists, thereby creating a need for lodging and opportunities to engage with the indigenous culture. This, in turn, can lead to the formation and concentration of P2PA establishments. The effective coefficients exhibited a contiguous belt pattern across central to southeastern coastal regions, indicating a significant impact of ATD on P2PA in the downtown, southwestern main urban areas, and Pudong New Area of Shanghai (Figure 4a). This phenomenon can be attributed to the cultural and historical background of Shanghai, which has led to the formation of 12 historical and cultural areas and the proliferation of cultural-tourism attractions in the downtown region, thereby generating robust demand for tourism accommodation. Furthermore, the development of P2PA in the Pudong New Area has been propelled by abundant resource endowments, distinctive industrial characteristics, and a plethora of cultural-tourism attractions, in line with the planning objective of establishing it as a core functional area of a tourism city.
CDD also had a significant positive effect on P2PA distribution in Shanghai, proving the existence of a competitive relationship between P2PA and hotels in Shanghai, which is consistent with previous research conclusions (Tussyadiah and Pesonen, 2016; Tang et al., 2019; Domènech and Zogal, 2020). This research conclusion also proves that with the natural evolution of the P2PA market, P2PA predominates around popular tourist attractions and the peripheral areas of the city, while in the downtown area, P2PA and hotels are in a state of coexistence (Lai, 2021).
Regarding the spatial distribution of regression coefficients, the positive effect of hotels in Shanghai gradually increased from northwest to southeast, suggesting that the solid competitive relationship between P2PA and hotels is concentrated in the southeastern coastal areas of Shanghai. This result proved that the tourism and hospitality industry of Shanghai is in a contestable market state, with vibrant market entities, and that cultural-tourism attractions have played an essential role in promoting the overall development of the tourism and hospitality industry in Shanghai (Figure 4b).
In terms of negative factors, firstly, research results showed that the constant term (Intercept) had a negative impact on P2PA distribution in Shanghai. The constant term (Intercept) indicates the magnitude of the impact of geographical location changes on the dependent variable after all other variables are determined, that is, the impact of location on the number of P2PAs in the study units. The spatial distribution pattern of its regression coefficient showed an evident C-shaped structure. The higher values were concentrated in Chongming District, Baoshan District, Jiading District, Qingpu District, and Jinshan District. In contrast, the lowest values were concentrated in Pudong New Area and Fengxian District. In addition, the contiguous areas of the lowest values appeared in the main urban areas and the western downtown area (near Hongqiao Airport). This phenomenon suggests that P2PA distribution in Shanghai is negatively impacted by location, which is related to Shanghai's policy of avoiding the formation of a megacity (i.e., the “urban sprawl” development pattern). This also shows that, during the construction of the urban–rural organic system, Shanghai has fully tapped into the advantages of various districts to increase the vitality and momentum of the tourism economy. As a result, the tourism industry is slightly affected by the location radiation effect of the downtown, and the surrounding areas of the city have alleviated the concentrated location pressure of the main urban areas to some extent (Figure 4c).
Moreover, BDD had a particular inhibitory effect on the clustering and distribution of P2PA in Shanghai, showing a negative correlation in low values, which is consistent with previous research conclusions (Ma et al., 2021). The spatial distribution pattern of its effective coefficient showed an “inverted C” shape, with the lowest values observed in Chenjia Town of southern Chongming District and southeastern Pudong New Area. There was a trend of gradual increase toward Fengxian District, Jinshan District, Dongjiang District, and Qingpu District. The main reason is that those areas with concentrated commercial attractions often have soaring land prices. Householders there have more ways (other than P2PA) to profit from houses with high spatial dividends, which hinders the development of P2PA (Figure 4d). For this reason, P2PA clustering in Shanghai is not in Resource-Oriented type. This result differs from the conclusions of existing studies about the pattern of P2PA clustering in areas with lagging economic development.
Finally, there was a negative correlation between TFD and the number of P2PAs in Shanghai. The spatial distribution of its effective regression coefficient was concentrated in Nanhui Xincheng Town and Shuyuan Town of southeastern Pudong New Area, and Chenjia Town and Hengsha Township of Chongming District, and presented a trend of gradual decrease from coastal to inland areas. On the one hand, this is because the high operating costs under the impact of TFD have hindered the development of P2PA. On the other hand, this suggests that tourists to Pudong New Area are not so sensitive to traffic convenience and travel mainly by means of self-driving (Figure 4e).
The effective regression coefficient of SRD was either positive or negative, indicating that its mechanism of action on P2PA distribution in Shanghai exhibited two effects. The spatial expression of its effective regression coefficient showed an evident circle structure. More specifically, scarce resources had the most significant negative impact on P2PA in urban areas and the greatest positive effect on northern Pudong New Area, eastern Fengxian District, Jiading District, and northwestern Chongming District in rural areas. On the one hand, this proves that under the positive drive of scarce resources, P2PA presented a promising development trend in the northern Pudong New Area, eastern Fengxian District, Jiading District, and northwestern Chongming District in rural areas. On the other hand, this also proves that the utilization rate of scarce resources in the southeastern Chongming District and southern Pudong New Area still needs to be improved, and there is still a large room for developing the P2PA industry there (Figure 4f).
On this basis, this study demonstrated that P2PA in Shanghai exhibited two types of clustering patterns: Resource-Oriented and Demand-Oriented. Nonetheless, the hypothesis of Accommodation-Oriented P2PA clustering was rejected. Notably, the P2PA presents vertical clustering.
7 Discussion and conclusions
Using P2PA data for Shanghai from 2016 to 2021, this study explored the spatiotemporal clustering characteristics of P2PA in the urban and rural areas of Shanghai using ArcGIS10.0 and MGWR2.0. Moreover, the spatiotemporal evolution status of the urban–rural tourism system and the evolutionary drivers of the distribution location of P2PA are analyzed in visual form. The main conclusions are as follows:
Firstly, the total number of P2PAs in Shanghai increased continuously presenting significant clustering characteristics and forming a contiguous belt of P2PA in both urban and rural areas. During the six-year period, the HH clusters of P2PA in the urban areas of Shanghai gradually fragmented, while P2PA in the rural areas outside the Sixth Ring Road was characterized by a new contiguous HH cluster, showing a spatial transfer of P2PA from urban to rural areas.
Secondly, the development trend of an urban–rural tourism system in Shanghai is gradually taking shape. In the process of rapid urbanization, rural development is the result of continuous narrowing of the urban–rural gap and the gradual realization of urban–rural integration (Liu, 2018). The growth of P2PAs in rural areas is closely related to rural revitalization and rural tourism construction. uP2PA in Shanghai exhibited a two-stage development trend: a stage of steady growth (2016–2017) and a stage of rapid expansion (2018–2021). During the study period, the number of rP2PAs in Shanghai increased at an accelerated pace. HH clusters gradually expanded beyond the boundary of the Outer Ring Road, forming a contiguous belt of P2PA from urban to rural areas. This suggests that Shanghai has realized the orderly transfer of urban tourists to rural areas through regional functional positioning and collaboration and marked rapid progress in constructing an urban–rural organic tourism system.
Thirdly, the evolutionary drivers of the spatial pattern of P2PA in Shanghai are diversified, and significant differences exist between various factors in their positive and negative effects as well as the spatial distribution of their regression coefficients. Such findings confirm that the effect of intraregional clusters varies county by county (Cohen and Paul, 2005), and both positive and negative effects occur across neighboring regions, known as interregional clusters (Lee et al., 2020; Yang and Fik, 2014). Cultural-tourism attractions have a significant enhancing effect on P2PA distribution in Shanghai, while business demands and traffic facilities have significant inhibitory effects. This conclusion aligns with previous research findings, indicating that tourism resources play a significant role in the distribution of P2PA. Tourism resources can attract tourists, generating demand for accommodation and experiencing local culture, which in turn promotes the emergence and agglomeration of P2PA (Ma et al., 2021). This study is partly consistent with previous research on P2PA in other Chinese cities such as Nanjing (Ma et al., 2021), which found that proximity to tourist attractions is associated with higher densities of P2PA listings. From the perspective of intra-industry relationships and tourist competition, however, our findings differ from earlier evidence, which suggested that P2PA and hotels tend to exhibit a predominantly collaborative rather than competitive relationship. In contrast, the present results reveal that homestays and hotels in Shanghai are still engaged in competition, and this competitive relationship is particularly pronounced in the central urban area. A plausible explanation for this divergence is that the hotel density indicator used in this study covers not only star-rated hotels but also a wide range of other hotel types, thus providing a more comprehensive depiction of the accommodation market. Combining our results with previous research, it can be inferred that P2PA may be locationally complementary to high-end star hotels, avoiding areas with very high concentrations of traditional five-star hotels, while simultaneously competing for customers with chain hotels and economy hotels. Furthermore, the MGWR results indicate that the density of commercial attractions exerts a weak but negative effect on P2PA agglomeration, that is, higher densities of commercial attractions are associated with lower levels of P2PA clustering overall. This reverse driving effect is broadly consistent with earlier empirical findings (Zhang et al., 2019).
The impact of scarce resources on P2PA distribution in Shanghai showed spatial differences. This study confirmed that P2PA vertical clustering in Shanghai conforms to Resource-Oriented and Demand-Oriented clustering mechanisms rejecting the hypothesis of Accommodation-Oriented clustering and demonstrated the existence of a global competitive relationship between P2PA and hotels.
7.1 Theoretical implications
This study explores the heterogeneity in the spatiotemporal clustering evolution and driving mechanisms of urban and rural P2PA in Shanghai and provides a visual framework for interpreting urban–rural differentiation and its associations with multiple spatial factors. First, by identifying a clear pattern of central aggregation and peripheral dispersion, the findings enrich the literature on tourism clusters and spatial economics, showing that P2PA clusters in Shanghai follow a core–periphery diffusion trajectory consistent with central place theory, whereby urban economies generate positive externalities that overcome spatial frictions and trigger rural cluster formation.
Second, building on the reality of sharing accommodation in China, the study extends previous analyses of P2PA drivers by constructing a six-dimensional index system and demonstrating that vertical clustering in Shanghai is jointly shaped by resource-oriented and demand-oriented mechanisms. This provides a theoretical refinement of urban–rural interaction theory, highlighting how tourism resources, business demand and scarce rural assets together underpin the emergence of an integrated urban–rural tourism system.
Third, by applying a multiscale MGWR framework to P2PA data, the study illustrates how spatial non-stationarity and scale effects can be incorporated into the analysis of sharing-economy accommodation, thereby offering a methodological contribution that can be generalized to other cities and related research topics.
7.2 Practical implications
The findings also have several practical implications for urban–rural tourism planning and P2PA management. First, the observed transfer of P2PA clusters from inner-city cores to peri-urban and rural areas suggests the need for integrated urban–rural planning that coordinates spatial layouts, destination carrying capacity and tourism functions, so as to avoid over-concentration in city centers while supporting rural revitalization. Second, the strong influence of cultural-tourism attractions and scarce resources indicates that policy makers should deepen industrial linkages by providing rural P2PAs with financial incentives, technical assistance and marketing support, encouraging the development of agritourism, cultural immersion products and extended tourism value chains. Third, the prominence of resource- and demand-oriented clustering patterns underscores the importance of culture and community-based empowerment, actively involving local residents in P2PA operations and integrating intangible cultural heritage into the design of accommodation and experiences.
In addition, the competitive relationship identified between P2PAs and hotels implies that the coexistence of multiple accommodation formats can enhance regional adaptability and economic resilience. Future policies should pay attention to coordinating the development of P2PAs and hotels, alleviating conflicts of interest and fostering a diversified and resilient tourism accommodation system.
Statements
Data availability statement
The raw data supporting the conclusions of this article will be made available by the authors, without undue reservation.
Author contributions
CW: Funding acquisition, Writing – original draft, Conceptualization, Investigation. HS: Methodology, Writing – review & editing, Project administration. YZ: Validation, Writing – review & editing, Software. WC: Visualization, Validation, Methodology, Writing – review & editing.
Funding
The author(s) declared that financial support was received for this work and/or its publication. This work was supported by Guangdong Philosophy and Social Science Foundation Project [GD22YGL22], the National Social Science Foundation Art Program [grant number 23BH159], Doctoral Research Start-up Fund of Guangdong University of Science & Technology [grant number: GKY-2023BSQD-04], Guangdong Province Key Field Special Project [2024ZDZX4035], Key Scientific Research Project of Nanfang College, Guangzhou [2025XSJ009].
Conflict of interest
The author(s) declared that that this work was conducted in the absence of any commercial or financial relationships that could be construed as a potential conflict of interest.
Generative AI statement
The author(s) declared that generative AI was not used in the creation of this manuscript.
Any alternative text (alt text) provided alongside figures in this article has been generated by Frontiers with the support of artificial intelligence and reasonable efforts have been made to ensure accuracy, including review by the authors wherever possible. If you identify any issues, please contact us.
Publisher’s note
All claims expressed in this article are solely those of the authors and do not necessarily represent those of their affiliated organizations, or those of the publisher, the editors and the reviewers. Any product that may be evaluated in this article, or claim that may be made by its manufacturer, is not guaranteed or endorsed by the publisher.
References
1
Adamiak C. (2018). Mapping Airbnb supply in European cities. Ann. Tour. Res. 71, 67–71. doi: 10.1016/j.annals.2018.02.008
2
Al-Saad S. A. Jawarneh R. N. Aloudat A. S. (2023). Spatiotemporal cluster analysis of reputable tourist accommodation in Greater Amman Municipality, Jordan. J. Hosp. Tour. Technol. 14, 579–597. doi: 10.1108/JHTT-03-2021-0071
3
Brunsdon C. Fotheringham A. S. Charlton M. E. (1996). Geographically weighted regression: a method for exploring spatial nonstationarity. Geogr. Anal. 28, 281–298. doi: 10.1111/j.1538-4632.1996.tb00936.x
4
Cao K. Liu Q. Xie J. Lv C. Meng Y. (2021). Distribution characteristics and influencing factors of homestay in LongHu Mountain scenic area of Yingtan city. Resour. Dev. Mark. 37, 246–250, 152.
5
Charlton M. Fotheringham A. S. Brunsdon C. (2009). Geographically Weighted Regression White Paper. Kildare: National University of Ireland Maynooth, 1–14.
6
Chien Y. -M. C. Carver S. Comber A. (2020). Using geographically weighted models to explore how crowdsourced landscape perceptions relate to landscape physical characteristics. Landsc. Urban Plan. 203:103904. doi: 10.1016/j.landurbplan.2020.103904
7
Cohen J. P. Paul C. J. M. (2005). Agglomeration economies and industry location decisions: the impacts of spatial and industrial spillovers. Reg. Sci. Urban Econ. 35, 215–237. doi: 10.1016/j.regsciurbeco.2004.04.005
8
Cole S. (2009). A logistic tourism model: resort cycles, globalization, and chaos. Ann. Tour. Res.36, 689–714. doi: 10.1016/j.annals.2009.07.004
9
Cui N. Gu H. Shen T. (2019). The spatial differentiation and relationship between housing prices and rents: evidence from Beijing in China. Geogr. Res. 38, 1420–1434. doi: 10.11821/dlyj020180352
10
Cupido K. Fotheringham A. S. Jevtic P. (2020). Local modelling of U.S. mortality rates: a multiscale geographically weighted regression approach. Popul. Space Place. 2379, 1–11. doi: 10.1002/psp.2379
11
da Silva A. R. Mendes F. F. (2018). On comparing some algorithms for finding the optimal bandwidth in geographically weighted regression. Appl. Soft Comput. 73, 943–957. doi: 10.1016/j.asoc.2018.09.033
12
Deng N. Liu J. Dai Y. Li H. (2019). Different cultures, different photos: a comparison of Shanghai's pictorial destination image between East and West. Tour. Manag. Perspect. 30, 182–192. doi: 10.1016/j.tmp.2019.02.016
13
Domènech A. Zogal V. (2020). Geographical dimensions of Airbnb in mountain areas: the case of Andorra. J. Rural Stud. 79, 361–372. doi: 10.1016/j.jrurstud.2020.08.051
14
Fang B. Ye Q. Law R. (2016). Effect of sharing economy on tourism industry employment. Ann. Tour. Res. 57, 264–247. doi: 10.1016/j.annals.2015.11.018
15
Fotheringham A. S. Charlton M. E. Brunsdon C. (1998). Geographically weighted regression: a natural evolution of the expansion method for spatial data analysis. Environ. Plan. A Econ. Space. 30, 1905–1927. doi: 10.1068/a301905
16
Fotheringham A. S. Yang W. Kang W. (2017). Multiscale geographically weighted regression (MGWR). Ann. Am. Assoc. Geogr. 107, 1247–1265. doi: 10.1080/24694452.2017.1352480
17
Gu H. Yu H. Sachdeva M. Liu Y. (2020). Analyzing the distribution of researchers in China: an approach using multiscale geographically weighted regression. Growth Change. 12453, 1–17. doi: 10.1111/grow.12453
18
Gutierrez J. Garcia-Palomares J. C. Romanillos G. Salas-Olmedo M. H. (2016). Airbnb in tourist cities: comparing spatial patterns of hotels and peer-to-peer accommodation. Tour. Manag. 62, 278–291. doi: 10.1016/j.tourman.2017.05.003
19
Guttentag D. (2015). Airbnb: disruptive innovation and the rise of an informal tourism accommodation sector. Curr. Iss. Tour. 18, 1192–217. doi: 10.1080/13683500.2013.827159
20
Hao S. Zhao Y. Li K. (2018). Spatial distribution characteristics and influencing factors of Bed and Breakfast (B&B) in Xiamen City. J. Central China Normal Univ. (Nat. Sci.). 52, 916–924.
21
Heo Y. (2016). Sharing economy and prospects in tourism research. Ann. Tour. Res. 58, 166–170. doi: 10.1016/j.annals.2016.02.002
22
Hu X. Li X. Wang T. Zhao H. Yan S. Deng L. et al . (2020). Spatial agglomeration pattern of homestay inn and influencing factors based on the comparison of Hangzhou, Huzhou, and Enshi cities. Prog. Geogr. 39, 1698–707. doi: 10.18306/dlkxjz.2020.10.009
23
Hudik M. (2020). Substitutability of hotels and peer-to-peer accommodations in Shanghai. J. Hosp. Tour. Insights. 4, 437–456. doi: 10.1108/JHTI-05-2020-0076
24
Lagonigro R. Martori J. C. Apparicio P. (2020). Understanding Airbnb spatial distribution in a southern European city: the case of Barcelona. Appl. Geogr. 115, 1–11. doi: 10.1016/j.apgeog.2019.102136
25
Lai L. (2021). Location of Airbnb and hotels: the spatial distribution and relationships. Tour. Rev. 77:209. doi: 10.1108/TR-10-2020-0476
26
Lee Y. Jang S. Kim J. W. (2020). Tourism clusters and peer-to-peer accommodation. Ann. Tour. Res. 83:102960. doi: 10.1016/j.annals.2020.102960
27
Li L. Hou G. Xia S. (2021). Spatial-temporal pattern and influencing factors of sharing accommodation in Shanghai. Hum. Geogr. 36, 104-14+54. doi: 10.13959/j.issn.1003-2398.2021.01.013
28
Liu Y. (2018). Research on the urban-rural integration and rural revitalization in the new era in China. Acta Geogr. Sin. 73, 637–650.
29
Long F. Liu J. Zhu H. Li T. (2019). Spatial distribution of homestay and its influencing factors in the Yangtze River Delta of China. Geogr. Res. 38, 950–960. doi: 10.11821/dlyj020180308
30
Ma X. Hou G. Li L. Yang Y. (2021). Cluster identification, distribution pattern and influencing factors of B&B based on DBSCAN: a case study of Nanjing. Hum. Geogr. 36, 84–93. doi: 10.31497/zrzyxb.20211017
31
Martín J. M. M. Prados-Castillo J. F. de Castro-Pardo M. Aguilera J. D. D. J. (2021). Exploring conflicts between stakeholders in tourism industry. Citizen attitude toward peer-to-peer accommodation platforms. Int. J. Conflict Manag. 32, 697–721. doi: 10.1108/IJCMA-12-2020-0201
32
Medina-Hernandez V. C. Marine-Roig E. Ferrer-Rosell B. (2024). Attributes influencing guests' experiences: a comparison of nonprofit and for-profit peer-to-peer accommodation platforms. Inf. Tech. Tour. 26, 1–37. doi: 10.1007/s40558-024-00289-w
33
Mei L. Jiang H. (2021). The spatial differentiation process, factors and trends of B&B in Beijing based on Airbnb data. Econ. Geogr. 41, 213–222.
34
Michael E. J. (2003). Tourism micro-clusters. Tour. Econ. 9, 133–145. doi: 10.5367/000000003101298312
35
Ministry of Culture and Tourism of the People's Republic of China (2020). Basic requirements and evaluation of tourist homestays (LB/T 065-2019). Available online at: https://zwgk.mct.gov.cn/zfxxgkml/hybz/202012/t20201205_915538.html (Accessed December 5, 2020).
36
Mollalo A. Rivera K. M. Vahedi B. (2020a). Artificial neural network modeling of novel coronavirus (COVID-19) incidence rates across the continental United States. Int. J. Environ. Res. Public Health. 17:4204. doi: 10.3390/ijerph17124204
37
Mollalo A. Vahedi B. Rivera K. M. (2020b). GIS-based spatial modeling of COVID-19 incidence rate in the continental United States. Sci. Tot. Environ. 728:138884. doi: 10.1016/j.scitotenv.2020.138884
38
Nur Muharam I. Tussyadiah I. P. Kimbu A. N. (2024). A theoretical model of user acceptance of blockchain-based peer-to-peer accommodation. Curr. Iss. Tour. 27, 1008–1025. doi: 10.1080/13683500.2022.2164485
39
Oshan T. M. Li Z. Kang W. Wolf L. J. Fotheringham A. S. (2019). MGWR: a Python implementation of multiscale geographically weighted regression for investigating process spatial heterogeneity and scale. ISPRS Int. J. Geo-Inf. 8:269. doi: 10.3390/ijgi8060269
40
Petruzzi M. A. Marques C. (2024). Peer-to-peer accommodation in the time of COVID-19: a segmentation approach from the perspective of tourist safety. J. Vacat. Mark. 30, 72–92. doi: 10.1177/13567667221118638
41
Porter M. E. (1998). Clusters and the new economics of competition. Harvard Bus. Rev. 76, 77–90. doi: 10.1201/b14647-11
42
Prayag G. Ozanne L. K. A. (2018). systematic review of peer-to-peer (P2P) accommodation sharing research from 2010 to 2016: progress and prospects from the multi-level perspective. J. Hosp. Mark. Manag. 27, 649–678. doi: 10.1080/19368623.2018.1429977
43
Rodríguez-Pérez de Arenaza D. Hierro L. Á. Patiño D. (2019). Airbnb, sun-and-beach tourism and residential rental prices. The case of the coast of Andalusia (Spain). Curr. Iss. Tour. 1–18. doi: 10.1080/13683500.2019.1705768
44
Scherer F. M. Ross D. (1990). Industrial Market Structure and Economic Performance. New York: Social Science Electronic Publishing.
45
Shen T. Yu H. Zhou L. Gu H. He H. (2020). On hedonic price of second-hand houses in Beijing based on multi-scale geographically weighted regression: scale law of spatial heterogeneity. Econ. Geogr. 40, 75–83. doi: 10.15957/j.cnki.jjdl.2020.03.009
46
Sigala M. (2015). The application and impact of gamification funware on trip planning and experiences: the case of TripAdvisor's funware. Electr. Mark. 25, 189–209. doi: 10.1007/s12525-014-0179-1
47
Sisman S. Aydinoglu A. (2022). A modelling approach with geographically weighted regression methods for determining geographic variation and influencing factors in housing price: a case in Istanbul. Land Use Policy119:106183. doi: 10.1016/j.landusepol.2022.106183
48
Tang J. Xie L. Ma M. (2021). Study on spatial distribution and influencing factors of homestay in Chang-Zhu-Tan urban agglomeration. J. Hunan Univ. Fin. Econ. 37, 19–30.
49
Tang L. Kim J. Wang X. (2019). Estimating spatial effects on peer-to-peer accommodation prices: towards an innovative hedonic model approach. Int. J. Hosp. Manag. 81, 43–53. doi: 10.1016/j.ijhm.2019.03.012
50
Tussyadiah I. P. Pesonen J. (2016). Impacts of peer-to-peer accommodation use on travel patterns. J. Travel Res. 55, 1022–1040. doi: 10.1177/0047287515608505
51
Wang D. Nicolau J. L. (2017). Price determinants of sharing economy based accommodation rental: a study of listings from 33 cities on Airbnb.com. Int. J. Hosp. Manag. 62, 120–131. doi: 10.1016/j.ijhm.2016.12.007
52
Wolf L. J. Oshan T. M. Fotheringham A. S. (2018). Single and multiscale models of process spatial heterogeneity. Geogr. Anal. 50, 223–246. doi: 10.1111/gean.12147
53
Wu J. Chen Q. Chen J. (2020). Spatial and temporal distribution and the influencing factors of homestay in Fujian province based on the multi-scale. Resour. Dev. Mark. 36, 647–653.
54
Wu X. Qiu J. (2019). A study of Airbnb listing price determinants: based on data from 36 cities in China. Tour. Tribune. 34, 13–28.
55
Yang J. Luo Y. Xie D. Zhang Y. (2018). Research on operational efficiency of development of B&B resource in rural areas of Chongqing. J. Southwest China Normal Univ. (Nat. Sci. Edn.). 43, 49–56.
56
Yang Y. Fik T. (2014). Spatial effects in regional tourism growth. Ann. Tour. Res. 46, 144–162. doi: 10.1016/j.annals.2014.03.007
57
Yang Y. Li H. (2022). Monitoring spatiotemporal characteristics of land-use carbon emissions and their driving mechanisms in the Yellow River Delta: a grid-scale analysis. Environ. Res.214:114151. doi: 10.1016/j.envres.2022.114151
58
Yu H. Fotheringham A. S. Li Z. Oshan T. Kang W. Wolf L. J. (2020). Inference in multiscale geographically weighted regression. Geogr. Anal. 52, 87–106. doi: 10.1111/gean.12189
59
Zenker S. Kock F. (2020). The coronavirus pandemic—a critical discussion of a tourism research agenda. Tour. Manag. 81:104164. doi: 10.1016/j.tourman.2020.104164
60
Zervas G. Proserpio D. Byers J. W. (2021). A first look at online reputation on Airbnb, where every stay is above average. Mark. Lett. 32, 1–16. doi: 10.1007/s11002-020-09546-4
61
Zhang H. Lu L. Zhang D. Yu H. Zhang X. (2019). Spatial pattern and contributing factors of homestay inns in the area around Mogan Mountain. Geogr. Res. 38, 2695–2715.
62
Zhang M. Geng R. Huang Y. Ren S. (2021). Terminator or accelerator? Lessons from the peer-to-peer accommodation hosts in China in responses to COVID-19. Int. J. Hosp. Manag. 92:102760. doi: 10.1016/j.ijhm.2020.102760
63
Zhang S. Zhang K. (2007). Comparison between general Moran's Index and Getis-Ord General G of spatial autocorrelation. Acta Sci. Nat. Univ. Sunyatseni. 46, 93–97. doi: 10.1631/jzus.2007.A0978
64
Zhang X. (ed.). (2020). “A comparative analysis between Airbnb and hotel industry. The Investigation from China,” in The 20th International Conference on Electronic Business (Hong Kong SAR, China).
65
Zhang X. Song H. Huang G. Q. (2009). Tourism supply chain management: a new research agenda. Tour. Manag. 30, 345–358. doi: 10.1016/j.tourman.2008.12.010
66
Zhang Y. She J. Long X. Zhang M. (2022). Spatio-temporal evolution and driving factors of eco-environmental quality based on RSEI in Chang-Zhu-Tan metropolitan circle, central China. Ecol. Indic. 144:109436. doi: 10.1016/j.ecolind.2022.109436
67
Zhou X. (2018). Research on rural revitalization strategy and planning measure in megacities under the stringent resource constraints: a case study of Shanghai. Shanghai Urban Plan. Rev. 6, 22–29. doi: 10.11982/j.supr.20180603
Summary
Keywords
peer-to-peer accommodation, Shanghai, spatial distribution mechanisms, spatiotemporal clustering, urban–rural tourism system
Citation
Wang C, Shen H, Zhang Y and Cui W (2026) Spatial transfer from urban to rural areas? Characteristics and evolutionary drivers of urban–rural spatiotemporal clusters of peer-to-peer accommodation. Front. Sustain. Cities 7:1721902. doi: 10.3389/frsc.2025.1721902
Received
10 October 2025
Revised
30 November 2025
Accepted
08 December 2025
Published
09 January 2026
Volume
7 - 2025
Edited by
Philip Boland, Queen's University Belfast, United Kingdom
Reviewed by
Arif Ibne Asad, Tomas Bata University in Zlín, Czechia
Hongli Pang, Shanghai Maritime University, China
Updates
Copyright
© 2026 Wang, Shen, Zhang and Cui.
This is an open-access article distributed under the terms of the Creative Commons Attribution License (CC BY). The use, distribution or reproduction in other forums is permitted, provided the original author(s) and the copyright owner(s) are credited and that the original publication in this journal is cited, in accordance with accepted academic practice. No use, distribution or reproduction is permitted which does not comply with these terms.
*Correspondence: Wenjing Cui, cuiwenjing@gdust.edu.cn
Disclaimer
All claims expressed in this article are solely those of the authors and do not necessarily represent those of their affiliated organizations, or those of the publisher, the editors and the reviewers. Any product that may be evaluated in this article or claim that may be made by its manufacturer is not guaranteed or endorsed by the publisher.