Cross-border e-commerce significantly fuels economic expansion in cities, particularly impacting the green development performance of export-oriented developing countries. This paper employs a super-SBM model for evaluating the performance of urban green development (UGDP) in 293 Chinese prefecture-level cities within the timeframe of 2011–2021, using panel data. A multi-period Difference-in-Differences (DID) model is used to analyze the impact of the cross-border e-commerce pilot zone (CEPZ) policy on UGDP and its underlying mechanisms. Findings demonstrate a statistically significant positive effect of CEPZ on UGDP, robust across various sensitivity tests. The policy stimulated green innovation and digital transformation to enhance UGDP. This implies that cross-border e-commerce not only boosts economic expansion in pilot cities but also improves their green development by fostering innovation, accelerating transformation, and reducing energy consumption and carbon intensity. In essence, cross-border e-commerce development yields a “double dividend” of economic advancement and carbon emission reduction. This development model offers a novel approach to sustainable urban growth, balancing economic advancement with environmental stewardship and providing new insights for future urban development strategies.
1 Introduction
The escalating global climate crisis, exacerbated by air pollution, poses significant risks to human well-being (Zhang et al., 2022). In response, and following the Paris Agreement, nations increasingly prioritize green, low-carbon development strategies. Cities, responsible for approximately 80% of global GDP, are both drivers of economic growth and major contributors to greenhouse gas and waste emissions. Improving urban green development is therefore critical to achieving the UN Sustainable Development Goals (SDGs 6, 8, 11, 12, and 13). Such improvements not only foster economic growth and productivity but also conserve resources, reduce pollution, and mitigate greenhouse gas emissions.
China, as a transitioning emerging economy, has sustained rapid growth for four decades since its reform and opening-up, facing serious challenges such as the matters of high energy utilization, emissions, and environmental pollution. The pressures of resource depletion, along with demographic and developmental demands, compel China to shift towards a green and sustainable development pathway. Urban green development’s significance has been consistently emphasized by the Chinese government. In 2022, it introduced the National Plan for New-type Urbanization (2021–2035) to guide the transformation of Chinese cities from extensive to green economies. According to the United Nations Development Programme, China’s overall achievement rate for the 2030 Sustainable Development Goals in urban areas has reached 80.01%. However, economic and environmental indicators still show room for improvement. Therefore, exploring strategies to enhance UGDP and advancing toward sustainable urban development pathways not only provide new frameworks for China but also contribute to the global pursuit of urban sustainability (Parnell, 2016).
Ongoing debate surrounds the subject of the influence of cross-border e-commerce on UGDP. While some research suggests that international trade can lower costs, stimulate green innovation, and improve environmental outcomes (Cao et al., 2021; Wang et al., 2022), other studies highlight potential negative consequences, such as increased waste from packaging and higher energy consumption in logistics (Charfeddine and Mrabet, 2017; Ulucak and Apergis, 2018). UGDP, a holistic measure encompassing economic development and environmental protection, assesses resource use and ecological sustainability (Xia et al., 2024). Existing research on UGDP primarily focuses on quantifying green development levels, analyzing regional variations (Battisti et al., 2023), and identifying influential factors, particularly policy interventions. Studies show that clean air policies positively affect UGDP (Zhou, 2024), and energy transition policies drive improvements through industrial upgrades (Yu et al., 2024). Similarly, the National Ecological Demonstration Zone Policy fosters innovation and strengthens environmental regulation, thereby promoting UGDP (Yuan et al., 2024). Initial investigations into the influences of cross-border e-commerce indicate that CEPZs can boost economic growth and carbon emission efficiency (Li, 2024), although they might also lead to overall CO2 emission increases alongside industrial upgrading and technological advancements (Dong et al., 2023).
Existing studies provide a solid basis for this paper’s examination of the correlation between CEPZ and UGDP. However, there are still gaps in research perspectives, methods and analytical frameworks regarding this relationship that need further analysis and expansion. First, most existing research focuses on building and evaluating indicator systems for cross-border e-commerce and UGDP, paying less attention to how CEPZ impact UGDP. Second, in terms of methodology, the literature largely uses qualitative methods to analyze the cross-border e-commerce development’s economic and ecological advantages, with fewer studies employing rigorous empirical methods like the DID model to assess policy effects. Finally, regarding the analytical framework, most studies consider policy as one of the factors influencing UGDP, but few explore the mechanisms that policy affects UGDP through.
Existing research does not provide direct evidence that CEPZ influence UGDP. This study, by investigating whether the policies in pilot cities can promote urban green development, aims to fill this gap. Specifically, the paper uses the central government’s CEPZ policy as a starting point to empirically examine its impact on UGDP. The study seeks to answer three questions: 1. Does the CEPZ policy have a significant impact on UGDP? 2. What mechanisms drive the impact of the CEPZ policy on UGDP? 3. Is there heterogeneity in the impact of CEPZ on UGDP?
The marginal contributions and innovations of this paper mainly manifest in the following aspects: (1) This study examines the correlation linking CEPZ and UGDP. By applying the DID model to address endogeneity with CEPZ cities taken as quasi-natural experimental samples, the paper identifies the net effect of CEPZ policies on UGDP. This finding provides valuable insights into how a city’s economic and social growth can be promoted by the development of CEPZ while pollution emissions are reduced. (2) Traditional research on urban digital measurement relies on constructing indicator systems, which can be limited by data availability and instability, potentially leading to inaccurate assessments of a city’s digital transformation. This paper introduces a novel approach by using text analytics to measure digital transformation. By using Python’s Jieba library to analyze the annual government work reports for the purpose of extracting and examining keywords associated with urban digital transformation, the study accurately gauges the extent of digital development. This method leverages the reports’ ability to reflect strategic plans and future directions, offering a more reliable measurement of urban digital transformation. Additionally, in the paper, an exploration is made on how urban digital transformation and green innovation mediate the influence of CEPZ on UGDP. (3) Recognizing that disparities in administrative level and location lead to variations in cities’ economic and social evolution capacities., this study systematically investigates how CEPZ impacts UGDP across cities with different locations and administrative statuses. This analysis provides a foundation for policymakers and practitioners to tailor CEPZ development strategies to local conditions, thereby effectively promoting the green growth of cities.
The arrangement of the rest of this paper is as shown below: Background on China’s CEPZ policy is provided in Section 2. Section 3 presents the theoretical framework and hypotheses. Section 4 details the econometric model and data sources. Section 5 presents the empirical findings, robustness checks, and causal mechanism exploration. Finally, Section 6 sees the conclusion of the study and the discussion of its policy implications.
2 Policy background of China’s CEPZ policy
Recently, for the expansion of China’s foreign trade, cross-border e-commerce has been a key catalyst. As an innovative form of trade, it has experienced rapid growth, effectively counteracting declines in exports and supporting economic development for the country. The Chinese government has consistently bolstered its support for cross-border e-commerce with the implementation of an array of policies, aimed at ensuring its sustainable growth, as shown in Supplementary Table S1. In August 2013, the Ministry of Commerce, along with other pertinent departments, released the “Opinions on Implementing Policies to Support Cross-border E-commerce Retail Exports,” which outlined six key measures to address significant challenges hindering the development of retail exports in cross-border trade and to promote its advancement. Subsequently, the State Council issued the “Guiding Opinions on Promoting the Healthy and Rapid Development of Cross-border E-commerce” in June 2015, a landmark document that directed the swift progression of the sector. Against the backdrop of promoting green and low-carbon development, China’s e-commerce industry attaches great importance to sustainable transformation. In 2021, the Ministry of Commerce published the “Notice on Promoting Green Development Among E-commerce Enterprises,” which, for the first time, explicitly detailed specific initiatives to advance green development in the e-commerce sector.
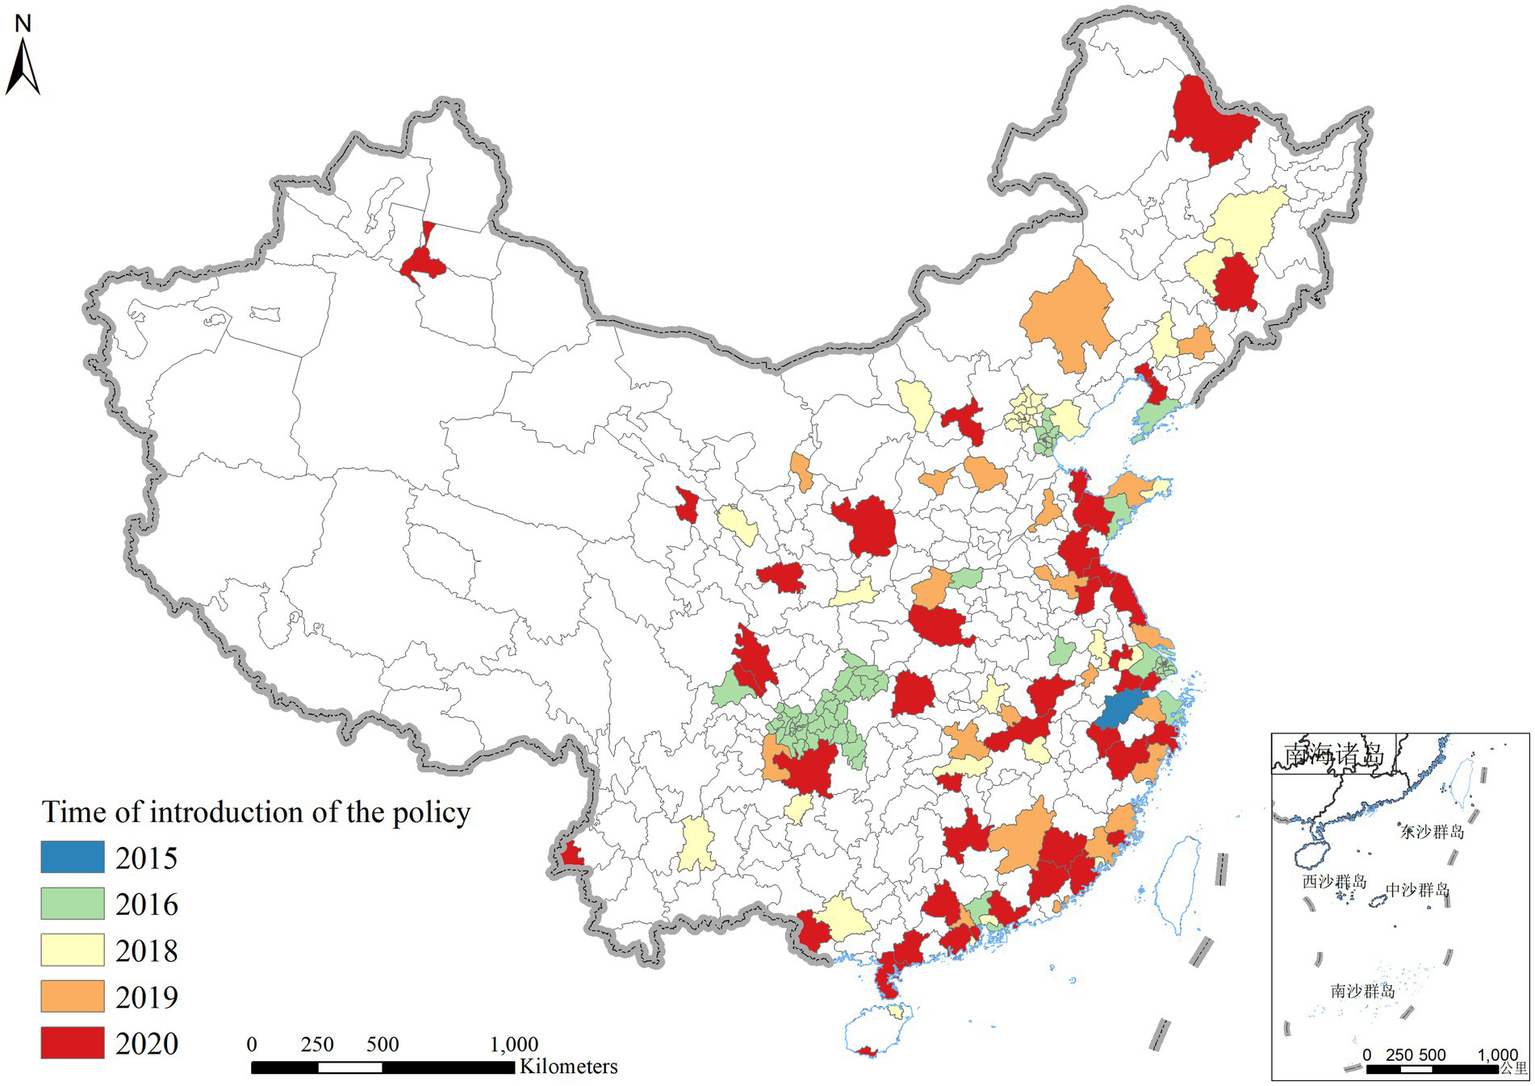
CEPZs stand for China’s initial endeavors to handle institutional barriers to cross-border e-commerce development. The first CEPZ was established in Hangzhou in March 2015, and its successful implementation has been replicated across the nation. The expansion of CEPZs has seen a significant increase in their number and geographic coverage: from 12 pilot cities in January 2016, the count rose to 22 by 2018, expanded further to 59 in 2019, and added 46 more in 2020. In February 2022, an additional 27 cities were designated as CEPZs, followed by 33 more, including Langfang, in September of the same year. This growth brought the total number of CEPZs to 165. Details are reported in Supplementary Tables S2, S3. Throughout their development, CEPZ pilot cities have prioritized the implementation of green development strategies. For instance, Qingdao has effectively leveraged Hangzhou’s model to create an internet information flow-driven green development framework. The establishment of CEPZs in China has occurred in seven distinct phases, with inland cities pursuing unique growth trajectories based on their specific industrial strengths and geographic benefits. Concurrently, coastal cities in the eastern regions have concentrated on pioneering new business models and formats, gradually establishing an open network characterized by “land-sea interconnection and east–west mutual benefit.” The geographical distribution and establishment timelines of CEPZs across different batches are depicted in Figure 1.
Figure 1
Geographic location and timing of CEPZ establishment in batches. In the legend, 2015 indicates that the city introduced the CEPZ policy in 2015; the same interpretation applies to the other years.
3 Theoretical analysis and research hypothesis
The CEPZ policy is capable of improving supply chain efficiency, optimize resource use, and facilitate the green upgrading of industries (Li, 2024). Firstly, CEPZs can significantly lower information acquisition costs. Drawing on principles from information economics, CEPZs offer digital platforms for information sharing that streamline interactions between merchants and consumers, thereby reducing the costs associated with information searches. Additionally, these zones dismantle information barriers, enabling green products to access broader sales channels, thus promoting the growth of environmentally sustainable industries and urban green sectors.
Secondly, digital technologies are harnessed by CEPZs to propel precision marketing and intelligent sales strategies. This technological integration improves circulation efficiency, better aligns supply with demand, and results in cost reductions and increased operational efficiency, contributing to the enhancement of UGDP. Furthermore, leveraging the long tail theory, CEPZs employ digital technologies to enhance market communication, allowing for the provision of customized products and the collection of data on potential customers (Elia et al., 2021). Through developing robust e-commerce platforms catering to personalized demands and backing numerous SMEs, CEPZs capitalize on the “long tail effect,” thereby expanding the market. This expansion attracts investment and businesses, which in turn increases market concentration and accelerates urban green development.
Moreover, the CEPZ policy fosters the growth of cross-border e-commerce ancillary services such as transactions, payment systems, and logistics. It drives the optimization and upgrading of urban industrial structures, not only stimulating economic growth but also reducing pollution emissions from traditional industries, thereby positively influencing UGDP. Therefore, this paper proposes Hypothesis 1:
H1: The implementation of the CEPZ policy has a significant positive effect on urban green development performance (UGDP) by improving economic efficiency and reducing environmental pressure.
Endogenous Growth Theory suggests that innovation is a crucial driver of economic expansion, with urban green innovation increasingly playing a pivotal role in advancing urban green development (Liao and Li, 2022). Regarding innovation costs, the CEPZ policy offers financial support and tax incentives to foster green innovation. Additionally, CEPZs can centralize funding and talent, thereby lowering financing and R&D expenses and boosting the motivation for technological innovation in pilot cities (Cheng and Jin, 2022). From a market demand perspective, CEPZs eliminate geographical and temporal barriers, and the utilization of artificial intelligence and big data makes it easier to discover new markets (Pillai et al., 2021; Borghi and Mariani, 2021). As market expansion heightens competition, enhancing green technological innovation becomes essential for achieving market recognition and securing investment trust, which in turn improves product competitiveness and social acceptance, thereby strengthening the drive for urban green innovation. Moreover, green technological innovation is inherently knowledge-intensive (Bartlett and Trifilova, 2010). CEPZs, by concentrating funds, talent, and technology, possess a wealth of innovative resources and achieve higher efficiency in green innovation. The spatial clustering of green technological innovation activities fosters knowledge exchange among workers across various innovation stages, lowering the costs of knowledge transformation and further increasing green innovation efficiency. This spatial agglomeration also attracts high-caliber technological R&D talent, helping the urban industrial structures transform and upgrade towards sustainability. The outcomes of green technological innovation in developing countries and regions initially drive urban economic growth, thereby providing the financial backing necessary for enhancing urban green development (Zhou, 2012). Based on this analysis, this study proposes Hypothesis 2:
H2: The CEPZ policy indirectly enhances UGDP through its positive impact on urban green innovation.
The CEPZ policy is of vital significance in facilitating the digital transformation of urban industries, thereby enhancing urban green development outcomes. CEPZs support the establishment of digital financial services, intelligent logistics, and e-commerce credit systems, which provide platforms for the enlargement of the service sector and the elevation of the proportion of the tertiary industry. This growth necessitates robust digital information technology infrastructure. Moreover, the government has underscored the importance of strengthening digital information technology infrastructure in cross-border e-commerce. Motivated by both market demands and policy initiatives, CEPZs are set to significantly drive urban digital transformation. The digitization of economies has turned out to be a critical element in facilitating economic growth, social transformation, and environmental sustainability (Wei et al., 2023). Digital transformation not only facilitates the green transformation of urban lifestyles by mitigating environmental pollution (Zhang and Ran, 2023) but also supports the sustainable development of industrial systems through the industrial structure upgrading (Kohli and Melville, 2019; Wu et al., 2021) and resource allocation optimization (Ishida, 2015). Additionally, urban digitalization can reduce transaction costs associated with transportation, communication, and coordination (Alcácer et al., 2016). Digital technology platforms empower the integration of knowledge and data from various regions and industries, thereby facilitating cross-sector innovation, promoting the eco-friendly transformation of production modes (Zhang et al., 2024) and thereby enhancing UGDP. Based on this analysis, we propose Hypothesis 3:
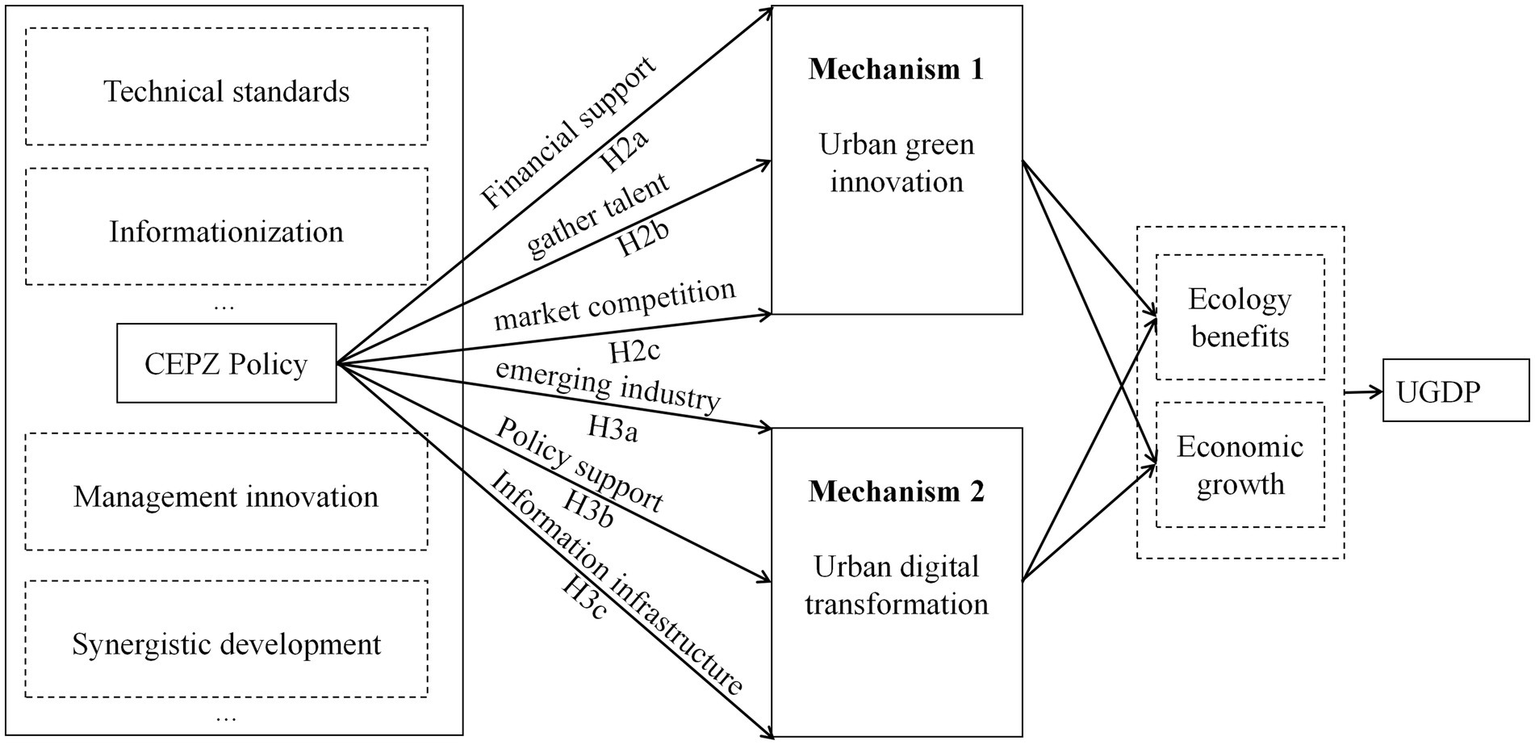
H3: The CEPZ policy promotes urban digital transformation, which in turn contributes to improvements in UGDP (see Figure 2).
Figure 2
Research framework of this study.
4 Research design
4.1 Model design
4.1.1 Difference-in-differences model
The focus of this study is to examine how the CEPZ policy influences UGDP. Implemented in seven distinct phases, the CEPZ policy introduced variations both temporally comparing periods before and after its enactment and geographically distinguishing pilot cities from non-pilot ones. To accurately isolate the CEPZ policy’s effect on UGDP, a multi-timepoint DID approach is employed, which effectively accounts for these temporal and spatial differences. The analysis includes a treatment group of 165 cities designated as CEPZs and a control group comprising cities without such pilot status. Building on the framework established by Bertrand’s model design (Bertrand et al., 2004), the following DID model is developed to appraise the influence of the CEPZ policy on UGDP, as presented in Equations 1, 2:
Wherein, i and t represent city and year, respectively; serves as the dependent variable, denoting the UGDP of city i in year t; represents the matrix of city-level control variables, specifically encompassing economic development, industrial structure, fiscal level, urbanization rate, market environment, and environmental regulation. and denote city fixed effects and year fixed effects, respectively, while represents the random disturbance term, and is the intercept term. is the group dummy variable, indicating whether the city has established a CEPZ. If so, equals 1; otherwise, it equals 0. is the policy dummy variable, indicating whether the CEPZ has been established in the current year. If city i and previous years have not established a CEPZ, ; otherwise, it equals 1. This study primarily focuses on the coefficient If , it indicates that in comparison with the control group, the establishment of CEPZs has promoted urban green development, thereby confirming Hypothesis 1.
4.1.2 Mediating effects model
To identify the potential mediating effects between the core explanatory variable and the dependent variable in this study, namely the influences of urban green innovation and urban digital transformation as mediating variables, the following regression equations are constructed based on the theoretical mechanism analysis of previous studies, using the independent variable and potential mediating variables and :
Where represents urban green innovation, denotes urban digital transformation, and are city fixed effects, and reflect time fixed effects, and are intercept terms, and and are error terms.
4.2 Variable selection
4.2.1 Dependent variable: UGDP
The Super-SBM model is used to evaluate UGDP in accordance with the methodology described by Li et al. (2022). In academic research, UGDP evaluation typically employs either parametric (SFA) or non-parametric (DEA) approaches (Li et al., 2022). The DEA method offers several advantages over SFA, including the absence of required production function assumptions, reduced subjectivity, simplified algorithms, and minimized errors (Zheng, 2021). However, DEA’s limitation lies in its inability to further analyze efficient decision-making units.
Addressing the consideration of undesired outputs (Tone, 2001) put forward the SBM model, which is a non-radial efficiency measurement in the context of the DEA framework (Di et al., 2021). This model directly incorporates slacks into the objective function, accounting for undesired outputs while measuring excess inputs and insufficient outputs (Zheng, 2021). To overcome the inability of the standard SBM model to distinguish among decision-making units that are efficient at the same time, a super-efficiency SBM model was developed by Tone (2002).
Adopting Li’s approach, our model is constructed accordingly:
Where stands for the UGDP computed by means of the Super-SBM model. , , denote the slack variables of inputs, desirable outputs and undesirable outputs, respectively. k and j are DMUs, and λ is the weight of jth DMU.
To evaluate total factor input efficiency and energy efficiency in the context of UGDP, we develop an indicator system that incorporates undesired outputs, as presented in Table 1. Traditional methods of measuring energy efficiency often rely on GDP energy consumption to assess UGDP, which neglects the substitution effects of factors like capital and labor. Therefore, this study measures urban economic inputs across capital (fixed asset investment, urban land area, and science expenditure), labor (year-end employment and industrial enterprise counts), and energy (water, gas, and electricity consumption).
Table 1
Primary indicators
Secondary indicators
Tertiary indicators
Input indicators
Capital input
Fixed asset investment
Urban construction land area
Fiscal expenditure on science and technology
Labor input
Number of employed persons (year-end)
Number of large industrial enterprises
Energy and resource input
Total water supply
Total gas supply
Total electricity consumption
Output indicators
Desired outputs
Real GDP
Per capita total social consumption
Urban green area
Undesirable outputs
Industrial wastewater discharge
Sulfur dioxide emissions
Dust (smoke) emissions
UGDP indicators.
Both favorable and unfavorable outputs are encompassed by the output indicators. The desirable outputs include real GDP, total per capita social consumption, and urban green area. Real GDP is measured at constant 2011 prices, while total per capita social consumption and urban green area are normalized using the min-max method. Undesired outputs are symbolized by industrial waste emissions, which include industrial wastewater discharge, sulfur dioxide emissions (Chen et al., 2024), and dust (smoke) emissions. Missing values for these indicators are interpolated using the ipolate command in Stata. Utilizing these indicators and methods, the UGDP of Chinese cities has been assessed for the period from 2011 to 2021.
4.2.2 Core explanatory variable: CEPZ
The CEPZ is adopted as a quasi-natural experiment in this study. The main explanatory variable indicates whether a city was designated as CEPZ in a specific year. If a city became a pilot city during the sample period, the variable takes a value of 1; otherwise, it is 0. For the year of establishment and all following years, the time variable is assigned a value of 1; otherwise, the value is 0. Supplementary Table S1 provides the list of CEPZs.
4.2.3 Control variables
Based on literature on the drivers of urban green economic growth and cross-border e-commerce (Wang and Yi, 2021; Ma et al., 2021), the following control variables are included: (1) Economic development (per capita GDP); (2) Industrial structure (ratio of secondary and tertiary industry output to GDP); (3) Government expenditure (Qi et al., 2021) (fiscal expenditure as a percentage of GDP); (4) Urbanization rate (urban population as a proportion of total population); and (5) Marketization level (number of newly registered enterprises in the city).
4.3 Data sources
This study employs panel data from 293 Chinese cities covering the years 2011-2021. Data for the explanatory variable—the CEPZ policy pilot cities—are obtained from the official Chinese government website. The dependent variable, UGDP, is calculated based on a constructed input–output indicator system. The measurement of labor input is based on the number of employed persons at year-end, sourced from statistical yearbooks and development bulletins of provinces. The capital input is estimated by utilizing the perpetual inventory method, with 2000 being set as the base year., using data from the China Statistical Yearbook and local statistical bulletins. The energy and resource inputs originate from the China Energy Statistical Yearbook.
As for control variables, the measurement of the marketization level is based on the number of newly registered enterprises in a city, sourced from Tianyancha. Other control variables are obtained from provincial and city statistical yearbooks. Intermediary variables—urban digital transformation and urban green innovation—are measured using keyword frequencies in government work reports from official provincial and city websites, and the count of green patents, utility models, and inventions in cities from the National Intellectual Property Administration, respectively. Missing data are supplemented using bulletins on local economic development and yearbooks for prefecture-level city statistics (2011–2021). Table 2 presents the statistical characteristics of each variable.
Percentage of GDP (%) contributed by secondary and tertiary industries (%)
2,567
97.641
6.065
44.210
99.990
Government expenditure
Government fiscal (%) expenditure / GDP (%)
2,561
0.204
0.131
0.044
2.349
Urbanization rate
Urban population / total population (%)
2,799
1.258
4.098
0.182
27.338
Marketization level
Marketization Index (re-scaled to 0–100, based on the number of newly registered enterprises)
3,339
52.579
28.186
0.110
100
Descriptive statistics.
5 Analysis of empirical results
5.1 Benchmark regression results
Using a DID model, we assessed the effect of the CEPZ on urban UGDP. The results of the baseline regression are presented in Table 3. In column (1), provided that only the time-fixed effect and city-fixed effect are controlled, the estimated coefficient is positively significant at the 1% level with markedness. Thereby, it shows that the CEPZ policy exerts a favorable action on UGDP. To address potential omitted variable bias, control variables were added, and the results can be seen in column (2). The coefficient that has been estimated remains markedly positive at the 5% level of significance, showing that the CEPZ policy significantly increases UGDP in pilot cities in contrast to non-pilot cities, supporting Hypothesis 1.
Table 3
Variable
(1)
(2)
CEPZ
0.029***
0.009**
(0.004)
(0.004)
Economic development
0.026***
(0.006)
Industrial structure
0.038
(0.040)
Government expenditure
0.164***
(0.024)
Urbanization rate
12.820***
(2.012)
Marketization level
0.045***
(0.005)
City fixed effects
Yes
Yes
Year fixed effects
Yes
Yes
Cons
1.048***
0.767***
(0.001)
(0.042)
Sample size
2,840
2,429
R2
0.552
0.719
Benchmark regression results.
*, *, and *** indicate statistical significance at the 10, 5, and 1% levels, respectively. Standard errors are in parentheses. This notation applies to all subsequent tables.
The CEPZ policy appears to enhance UGDP by attracting capital and talent, stimulating the growth of emerging industries such as digital services, facilitating the optimization and upgrading of urban industrial structures and enhancing the driving force for urban green development. This policy effectively enhances the level of urban green development, which contributes to green transformation, industrial upgrading, and the sustainable development of the city.
The regression outcomes regarding the control variables are in line with what was expected. Urban economic development, government expenditure, urbanization rate, and marketization level all have significant positive impacts on UGDP. Economic development serves as a foundation for urban green development by exerting an influence on green innovation capacity and emerging sectors development, which benefit urban green progress. Government expenditure provides financial support, enhances the effects of the CEPZ policy, and promotes UGDP. Both urbanization rate and marketization level, as indicators of market size, contribute to smoother information flow and economies of scale, reducing production costs and enhancing urban green development. Improving market order and advancing market reforms can further help cities achieve green development goals.
5.2 Parallel trend test
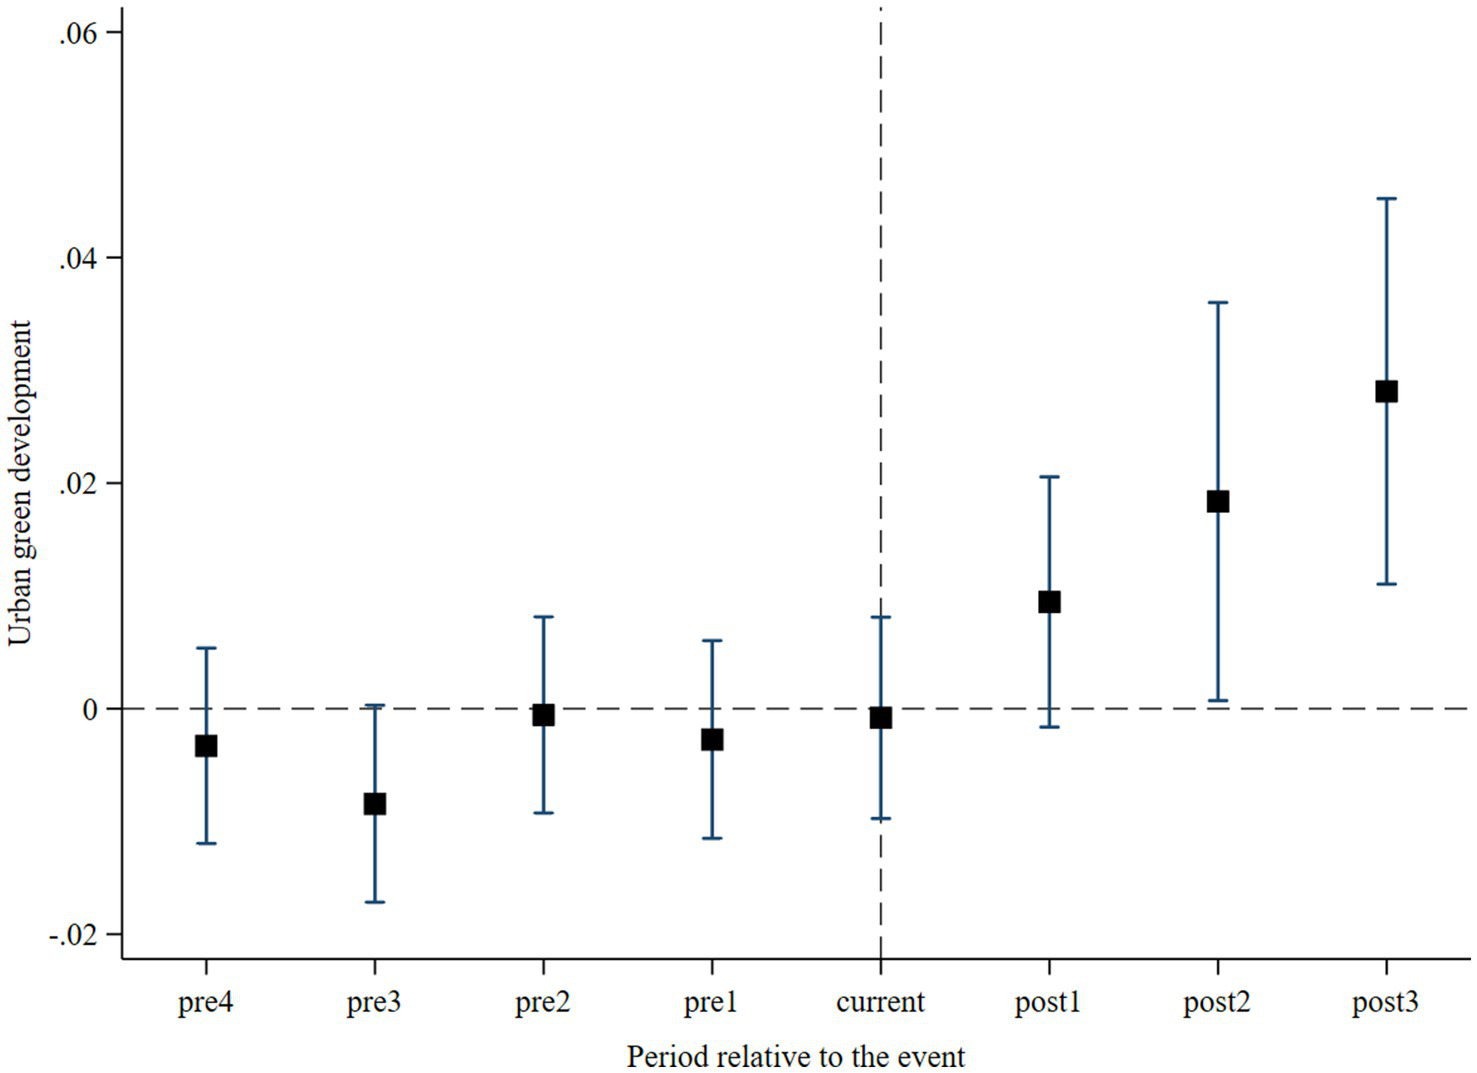
A fundamental assumption the multi-period DID model rests on is that before the policy is executed, the treatment and control groups exhibit similar tendencies, namely the parallel trend assumption. To examine the dynamic effects of the CEPZ on UGDP and verify compliance with this assumption—that, in the absence of CEPZ, the green development trends of both groups would be identical—the following parallel trend test model is constructed (Equation 6):
In the equation, represents whether a city is a CEPZ pilot city, where Treat = 1 represents the treatment group (pilot cities), and Treat = 0 represents the control group (non-pilot cities). denotes the year when the CEPZ was established in the city, and k represents k years after the establishment of the CEPZ. indicates whether there is a significant difference in UGDP between pilot and non-pilot cities k years after the CEPZ establishment. represents city fixed effects, represents time fixed effects, and represents the random disturbance term. Based on Equation 5, the parallel trend test is carried out, with the results being presented in Figure 3. If the regression coefficient of the impact of the CEPZ policy on UGDP fails to pass the significance level test before the policy is implemented, it indicates that no significant disparity was observed between the treatment and control groups before the policy implementation took place, fulfilling the parallel trend hypothesis. As seen in Figure 3, during the pre1-pre4 period before policy implementation, the regression coefficients lack significance, which implies that there was no statistically discernible difference in green development index between the treatment group and the control group before the CEPZ policy was implemented, thus passing the parallel trend test. After the policy implementation, within the post1-post3 period, the regression coefficients acquire significance, indicating that the CEPZ significantly promotes UGDP after policy implementation. In summary, the utilization of the DID method within this paper for analyzing the effect of the CEPZ policy on UGDP adheres to the basic premise of the parallel trend hypothesis.
Figure 3
Parallel trend test plot.
5.3 Robustness analysis
To guarantee the robustness of the test outcomes, four methods are utilized for validation in this paper: variable substitution test, exclusion of interfering policies test, placebo test, and PSM-DID.
5.3.1 Variable substitution test
UGDP is manifested in the reduction of carbon emissions and energy consumption while spurring economic growth (Zhang et al., 2024). To obtain more robust results, and drawing on Qi et al. (2021), we re-measure the policy effects of CEPZ using indicators such as carbon emission intensity, total energy consumption (Kirat et al., 2024), GDP, and per capita GDP, incorporating them into the benchmark regression model. Table 4 presents the results. Under constant conditions, the CEPZ significantly promotes urban GDP development and reduces energy consumption and carbon emission intensity. This demonstrates that the CEPZ policy enhances UGDP and supports the robustness of the benchmark regression results.
Table 4
Variable
(1)
(2)
(3)
(4)
Carbon emission intensity
Energy consumption
LnGDP
Ln GDP per capita
CEPZ
−0.092***
−0.113***
0.098***
0.039***
(0.026)
(0.024)
(0.010)
(0.009)
Economic development
0.657***
0.392***
0.995***
0.958***
(0.040)
(0.036)
(0.015)
(0.014)
Industrial structure
−0.170
0.458**
0.162
0.146
(0.272)
(0.205)
(0.104)
(0.096)
Government expenditure
−0.703***
1.106***
−0.307***
−0.236***
(0.160)
(0.130)
(0.060)
(0.055)
Urbanization rate
−39.505***
−47.810***
11.500**
17.655***
(13.583)
(12.965)
(5.087)
(4.666)
Marketization level
0.006
0.207***
0.152***
0.141***
(0.037)
(0.032)
(0.014)
(0.013)
City fixed effects
Yes
Yes
Yes
Yes
Year fixed effects
Yes
Yes
Yes
Yes
Cons
4.180***
4.795***
5.383***
8.670***
(0.282)
(0.226)
(0.107)
(0.098)
Sample size
2,411
1969
2,160
2,160
R2
0.907
0.971
0.993
0.990
Robustness tests 1 replacement variables.
*, *, and *** indicate statistical significance at the 10, 5, and 1% levels, respectively. Standard errors are in parentheses.
5.3.2 Exclusion of interfering policies test
Given the potential overlapping effects of government policies introduced concurrently, failing to account for other relevant policies could distort the baseline estimation results. To address this, we collected policies that may have impacted urban green development between 2011 and 2020, including the Smart City Pilot Policy (Chen and Dagestani, 2023; Chen, 2023), the Low-Carbon City Pilot Policy (Chen et al., 2020), the New Energy Demonstration City Policy, and the Circular Economy Demonstration City Pilot Policy. An interfering policy exclusion test was conducted by incorporating dummy variables for these four policies to control for their potential impacts on the research findings. Table 5 presents the regression results. The regression results after separately adding the dummy variable of each policy are presented in the first four columns, while the fifth column includes all four policies simultaneously in the benchmark regression model. Notably, the coefficient estimated for CEPZ remains markedly positive, having a trifling deviation from the baseline results, which demonstrates the robustness of our findings.
*, *, and *** indicate statistical significance at the 10, 5, and 1% levels, respectively. Standard errors are in parentheses.
5.3.3 Placebo test
For the purpose of ensuring the robustness of the estimated effect of the CEPZ policy on UGDP, a placebo test was conducted by altering the policy implementation timing. Following Chen et al. (2020), hypothetical policy implementation dates were advanced by 3–5 years. The CEPZ policy interaction term was reconstructed and included in the benchmark regression model. If the dummy variable for CEPZ remained significantly positive, it would suggest that the observed effects might be due to other policy changes or random factors rather than the CEPZ policy. The regression results, shown in Table 6 (1) to (3), reveal that the estimated coefficients for the CEPZ interaction term are not significant, implying that urban green development is indeed attributable to the implementation of the CEPZ policy, and the benchmark regression results exhibit good robustness.
Table 6
Variable
(1)
(2)
(3)
Three years in advance
Four years in advance
Five years in advance
CEPZ
0.004
−0.000
−0.002
(0.003)
(0.003)
(0.003)
Economic development
0.028***
0.029***
0.030***
(0.006)
(0.006)
(0.006)
Industrial structure
0.038
0.037
0.037
(0.040)
(0.040)
(0.040)
Government expenditure
0.166***
0.167***
0.167***
(0.024)
(0.024)
(0.024)
Urbanization rate
12.749***
12.847***
12.883***
(2.015)
(2.016)
(2.016)
Marketization level
0.044***
0.044***
0.044***
(0.005)
(0.005)
(0.005)
City fixed effects
Yes
Yes
Yes
Year fixed effects
Yes
Yes
Yes
Cons
0.765***
0.762***
0.761***
(0.042)
(0.042)
(0.042)
Sample size
2,429
2,429
2,429
R2
0.718
0.718
0.718
Robustness tests 3 placebo tests.
*, *, and *** indicate statistical significance at the 10, 5, and 1% levels, respectively. Standard errors are in parentheses.
5.3.4 PSM-DID test
Although the baseline regression satisfies the parallel trend assumption, given that factors such as economic development and digitalization levels can influence it, the selection of CEPZ pilot cities may not be entirely exogenous (Wang et al., 2022). To mitigate selection bias and resulting endogeneity issues, we employ propensity score matching (PSM), which reduces biases from observable and unobservable factors between CEPZ pilot cities and the control group (Wang et al., 2019). Therefore, this study utilizes the PSM method proposed by Heckman et al. (1998) to test the robustness of the baseline regression.
In an effort to gain better control of differences between the treatment and control groups, we apply three PSM-DID estimation methods—caliper matching, nearest neighbor matching, and kernel matching—to alleviate potential sample selection bias. Specifically, a logistic regression is performed on the dummy variable indicating whether a city is approved as a CEPZ, using economic level, industrial structure, fiscal status, urbanization rate, and market environment as covariates. In caliper matching, a caliper value of 0.823 (one-quarter of the standard deviation of the propensity score) is used. Fork-nearest neighbor matching, k is set to 2. Only samples within the common support domain are retained for regression analysis.
As shown in Table 7, the estimation outcomes, suggest that the dummy variable related to the CEPZ policy stays significantly positive at the 5% level. This indicates that the CEPZ policy is beneficial to the enhancement of UGDP, thereby confirming the robustness of our conclusion.
Table 7
Variable
(1)
(2)
(3)
Caliper matching (radius = 0.823)
k-Nearest neighbor matching (k = 2)
Kernel matching
CEPZ
0.008**
0.009**
0.009**
(0.004)
(0.004)
(0.004)
Economic level
0.041***
0.026***
0.026***
(0.009)
(0.006)
(0.006)
Industrial structure
0.377***
0.038
0.038
(0.144)
(0.040)
(0.040)
Fiscal level
0.035
0.164***
0.164***
(0.042)
(0.024)
(0.024)
Urbanization rate
3.786
12.820***
12.820***
(3.506)
(2.012)
(2.012)
Market environment
0.057***
0.045***
0.045***
(0.010)
(0.005)
(0.005)
City fixed effects
Yes
Yes
Yes
Year fixed effects
Yes
Yes
Yes
Cons
0.506***
0.767***
0.767***
(0.144)
(0.042)
(0.042)
Sample size
1,142
2,429
2,429
R2
0.828
0.719
0.719
Robustness tests 4 PSM-DID.
*, *, and *** indicate statistical significance at the 10, 5, and 1% levels, respectively. Standard errors are in parentheses.
5.3.5 Heterogeneous treatment effect and robustness test
Drawing on Callaway and Sant’Anna’s (2021) research, to further verify result robustness and address potential bias concerns in two-way fixed effects estimation, this study implements corresponding correction strategies by employing the multiple-period doubly robust estimator (Callaway and Sant’Anna Difference-in-Differences, CSDID) for robustness testing. This approach, grounded in the principle of double robustness, effectively alleviates potential estimation bias in the DID framework (Table 8). Table 8 results demonstrate that all four different types of average treatment effects confirm that CEPZ policy implementation significantly enhances urban UGDP, consistent with baseline results, indicating conclusion robustness.
Table 8
Variable
(1)
(2)
(3)
(4)
Simple weighted average treatment effect
Dynamic average treatment effect
Calendar average treatment effect
Group-wise average treatment effect
Simple ATT
0.015**
−0.002
0.007
0.002
Pre_avg
0.026**
0.010
Post_avg
CAverage
0.015**
0.007
GAverage
0.008*
0.004
Robustness test using alternative estimation methods.
*, **, and *** indicate statistical significance at the 10, 5, and 1% levels, respectively. Standard errors are in parentheses.
5.4 Mechanism analysis
Baseline regression results indicate that the CEPZ policy positively affects UGDP. However, the mechanism through which CEPZ influences UGDP is not fully understood. Theoretical analyses suggest that CEPZ promotes urban green development by fostering green innovation and facilitating digital economic transformation. Therefore, this section examines how CEPZ impacts UGDP from two perspectives—urban green innovation and urban digital transformation—by constructing Equations 3, 4.
5.4.1 Urban green innovation
Urban green innovation is crucial for advancing green development. Green technological advancements enhance production efficiency and reduce environmental burdens (Baumann and Kritikos, 2016), thereby improving UGDP. To assess whether the CEPZ policy fosters urban green innovation, we use proxies such as green patent grants, green invention patent grants, and green utility model patent grants, conducting regression tests with Equation 3. The outcomes presented in columns (1) to (3) of Table 9 display coefficients that are significantly positive at the 1% level, indicating that CEPZ significantly promotes urban green innovation.
Table 9
Variable
(1)
(2)
(3)
GP
GI
GU
CEPZ
0.098***
0.021***
0.077***
(0.004)
(0.001)
(0.003)
Economic development
0.054***
0.013***
0.041***
(0.006)
(0.002)
(0.004)
Industrial structure
−0.079**
−0.020
−0.059**
(0.039)
(0.013)
(0.029)
Government expenditure
0.079***
0.024***
0.055***
(0.023)
(0.008)
(0.017)
Urbanization rate
0.402
−0.066
0.469
(1.936)
(0.640)
(1.470)
Marketization level
−0.009*
−0.004**
−0.005
(0.005)
(0.002)
(0.004)
City fixed effects
Yes
Yes
Yes
Year fixed effects
Yes
Yes
Yes
Cons
−0.004
0.001
−0.005
(0.040)
(0.013)
(0.030)
Sample size
2,429
2,429
2,429
R2
0.876
0.862
0.862
Mechanism analysis: urban green innovation.
*, **, and *** indicate statistical significance at the 10, 5, and 1% levels, respectively. Standard errors are in parentheses.
Additionally, Ren et al. (2022) lay stress on the essential role of green innovation in enhancing UGDP. CEPZ pilot cities leverage policy incentives to attract innovative elements like talent, information, technology, and capital, reducing green innovation costs and enhancing the city’s green innovation capabilities. CEPZs also optimize resource allocation and disseminate green technologies through e-commerce platforms, mitigating negative environmental externalities and promoting industrial upgrading (Yan et al., 2023), thereby contributing to urban green development. In summary, CEPZs elevate UGDP by fostering urban green innovation, supporting Hypothesis 2.
5.4.2 Urban digital transformation
Urban digital transformation is widely recognized as a key driver of urban green development performance (UGDP) (Hunjra et al., 2024). To examine whether the CEPZ policy promotes this transformation, we employ a mediation analysis framework. The degree of digital transformation is measured by analyzing the frequency of keywords related to digital technologies and smart manufacturing in municipal government work reports. Following Leng and Zhang (2024), we apply Python-based text analysis techniques, including text extraction, Jieba word segmentation, and word-frequency statistics, to compute the share of terms associated with digital technologies and intelligent systems in the total word count of each city’s government work reports over the period 2011–2021. These shares are used as proxies for urban digital development and are introduced into the regression model specified in Equation 4.
The regression results reported in columns (1)–(4) of Table 10 are positive and statistically significant at the 5 and 1% levels, indicating that the CEPZ policy exerts a significant promoting effect on urban digital development. A central feature of the CEPZ initiative is the establishment of the “six systems and two platforms,” which encourages local governments to strengthen digital infrastructure and interdepartmental coordination (Guo and Qiao, 2024), thus accelerating the pace of digital transformation. This progress supports the expansion of the digital economy, improves resource allocation efficiency, lowers transaction costs (Deng et al., 2022), facilitates industrial structure upgrading, and enhances green total factor productivity (Timmer and Szirmai, 2000), which in turn contributes to improved urban green development performance (UGDP) (Lv and Chen, 2024). These findings confirm Hypothesis 3.
Table 10
Variable
(1)
(2)
(3)
(4)
DC
DW
IC
IW
CEPZ
0.011**
0.023**
0.030***
0.062***
(0.005)
(0.010)
(0.004)
(0.008)
Economic development
0.040***
0.081***
0.037***
0.077***
(0.007)
(0.014)
(0.006)
(0.012)
Industrial structure
0.019
0.044
−0.021
−0.042
(0.045)
(0.095)
(0.037)
(0.077)
Government expenditure
0.123***
0.252***
0.067***
0.138***
(0.027)
(0.056)
(0.022)
(0.046)
Urbanization rate
6.577***
13.809***
8.481***
17.723***
(2.261)
(4.750)
(1.846)
(3.867)
Marketization level
0.082***
0.173***
0.048***
0.102***
(0.006)
(0.013)
(0.005)
(0.010)
City fixed effects
Yes
Yes
Yes
Yes
Year fixed effects
Yes
Yes
Yes
Yes
Cons
−0.163***
−0.341***
−0.141***
−0.294***
(0.047)
(0.098)
(0.038)
(0.080)
Sample size
2,388
2,388
2,388
2,388
R2
0.536
0.534
0.531
0.531
Mechanism analysis: urban digital transformation.
*, **, and *** indicate statistical significance at the 10, 5, and 1% levels, respectively. Standard errors are in parentheses.
5.5 Heterogeneity analysis
5.5.1 Location heterogeneity
Acknowledging the heterogeneous effect of the development of cross-border e-commerce between coastal and inland cities, this study follows Bo Li (2022) in classifying Chinese cities into coastal and inland regions based on the *China Marine Statistical Yearbook*. In order to look into the spatial heterogeneity of the impact of the CEPZ policy on UGDP, separate regression analyses are conducted for inland and coastal regions, with results presented in Table 11, columns (1) and (2). The results suggest that the CEPZ exerts a positive influence on UGDP in inland cities, whereas its effect on coastal cities is not significant, suggesting spatial heterogeneity in the policy’s effects.
Table 11
Variable
(1)
(2)
(3)
(4)
Coastal areas
Inland areas
Provincial capitals
Non-provincial capitals
CEPZ
0.005
0.014**
0.019***
−0.004
(0.005)
(0.006)
(0.006)
(0.006)
Economic development
0.041***
0.013
0.044***
0.021***
(0.009)
(0.008)
(0.017)
(0.006)
Industrial structure
0.040
0.039
0.457**
0.014
(0.041)
(0.240)
(0.199)
(0.041)
Government expenditure
0.187***
0.123**
0.006
0.163***
(0.027)
(0.053)
(0.159)
(0.024)
Urbanization rate
7.731***
18.067***
5.577
13.962***
(2.864)
(2.965)
(6.030)
(2.127)
Marketization level
0.044***
0.038***
0.022
0.047***
(0.007)
(0.010)
(0.024)
(0.006)
City fixed effects
Yes
Yes
Yes
Yes
Year fixed effects
Yes
Yes
Yes
Yes
Cons
0.774***
0.829***
0.381*
0.796***
(0.049)
(0.233)
(0.202)
(0.042)
Sample size
1,572
857
269
2,160
R2
0.714
0.730
0.692
0.724
Heterogeneity analysis.
*, **, and *** indicate statistical significance at the 10, 5, and 1% levels, respectively. Standard errors are in parentheses.
This outcome may be explained by several factors. Coastal cities have advantageous foreign trade locations and have developed mature industrial chains and logistics systems over years of openness. In contrast, inland regions have weaker foreign trade foundations. The CEPZ policy provides new development opportunities for inland cities, boosting the expansion of cross-border e-commerce, with the net export growth rates being among the top ones nationwide. Furthermore, most inland regions rely heavily on manufacturing. The CEPZ policy promotes emerging industries such as digital services through digital platform construction, advancing industrial upgrading in inland cities and enhancing their UGDP. Additionally, while coastal regions already have high economic and innovation levels, the CEPZ policy’s incentives and agglomeration effects provide inland cities with funding, talent, and technology to foster green innovation and digital transformation, thereby boosting UGDP in inland regions.
5.5.2 Administrative hierarchy heterogeneity
China’s urban administrative hierarchy significantly influences policy implementation (Wang and Yang, 2021; Chen and Groenewold, 2015). The capacity for fiscal resource allocation often constrains local governments in promoting urban green development (Tevapitak and Helmsing, 2019). Generally, cities with higher administrative levels possess greater policy incentives and fiscal allocation capabilities. To investigate whether urban administrative hierarchy affects the effectiveness of the CEPZ, this study classifies prefecture-level cities into provincial capitals (high administrative level) and non-provincial capitals (lower administrative level) for regression analysis. Columns (3) and (4) of Table 11 present the results. The results suggest that the CEPZ policy has a significantly positive impact on UGDP in provincial capitals, while its effect on non-provincial capitals is not significant.
Potential explanations involve the benefits that cities of a higher administrative level possess in terms of fiscal capacity and resource aggregation (Jiang et al., 2018), enabling them to access more preferential policies from higher-level governments, direct resource allocation, and concentrate local resources (Gao et al., 2022). Consequently, during the implementation of the CEPZ policy, provincial capitals can secure more financial subsidies and policy incentives than non-provincial capitals. Additionally, provincial capitals typically exhibit higher levels of economic development. By leveraging agglomeration and siphon effects, they reduce urban production costs and enhance green innovation capabilities. As a result, the CEPZ policy exerts a more significant effect on enhancing UGDP in provincial capitals.
6 Conclusion and policy implications
6.1 Research conclusion
The objective of the CEPZ policy is to cultivate the growth of cross-border e-commerce and digital trade. This is accomplished by refining digital trade operations and capitalizing on the green economic effects of e-commerce for the purpose of enhancing UGDP. This study examines the institutional background and theoretical basis of the CEPZ policy, using panel data from 293 Chinese prefecture-level cities from 2011 to 2021. A DID model is constructed to evaluate the policy’s impact on UGDP, as well as the underlying mechanisms and heterogeneity of these effects.
The principal findings are presented below:
A significant positive correlation exists between the CEPZ policy and UGDP, and this result remains robust after various robustness checks.
Mechanism analysis indicates that CEPZ enhances UGDP by promoting urban green innovation and accelerating digital transformation.
The policy effects vary due to regional and administrative differences. Specifically, the CEPZ policy exerts a more conspicuous impact on UGDP in inland areas compared to coastal regions, highlighting its role in advancing green development in inland cities. Additionally, the policy significantly boosts UGDP in provincial capitals but has a less significant effect in non-provincial capitals. Higher administrative-level cities attract more funding, talent, and policy support, making the CEPZ policy’s contribution to UGDP more evident in these cities.
6.2 Policy implications
Drawing from the analysis and deductions, this study presents the following policy-related advice to Optimize the policies related to cross-border e-commerce to promote the green development of cities.
Expand CEPZ Coverage Nationwide to Boost Urban Green Development.
Currently, only 35.8% of cities are included in the CEPZ policy. Given the positive impact of CEPZ on UGDP, it is advisable for governments at all levels to promote high-quality CEPZ development. The central government could clarify selection criteria for pilot cities, establish comprehensive requirements for CEPZ designation, and incrementally increase the number of pilot cities. Additionally, replicating and promoting experiences from earlier CEPZ implementations nationwide may speed up the growth of cross-border e-commerce. Local governments might implement policies related to tax reduction, talent attraction, and infrastructure development within CEPZs to create a supportive environment.
Enhance Urban Green Innovation and Promote Digital Transformation.
Since urban green innovation and digital transformation can amplify the effects of CEPZ on UGDP, governments could intensify financial support and strengthen patent protection. By fostering an environment conducive to innovation, the capabilities and motivation of enterprises and research institutions to engage in green innovation may be enhanced. Policy guidance could increase investment in digital infrastructure and reinforce support for green innovation, establishing a comprehensive system for digital and green innovation development.
Tailor development strategies to individual cities to optimize CEPZ policy outcomes
The effectiveness of CEPZ policies varies due to differences in urban characteristics. Governments might consider increasing support for CEPZs in central and western regions by providing preferential treatment and prioritizing infrastructure and funding needs for cross-border e-commerce. Addressing resource shortages in non-provincial capitals, such as funding and talent, may prevent disparities in green development due to policy implementation. Furthermore, pilot cities could align development strategies with their specific stages of urban development, focusing on strengthening economic foundations, accelerating energy structure transformation, and promoting industrial upgrading while considering local resource endowments and policy environments to advance urban green development goals.
Whilst this study presents a comprehensive analysis of how the CEPZ policies affect UGDP, it is subject to particular limitations. Firstly, the research focuses exclusively on the overall effects of the CEPZ pilot initiatives, due to the diverse and complex nature of cross-border e-commerce development, which may not fully capture the specific policies implemented in each pilot city. Second, limited data availability prevented the inclusion of all negative outcomes, such as the effects of industrial growth on urban groundwater quality. Future research should aim to refine and incorporate more extensive indicators for measuring UGDP, allowing for a more precise assessment of how CEPZ pilot policies influence UGDP.
Statements
Data availability statement
The data analyzed in this study is subject to the following licenses/restrictions: The data that support the findings of this study are available on request from the corresponding author, HW, upon reasonable request. Requests to access these datasets should be directed to HW, wangheng@snnu.edu.cn.
Author contributions
HW: Conceptualization, Data curation, Writing – original draft. YW: Methodology, Writing – original draft. FZ: Formal analysis, Project administration, Software, Writing – original draft. JX: Supervision, Validation, Writing – original draft. XD: Supervision, Validation, Visualization, Writing – review & editing.
Funding
The author(s) declared that financial support was received for this work and/or its publication. The work was supported by the “National Social Science Foundation of China (22BGL195)”.
Conflict of interest
The author(s) declared that this work was conducted in the absence of any commercial or financial relationships that could be construed as a potential conflict of interest.
Generative AI statement
The author(s) declared that Generative AI was not used in the creation of this manuscript.
Any alternative text (alt text) provided alongside figures in this article has been generated by Frontiers with the support of artificial intelligence and reasonable efforts have been made to ensure accuracy, including review by the authors wherever possible. If you identify any issues, please contact us.
Publisher’s note
All claims expressed in this article are solely those of the authors and do not necessarily represent those of their affiliated organizations, or those of the publisher, the editors and the reviewers. Any product that may be evaluated in this article, or claim that may be made by its manufacturer, is not guaranteed or endorsed by the publisher.
AlcácerJ.CantwellJ.PiscitelloL. (2016). Internationalization in the information age: a new era for places, firms, and international business networks?J. Int. Bus. Stud.47, 499–512. doi: 10.1057/jibs.2016.22
BartlettD.TrifilovaA. (2010). Green technology and eco-innovation: seven case-studies from a Russian manufacturing context. J. Manuf. Technol. Manag.21, 910–929. doi: 10.1108/17410381011086757
BattistiL.AimarF.GiaccoG.DevecchiM. (2023). Urban green development and resilient cities: a first insight into urban forest planning in Italy. Sustainability15:12085. doi: 10.3390/su151512085
BaumannJ.KritikosA. S. (2016). The link between R&D, innovation and productivity: are micro firms different?Res. Policy45, 1263–1274. doi: 10.1016/j.respol.2016.03.008
BertrandM.DufloE.MullainathanS. (2004). How much should we trust differences-in-differences estimates?Q. J. Econ.119, 249–275. doi: 10.1162/003355304772839588
CallawayB.Sant’AnnaP. H. (2021). Difference-in-differences with multiple time periods. Journal of Econometrics, 225, 200–230. doi: 10.1016/j.jeconom.2020.12.001
CaoX.DengM.LiH. (2021). How does e-commerce city pilot improve green total factor productivity? Evidence from 230 cities in China. J. Environ. Manag.289:112520. doi: 10.1016/j.jenvman.2021.112520,
CharfeddineL.MrabetZ. (2017). The impact of economic development and social-political factors on ecological footprint: a panel data analysis for 15 MENA countries. Renew. Sust. Energ. Rev.76, 138–154. doi: 10.1016/j.rser.2017.03.031
ChenS.XunZ.HaitaaY.YaL. (2020). Did Chinese cities that implemented driving restrictions see reductions in pm10?Transp. Res. Part D Transp. Environ.79:102208. doi: 10.1016/j.trd.2019.102208
ChenJ. (2023). Mitigating nitrogen dioxide air pollution: the roles and effect of national smart city pilots in China. Energy263:125652. doi: 10.1016/j.energy.2022.125652
ChenY.ChenS.MiaoJ. (2024). Does smart city pilot improve urban green economic efficiency: accelerator or inhibitor. Environ. Impact Assess. Rev.104:107328. doi: 10.1016/j.eiar.2023.107328
ChenP.DagestaniA. A. (2023). Urban planning policy and clean energy development harmony – evidence from smart city pilot policy in China. Renew. Energy210, 251–257. doi: 10.1016/j.renene.2023.04.063
ChengZ.JinW. (2022). Agglomeration economy and the growth of green total-factor productivity in Chinese industry. Socio Econ. Plan. Sci.83:101003. doi: 10.1016/j.seps.2020.101003
DengH.BaiG.ShenZ.XiaL. (2022). Digital economy and its spatial effect on green productivity gains in manufacturing: evidence from China. J. Clean. Prod.378:134539. doi: 10.1016/j.jclepro.2022.134539
DiC.LiangL.JingS.HanY.GengZ.ChuC. (2021). Energy supply efficiency evaluation of integrated energy systems using novel SBM-DEA integrating Monte Carlo. Energy231:120834. doi: 10.1016/j.energy.2021.120834
DongK.YangS.WangJ. (2023). How digital economy lead to low-carbon development in China? The case of e-commerce city pilot reform. J. Clean. Prod.391:136177. doi: 10.1016/j.jclepro.2023.136177
EliaS.GiuffridaM.MarianiM. M.BrescianiS. (2021). Resources and digital export: an RBV perspective on the role of digital technologies and capabilities in cross-border e-commerce. J. Bus. Res.132, 158–169. doi: 10.1016/j.jbusres.2021.04.010
GuoD.QiaoL. (2024). Government environmental concern and urban green development efficiency: structural and technological perspectives. J. Clean. Prod.450:142016. doi: 10.1016/j.jclepro.2024.142016
HunjraA. I.ZhaoS.GoodellJ. W.LiuX. (2024). Digital economy policy and corporate low-carbon innovation: evidence from a quasi-natural experiment in China. Financ. Res. Lett.60:104910. doi: 10.1016/j.frl.2023.104910
IshidaH. (2015). The effect of ICT development on economic growth and energy consumption in Japan. Telemat. Inform.32, 79–88. doi: 10.1016/j.tele.2014.04.003
JiangT.SunK.NieH. (2018). Administrative rank, total factor productivity and resource misallocation in Chinese cities. J. Manage. World34:14. doi: 10.19744/j.cnki.11-1235/f.2018.03.004
KiratY.ProdromouT.SuardiS. (2024). Unveiling the nexus: climate change, green innovation, and the pendulum of energy consumption and carbon emissions. Energy Econ.138:107727. doi: 10.1016/j.eneco.2024.107727
LengA.ZhangY. (2024). The effect of enterprise digital transformation on audit efficiency—evidence from China. Technol. Forecast. Soc. Change201:123215. doi: 10.1016/j.techfore.2024.123215
LiY. (2024). How does digital trade impact urban carbon emissions efficiency? Evidence from China’s cross-border e-commerce pilot zones. J. Clean. Prod.456:142363. doi: 10.1016/j.jclepro.2024.142363
LiB.HanY.WangC.SunW. (2022). Did civilized city policy improve energy efficiency of resource-based cities? Prefecture-level evidence from China. Energy Policy167:113081. doi: 10.1016/j.enpol.2022.113081
LiaoB.LiL. (2022). Spatial division of labor, specialization of green technology innovation process and urban coordinated green development: evidence from China. Sustain. Cities Soc.80:103778. doi: 10.1016/j.scs.2022.103778
LvL.ChenY. (2024). The collision of digital and green: digital transformation and green economic efficiency. J. Environ. Manag.351:119906. doi: 10.1016/j.jenvman.2023.119906,
MaS.LinY.PanG. (2021). Does cross-border e-commerce contribute to the growth convergence? An analysis based on Chinese provincial panel data[J/OL]. J. Glob. Inf. Manag.29, 86–111. doi: 10.4018/JGIM.20210901
QiS.ChengS.CuiJ. (2021). Environmental and economic effects of China’s carbon market pilots: empirical evidence based on a did model. J. Clean. Prod.279:123720. doi: 10.1016/j.jclepro.2020.123720
RenS.HaoY.WuH. (2022). The role of outward foreign direct investment (OFDI) on green total factor energy efficiency: does institutional quality matters? Evidence from China. Resour. Policy76:102587. doi: 10.1016/j.resourpol.2022.102587
TevapitakK.HelmsingA. H. J. (2019). The interaction between local governments and stakeholders in environmental management: the case of water pollution by SMES in Thailand. J. Environ. Manag.247, 840–848. doi: 10.1016/j.jenvman.2019.06.097,
ToneK. (2001). A slacks-based measure of efficiency in data envelopment analysis. European Journal of Operational Research, 130, 498–509. doi: 10.1016/S0377-2217(99)00407-5
UlucakR.ApergisN. (2018). Does convergence really matter for the environment? An application based on club convergence and on the ecological footprint concept for the EU countries. Environ. Sci. Pol.80, 21–27. doi: 10.1016/j.envsci.2017.11.002
WangH.FangL.MaoH.ChenS. (2022). Can e-commerce alleviate agricultural non-point source pollution? — a quasi-natural experiment based on a China’s e-commerce demonstration city. Sci. Total Environ.846:157423. doi: 10.1016/j.scitotenv.2022.157423,
WangQ.HuA.TianZ. (2022). Digital transformation and electricity consumption: evidence from the broadband China pilot policy. Energy Econ.115:106346. doi: 10.1016/j.eneco.2022.106346
WangY.SunX.GuoX. (2019). Environmental regulation and green productivity growth: empirical evidence on the porter hypothesis from OECD industrial sectors. Energy Policy132, 611–619. doi: 10.1016/j.enpol.2019.06.016
WangS.YangD. (2021). Policy experimentation in China: the political economy of policy learning. SSRN Electron. J. 133, 2180–2228. doi: 10.2139/ssrn.3949212
WangQ.YiH. (2021). New energy demonstration program and China’s urban green economic growth: do regional characteristics make a difference?Energy Policy151:112161. doi: 10.1016/j.enpol.2021.112161
WeiX.JiangF.YangL. (2023). Does digital dividend matter in China’s green low-carbon development: environmental impact assessment of the big data comprehensive pilot zones policy. Environ. Impact Assess. Rev.101:107143. doi: 10.1016/j.eiar.2023.107143
WuH.HaoY.RenS.YangX.XieG. (2021). Does internet development improve green total factor energy efficiency? Evidence from China. Energy Policy153:112247. doi: 10.1016/j.enpol.2021.112247
XiaR.WeiD.JiangH.DingY.LuoX.YinJ. (2024). Research on the coordinated development and convergence characteristics of China’s urban competitiveness and green total factor productivity. Ecol. Indic.161:111954. doi: 10.1016/j.ecolind.2024.111954
YanZ.SunZ.ShiR.ZhaoM. (2023). Smart city and green development: empirical evidence from the perspective of green technological innovation. Technol. Forecast. Soc. Change191:122507. doi: 10.1016/j.techfore.2023.122507
YuZ.XieW.GuoJ.YangZ. (2024). Green effect of energy transition policy: a quasi-natural experiment based on new energy demonstration cities. Financ. Res. Lett.66:105669. doi: 10.1016/j.frl.2024.105669
YuanC.ShangM.HanZ.WangJ. (2024). Research on the impact of the national ecological demonstration zone on green total factor productivity: evidence from China. J. Environ. Manag.356:120421. doi: 10.1016/j.jenvman.2024.120421,
ZhangX.HanL.WeiH.TanX.ZhouW.LiW.et al. (2022). Linking urbanization and air quality together: a review and a perspective on the future sustainable urban development. J. Clean. Prod.346:130988. doi: 10.1016/j.jclepro.2022.130988
ZhangY.RanC. (2023). Effect of digital economy on air pollution in China? New evidence from the “national big data comprehensive pilot area” policy. Econ. Anal. Policy79, 986–1004. doi: 10.1016/j.eap.2023.07.007
ZhangR.YingW.WuK.SunH. (2024). The impact of innovative human capital agglomeration on urban green development efficiency: based on panel data of 278 cities in China. Sustain. Cities Soc.111:105566. doi: 10.1016/j.scs.2024.105566
ZhouL. (2024). Clean air policy and green total factor productivity: evidence from Chinese prefecture-level cities. Energy Econ.133:107512. doi: 10.1016/j.eneco.2024.107512
cross-border e-commerce pilot zones (CEPZ), DID model, digital transformation, green innovation, urban green development performance (UGDP)
Citation
Wang H, Wang Y, Zhang F, Xiong J and Ding X (2026) Impact of cross-border e-commerce policy on urban green development performance: evidence from prefecture-level cities in China. Front. Sustain. Cities 8:1670955. doi: 10.3389/frsc.2026.1670955
This is an open-access article distributed under the terms of the Creative Commons Attribution License (CC BY). The use, distribution or reproduction in other forums is permitted, provided the original author(s) and the copyright owner(s) are credited and that the original publication in this journal is cited, in accordance with accepted academic practice. No use, distribution or reproduction is permitted which does not comply with these terms.
All claims expressed in this article are solely those of the authors and do not necessarily represent those of their affiliated organizations, or those of the publisher, the editors and the reviewers. Any product that may be evaluated in this article or claim that may be made by its manufacturer is not guaranteed or endorsed by the publisher.