Abstract
Despite having a significant socio-economic impact on a country’s growth, one of the biggest contributors to waste generation is the construction sector, thus increasing the necessity for innovative construction waste management strategies. Lean Construction (LC) is a much-adopted methodology that helps manage construction waste efficiently. This study investigates the barriers to LC implementation in the UAE’s building construction sector, with a specific focus on its potential for effective construction waste management. Recognizing the urgent need to adopt sustainable practices in the face of escalating environmental concerns, the study employs a quantitative exploratory approach combining literature synthesis, expert validation, descriptive statistical analysis, Relative Importance Index (RII) ranking, and Partial Least Squares Structural Equation Modeling (PLS-SEM) to examine stakeholder perceptions across eight critical categories: Knowledge/Awareness, Attitude, Management, Government, Financial, Material/Resource, Technical, and Other contextual factors. The RII analysis ranks these barriers based on stakeholder responses, while the PLS-SEM approach models the strength and significance of their interrelationships within a validated structural framework. The findings reveal that while all eight categories significantly influence stakeholder perceptions, Attitude and Management factors exhibit the strongest impact, highlighting the importance of behavioral and organizational readiness in enabling LC adoption. The key deliverable of this research is a validated and empirically supported structural model that provides a strategic roadmap for overcoming resistance to LC implementation. By offering actionable insights into which barriers matter most and how they interact, the study equips policymakers, contractors, and industry stakeholders with evidence-based guidance to design targeted interventions. Ultimately, this research contributes to the growing discourse on sustainable construction by positioning LC as a viable pathway for reducing construction waste and improving efficiency in the UAE context.
1 Introduction
The construction industry is crucial for the socio-economic development of a nation as it significantly helps improve its residents’ standards of living by providing fundamental and enhanced infrastructure, such as roads, hospitals, schools and others. However, this industry is also one of the most significant contributors toward waste, thus, also affecting the need for new and innovative methods of effective waste management.
In this regard, the construction industry is held accountable for its various unsustainable practices including the use of non-renewable resources, the production of waste, energy and water consumption, and pollution, the most detrimental being the construction waste generation (Sadi et al., 2012). The United States Environmental Protection Agency (EPA) (US EPA-OLEM, 2016) defines construction and demolition (C&D) waste as the waste produced during the construction, refurbishment, and destruction of buildings, roads, and bridges. It contains a wide variety of materials such as concrete, bricks, wood, glass, metals, plastic, dust and more.
As per an article by British Broadcasting Corporation (BBC) (Miller, 2021), a third of the world’s waste and at least 40% of its carbon dioxide emissions are estimated to come from the construction sector. Further, according to the EPA’s (US EPA-OLEM, 2016) 2018 waste characterization report, the United States generated 600 million tons of construction and demolition waste in 2018, which was more than twice that of municipal solid waste. Likewise, in 2020, more than 37% of all waste produced in the European Union came from C&D operations (Statista, 2021).
Additionally, in the United Arab Emirates (UAE), the waste generated from the construction industry accounts for the largest share of the total waste produced in the country. In 2021, the Emirate of Abu Dhabi alone produced about 10.4 million tons of solid waste, of which, 37% of the non-hazardous solid waste was solely from the C&D sector (Environmental Environmental Agency—Abu Dhabi, 2022). Similarly, with an estimated 77 million metric tons produced in 2022, construction waste was, by far, the most prevalent kind of waste produced in Dubai (Saleh, 2023). Consequently, a significant amount of collected waste, including those from the C&D industry, eventually ends up in dumps or landfills outside of major cities. These landfills or dumpsites might not be designed to handle the greenhouse gas (GHG) emissions, waste sludge, odor, and soil and water contamination that follow, hence, leading to disastrous consequences on the environment and human health. Thus, in light of these increasing threats posed by the C&D waste, implementation of new and effective construction waste management approaches is of utmost importance. The Lean Construction (LC) approach is one such method.
Furthermore, the adoption of LC aligns closely with the United Nations Sustainable Development Goals (SDGs), particularly SDG 11 (Sustainable Cities and Communities) and SDG 12 (Responsible Consumption and Production) (United Nations, 2015). By promoting process efficiency, minimizing resource waste, and optimizing material flow throughout the project lifecycle, LC contributes directly to sustainable urban development and responsible production practices. Within the UAE’s construction context, where waste minimization is a key national priority, enhancing LC adoption supports not only operational efficiency but also the broader transition toward sustainable and circular built-environment practices.
While LC has demonstrated strong global uptake in countries such as the United Kingdom, United States, among others, driven by advanced procurement systems, robust training ecosystems, and integrated project delivery models, its application within the distinct regulatory and industrial environment of the UAE remains relatively limited. Despite the UAE’s strategic emphasis on sustainability through initiatives such as Vision 2030 and Net Zero by 2050, LC has not yet been widely institutionalized within mainstream construction practices. The UAE’s construction sector presents a unique set of challenges. These contextual differences limit the direct transferability of global LC solutions and necessitate locally grounded research. Moreover, although international literature emphasizes LC’s benefits for waste reduction, empirical studies investigating how UAE stakeholders perceive its barriers and applicability are scarce, especially using quantitative frameworks. This study addresses this gap by exploring how key organizational, managerial, and contextual factors influence perceptions of LC implementation in the UAE’s building sector, using a structural modeling approach to uncover patterns unique to this regional context. Accordingly, this study seeks to answer the following research questions:
What are the main barriers to implementation of LC methodologies for waste management in the UAE building construction sector, and how are these barriers associated with specific construction and Lean waste types across project phases?
How do stakeholders in the UAE’s building construction sector perceive these barriers, and which of these barriers exert the most significant influence on their perceptions of LC adoption?
What are the most commonly found construction waste types in the UAE building construction sector, and how do stakeholder-perceived barriers translate into construction waste generation patterns across different construction project phases?
To address this, a dual-method approach was adopted, integrating Partial Least Squares Structural Equation Modeling (PLS-SEM) and Relative Importance Index (RII) techniques to quantify both conceptual influences and practical waste manifestations. This enables a systems-level understanding of how various factors interact to shape LC implementation and its impact on waste management outcomes.
2 Literature review
2.1 Lean construction
2.1.1 Origin
The term “Lean” was originally used in 1988 to refer to the management concept of lean manufacturing, which has its roots in Toyota’s manufacturing System of the 1930s (Howell and Ballard, 1998). With its origins in the lean production system, LC emerged in the early 1990s by approaching the building process from three angles: transformation, flow, and value. Figure 1 gives an overview of the development of the “Lean Construction (LC)” concept over the years.
Figure 1
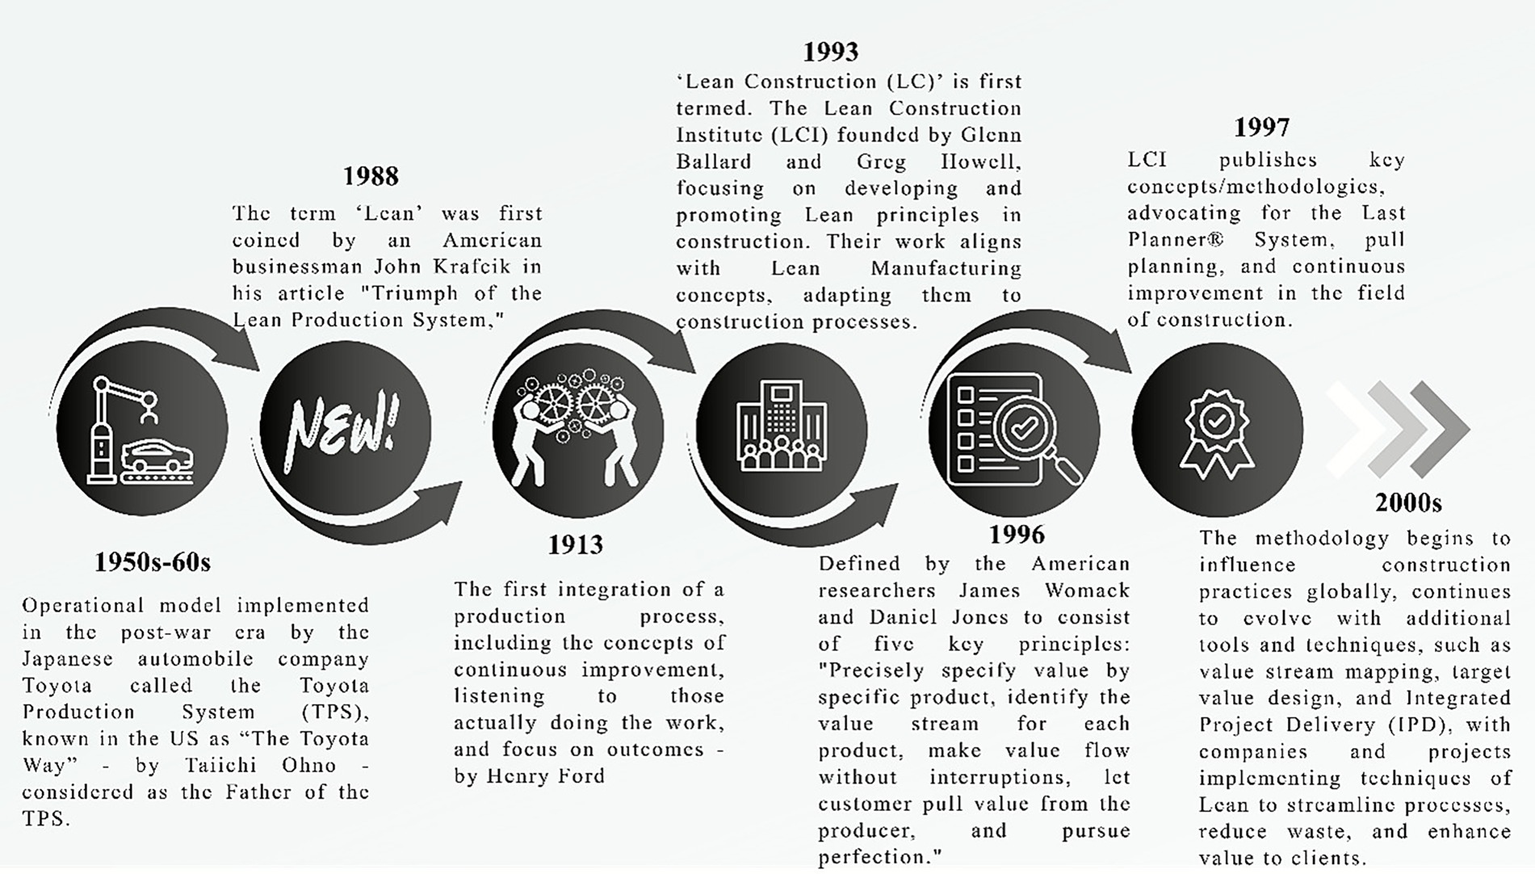
Development of “Lean Construction (LC)” concept over the years.
The idea of lean thinking and its benefits are realized through the adherence to five fundamental principles of lean production (Eskander and Hafez, 2013):
-
The first principle involves specifying the customer’s value, which requires a thorough understanding and identification of the client’s wants, focusing solely on what the client desires.
-
The second principle is understanding the value stream, which refers to the sequence of actions that, when executed correctly and in the right order, result in the product or service that the client values. Activities are categorized as superfluous and wasteful (which should be eliminated), supporting value-adding activities (which should be minimized as much as possible), and client value-adding (which should be continuously enhanced).
-
The third principle is about improving the flow of work to ensure it is consistent and uninterrupted from one value-adding or supporting activity to the next. This flow significantly accelerates processing, and all efforts should be made to eliminate obstructions and bottlenecks that impede this flow.
-
The fourth principle involves implementing a pull strategy to respond to client demand. Unlike non-lean businesses where work is pushed, resulting in the creation of unneeded outputs, most lean services respond to consumer demand and thus pull work through the system.
-
The fifth and final principle is perfection. Based on the previous four principles, organizations should strive to gain a deeper understanding of the system and provide recommendations for further improvement. An excellent process delivers just the right amount of value to the client. In an ideal process, each stage is value-adding, capable (produces a good outcome every time), available (produces the intended output, not just the desired quality, every time), adequate (does not cause delay), adaptable, and linked by continuous flow. If any of these elements fail, some waste is inevitably generated.
2.1.2 Suitability of lean principles for the construction industry
The primary objective of implementing Lean ideas in the construction industry is to eliminate the significant waste from its materials, processes, and workflows (Aslam et al., 2020). LC employs a suite of tools designed to identify and systematically reduce waste across various domains, including time, inventory, space, labor, equipment, and money. This approach ultimately enhances quality while reducing both production time and costs. Traditionally, sustainable construction efforts have prioritized the building’s operational performance, often overlooking the waste generated during the construction process itself. Nonetheless, integrating Lean thinking into construction practices offers the potential to substantially boost productivity and minimize waste generation. By focusing on adding value and eliminating inefficiencies, Lean promotes continuous and incremental improvements in both processes and outcomes (Waite, 2020).
Moreover, the construction industry encompasses a wide range of core activities, such as regulation, design, planning, production, construction, and maintenance. However, the complexity of these activities—marked by fragmented responsibilities and poorly defined interactions—often obscures a clear understanding of the industry’s structure and the challenges it faces (Hughes et al., 2015). The sector is often characterized by low productivity, cost overruns, delayed schedules, flaws, a bad reputation, insufficient safety precautions, and a scarcity of competent workers (Thomassen and Andreas, 2004). Additionally, the sector exhibits distinct characteristics that set it apart from other industries—the physical nature of its products, on-site project execution on the client’s premises, the uniqueness of most designs, the division of design and construction phases, the sequential nature of construction processes, and the pricing mechanisms used. These factors collectively contribute to the unique challenges and opportunities for improvement within the construction industry.
2.1.3 Application of lean principles in construction
As previously mentioned, LC is the constant process of eliminating waste, meeting or exceeding all client needs, focusing on the full value stream, and striving for perfection in the execution of building projects (Diekmann et al., 2004). To create a lean workplace, construction could implement a set of lean concepts and best practices, including customer focus, culture/people, workplace standardization, waste elimination, and continuous improvement/built-in quality.
Lean concepts have been introduced into the construction industry in various nations, including Australia, Brazil, Denmark, Ecuador, the UK, the USA Peru, and Finland (Fernández-Solís, 2008). However, transitioning to Lean is not a quick or isolated process; it involves a fundamental transformation of the entire organization. Lean is not merely a set of tools or rules—it is a shared philosophy and behavioral system that must be integrated throughout the value chain. Achieving Lean requires a long-term commitment to cultural and operational change.
Given the complex, dynamic, and often unpredictable nature of construction projects, Lean principles must be contextually understood and applied. This necessitates a deep understanding of the construction system as an interdependent network of processes and stakeholders (Diekmann et al., 2004). Lewis (2000) emphasized that while Lean offers significant benefits, its success in implementation heavily depends on the organizational context and prevailing culture.
Accordingly, the tenets of lean thinking in construction can be encapsulated into these key points (Xue et al., 2014). First and foremost, it emphasizes decreasing the shares of non-value-adding activities. This is followed by increasing the value of output by providing systematic configurations that cater to the needs of the customer. It also focuses on decreasing the variability that may occur in the process. Simplifying the different number of steps and parts is another crucial aspect. Furthermore, it aims at increasing the flexibility of output and enhancing the transparency of the process. Concentrating on the completion of the process is another significant point. It also underscores the importance of providing continuous improvements in the process and maintaining a balance between flow and conversion improvement. Lastly, establishing a benchmark is an integral part of these principles. These points collectively form the foundation of lean thinking.
Furthermore, the application of a lean system offers a multitude of benefits to companies (Abo-Zeid and Othman, 2018; Aslam et al., 2024). It enables a significant reduction in waste, cuts production costs, allows for a decrease in manufacturing cycle times while simultaneously reducing labor and maintaining or even increasing throughput. Furthermore, it aids in reducing inventory, which in turn increases customer service levels. The capacity in current facilities can be increased through the implementation of this system. It also plays a crucial role in improving quality and increasing profits. The system’s flexibility is enhanced, allowing it to react swiftly to changes in requirements. It also helps in creating a better strategic focus. Lastly, it improves cash flow by increasing shipping and billing frequencies. Thus, lean production methods provide a comprehensive solution for enhancing operational efficiency and profitability.
2.1.4 Lean tools for prevention and/or reduction of waste
Lean waste refers to any activity or element that adds cost without delivering value to the product or the end customer (Klein et al., 2020). In this context, eight classic categories of waste have been identified: transportation, motion, overproduction, inventory, waiting, over-processing, defects, and underutilized talent. A critical step in progressing toward a more efficient and leaner organizational state is the identification of the most prevalent or most detrimental forms of waste that should be addressed first. Furthermore, for successful Lean implementation, organizations must systematically identify, evaluate, and prioritize these waste types, focusing initially on those that offer the greatest potential for rapid improvement or quick, visible gains in productivity. The eight lean waste types are listed in Table 1 along with their respective description.
Table 1
| Sl. no. | Categories | Description | References |
|---|---|---|---|
| 1. | Overproduction | Occurs when a product, service, or element is made before it is asked for or required. | Nikakhtar et al., (2015), Klein et al. (2020), Maraqa et al. (2021), Maraqa et al. (2023), and Graham (2024) |
| 2. | Waiting | Occurs when workers are waiting for material, machine maintenance, programs, or equipment which results in time loss. | Nikakhtar et al. (2015), Bajjou and Chafi (2019), Klein et al. (2020), Maraqa et al. (2021), and Graham (2024) |
| 3. | Transportation | Involves the movement of people, goods, tools, inventory, equipment, or products further than necessary or moved around. | Nikakhtar et al. (2015), Klein et al. (2020), Maraqa et al. (2021), Maraqa et al. (2023), and Graham (2024) |
| 4. | Overprocessing | Occurs in situations where more work or steps than necessary are made, or more components than required are included in the process resulting in overly complex systems. | Klein et al. (2020), Maraqa et al. (2021), Maraqa et al. (2023), and Graham (2024) |
| 5. | Inventory | Excess of inventory or more than necessary to sustain a steady flow of work tends to increase lead time and needs of space, it also becomes more difficult the identify the problems and communicate. | Al-Hajj and Hamani (2011), Nikakhtar et al. (2015), Klein et al. (2020), Maraqa et al. (2021), Maraqa et al. (2023), and Graham (2024) |
| 6. | Motion | Includes any unnecessary movement of staff, equipment, or machinery. | Klein et al. (2020), Maraqa et al. (2021), Maraqa et al. (2023), and Graham (2024) |
| 7. | Defects | Occurs when final products or services are not fit for use, which incurs direct costs and reworking. Defects indicate clear opportunities to improve procedures. | Al-Hajj and Hamani (2011), Nikakhtar et al. (2015), Bajjou and Chafi (2019), Klein et al. (2020), Maraqa et al. (2021), and Graham (2024) |
| 8. | Underutilized talent | Not fully utilizing the skills, knowledge, and capabilities of workers and project teams can lead to inefficiencies and waste. | Al-Hajj and Hamani (2011), Bajjou and Chafi (2019), Klein et al. (2020), and Maraqa et al. (2021) |
Lean-type waste and their descriptions.
Several Lean strategies play a vital role in preventing/reducing waste within construction projects (Xue et al., 2014):
-
Process Analysis is a well-known tool for waste reduction in building projects. Each organization has its criteria and standards, which results in a unique type of process and analysis for its initiatives. This tool is essential for defining project objectives clearly and systematically, allowing teams to analyze workflows and pinpoint inefficiencies that contribute to waste.
-
Pull Technique is another effective Lean strategy, which ensures that materials and resources are delivered to the construction site only as needed, based on project demands and timelines. Proper implementation of this technique enhances planning accuracy, reduces excess inventory, and eliminates unnecessary handling—thereby cutting waste and improving overall workflow efficiency.
-
Mistake-proofing techniques is a proactive approach that improves project quality by preventing errors before they occur. It helps minimize rework, reduce delays, and ensure consistency in performance. By limiting the likelihood and consequences of errors in both products and processes, mistake-proofing significantly contributes to waste reduction and productivity gains.
In addition, there are numerous other Lean tools available, each supported by structured guidelines for adoption. Among the most prominent are 5S, Plan Do Check Act (PDCA), Continuous Improvement Cycle (CIP), and Kaizen. These methodologies share common philosophical principles, emphasizing iterative cycles and continuous improvement. These also require a bidirectional flow of information—communicating management goals and decisions while incorporating feedback from frontline personnel. This feedback loop enables teams to align improvements with organizational objectives and fosters a culture of proactive problem-solving. 5S, PDCA, CIP and Kaizen are depicted in Figure 2 (Waite, 2020) to show their underlying philosophies of iterative and cyclical processes seeking continual improvement.
Figure 2
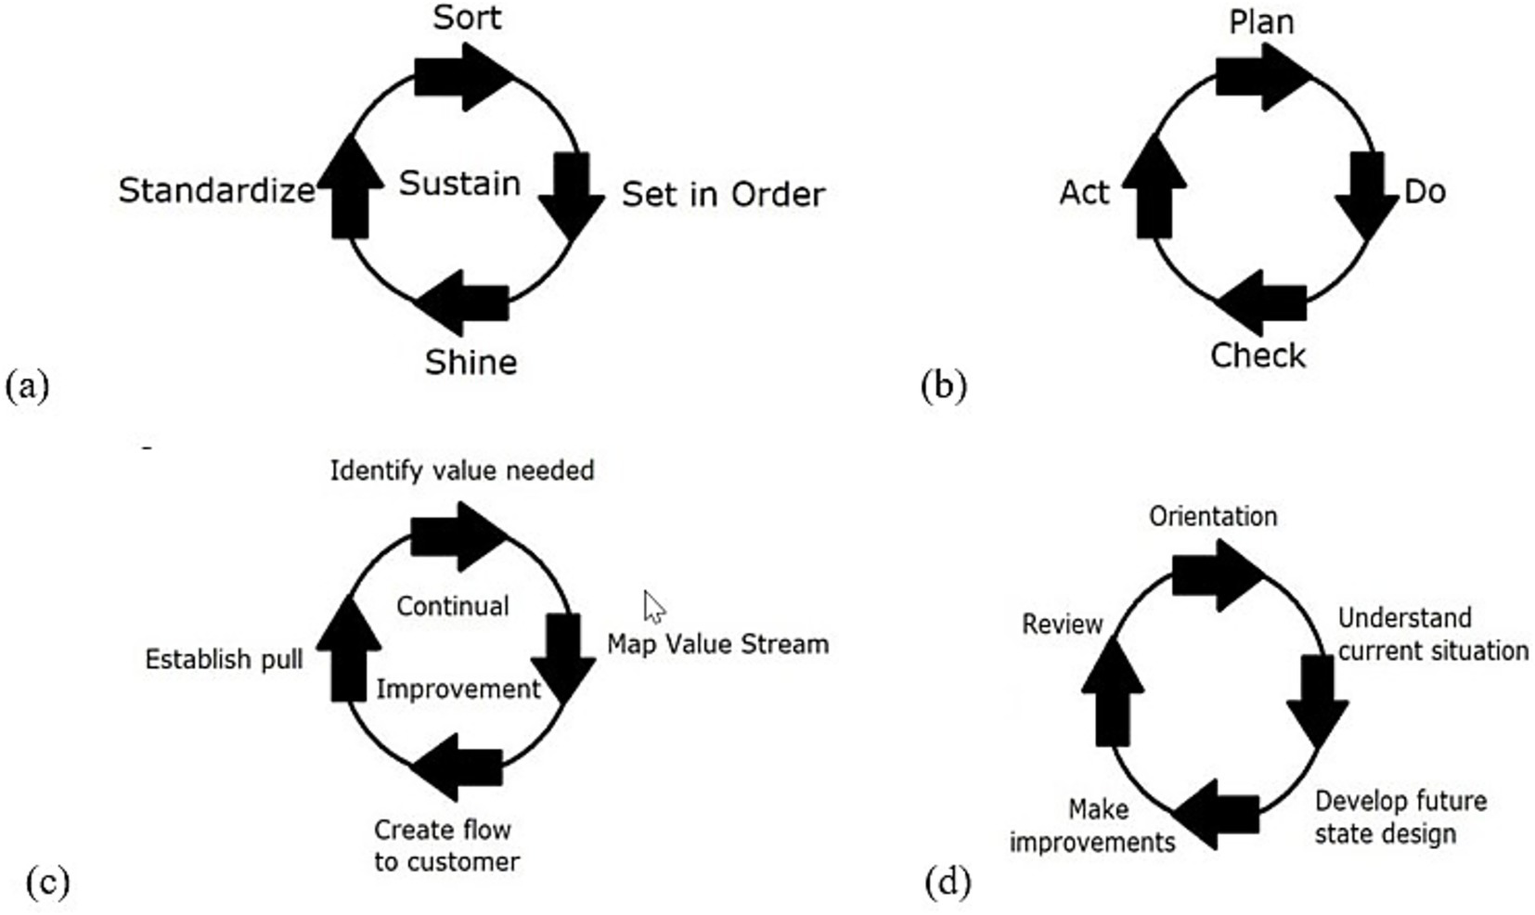
(a) 5S, (b) PDCA, (c) CIP, and (d) Kaizen. Source: Waite (2020).
Ultimately, the value of Lean lies not in the mechanical application of tools, but in embracing its core strategies of waste elimination, transparent communication, and relentless pursuit of improvement.
2.2 Impact of lean construction on construction waste management
A number of literatures point to the fact that LC is highly beneficial in the reduction of waste produced during the life of a construction project, right from its inception to even after its demolition. This section briefly looks through some of these literatures.
To begin with, a case study carried out by Nowotarski et al. (2019) present the benefits of LC toward waste reduction at an office building construction site. Lean Management was implemented for the performance of three different processes in the project and it was concluded that LC approach helped significantly reduce (by about half) the waste generated at the site. Furthermore, Agyekum et al. (2013) examined the application of LC approach for minimizing material wastage in the construction industry in Ghana. Likewise, Abo-Zeid and Othman (2018) investigated the role of Lean approach for reduction of waste in the Egyptian construction industry. A comprehensive understanding of various aspects regarding construction waste, its causes and impacts as well as the challenges and benefits of the implementation of LC in a construction project was highlighted. Additionally, the perception and application of LC for the reduction of construction waste was emphasized upon in this study. Similarly, a study by Waite (2020), lays stress on the use of Lean Management Principles to reduce waste and achieve sustainability in the construction sector. Furthermore, a case study by Berroir et al. (2023) investigated the applicability of LC and Artificial Intelligence (AI) and their potential synergy to aid in on-site construction waste management. In addition, Maraqa et al. (2023) provides strategies for waste reduction in construction projection using lean principles. Also, Karaz and Teixeira (2020) conducted a systematic literature review on construction waste management using LC and Building Information Modeling (BIM), providing useful insights into the relevance of LC for effective construction waste management.
2.3 Lean construction implementation in the UAE’S construction sector
Despite its numerous proven advantages for construction waste management globally, very few studies emphasize on the applicability of LC in the UAE’s construction sector (Small et al., 2017). A study by Bakry (2022) analyzed the suitability of lean tools for effective application in the UAE’s construction industry, by comparing the features of the regional construction market with an assessment of Lean tool capabilities. Al-Aomar (2012) carried out an analysis of LC practices in the construction industry within the Emirate of Abu Dhabi, with the aim of developing a framework for effective application of the approach in the C&D industry. According to the report, only 32% of the organizations surveyed within Abu Dhabi had either used or are currently aware of LC approaches. Warid and Hamani (2023) conducted a case study to investigate the suitability of applying the Last Planner System of LC in UAE construction projects and concluded its successful implementation in the industry. Additionally, Shurrab and Hussain (2018) carried out an empirical investigation to examine the manner in which lean methodology affects the performance of medium and large construction businesses in the UAE. Furthermore, Small et al. (2017) examined the opportunities for integrating LC methods into the construction industry in Dubai by providing insights into specific techniques for overcoming institutional resistance. Additionally, Kanafani (2015) investigated the barriers to the application of Lean principles in the UAE’s construction sector and concluded that lack of commitment from stakeholders overall and from management in particular was the greatest barrier. Another study by Wajahat (2022) also highlighted the barriers toward Lean implementation in the UAE construction industry, offering potential solutions from a Swedish context. Also, Watfa and Sawalha (2021) conducted an empirical study on the critical factors for the successful application of LC in the UAE construction sector.
In conclusion, numerous studies have demonstrated the effectiveness of LC (LC) methodologies in reducing construction waste. However, adoption of these practices within the UAE’s construction sector remains limited, and research on this subject in the region is relatively scarce. Notably, there is a lack of studies that explore stakeholders’ perceptions of LC specifically in the context of construction waste reduction, particularly within the UAE’s building construction sector.
Consequently, this gap underscores the necessity for the present study, which aims to assess the perceptions of professionals in the UAE construction industry regarding the application of Lean Construction. The objective is to gain insight into the attitudes, beliefs, and behaviors of stakeholders, and to identify the key factors influencing the adoption of LC practices. By doing so, the study seeks to inform the development of effective strategies for the successful implementation of LC in the UAE, thereby enhancing construction waste management with a focused lens on the building construction sector.
Tables 2, 3 present the foundational insights derived from the literature, detailing the primary types of construction waste and their prevalence across different project phases, respectively. These insights contextualize the relevance of Lean principles in addressing specific waste streams within the construction industry. Table 4 builds upon this by synthesizing a comprehensive list of LC implementation barriers, grouped into thematic constructs identified through content analysis of the literature.
Table 2
| Sl. no. | Construction waste type | Description | References |
|---|---|---|---|
| 1 | Demolition waste | Generated during the demolition or deconstruction of existing building structures. This includes materials such as concrete, bricks, wood, metals, insulation, and wiring. | Kanafani (2015), Nie et al. (2024), and Dispo (2024) |
| 2 | Excavation waste | Arises from digging, trenching, or earthmoving activities. It comprises soil, rocks, and other materials excavated from the building construction site. | Kanafani (2015), Nie et al. (2024), and Saradara et al. (2024) |
| 3 | Structural waste | Waste resulting from the construction of buildings. This includes excess concrete, steel beams, reinforcement bars (rebar), and other structural elements. | Al-Hajj and Hamani (2011), Kanafani (2015), and Nie et al. (2024) |
| 4 | Packaging waste | Packaging materials such as cardboard, plastic wrapping, and wooden pallets used to transport and store building construction materials and equipment. | Al-Hajj and Hamani (2011), Kanafani (2015), and Aldeeri and Touqan (2025) |
| 5 | Off-cuts and trim waste | Generated during the cutting, trimming, or shaping of building construction materials such as timber, pipes, and sheet metal. This waste includes small pieces or off-cuts that are discarded. | Al-Hajj and Hamani (2011) and Kanafani (2015) |
| 6 | Hazardous waste | Materials containing substances that pose a risk to human health or the environment. This includes items such as asbestos-containing materials, lead-based paints, solvents, and chemicals. | Kanafani (2015), Saradara et al. (2024), and Nie et al. (2024) |
| 7 | Non-hazardous waste | General waste produced during building construction activities that does not pose a significant risk to health or the environment. This category may include items such as plastic packaging, paper, cardboard, and food waste. | Al-Hajj and Hamani (2011), Kanafani (2015), Hittini and Shibeika (2019), and Saradara et al. (2024) |
| 8 | Land clearing waste | Generated during the clearing of land for construction purposes. It includes vegetation, tree stumps, roots, and other organic matter. | Kanafani (2015) and Saradara et al. (2024) |
| 9 | Electrical and electronic waste (E-Waste) | Discarded electrical and electronic equipment such as wiring, fixtures, appliances, and electronic devices used in construction. | Kanafani (2015), Husin (2019), Kumar and Verma (2024), and Aldeeri and Touqan (2025) |
| 10 | Mechanical and plumbing waste | Waste generated from the installation, maintenance, or replacement of mechanical and plumbing systems. This includes pipes, fittings, valves, and HVAC components. | Kanafani (2015) and Husin (2019) |
Construction wastes generated in a building construction project.
Table 3
| Sl. no. | Construction phases | Description | References |
|---|---|---|---|
| 1 | Design phase | Design errors, late changes, over-specifications, and lack of coordination leading to material mismatches, rework, and redundant designs. | Meshref et al. (2023) and Purushothaman and Seadon (2024) |
| 2 | Procurement phase | Overstocking, batch ordering, delayed delivery; excessive packaging and material handling due to poor forecasting and supplier coordination. | Al-Hajj and Hamani (2011) and Purushothaman and Seadon (2024) |
| 3 | Construction phase | Material off-cuts, formwork ejecta, spoil, and debris; general handling losses during core structural operations. | Al-Hajj and Hamani (2011), Saradara et al. (2024), Purushothaman and Seadon (2024) |
| 4 | Finishing phase | High volumes of trim waste (tiles, paint, carpentry), packaging from fixtures, surface rework (defects), and oversupply due to last-minute alterations. | Al-Hajj and Hamani (2011), Saradara et al. (2024), and Purushothaman and Seadon (2024) |
| 5 | Maintenance and repair phase | Waste from replacement of parts, reactive repairs, system upgrades, typically redundant or prematurely discarded building components. | Klimenko et al. (2019) |
Construction phase-wise waste types.
Table 4
| Sl. no. | Groups | Barriers | Reference | Description | Associated lean/construction waste type |
|---|---|---|---|---|---|
| 1 | Knowledge/ awareness (K) | Lack of knowledge about lean concepts including LC within the public procurement procedure (K1) | Al Balkhy et al. (2021), Bayhan et al. (2019), Musa et al. (2023), Enshassi et al. (2021a), Ahmed and Wong (2020), Enshassi et al. (2021b), Sayed et al. (2019), and Pedrosa et al. (2023) | Lack of knowledge about lean ideas, such as LC, affects public procurement procedures and leads to ineffective project execution and resource allocation. |
Overprocessing: due to redundant or misaligned procurement steps. Underutilized Talent: because workers are not trained or aware of how to contribute using Lean principles. Structural Waste: poor procurement may lead to wrong materials or specifications, requiring rework or disposal. Packaging Waste: over-ordering or inefficiencies lead to excess packaging. Demolition Waste: ineffective processes can result in redoing work or demolishing parts. |
| 2 | Lack of awareness programs (K2) | Kim and Park (2006), Alarcón et al. (2002), Mehra et al. (2015), and Bashir et al. (2015) | Lack of awareness campaigns prevents stakeholders from learning essential knowledge about LC techniques, which makes it more difficult for the sector to adopt effective procedures and achieve the best project outcomes. |
Underutilized Talent: workers, engineers, and managers lack the training to contribute efficiently. Waiting: due to lack of proactive planning and unfamiliarity with lean methods. Structural Waste: from execution errors due to ignorance of best practices. Off-cuts and Trim Waste: lack of lean planning results in inefficient cutting and material use. |
|
| 3 | Unskilled labor and low level of education of the site foreman (K3) | Al Balkhy et al. (2021), Pedrosa et al. (2023), and Musa et al. (2023) | The widespread presence of poorly trained and insufficiently educated site foremen poses a challenge to the effective application of LC methodologies, hindering the advancement of more sustainable and efficient construction procedures. |
Underutilized Talent: since it involves human resources not being effectively trained or deployed. Defects: errors in execution due to lack of technical skill. Overprocessing: inefficient procedures performed incorrectly or unnecessarily due to lack of understanding. Structural Waste: poor workmanship leads to material rework or structural failure. Mechanical and Plumbing Waste: faulty installation due to lack of technical training. |
|
| 4 | Lack of experiences (K4) | Alarcón et al. (2002) and Bashir et al. (2015) | The industry’s capacity to learn from prior experiences is limited by a lack of direct exposure to successful LC projects, which restricts the general adoption of lean methodology and best practices. |
Defects: mistakes are repeated due to lack of past project learnings. Waiting: inefficiencies occur while figuring out what to do or how to do it. Overprocessing: redundant or non-value-adding steps are repeated due to unfamiliarity with streamlined methods. Demolition Waste: corrections and reworks required due to misjudgment or lack of technical insight. Structural Waste: overdesign or mis-installation from inexperience. Non-hazardous Waste: materials wasted due to trial-and-error handling. |
|
| 5 | Attitude (A) | Selfishness among professionals (A1) | Mossman (2009) | Selfishness among professionals hampers collaboration and inhibits the collective adoption of LC principles. |
Underutilized Talent: collaboration failure prevents pooling of skills and ideas. Waiting: project delays occur when parties fail to share information or cooperate. Defects: lack of communication and teamwork increases coordination errors. Structural Waste: poor coordination between design and site execution causes rework. Demolition Waste: miscommunication can lead to incorrect construction that must be redone. Non-hazardous Waste: material overuse or disposal from poor planning and lack of collaboration. |
| 6 | Stick to the old ways and refuse to use new ideas (A2) | Bayhan et al. (2019) and Al Balkhy et al. (2021) | Resistance to new ideas and a preference for traditional methods hinder the integration of LC practices, preventing the industry from evolving and optimizing its processes to meet modern challenges. |
Waiting: delays occur when outdated methods slow adoption of faster, more efficient approaches. Overprocessing: reliance on redundant or inefficient traditional steps. Underutilized Talent: innovation and initiative from workers are suppressed when traditional practices dominate. Waiting: resistance to change causes delays in adopting improved workflows or new technologies. Overprocessing: outdated methods often involve redundant steps, excessive paperwork, and inefficient processes. Structural Waste: continued use of outdated techniques can result in inefficiencies and rework. Non-hazardous Waste: old processes yield excess packaging, paper, or unused materials. |
|
| 7 | Labor considers LC too complex (A3) | Musa et al. (2023), Bayhan et al. (2019), Metlej (2021), Sholanke et al. (2019), Al Balkhy et al. (2021), and Bajjou and Chafi (2018) | Labor frequently view LC as too difficult, which makes them unwilling to adopt it and prevents them from realizing how beneficial it is for enhancing workflow and eliminating waste. |
Underutilized Talent: workers disengage or avoid Lean methods because they feel incapable of applying them, leading to lost potential and inefficiency. Waiting: hesitation and slow decision-making occur as laborers delay actions due to uncertainty about Lean practices. Defects: misapplications or misunderstandings of Lean procedures lead to mistakes in execution and rework. Structural Waste: errors in construction or assembly due to improper application of Lean methods. Off-cuts and Trim Waste: inaccurate measurements and poor understanding of processes increase off-cut generation. Non-hazardous Waste: inefficient handling of materials and processes leads to excessive discard of general waste. |
|
| 8 | Fear of unfamiliar activities (A4) | Mossman (2009), Alarcón et al. (2002), Bashir (2013), Bashir et al. (2015), and Sarhan and Fox (2012) | Fear of unfamiliar activities creates a barrier to embracing LC methodologies, impeding progress toward more efficient and sustainable construction practices. |
Waiting: progress slows as workers hesitate to engage in new or unfamiliar Lean practices. Underutilized Talent: potential contributions from skilled workers are lost when fear prevents them from experimenting or innovating. Overprocessing: reliance on traditional, repetitive methods instead of simplified Lean processes increases unnecessary steps. Defects: avoidance of new, more accurate processes leads to reliance on outdated, error-prone methods. Structural Waste: reluctance to adopt efficient methods leads to continued use of error-prone construction techniques. Non-hazardous Waste: inefficient or redundant material usage arises from sticking to old, familiar processes. Packaging Waste: hesitation to implement new material-handling systems results in excess packaging and material movement. Off-cuts and Trim Waste: avoidance of prefabrication or precision cutting methods, leading to material surplus and scrap. |
|
| 9 | Lack of self-criticism (A5) | Alarcón et al. (2002) | A lack of self-criticism prevents professionals from identifying and addressing inefficiencies within their processes, hindering the continuous improvement necessary for successful implementation of LC principles. |
Defects: recurring errors go uncorrected because processes are not evaluated critically. Overprocessing: unnecessary or inefficient steps continue unchecked due to the absence of reflection and improvement. Underutilized Talent: failure to encourage feedback prevents workers from contributing ideas for improvement. Structural Waste: repeated mistakes in design or execution create rework and material loss. Demolition Waste: unaddressed process errors lead to the need for demolition and rebuilding. Non-hazardous Waste: materials are wasted when inefficiencies are ignored rather than resolved. |
|
| 10 | Inability to change the organizational culture (A6) | Kim and Park (2006), Sandeep and Panwar (2016), Salem et al. (2005), Zhou (2016), Mossman (2009), Mehra et al. (2015), Attri et al. (2017), and Sarhan and Fox (2012) | Inability to change the organizational culture to one that values innovation and efficiency obstructs the widespread adoption of LC, limiting the industry’s ability to adapt and thrive in a rapidly changing environment. |
Underutilized Talent: employees’ ideas and creativity are ignored due to a rigid culture resistant to innovation. Waiting: decision-making and process improvements are delayed because the organization resists change. Overprocessing: outdated procedures are maintained unnecessarily, adding non-value-creating steps. Structural Waste: rigid management structures hinder adaptive responses, resulting in design or build errors. Non-hazardous Waste: outdated practices result in continued material wastage and poor site management. Demolition Waste: reluctance to adopt continuous improvement increases the risk of rework and reconstruction. |
|
| 11 | Management (M) | Inadequate pre-planning (M1) | Ahmed et al. (2021) and Moyo and Chigara (2021) | Lack of thorough preparation and foresight in the initial stages of a construction project, including insufficient consideration of LC principles. This barrier impedes the effective implementation of lean methodologies, leading to inefficiencies, delays, and increased costs during project execution. |
Waiting: project activities are delayed due to poor scheduling and lack of foresight in planning. Overproduction: materials and work are initiated prematurely without proper coordination. Defects: design and construction errors arise because critical details were not addressed during planning. Transportation: poor logistics planning causes unnecessary movement of materials or equipment. Structural Waste: insufficient planning and poor coordination between design and execution causes incorrect installations and material wastage during construction. Excavation Waste: poor pre-planning and site preparation leads to unnecessary earthwork and material handling. Non-hazardous Waste: poor resource coordination results in surplus materials and packaging waste. Packaging Waste: Disorganized logistics and delivery lead to excessive packaging disposal. |
| 12 | Lack of employee training and continuous improvement in lean construction (M2) | Al Balkhy et al. (2021), Sayed et al. (2019), Moyo and Chigara (2021), Ahmed et al. (2021), and Sholanke et al. (2019) | Inadequate employee training about LC principles and the absence of efforts to make ongoing enhancements hinder the industry’s capacity to maximize project completion and improve efficiency. |
Underutilized Talent: employees are unable to contribute effectively because they lack Lean knowledge and skill development. Defects: mistakes occur due to insufficient understanding of best practices through Lean processes and poor execution. Overprocessing: inefficient or redundant activities persist because workers are not trained to identify wasteful steps. Waiting: Poorly trained staff take longer to make decisions or complete tasks, causing delays. Structural Waste: poor workmanship and repeated errors increase rework and material usage. Off-cuts and Trim Waste: inefficient handling of materials results in excessive trimming and waste generation. Non-hazardous Waste: limited training in sustainable practices leads to poor waste segregation and material management. |
|
| 13 | Lack of information sharing (M3) | Ahmed et al. (2021), Moyo and Chigara (2021), Bayhan et al. (2019), Alarcón et al. (2002), and Bashir et al. (2015) | This refers to ineffective channels for exchanging information and aligning efforts, hindering the seamless integration of LC principles and impeding project efficiency. |
Waiting: delays occur as teams wait for necessary information or approvals from other departments. Defects: miscommunication or missing data leads to design errors, rework, and inconsistencies. Overprocessing: duplicate work arises when information is not shared efficiently among stakeholders. Transportation: unnecessary transfer of information or materials due to poor coordination systems. Structural Waste: incorrect or incomplete information results in rework and inefficient material use. Packaging Waste: lack of coordination in material handling increases unnecessary packaging and transport. Demolition Waste: poor information flow can lead to construction errors requiring partial demolition and rebuilding. Mechanical and Plumbing Waste: Mis-coordination between MEP teams and other disciplines causes fitting errors. |
|
| 14 | Poor communication between project parties (M4) | Mehra et al. (2015), Attri et al. (2017), and Small et al. (2017) | This denotes a lack of effective information exchange and collaboration among stakeholders involved in a construction project, hindering the successful implementation of LC principles. This barrier leads to misunderstandings, delays, and conflicts, impeding the optimization of processes and the attainment of project goals. |
Waiting: tasks are delayed because critical information, approvals and instructions are not communicated promptly. Defects: misinterpretation of plans or instructions between design and site teams leads to construction errors and rework. Overprocessing: duplicate efforts, excessive documentation and unnecessary corrections occur due to misaligned communication. Transportation: Repeated physical or digital transfer of drawings, materials, or requests due to fragmented communication. Structural Waste: errors caused by poor coordination between designers, contractors, and site staff result in rework and excess material use. Demolition Waste: sections of work may need to be demolished and rebuilt due to misunderstanding of requirements or drawings. Non-hazardous Waste: inefficient communication causes improper use, storage or disposal of materials on-site. Mechanical and Plumbing Waste: Coordination lapses between trades lead to misplaced or conflicting installations. |
|
| 15 | Lack of supply chain integration (M5) | Ahmed et al. (2021), Moyo and Chigara (2021), and Al Balkhy et al. (2021) | The absence of seamless collaboration and coordination among various suppliers and subcontractors, inhibiting the smooth implementation of LC practices and resulting in inefficiencies within the project delivery process. |
Waiting: work halts while materials, approvals, or subcontractor inputs are delayed. Transportation: excessive or unnecessary movement of materials occurs because of unaligned logistics. Inventory: overstocking or shortages result from a lack of synchronized supply chain planning. Packaging Waste: excess packaging from fragmented deliveries and multiple suppliers. Structural Waste: delays or mismatched deliveries cause rework and material inefficiencies. Non-hazardous Waste: over-ordering, improper storage or handling of materials results in general site waste accumulation. |
|
| 16 | Slow decision-making as a result of complex organization hierarchy (M6) | Ahmed et al. (2021), Moyo and Chigara (2021), Musa et al. (2023), Al Balkhy et al. (2021) | The delays in responding to project needs due to bureaucratic layers, hindering the agile implementation of LC principles and impeding overall project efficiency. |
Waiting: prolonged approval processes delay project progress and workflow efficiency. Overprocessing: redundant layers of authorization add unnecessary administrative steps. Underutilized Talent: decision-making power is concentrated, limiting initiative and problem-solving among lower-level staff. Structural Waste: delays in approvals lead to scheduling conflicts and inefficient resource use. Non-hazardous Waste: stalled activities cause material degradation and accumulation of general waste on-site. |
|
| 17 | Contractors and specialists rarely involved in the planning and design phase (M7) | Ahmed et al. (2021) and Moyo and Chigara (2021) | This signifies a missed opportunity for early collaboration and input, leading to suboptimal project outcomes and hindering the effective implementation of LC principles. |
Defects: design errors occur because practical, on-site expertise is not considered early. Overprocessing: additional rework and redesign efforts arise due to lack of early coordination. Waiting: delays in later phases arise due to design conflicts discovered too late. Structural Waste: design inconsistencies lead to rework and material wastage during construction. Demolition Waste: parts of the structure may need to be removed and redone due to impractical design details. Packaging Waste: un-coordinated deliveries and material handling due to poor upfront planning. Non-Hazardous Waste: extra materials consumed during late-stage corrections or modifications. |
|
| 18 | Lengthy approval procedure from top management (M8) | Small et al. (2017) | This represent administrative delays that prevent LC techniques from being quickly implemented, reducing project efficiency and responsiveness to changing requirements. |
Waiting: extended approval times delay project execution and disrupt workflow continuity. Overprocessing: multiple unnecessary approval steps add bureaucracy and slow progress. Underutilized Talent: lower-level staff cannot act independently despite being capable. Structural Waste: delayed approvals affect scheduling and material readiness, leading to inefficiencies. Non-hazardous Waste: idle time results in material spoilage and accumulation of site waste. |
|
| 19 | Lack of support from top management (M9) | Ahmed et al. (2021), Moyo and Chigara (2021), and Bayhan et al. (2019) | This indicates a lack of commitment and resources essential for driving the adoption of LC principles throughout the organization. |
Underutilized Talent: employees are not empowered or motivated to apply Lean principles effectively. Waiting: decision-making and resource allocation are delayed due to lack of managerial involvement. Overprocessing: inefficient or outdated processes persist because leadership does not champion Lean improvements. Structural Waste: limited oversight, lack of resource support and commitment lead to poor quality control and material rework. Non-hazardous Waste: general inefficiencies, unused materials, and administrative waste from lack of strategic guidance. Demolition Waste: lack of strategic direction causes misaligned objectives, requiring correction or reconstruction. |
|
| 20 | Unclear project definition and outcomes (M10) | Attri et al. (2017) and Bashir et al. (2015) | A lack of clarity in project objectives, which hampers the application of LC methodologies requiring clear goals for optimization and continuous improvement. |
Defects: vague project objectives lead to design errors, rework, and misaligned deliverables. Overprocessing: unnecessary work and redundant documentation occur due to unclear scope. Waiting: teams pause for clarification or additional instructions, delaying workflow. Overproduction: work is done ahead of need or to incorrect specifications. Structural Waste: miscommunication and poor project scoping lead to rework and excess material use and wastage. Demolition Waste: unclear design or scope changes result in partial demolition and reconstruction. Non-hazardous Waste: inefficient planning and misalignment create surplus or discarded materials. |
|
| 21 | Centralization of decision under single authority (M11) | Moyo and Chigara (2021), Musa et al. (2023) and Al Balkhy et al. (2021) | Refers to a concentration of power that inhibits decentralized problem-solving and collaborative decision-making, hindering the agile and adaptive nature of LC practices. |
Waiting: project teams experience delays while awaiting approvals or instructions from a single authority. Underutilized Talent: employees and middle managers are discouraged from making independent decisions or suggesting improvements. Overprocessing: repetitive administrative reviews occur due to concentration of decision-making power. Structural Waste: delayed decisions disrupt work sequencing and resource allocation, leading to inefficiencies. Non-hazardous Waste: prolonged waiting periods cause material degradation and general site waste. Packaging Waste: Inefficient procurement cycles and material handling due to rigid hierarchy. |
|
| 22 | Lack of motivation for the employees to learn about lean construction (M12) | Moyo and Chigara (2021), Ahmed et al. (2021), Al Balkhy et al. (2021), and Sholanke et al. (2019) | Signifies a reluctance to embrace new methodologies, impeding the adoption of lean principles essential for enhancing project efficiency and effectiveness. |
Underutilized Talent: workers do not develop or apply skills that could enhance productivity and reduce waste. Defects: low engagement and poor understanding lead to mistakes and inconsistent quality. Waiting: lack of motivation slows initiative and responsiveness, delaying workflow improvement. Structural Waste: errors and inefficiencies persist due to limited workforce engagement and care. Off-cuts and Trim Waste: inattentive material handling and poor work habits increase waste during fabrication. Non-hazardous Waste: disinterested employees fail to adhere to waste management practices, leading to avoidable material loss. |
|
| 23 | Poor leadership (M13) | Mossman (2009), Mehra et al. (2015), Attri et al. (2017), and Bashir et al. (2015) | Denotes a deficiency in guiding and inspiring teams, hindering the successful implementation of LC principles that require strong direction and support from management |
Underutilized Talent: lack of direction and support prevents employees from contributing their full potential. Waiting: indecisive or ineffective leadership causes delays in task allocation and project progression. Defects: unclear guidance and inconsistent supervision lead to mistakes and quality issues. Overprocessing: lack of clear priorities causes redundant or misdirected efforts. Structural Waste: poor supervision and decision-making cause errors and rework during construction. Demolition Waste: inadequate oversight leads to improper execution, resulting in sections needing removal or rebuilding. Non-hazardous Waste: disorganized site management results in unnecessary material loss and poor waste segregation. |
|
| 24 | Lack of transparency (M14) | Alarcón et al. (2002) | Deficit in openness and accessibility of information, impeding the effective application of LC principles that rely on shared visibility and accountability throughout the project lifecycle. |
Defects: hidden information and poor visibility lead to design or execution errors that require correction. Overprocessing: redundant checks and reporting arise to compensate for missing transparency. Waiting: delayed communication of project updates causes idle time and disrupted scheduling. Structural Waste: lack of clarity on specifications or progress leads to rework and inefficient use of materials. Non-hazardous Waste: incomplete information about materials or processes leads to poor site waste handling and segregation. |
|
| 25 | Poor communication among participants of the production process (managers, foremen, administrators, etc.) (M15) | Bashir et al. (2015), Bashir (2013), and Salem et al. (2005) | Breakdown in coordination and information sharing that prevents LC principles—which depend on smooth cooperation and mutual understanding—from being applied effectively. |
Waiting: work progress is delayed as teams await information or clarification from others. Defects: errors occur due to misunderstandings or inconsistent instructions between project participants. Overprocessing: repeated corrections and duplicated efforts result from unclear communication channels. Transportation: inefficient communication leads to unnecessary movement of materials, tools, or workers. Structural Waste: poor coordination causes design and construction mismatches leading to rework. Demolition Waste: misaligned instructions and execution errors require partial demolition and reconstruction. Non-hazardous Waste: inefficient coordination leads to unnecessary material use and increased waste generation. Mechanical and Plumbing Waste: coordination gaps between trades lead to damaged or misplaced MEP components. |
|
| 26 | Lack of long-term commitments to innovation and change within the company (M16) | Ahmed et al. (2021), Bayhan et al. (2019), Al Balkhy et al. (2021), Prabaharan and Shanmugapriya (2023), Enshassi et al. (2021a), Ahmed and Wong (2020), Mossman (2009), Bashir (2013), Bashir et al. (2015), and Small et al. (2017) | Indicates a reluctance to invest in continuous improvement initiatives, impeding the sustained adoption and integration of LC practices essential for long-term success. |
Underutilized Talent: employees are discouraged from pursuing continuous improvement or suggesting innovative solutions. Overprocessing: outdated processes are maintained without evaluation or optimization. Defects: lack of sustained learning leads to recurring mistakes and process degradation. Waiting: progress slows as the organization hesitates to invest in or adopt new Lean practices. Structural Waste: failure to innovate leads to repetitive errors and material inefficiencies over time. Non-hazardous Waste: obsolete methods and lack of process improvement result in persistent material wastage. Off-cuts and Trim Waste: lack of investment in precision technologies or prefabrication increases material excess. Demolition Waste: lack of adaptation to modern standards or sustainable methods causes rework and reconstruction needs. |
|
| 27 | Lack of teamwork (M17) | Bashir et al. (2015), Bashir (2013), and Salem et al. (2005) | Inadequate teamwork and responsibility sharing among project participants, obstructing the successful application of LC concepts, which place value on cooperation and group problem-solving. |
Underutilized Talent: individual capabilities are not effectively combined, leading to lost potential and inefficiency. Waiting: tasks are delayed as teams fail to coordinate or wait on others to complete dependent activities. Overprocessing: teams duplicate efforts or engage in redundant activities due to poor coordination. Defects: poor collaboration leads to inconsistent work quality and errors that require rework. Structural Waste: lack of coordination results in mistakes during construction, leading to material rework. Demolition Waste: misaligned efforts between trades or departments lead to errors requiring partial demolition. Non-hazardous Waste: inefficient teamwork leads to duplicated material use and general on-site waste accumulation. Mechanical and Plumbing Waste: coordination gaps between trades cause misalignment or damage. |
|
| 28 | Government (G) | Lack of supportive government laws and regulations that helps to implement lean construction (G1) | Al-Hajj and Hamani (2011), Ahmed et al. (2021), Moyo and Chigara (2021), Enshassi et al. (2021b) and Ahmed and Wong (2020) | Denotes a deficiency in legal frameworks and incentives, hindering the widespread adoption of lean methodologies in the construction industry. |
Waiting: Bureaucratic processes and unclear legal frameworks cause project delays. Overprocessing: additional administrative steps are required to comply with outdated or irrelevant regulations. Defects: inconsistent or poorly defined standards lead to confusion and implementation errors. Underutilized Talent: industry professionals cannot fully apply Lean methods due to regulatory constraints. Structural Waste: misalignment between regulatory requirements and modern practices leads to inefficiencies and rework. Demolition Waste: delayed or conflicting approvals cause rework or redesign after construction begins. Non-hazardous Waste: lack of waste management regulations contributes to poor segregation and disposal practices on-site. |
| 29 | Inconsistent governmental policies (not constant and steady) over time (G2) | Moyo and Chigara (2021), Pedrosa et al. (2023), and Enshassi et al. (2021a) | Fluctuating regulations and guidelines, which disrupt continuity and stability, impeding the consistent implementation of LC practices in the industry. |
Waiting: project implementation is delayed as companies adjust to frequent policy changes. Overprocessing: repeated administrative adjustments are needed to comply with shifting government requirements. Defects: projects built under outdated or misunderstood regulations must be redone or corrected. Overprocessing: Additional documentation or compliance work required due to policy changes. Structural Waste: redesign or reconstruction of project elements due to compliance revisions. Non-hazardous Waste: inconsistent waste management policies result in poor recycling and disposal practices. |
|
| 30 | Government bureaucracy and instability (G3) | Small et al. (2017) | This indicates administrative hurdles and uncertainty in policies, obstructing the streamlined adoption of LC practices within the construction sector. |
Waiting: long approval cycles and administrative delays stall project flow. Overprocessing: excessive documentation and administrative steps add unnecessary effort. Transportation: repeated movement of documents and people across departments for approvals. Structural Waste: inefficient inspection and permitting processes delay work and increase rework risk. Non-hazardous Waste: idle materials deteriorate while awaiting administrative clearance. |
|
| 31 | Inflation in material prices due to unsafe market conditions for construction (G4) | Enshassi et al. (2021b) and Ahmed and Wong (2020) | This refers to volatile economic environments that disrupt cost predictability, impeding the efficient implementation of LC practices reliant on stable input costs. |
Waiting: delays occur while sourcing affordable materials or renegotiating prices. Inventory: firms and projects overstock or understock materials in response to unpredictable pricing. Overproduction: materials may be purchased in excess to hedge against future price increases, leading to inefficiencies. Structural Waste: fluctuating prices cause changes in material selection and substitutions that result in inefficiencies. Packaging Waste: bulk buying during inflation periods increases packaging materials and handling waste. Non-hazardous Waste: over-purchasing or poor storage due to panic buying leads to material degradation and waste. |
|
| 32 | Corruption due to bribery, extortion and fraud (G5) | Attri et al. (2017) | This signifies unethical practices that undermine fair competition and transparency, hindering the effective implementation of LC principles and impeding project efficiency. |
Overprocessing: additional, redundant steps (paperwork, payments, or approvals) arise to satisfy corrupt practices. Defects: poor-quality materials or work from non-merit-based contractor selection. Waiting: delays due to favoritism, selective approvals, and administrative manipulation. Structural Waste: substandard materials and compromised supervision lead to structural inefficiencies and rework. Demolition Waste: corruption-induced poor-quality work results in the need for removal and reconstruction. Non-hazardous Waste: misuse of materials and over-ordering to conceal inflated procurement costs. |
|
| 33 | Financial (F) | Lack of funding to start the implementation of lean construction in the company (F1) | Al Balkhy et al. (2021), Bayhan et al. (2019), Sholanke et al. (2019), Enshassi et al. (2021b), and Ahmed and Wong (2020) | This denotes a shortage of financial resources, hindering the initial investment necessary for adopting lean methodologies and initiating process improvements. |
Waiting: limited financial resources delay the initiation of Lean programs and procurement of necessary tools. Inventory: insufficient funding disrupts material flow, causing shortages or overstocking at inappropriate times leading to unwanted waste. Underutilized Talent: employees cannot receive proper training or use Lean tools effectively due to budget constraints. Structural Waste: poor funding limits quality control and supervision, resulting in rework and inefficiencies. Non-hazardous Waste: resource mismanagement due to funding gaps causes surplus materials and waste accumulation. |
| 34 | Poor salaries of professionals (F2) | Bashir (2013), Bashir et al. (2015), and Sandeep and Panwar (2016) | It represents insufficient pay, which could lower productivity and make it more difficult to hire and retain the qualified workers needed to successfully apply LC techniques. |
Underutilized Talent: low compensation reduces motivation and engagement, preventing employees from performing to their full potential. Defects: lack of incentive and morale leads to careless work and quality issues. Waiting: reduced workforce motivation slows productivity and responsiveness. Structural Waste: poor performance and reduced oversight lead to construction errors and rework. Off-cuts and Trim Waste: low worker motivation results in careless material cutting and handling. Non-hazardous Waste: demotivated staff fail to follow waste management protocols, increasing general waste on-site. |
|
| 35 | Unsteady price of commodities (F3) | Bashir (2013) and Bashir et al. (2015) | Refers to fluctuating costs of materials, hindering cost predictability and making it challenging to implement LC practices that rely on stable input prices. |
Waiting: procurement activities are delayed as firms wait for favorable price conditions. Inventory: companies overstock materials during low-price periods, leading to storage inefficiencies. Overproduction: excess ordering occurs to mitigate future price increases, causing imbalance in supply. Structural Waste: fluctuating prices lead to material substitution and inconsistencies in quality, causing rework. Packaging Waste: repeated orders and deliveries increase packaging materials and logistics waste. Non-hazardous Waste: materials purchased in excess may expire, degrade, or be discarded due to poor storage and planning. |
|
| 36 | Low tender prices (F4) | Small et al. (2017) | This show underbidding in the procurement process, which might delay the successful use of LC techniques that prioritize value delivery over cost-cutting initiatives and compromise quality. |
Defects: cost-cutting during low tenders leads to poor-quality materials and workmanship. Overprocessing: extra rework and paperwork to justify cost changes or recover losses. Underutilized Talent: qualified professionals are replaced with less experienced labor to reduce costs, limiting efficiency. Waiting: delays caused by resource shortages or budget constraints. Structural Waste: compromised quality and poor workmanship lead to rework and excess material use. Demolition Waste: substandard construction resulting from low-cost strategies may require removal and rebuilding. Non-hazardous Waste: the use of cheap, low-quality materials increases waste generation and disposal needs. |
|
| 37 | Material requirement and equipments (R) | Scarcity of materials suitable for LC implementation (R1) | Ahmed et al. (2021), Moyo and Chigara (2021), Bayhan et al. (2019), and Sayed et al. (2019) | This refers to a lack of availability of specific materials tailored to LC methodologies, hindering the seamless integration of lean principles into construction projects. |
Inventory: material shortages cause imbalance in supply, leading to overstocking of alternatives or waiting for deliveries. Waiting: project progress is delayed due to unavailability of Lean-compliant materials. Transportation: sourcing materials from distant suppliers increases unnecessary movement and logistical inefficiencies. Overprocessing: rework or modification of unsuitable materials to meet design requirements. Structural Waste: unsuitable or substitute materials lead to poor performance and rework. Non-hazardous Waste: replacement materials may not be optimized for Lean use, creating excess waste on-site. |
| 38 | Inadequate equipment to implement LC methods (R2) | Ahmed et al. (2021), Moyo and Chigara (2021), Bayhan et al. (2019), and Sayed et al. (2019) | This denotes a shortage of specialized tools and machinery required for efficient execution of LC practices, impeding the adoption and effectiveness of lean methodologies on construction sites. |
Waiting: project activities are delayed while teams share or wait for limited equipment. Overprocessing: additional manual work or alternative steps are performed due to lack of proper tools. Motion: excessive physical movement occurs as workers adapt processes to compensate for missing equipment. Structural Waste: inefficiencies and errors occur when manual methods replace appropriate mechanized processes. Non-hazardous Waste: inefficient equipment use increases material handling and site waste accumulation. |
|
| 39 | Limited use of off-site construction techniques and prefabrication (R3) | Al Balkhy et al. (2021), Pedrosa et al. (2023), and Metlej (2021) | Signifies a missed opportunity to streamline processes and minimize waste, hindering the full realization of LC principles aimed at maximizing efficiency and productivity. |
Overprocessing: traditional on-site methods require more steps and labor compared to prefabrication. Transportation: inefficient movement of materials and components occurs due to fragmented on-site processes. Motion: limited prefabricated technique-usage leads to more movement of personnel on-site to produce the same components. Defects: lack of precision from on-site fabrication increases the likelihood of errors and rework. Structural Waste: manual on-site fabrication results in dimensional inaccuracies and excess material use. Off-cuts and Trim Waste: inefficient on-site cutting and assembly increase material waste. Non-hazardous Waste: traditional methods produce general debris, packaging, and miscellaneous material waste. |
|
| 40 | Technical (T) | Poor performance measurements strategies (T1) | Small et al. (2017), Bashir et al. (2015), Moyo and Chigara (2021), Al Balkhy et al. (2021), Sayed et al. (2019), and Bashir (2013) | Refers to inadequate methods for assessing project progress and outcomes, hindering the effective implementation of LC principles reliant on data-driven decision-making and continuous improvement. |
Defects: errors and inefficiencies go undetected due to lack of proper monitoring and evaluation. Overprocessing: excessive or redundant reporting compensates for unclear metrics. Waiting: delayed decision-making results from absence of real-time performance feedback. Underutilized Talent: workers’ feedback and ideas are ignored in the absence of performance monitoring. Structural Waste: rework from undetected quality issues or performance deviations. Non-hazardous Waste: poor monitoring of material usage leads to excess consumption and waste generation. Demolition Waste: unmeasured performance deviations can cause major errors requiring partial reconstruction. |
| 41 | Lack of software advancement that helps in implementing LC (T2) | Ahmed et al. (2021), Moyo and Chigara (2021), Bayhan et al. (2019), Sholanke et al. (2019), and Musa et al. (2023) | Indicates a deficiency in technology tools tailored for LC methodologies, impeding the efficient adoption and integration of lean practices into project management processes. |
Waiting: project progress is delayed due to slow information processing and manual coordination. Overprocessing: repetitive manual data entry and documentation replace automated workflows. Transportation and Motion: excess movement of documents, drawings, and personnel for communication. Defects: lack of digital integration leads to inaccurate data, poor coordination, and errors. Structural Waste: coordination gaps from manual systems result in design and construction inconsistencies. Demolition Waste: design or planning errors unnoticed until construction stage. Non-hazardous Waste: absence of digital monitoring leads to uncontrolled material usage and waste. |
|
| 42 | Lack of agreed implementation methodology (T3) | Small et al. (2017) | Refers to the absence of a standardized approach for applying LC principles, resulting in inconsistency and hindering effective adoption across projects. |
Defects: inconsistent application of Lean principles leads to errors and quality deviations. Overprocessing: different teams follow varied methods, causing duplication of effort and inefficiency. Waiting: uncertainty in procedures delays task execution and decision-making. Underutilized Talent: employees’ Lean knowledge and initiative remain unused without structure. Structural Waste: inconsistent methodologies or unclear Lean standards lead to construction errors and rework. Non-hazardous Waste: lack of standardized processes increases material wastage and poor handling. Demolition Waste: misaligned methods among teams can result in incorrect installations that require removal and rebuilding. |
|
| 43 | Logistics problems (T4) | Small et al. (2017) | Challenges in material delivery, site access, and resource management, impeding the smooth implementation of LC practices reliant on efficient logistics for project optimization. |
Transportation: inefficient movement of materials and equipment increases handling time and cost. Waiting: project delays occur when materials, tools, or components do not arrive on time. Motion: extra movement of workers searching for or moving materials. Inventory: poor logistics management leads to either material shortages or excessive stockpiling. Packaging Waste: excess packaging from multiple small or redundant deliveries. Structural Waste: delays and material mismanagement result in quality deterioration or improper installation. Non-hazardous Waste: disorganized logistics lead to material damage and unnecessary disposal on-site. |
|
| 44 | Complexity of LC implementation (T5) | Alarcón et al. (2002) | Denotes the intricate nature of integrating LC principles into existing workflows, posing challenges and hindering widespread adoption within the construction industry. |
Overprocessing: redundant procedures arise as firms overcomplicate Lean adoption. Waiting: delays in decision-making and adoption due to confusion or uncertainty. Underutilized Talent: employees lack clarity on roles or are excluded from Lean initiatives. Structural Waste: misunderstandings and misapplications of Lean methods cause execution errors and rework. Non-hazardous Waste: general inefficiencies and material misuse from uncoordinated Lean processes. Demolition Waste: poor understanding of Lean coordination can lead to incorrect assembly, requiring partial demolition. |
|
| 45 | Inaccurate and incomplete designs (T6) | Ahmed et al. (2021), Moyo and Chigara (2021), Musa et al. (2023), Bayhan et al. (2019), Metlej (2021), and Sholanke et al. (2019) | Denotes deficiencies in project plans, leading to disruptions and inefficiencies during construction, thereby hindering the smooth implementation of LC practices. |
Defects: incomplete or inaccurate designs lead to rework and errors in execution. Overprocessing: additional revisions and clarifications are needed due to incomplete drawings. Waiting: construction activities are delayed while design issues are resolved or clarified. Structural Waste: incorrect or incomplete design details lead to rework and inefficient material usage. Demolition Waste: errors in design can result in the need to remove and rebuild completed sections. Non-hazardous Waste: repeated adjustments and redesigns generate surplus materials and general site waste. |
|
| 46 | Others (O) | Difficult nature of construction industry (O1) | Moyo and Chigara (2021), Al Balkhy et al. (2021), Pedrosa et al. (2023), Bajjou and Chafi (2018), and Martinez et al. (2019) | Refers to the inherently complex and unpredictable characteristics of construction projects, posing challenges to the streamlined implementation of LC methodologies. |
Waiting: unpredictable site conditions and uncertainties delay progress and disrupt workflow. Overprocessing: complex project conditions require redundant steps and repeated verification. Defects: variability in materials, methods, and labor increases the likelihood of errors. Structural Waste: unpredictable conditions lead to rework, excess material use, and inefficiencies. Excavation Waste: site difficulties such as unstable ground conditions increase redundant earthwork. Non-hazardous Waste: complex operations generate additional debris and general construction waste. |
| 47 | Dependence on many subcontractors (O2) | Ahmed et al. (2021) and Moyo and Chigara (2021) | This signifies a fragmented supply chain and coordination challenges, hindering the cohesive implementation of LC practices across project phases. |
Waiting: project delays occur as different subcontractors wait for preceding tasks to be completed. Defects: inconsistent workmanship and lack of coordination among subcontractors lead to errors. Transportation: frequent movement of materials and resources between subcontractors increases inefficiency. Structural Waste: poor coordination among subcontractors leads to misalignment and rework. Packaging Waste: repeated handling and transport of materials between subcontractors increase packaging use. Non-hazardous Waste: fragmented workflows and overlapping activities cause excess general site waste. |
|
| 48 | Long implementation period (O3) | Alarcón et al. (2002) | This indicates a prolonged timeframe required for transitioning to LC practices, potentially delaying the realization of benefits and hindering organizational buy-in. |
Waiting: prolonged timelines slow progress and reduce workflow efficiency. Overprocessing: extended implementation leads to unnecessary steps, reviews, and duplicated efforts. Underutilized Talent: lengthy projects cause employee fatigue and reduced motivation, lowering productivity. Structural Waste: extended project duration increases the risk of rework and material deterioration. Non-hazardous Waste: prolonged site activity leads to accumulation of general waste and unused materials. |
|
| 49 | Lack of integrity in the production chain including clients, materials, suppliers, and subcontractors (O4) | Small et al. (2017) and Bashir et al. (2015) | Denotes ethical lapses and trust issues, impeding the smooth execution of LC principles reliant on collaborative and transparent relationships throughout the supply chain. |
Defects: poor ethical practices and lack of accountability lead to quality issues and non-conformance. Transportation: uncoordinated supply chain activities result in unnecessary movement of materials and delays. Overprocessing: repeated checks and corrective actions are needed due to distrust and lack of transparency. Structural Waste: poor quality and dishonesty in the supply chain cause errors and material inefficiencies. Demolition Waste: defective or non-compliant work resulting from poor coordination requires removal and rebuilding. Non-hazardous Waste: lack of transparency in material sourcing and handling increases waste and inefficiency on-site. |
Barriers to LC implementation.
Based on this synthesis, the following section develops a set of hypotheses to test the influence of these identified constructs on stakeholder perceptions of LC adoption. These hypotheses form the conceptual framework evaluated through the PLS-SEM approach employed in this study.
2.4 Hypotheses development
The hypotheses tested in this study were developed based on a thematic synthesis of individual barriers LC adoption identified in prior literature. Rather than relying on a pre-existing framework, the study first compiled a comprehensive list of LC implementation barriers drawn from numerous scholarly sources. These barriers were then categorized into conceptually coherent constructs based on observed patterns and similarities in their descriptions. The process involved inductive grouping of barriers into eight overarching categories namely, Knowledge/Awareness, Attitude, Management, Government, Financial, Material/Resources, Technical, and Other, each representing a distinct dimension of influence on stakeholder perceptions.
Table 4 presents the detailed mapping of individual indicators (barriers) under each construct, along with citations to the respective sources from which these barriers were extracted. This data-driven categorization process enabled the formulation of hypotheses that align both with observations from previous studies and with the structural requirements of the proposed research model.
Based on this thematic structuring, the following hypotheses are proposed to assess how these eight categories of barriers influence stakeholder perceptions of LC adoption in the UAE building construction sector (illustrated in Figure 3):
Figure 3
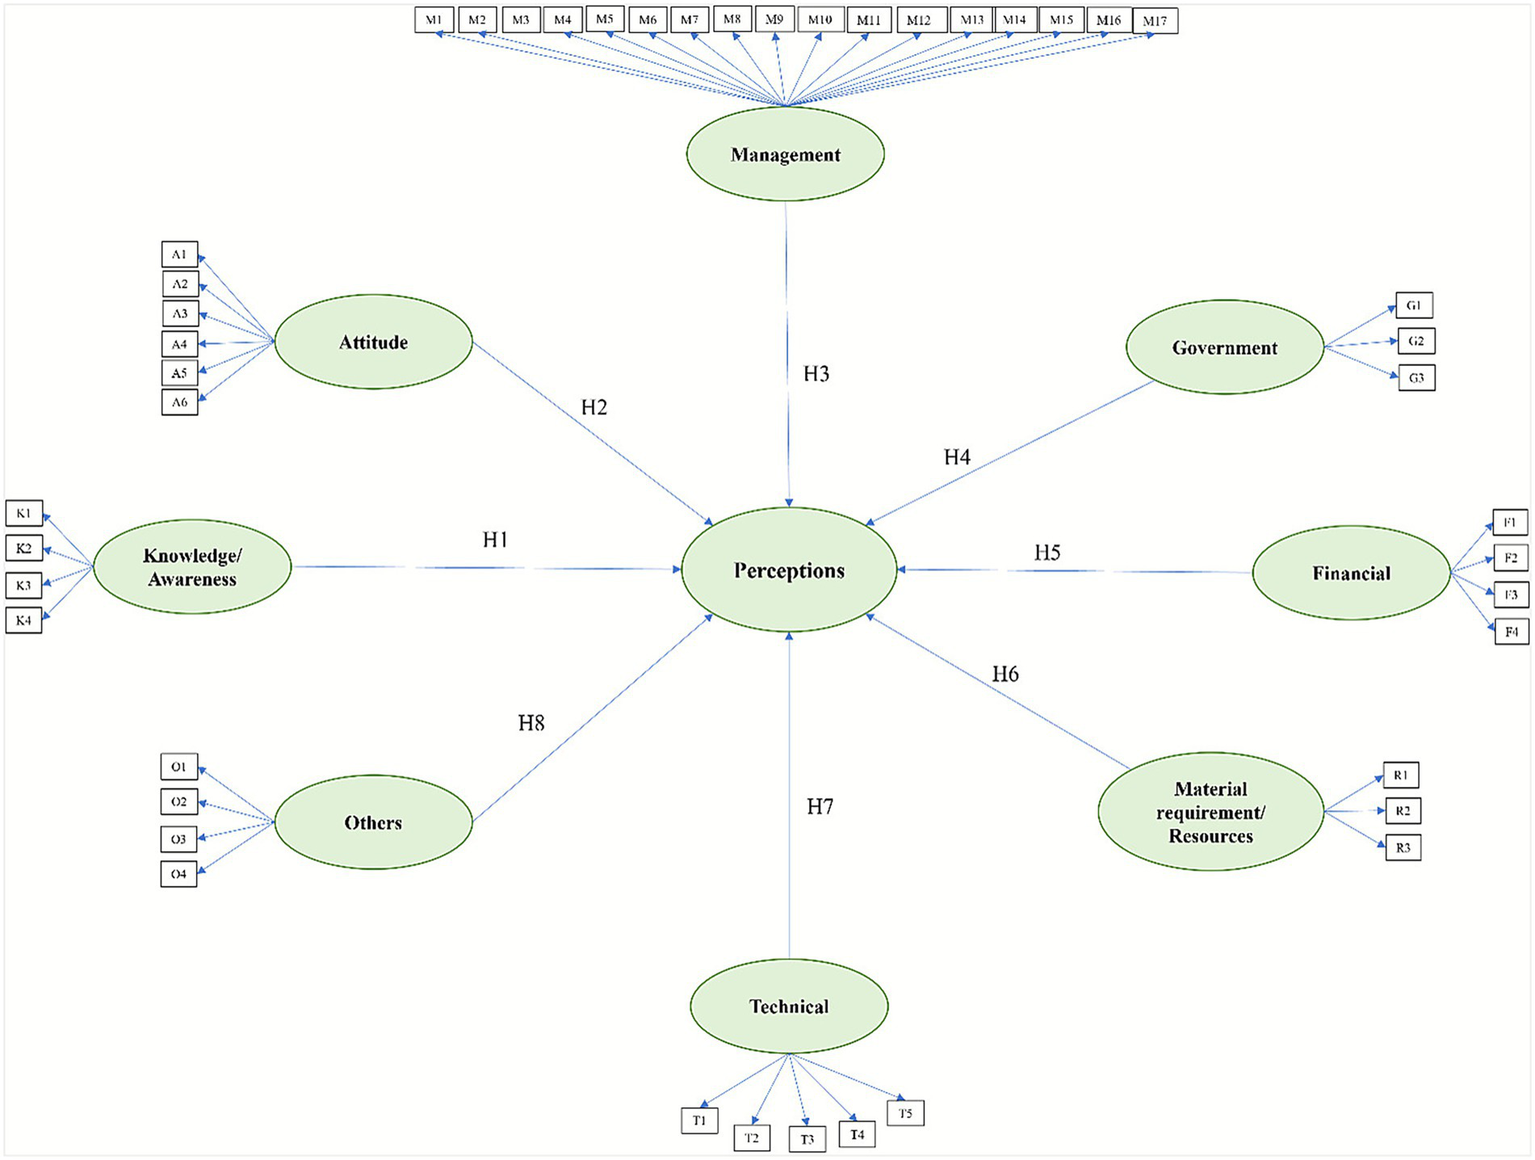
SEM path diagram and hypotheses analyzed in the study.
H1: Knowledge/awareness factor (K) has a significant impact on the perception of stakeholders toward LC implementation.
H2: Attitude factor (A) has a significant impact on the perception of stakeholders toward LC implementation.
H3: Management factor (M) has a significant impact on the perception of stakeholders toward LC implementation.
H4: Government factor (G) has a significant impact on the perception of stakeholders toward LC implementation.
H5: Financial factor (F) has a significant impact on the perception of stakeholders toward LC implementation.
H6: Material requirement/Resources factor (R) has a significant impact on the perception of stakeholders toward LC implementation.
H7: Technical factor (T) has a significant impact on barriers on the perception of stakeholders toward LC implementation.
H8: Other factor (O) has a significant impact on the perception of stakeholders toward LC implementation.
Testing these hypotheses helps validate the conceptual framework proposed in this study, which integrates stakeholder perceptions with operational challenges in LC implementation. By empirically examining how distinct categories of barriers impact stakeholder perception toward adoption of LC, the study contributes to addressing the research gap concerning systemic limitations to LC adoption in developing construction markets such as the UAE.
3 Materials and methods
3.1 Research design
This study employed a quantitative exploratory research design. In the first phase, a comprehensive literature review and expert validation were conducted to identify and refine the barriers influencing LC adoption in the UAE. The outcome of this phase was a set of 49 validated barriers grouped into eight categories. In the second phase, a structured questionnaire was developed based on these barriers and distributed to construction industry professionals. The collected data were analyzed using Partial Least Squares Structural Equation Modeling (PLS-SEM) to investigate barriers to LC implementation and perceptions of its effectiveness in the context of the UAE’s building construction sector. The overall flow diagram of the research methodology is illustrated in Figure 4. This diagram provides a visual summary of the methodological stages, clarifying the logical progression from barrier identification and validation through quantitative analysis and interpretation. It enhances transparency and replicability by outlining each key step in the data collection and analysis process. This section gives a detailed description of the various phases of this study.
Figure 4
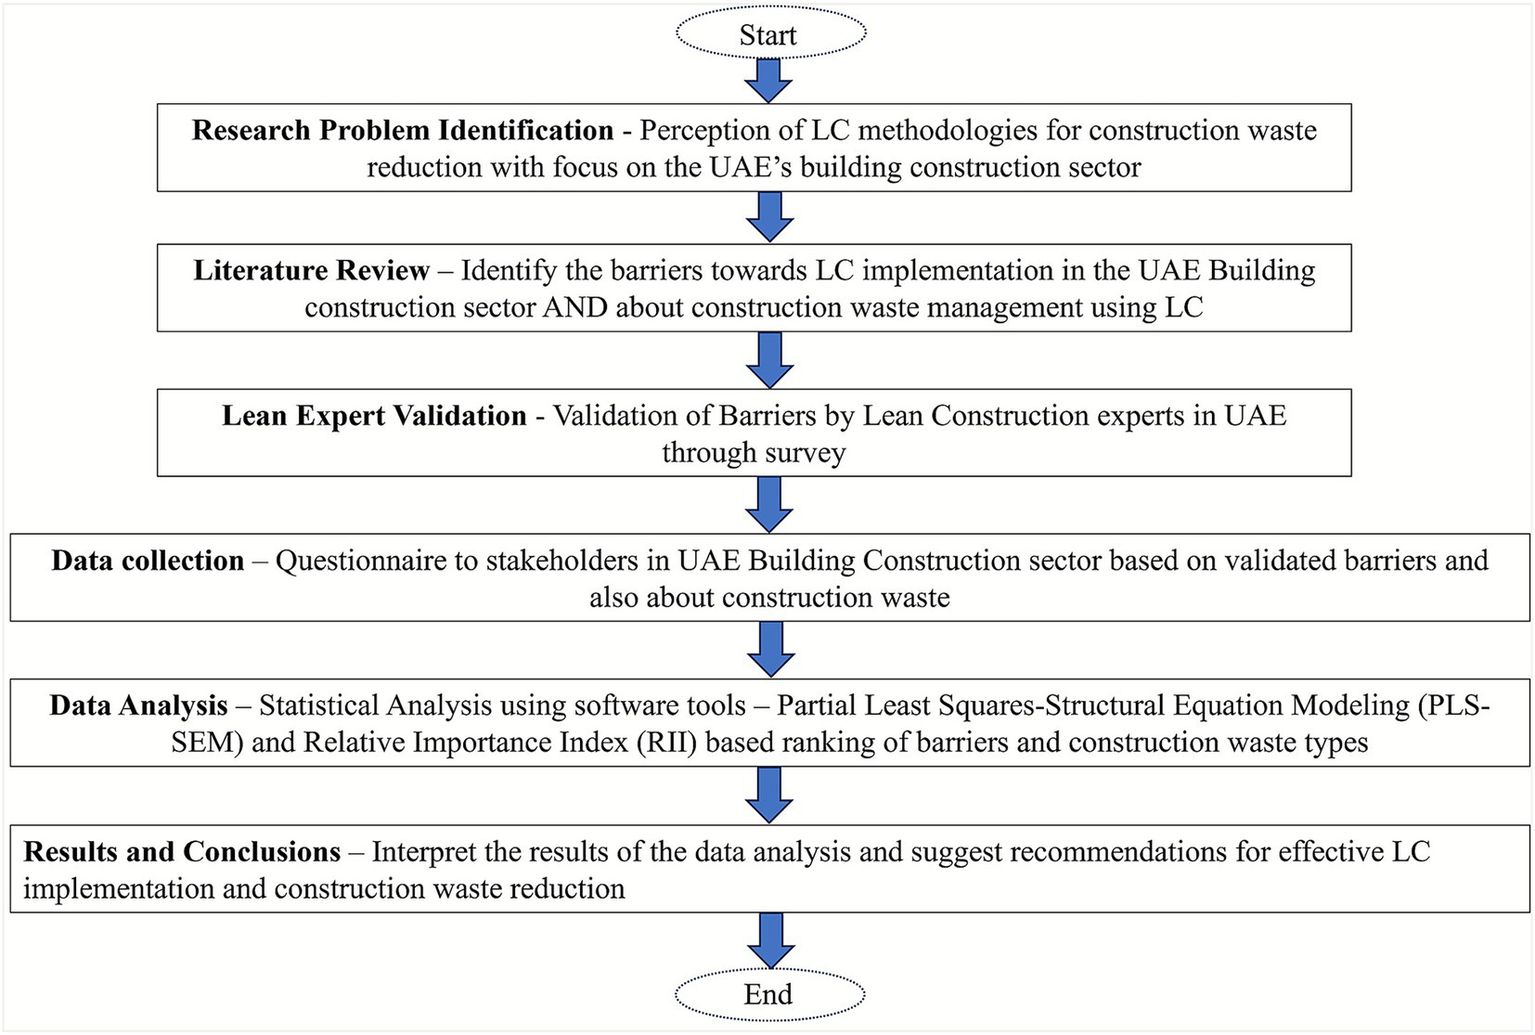
Research methodology flowchart.
3.2 Identification and expert validation of barriers to adoption of lean construction in the UAE
To support the development of the theoretical framework, a targeted literature search was carried out using academic databases such as Scopus, ScienceDirect, and Google Scholar. Search terms included “Lean Construction,” “construction waste,” “barriers to Lean implementation,” and “UAE construction sector,” with a focus on recent peer-reviewed publications. Sources were selected based on conceptual relevance and citation impact to ensure practical alignment with the study objectives. An initial literature review was conducted to identify the types of construction waste commonly generated, the stages of the construction process during which they arise, and potential obstacles hindering LC adoption. This foundational research informed the development of key research instruments and is summarized in Tables 2–4, which, respectively, outline the types of construction waste, construction phase-wise waste generation, and recognized LC implementation barriers. To strengthen the analytical connection between the identified LC implementation barriers and their practical implications on waste management, a column was included within Table 4 linking each barrier to its corresponding Lean waste and construction waste category. This mapping was developed through content analysis of prior studies and cross-referencing with the eight classical Lean waste types and 10 major construction waste streams summarized in Tables 1, 2. The inclusion of this mapping enables a clearer understanding of how specific organizational and technical barriers contribute to distinct forms of waste generation within the UAE’s building sector.
The gathering of data was an essential and crucial part of this study as it helped to determine how stakeholders in the UAE understands LC and construction waste generation. The distribution of a questionnaire to professionals actively engaged in the building construction industry in the UAE was the chosen quantitative data collecting strategy for obtaining the perspectives and understandings of the stakeholders.
To ensure contextual relevance and validity, the survey underwent expert validation by a panel of six experienced professionals from diverse roles within the UAE construction industry. Their expertise spanned a spectrum of projects including residential villas, residential buildings (ranging from G + 5 to G + 10), commercial developments (such as malls and offices), industrial facilities, and infrastructure ventures. In an authoritative capacity, the expert panel undertook the validation of the existing barriers. During the expert validation phase, each of the initially identified 49 barriers was evaluated based on three criteria: (1) contextual relevance to the UAE construction sector, (2) frequency of occurrence in practice, and (3) perceived impact on LC implementation. Their feedback led to refinements in the questionnaire, including the removal of specific indicators such as “Inflation in material prices due to unsafe market conditions for construction” (G4), “Corruption due to bribery, extortion and fraud” (G5), and “Inaccurate and incomplete designs” (T6), while retaining others that received neutral responses—“Inconsistent governmental policies (not constant and steady) over time” (G2), “Government bureaucracy and instability” (G3) and “Complexity of LC implementation” (T5)—but were deemed relevant in the local context. Barriers such as corruption, inflation instability, and governmental inconsistency were excluded as experts unanimously confirmed that these issues are largely mitigated in the UAE through strict legal enforcement, transparent tendering systems, and stable macroeconomic conditions. Their exclusion strengthened the contextual validity of the study instrument and ensured that the final barrier set accurately reflects the practical realities of LC adoption in the UAE. The conceptual integrity of the affected constructs was maintained, as the remaining items continued to represent the same underlying dimensions influencing LC implementation in the UAE building industry. Table 5 presents the background details of the expert panel involved in the validation process.
Table 5
| Expert | Job title | Years of experience in lean | Affiliation |
|---|---|---|---|
| 1 | Director | 20–25 | Contractor |
| 2 | Cost Control Engineer | 10–15 | Contractor |
| 3 | Faculty | 10–15 | Education |
| 4 | Quality and Process Improvement Manager | 5–10 | Contractor |
| 5 | Lean Construction Engineer | 5–10 | Contractor |
| 6 | Deputy Construction Manager | 10–15 | Contractor |
Background details of the expert panel that validated the barriers.
3.3 Data collection
3.3.1 Survey design
Following expert validation, the final questionnaire was prepared and structured into three distinct sections to enable a comprehensive understanding of stakeholder perceptions and waste management practices. Section 1 focused on gathering demographic data about the respondents, such as their job roles, years of experience, and sector of involvement. Section 2 was designed to assess stakeholder perceptions regarding the adoption of LC, using the set of barriers and indicators previously identified in Table 4 after the inclusion of modifications suggested by the expert panel. Section 3 aimed to understand waste generation practices and trends within the UAE’s building construction industry, capturing information about the types and sources of construction waste encountered in practice. All questions in the latter two sections collected responses based on Likert scale—Extremely High (5), High (4), Moderate (3), Low (2), and Extremely Low (1). The conversion from the qualitative scale, of Extremely High to Extremely Low, to numerical scale, of 5–1 respectively, was carried out manually using Microsoft Excel. A 5-point Likert scale was selected as it offers a balanced range of responses while maintaining simplicity for respondents, thereby enhancing survey completion rates.
3.3.2 Sampling
The survey was administered online, over a period of 1 month, to ensure broad accessibility and outreach. A combination of purposive and snowball sampling methods was adopted. Initially, responses were collected from professionals working directly within the UAE building construction sector, following which, participants were also encouraged to forward the survey to colleagues in similar roles to enhance participation. In total, 77 valid responses were obtained, including five from individuals currently working in infrastructure development but with relevant prior experience in building construction. These responses were included due to their relevance to the study. All responses obtained were complete, resulting in 100% valid response rate. Thus, no data cleaning or exclusions were required.
3.4 Data analysis
The data obtained from the three sections of the questionnaire were systematically analyzed using both descriptive and inferential statistical techniques to address the study objectives. Data from section 1 (respondent demographics) were analyzed to provide an overview of the sample composition in terms of age, experience, professional role, and prior exposure to LC. Data from sections 2 and 3 were subsequently subjected to inferential analysis using two complementary techniques: Partial Least Squares Structural Equation Modeling (PLS-SEM) and the Relative Importance Index (RII). The PLS-SEM method was employed to evaluate the hypothesized relationships among latent constructs and to assess the reliability and validity of the measurement and structural models. In parallel, the RII method was used to prioritize the identified barriers to LC adoption and to analyze the perceived frequency and significance of different construction waste types and sources. The integration of these analytical approaches enabled both theoretical validation and practical ranking of the factors influencing LC implementation and construction waste management within the UAE’s building sector.
3.4.1 Partial least squares-structural equation modeling analysis
Partial Least Squares Structural Equation Modeling (PLS-SEM) is a robust statistical technique designed to examine complex relationships between observed (manifest) variables and latent constructs within a reflective measurement model (Hair et al., 1998). Quantitative data collected for section 2 were mainly analyzed using SmartPLS 4 employed for PLS-SEM analysis. The sample size of 77 respondents falls below commonly recommended thresholds for complex PLS-SEM models. However, unlike covariance-based structural equation modeling (CB-SEM), PLS-SEM is particularly well-suited for exploratory research, smaller sample sizes, and theory development rather than theory confirmation (Huang, 2021; Henseler and Sarstedt, 2013). Also, Henseler and Sarstedt (2013) states that the sample size requirements in PLS-SEM is usually independent of the overall model complexity. Additionally, a separate G*Power calculation was conducted to check for the adequacy of the sample size obtained. With 77 responses, 8 predictor constructs, an alpha level of 0.05, and an assumed medium effect size (f2 = 0.15), the resulting statistical power was 0.81, exceeding the conventional threshold of 0.80 recommended for ensuring statistical reliability (Cohen, 1977). Hence, PLS-SEM is the chosen methodology for this study, given its exploratory nature and the under-researched context of LC barriers in the UAE (Hair et al., 1998). The SEM path model is shown in Figure 3.
The analysis proceeded in two stages: (1) assessment of the measurement model, and (2) assessment of the structural model. The first stage involved evaluating indicator reliability, internal consistency, convergent validity, and discriminant validity to ensure that the reflective constructs were measured accurately and consistently. In the second stage, the structural relationships among the latent constructs were estimated using path analysis and bootstrapping procedures to determine the strength and statistical significance of each hypothesized path.
Model quality was further evaluated using common PLS-SEM criteria such as the Standardized Root Mean Square Residual (SRMR) for model fit, the Variance Inflation Factor (VIF) to test for multicollinearity, and R2 and f2 statistics to assess explanatory power and effect size. The details of these results, along with the corresponding indices, are presented and discussed in section 4.2.1.
This structured approach ensured that both the measurement and structural aspects of the model were rigorously tested in line with established PLS-SEM practices (Hair et al., 1998; Fornell and Larcker, 1981; Hu and Bentler, 1998; Henseler et al., 2015; Huang, 2021).
3.4.2 Relative importance index analysis
To complement the PLS-SEM findings, RII method was used to rank both the identified barriers (section 2) and the types of construction waste (section 3) based on stakeholder perceptions of their significance. The RII method is commonly utilized to determine the relative significance of various criteria or indicators as perceived by respondents. This approach enables a comparative assessment of stakeholder priorities or perceptions regarding specific factors. The RII values range from 0 to 1 (excluding 0), with higher values indicating greater perceived importance of a given criterion within the context of the survey. The RII formula used is (Aravindh et al., 2022):
Where, n1—number of respondents who selected “Extremely Low.”
n2—number of respondents who selected “Low.”
n3—number of respondents who selected “Moderate.”
n4—number of respondents who selected “High.”
n5—number of respondents who selected “Extremely High.”
A—highest value of the scale = 5 in this study.
N—total number of respondents.
This analysis enabled the identification of the most critical barriers affecting LC adoption in the UAE, complementing the PLS-SEM analysis by offering a practical ranking of barrier significance. The combined use of PLS-SEM and RII provided both statistical validation and managerial prioritization, ensuring that the study findings were theoretically grounded and practically relevant.
Furthermore, in addition to ranking the identified barriers to LC adoption in the UAE, RII method was also applied to assess and rank construction waste generation patterns across three distinct dimensions (analysis carried out on data obtained from section 3 of the survey):
-
By Construction Waste Type: Respondents rated the frequency of occurrence for 10 common categories of construction waste given in Table 2, derived from literature and previous regional studies.
-
By Lean Waste Category: Participants assessed the frequency of waste occurrence corresponding to the eight Lean waste types from Table 1.
-
By Construction Project Phase: Respondents indicated the project stages mentioned in Table 3, during which waste generation is most prevalent.
This combined RII approach enabled both diagnostic and comparative evaluation of waste generation trends, helping to identify the most critical sources and phases of waste within UAE construction projects. The detailed results of this analysis are presented in section 4.2.3.
Integration of Barrier–Waste Analysis for Developing Recommendations.
In addition to the above-mentioned quantitative analyses, the study included an interpretive step that connected the identified barriers to their corresponding Lean and construction waste types, as summarized in Table 4. This linkage was established through literature synthesis and cross-referencing, ensuring theoretical consistency with established LC principles. The purpose of this association was to clarify how specific implementation barriers contribute to distinct waste streams within the UAE’s building construction context.
Furthermore, this interpretive step was extended through the integration of results from the PLS-SEM and RII analyses in section 4.3. While the PLS-SEM model revealed the relative influence of barrier constructs, such as managerial, attitudinal, and knowledge-related factors, on stakeholder perceptions toward LC adoption, the RII analysis identified the most critical barriers and waste types as perceived by practitioners. Synthesizing these findings allowed for a deeper understanding of how conceptual barriers translate into operational inefficiencies and waste patterns.
The results of this analytical integration directly informed the development of the strategic recommendations presented in section 4.4. By identifying which barriers are most closely tied to particular forms of waste and how these relationships manifest statistically and practically, the recommendations were designed to address both the root causes of waste management inefficiency and their outcomes. This integration ensured that the proposed strategies for enhancing LC adoption were explicitly aligned with waste reduction objectives and provided the analytical basis for the synthesized interpretation presented in section 4.3, which in turn guided the development of the strategic recommendations in section 4.4.
Overall, this methodological design provides a rigorous and context-specific evaluation of how LC is perceived in the UAE, offering insights into key implementation barriers and informing strategic interventions for effective construction waste management in the country’s building sector using LC.
4 Results and discussion
4.1 Demographic information
The first section of the survey was designed to gather general demographic information about the respondents, enabling a contextual understanding of their professional backgrounds and the characteristics of their respective organizations. This information provides essential context for interpreting the subsequent responses related to LC implementation and perceptions. A summary of the demographic data is presented in Table 6.
Table 6
| Sl. no. | Item | Demographics | Percentage of respondents |
|---|---|---|---|
| 1. | Age group | 25–35 years old | 81.8 |
| 35–45 years old | 9.1 | ||
| 45–55 years old | 5.2 | ||
| More than 55 years old | 3.9 | ||
| 2. | Affiliation of organization | Client | 18.2 |
| Consultant | 35.1 | ||
| Contractor | 36.4 | ||
| Other | 10.4 | ||
| 3. | Education level | Bachelors degree | 41.6 |
| Masters degree | 55.8 | ||
| Doctoral (PhD) degree | 2.6 | ||
| Post doctoral degree | 0 | ||
| 4. | Years of experience | 0–5 years | 41.6 |
| 5–10 years | 37.7 | ||
| 10–15 years | 7.8 | ||
| 15–20 years | 6.5 | ||
| 20–25 years | 0 | ||
| >20 years | 6.5 | ||
| 5. | Construction sector | Residential villas | 18.2 |
| Residential buildings (G + 5) | 31.2 | ||
| Residential buildings (G + 10) | 14.3 | ||
| Residential buildings (>G + 10) | 15.6 | ||
| Commercial (malls, offices, etc.) | 9.1 | ||
| Industrial buildings (warehouses, etc.) | 3.9 | ||
| Infrastructure | 6.5 | ||
| Other | 1.3 | ||
| 6. | Age of the organization | 0–10 years | 61 |
| 10–20 years | 19.5 | ||
| 20–30 years | 7.8 | ||
| More than 30 years | 11.7 | ||
| 7. | Size of the organization (based on approx. Number of employees) | Less than 100 employees | 27.3 |
| 100–250 employees | 49.4 | ||
| 250–500 employees | 6.5 | ||
| More than 500 employees | 16.9 | ||
| 8. | Is Lean Construction principles already implemented at the respondents’ organization? | Yes | 20.8 |
| No | 79.2 |
Results of the demographics information from section 1 of the survey.
This demographic data reveals that a significant majority of respondents (81.8%) were between 25 and 35 years old, indicating a relatively young professional cohort. Most respondents held at least a Master’s degree (55.8%), and over 79% were affiliated with contracting or consulting firms. The predominant involvement was in residential construction, especially mid-rise buildings (G + 5), followed by high-rise and villa projects. Additionally, only 20.8% reported that LC principles were already implemented in their organizations.
This demographic composition accurately represents the current profile of the UAE’s building construction workforce, which is characterized by a relatively young and operationally engaged professional base. Importantly, the low proportion of respondents with LC experience aligns with the study’s focus on identifying barriers to adoption rather than evaluating mature implementation. The perspectives of these professionals therefore provide direct insight into the practical, managerial, and cultural factors that currently limit LC diffusion across the sector. However, as most participants are general construction practitioners rather than LC specialists, the results are intended to represent industry-wide perceptions rather than expert evaluations.
4.2 Perception toward lean construction implementation in the UAE’S building construction sector
The responses collected from section 2 of the survey were utilized to perform both Partial Least Squares Structural Equation Modeling (PLS-SEM) and Relative Importance Index (RII)-based analyses, while responses from section 3 were analyzed using RII alone. Participants rated each item using a five-point Likert scale, ranging from “Extremely High” to “Extremely Low.” For analytical purposes, these qualitative responses were converted to corresponding numerical values on a scale from 5 to 1, respectively. The transformed data were then employed to assess the perceived significance and interrelationships of the identified indicators and barriers related to LC adoption within the UAE construction sector.
4.2.1 Partial least squares-structural equation modeling analysis
The responses obtained from this section of the survey were imported into SmartPLS 4 for conducting the Partial Least Squares Structural Equation Modeling (PLS-SEM) analysis. The relatively small sample size limits the generalizability of the results. The study should thus be considered exploratory, providing initial insights to guide future large-scale research.
This method is employed to determine the existence and strength of statistically significant linear relationships among constructs, making it highly effective for developing and testing theoretical frameworks. In the current study, PLS-SEM was utilized to investigate the interconnections among the identified constructs and to evaluate the validity of the proposed research model. The analysis involved repeated iterations using the PLS algorithm and bootstrapping procedures to compute path coefficients and assess their statistical significance. These results provide insights into the relationships and relative influence among the factors under investigation. The hypotheses presented in section 2.5 (and Figure 3) were tested using PLS-SEM to evaluate the relationships between the identified barrier constructs and LC implementation perceptions.
Firstly, the measuremental model was evaluated for its indicator reliability and validity. Reliability pertains to the consistency and stability of the measurement instruments employed in a study. In the context of PLS-SEM, reliability is assessed through two key components: individual item reliability and internal consistency (Hair et al., 2021a; Hair et al., 1998). Individual item reliability is typically evaluated using factor loadings, with values exceeding 0.60 considered acceptable (Fornell and Larcker, 1981), while the internal consistency is assessed through Composite Reliability (CR) and Cronbach’s alpha. Cronbach’s alpha measures the extent to which items within a construct are interrelated, providing an estimate of the shared variance among the indicators relative to the total variance (Collins, 2007; DeVellis, 2005). Values of Cronbach’s alpha range between 0 and 1, with values above 0.70 generally indicating a high level of internal consistency of a factor.
Conversely, validity refers to the degree to which the measurement instrument accurately captures the intended constructs. Two primary forms of validity assessed in this study are convergent validity and discriminant validity. Convergent validity reflects the extent to which multiple indicators of the same construct are correlated, and is evaluated using Average Variance Extracted (AVE). An AVE value above 0.50 is recommended to establish adequate convergent validity (Hair et al., 2021a; Bagozzi and Yi, 1988). Discriminant validity, on the other hand, assesses the extent to which a construct is truly distinct from other constructs. It is commonly evaluated using the Heterotrait–Monotrait (HTMT) criterion (Fornell and Larcker, 1981), which compares the average correlations between indicators of different constructs (heterotrait) with those of the same construct (monotrait) (Hair et al., 2021a; Henseler et al., 2015). When the HTMT ratio is below a specified threshold, typically 0.85 or 0.90, it indicates good discriminant validity, confirming that the constructs are distinct and not capturing the same underlying concept.
As presented in Table 7, the factor loadings for all items in this study exceed 0.70, thereby satisfying the threshold for individual item reliability. Furthermore, both the Cronbach’s alpha and Composite Reliability values for all constructs are above 0.70, indicating strong internal consistency. Additionally, the AVE values for all constructs are greater than 0.50, confirming acceptable convergent validity. These results collectively demonstrate that the measurement model exhibits robust reliability and validity.
Table 7
| Sl. no. | Dimension/barriers | Item | Factor loading | Cronbach’s alpha | Composite reliability (CR) | Variance extraction (AVE) |
|---|---|---|---|---|---|---|
| 1 | Overall Knowledge/awareness (K)—perception | K1 | 0.846 | 0.858 | 0.922 | 0.695 |
| 2 | K2 | |||||
| 3 | K3 | |||||
| 4 | K4 | |||||
| 5 | Overall attitude (A)—perception | A1 | 0.925 | 0.959 | 0.964 | 0.83 |
| 6 | A2 | |||||
| 7 | A3 | |||||
| 8 | A4 | |||||
| 9 | A5 | |||||
| 10 | A6 | |||||
| 11 | Overall management (M)—perception | M1 | 0.849 | 0.711 | 0.894 | 0.152 |
| 12 | M2 | |||||
| 13 | M3 | |||||
| 14 | M4 | |||||
| 15 | M5 | |||||
| 16 | M6 | |||||
| 17 | M7 | |||||
| 18 | M8 | |||||
| 19 | M9 | |||||
| 20 | M10 | |||||
| 21 | M11 | |||||
| 22 | M12 | |||||
| 23 | M13 | |||||
| 24 | M14 | |||||
| 25 | M15 | |||||
| 26 | M16 | |||||
| 27 | M17 | |||||
| 28 | Overall government (G)—perception | G1 | 0.948 | 0.89 | 0.924 | 0.818 |
| 29 | G2 | |||||
| 30 | G3 | |||||
| 31 | Overall financial (F)—Perception | F1 | 0.87 | 0.846 | 0.92 | 0.672 |
| 32 | F2 | |||||
| 33 | F3 | |||||
| 34 | F4 | |||||
| 35 | Overall material requirement and equipments (R)—perception | R1 | 0.9 | 0.888 | 0.93 | 0.814 |
| 36 | R2 | |||||
| 37 | R3 | |||||
| 38 | Overall technical (T)—perception | T1 | 0.895 | 0.657 | 0.899 | 0.568 |
| 39 | T2 | |||||
| 40 | T3 | |||||
| 41 | T4 | |||||
| 42 | T5 | |||||
| 43 | Overall others (O)—perception | O1 | 0.887 | 0.716 | 0.923 | 0.51 |
| 44 | O2 | |||||
| 45 | O3 | |||||
| 46 | O4 |
Measurement model parameter estimation from PLS-SEM analysis.
In addition to AVE and composite reliability, discriminant validity was confirmed using the Heterotrait–Monotrait (HTMT) criterion. All HTMT ratios ranged between 0.42 and 0.81, remaining below the conservative threshold of 0.85. These results confirm that each construct is empirically distinct from the others, satisfying the discriminant validity requirement for SEM analysis. The validity results further confirmed that the refined constructs retained theoretical coherence following expert validation.
Furthermore, the Standardized Root Mean Square Residual (SRMR) is a widely used goodness-of-fit index in PLS-SEM to evaluate the adequacy of the overall model. The SRMR value ranges between 0 and 1, with a value below 0.08 generally indicating a satisfactory model fit (Hu and Bentler, 1998). In this study, the SRMR value obtained for the model is 0.0601, thereby confirming that the model demonstrates a good fit. The model fit indices, including the SRMR value, are presented in Table 8. It is important to note that the SRMR value was derived directly from the SmartPLS 4 output using the bootstrapped PLS algorithm. Although an SRMR of 0.0601 indicates a satisfactory model fit, caution is warranted when interpreting this value given the relatively small sample size. In small-sample PLS-SEM models, fit indices can be somewhat optimistic due to limited data variability and reduced model complexity (Hair et al., 2021b). Therefore, the reported SRMR should be viewed as indicative rather than conclusive evidence of overall model adequacy. Despite this limitation, the consistency of other model diagnostics, such as high factor loadings, and strong reliability and validity measures, supports the robustness of the model.
Table 8
| Dimension correlation | VIF | Model fit |
|---|---|---|
| Overall K (K1–K4)—perception | 1.244 | SRMR = 0.0601 |
| Overall A (A1–A6)—perception | 1.365 | |
| Overall M (M1–M17)—perception | 1.408 | |
| Overall G (G1–G3)—perception | 1.586 | |
| Overall F (F1–F4)—perception | 1.078 | |
| Overall R (R1–R3)—perception | 1.455 | |
| Overall T (T1–T5)—perception | 1.753 | |
| Overall O (O1–O4)—perception | 1.722 |
Collinearity and model fit results from PLS-SEM.
In addition to model fit, assessing multicollinearity is essential in Structural Equation Modeling (SEM) to ensure the validity of the parameter estimates. Multicollinearity is examined using the Variance Inflation Factor (VIF), where values less than 5 are indicative of acceptable levels of collinearity (Huang, 2021). All VIF values in this study fall well below the threshold of 5, as shown in Table 8, confirming the absence of multicollinearity among the latent constructs.
Next, the results from the path analysis were utilized to examine and explain the structural model verification. In the path analysis, the T-value is used to determine whether the hypothesis is valid or not (Huang, 2021). The path coefficient (β) represents the strength and direction of the relationship between each independent variable (K, A, M, G, F, R, T, O) and the dependent variable (stakeholder perception). A higher β value indicates a stronger positive influence. In this study, as seen in Table 9, all β values range from 0.871 to 0.944, reflecting strong positive relationships between each category of barrier and stakeholder perceptions of LC. Further, to evaluate the statistical significance of each relationship, T-values and p-values were analyzed. The T-value determines the statistical significance of the relationship between variables: a T-value greater than 1.96 corresponds to a significance level of 0.05, greater than 2.58 corresponds to 0.01, and greater than 3.29 indicates a highly significant relationship at 0.001. In this study, all eight hypothesized paths (H1 through H8) reported T-values significantly greater than 3.29 and p-values less than 0.001, confirming that each hypothesis is statistically significant and valid.
Table 9
| Path analysis | Path coefficient (β) | T-value | p-value | Hypothesis |
|---|---|---|---|---|
| Overall K—perception | 0.883 | 64.238 | 0.000 | H1 valid |
| Overall A—perception | 0.944 | 104.322 | 0.000 | H2 valid |
| Overall M—perception | 0.871 | 12.431 | 0.000 | H3 valid |
| Overall G—perception | 0.936 | 88.367 | 0.000 | H4 valid |
| Overall F—perception | 0.894 | 65.460 | 0.000 | H5 valid |
| Overall R—perception | 0.915 | 94.150 | 0.000 | H6 valid |
| Overall T—perception | 0.897 | 43.336 | 0.000 | H7 valid |
| Overall O—perception | 0.905 | 36.261 | 0.000 | H8 valid |
Path analysis verification and examination.
These findings reinforce the robustness of the proposed model and confirm that various factors—including knowledge, awareness, managerial, governmental, financial, resource-based, technical, and other barriers—significantly shape stakeholder perceptions toward LC adoption in the UAE’s building construction sector. The results underscore the multifaceted nature of resistance toward LC adoption and validate the importance of addressing these dimensions holistically. The validated structural model, as generated using SmartPLS 4, is illustrated in Figure 5.
Figure 5
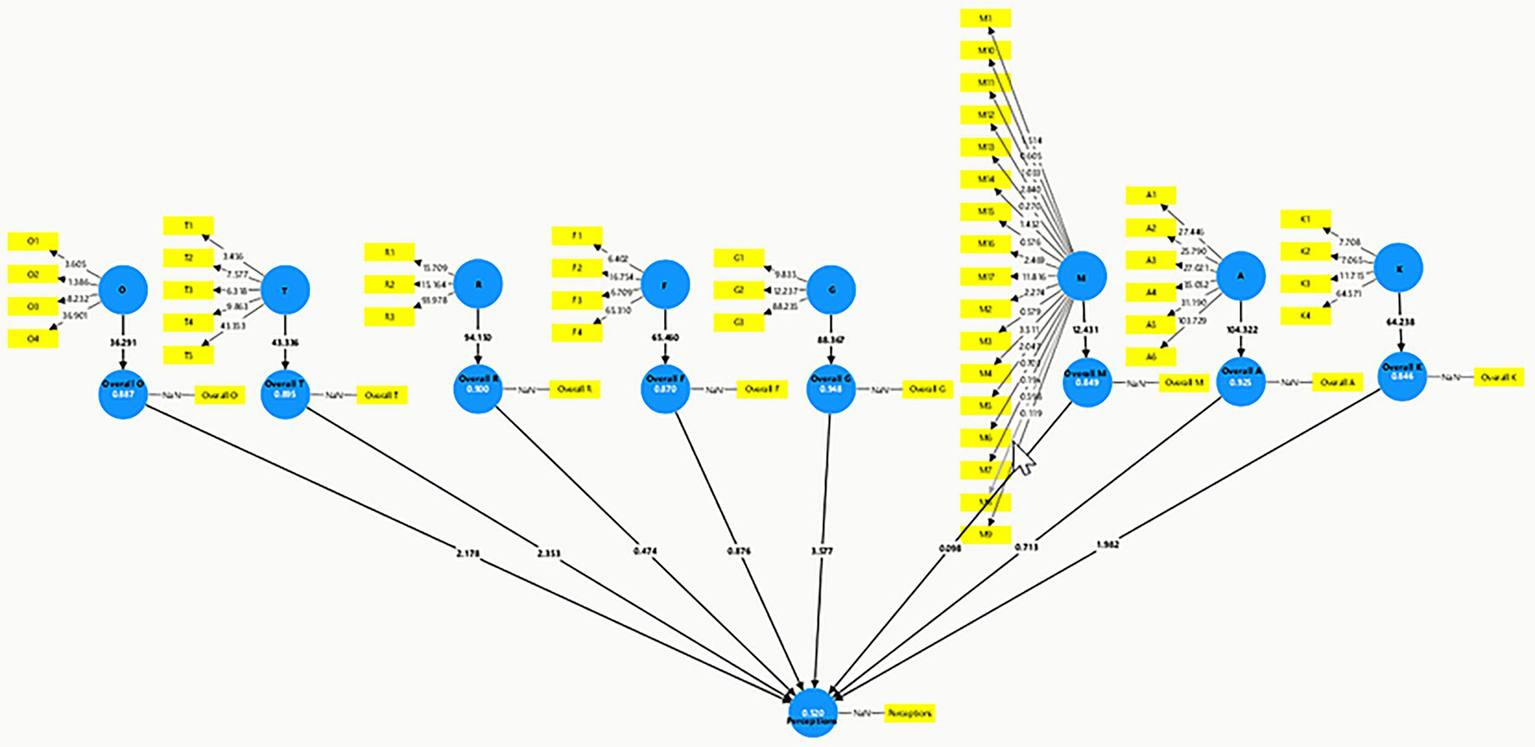
PLS-SEM path diagram generated from SmartPLS 4 software analysis.
In addition, the coefficient of determination (R2) and the effect size (f2) are key indicators used in PLS-SEM to assess the explanatory power of the structural model constructs (Huang, 2021). The R2 value, which ranges from 0 to 1, indicates the proportion of variance in the endogenous (dependent) variable explained by the exogenous (independent) constructs. An R2 value of approximately 0.50 is considered to reflect moderate explanatory power, whereas values closer to 1.0 denote strong explanatory capacity. As shown in Table 10, the R2 values obtained in this study are consistently high, suggesting that the structural model provides a high degree of explanation of the variance in stakeholder perceptions toward LC implementation in the UAE building construction sector.
Table 10
| Path analysis | R 2 | R2 Adjusted | f 2 |
|---|---|---|---|
| Overall K—perception | 0.780 | 0.777 | 0.179 |
| Overall A—perception | 0.891 | 0.890 | 3.208 |
| Overall M—perception | 0.759 | 0.756 | 1.510 |
| Overall G—perception | 0.876 | 0.874 | 0.287 |
| Overall F—perception | 0.800 | 0.797 | 0.021 |
| Overall R—perception | 0.837 | 0.835 | 0.005 |
| Overall T—perception | 0.805 | 0.802 | 0.109 |
| Overall O—perception | 0.819 | 0.817 | 0.099 |
R2 and f2 values from PLS-SEM analysis.
Furthermore, the effect size (f2) is used to evaluate the impact of individual exogenous variables on the endogenous construct. According to established guidelines, an f2 value between 0.02 and 0.15 represents a small effect, between 0.15 and 0.35 indicates a medium effect, and values above 0.35 denote a large effect. As detailed in Table 10, the constructs of Attitude (f2 = 3.208) and Management (f2 = 1.510) exhibit large effect sizes, indicating a substantial contribution to stakeholders’ perception of LC. In contrast, Knowledge/Awareness (f2 = 0.179) and Government (f2 = 0.287) demonstrate medium-level explanatory power. Other factors such as Financial, Resource, Technical, and Other aspects reflect lower f2 values, suggesting smaller effect sizes in the model.
It may be mentioned here that, although all eight hypothesized paths (H1–H8) were found to be statistically significant (p < 0.5), this uniform significance pattern is consistent with theoretical expectations rather than indicative of model artifacts. LC adoption is a multidimensional process that depends on the concurrent functioning of managerial, technical, financial, policy and attitudinal enablers. Hence, the presence of consistently significant relationships across constructs reflects the integrated nature of these barriers in influencing stakeholder perceptions. Moreover, the variation observed in the standardized path coefficients and effect size (f2) values confirms that while all relationships are significant, their relative strength differs. Together with low VIF values (<5.0), these results demonstrate that the model is neither overfitted nor multicollinear, but rather captures the systemic and interrelated dynamics of LC implementation in the UAE context.
4.2.2 Relative importance index and ranking of barriers to LC adoption in the UAE building construction sector
The numerically scaled responses obtained from section 2 of the survey were subsequently employed to conduct a Relative Importance Index (RII) analysis, followed by an RII-based ranking of the indicators.
The analysis of Table 11, with barriers ranked individually within each construct, reveals key impediments to LC implementation in the UAE. In the Knowledge/Awareness category, the most pressing issue is K1: Lack of knowledge about lean concepts within public procurement, emphasizing a critical institutional knowledge gap. K2: Lack of awareness programs follows, suggesting limited initiatives to disseminate lean knowledge. Within the Attitude construct, A6: Inability to change organizational culture ranks first, indicating that entrenched cultural norms pose a major obstacle. Other attitudinal concerns include A2: Resistance to new ideas and A1: Selfishness among professionals, which reflect behavioral inertia within project teams. These findings underline the need for both top-down policy reform and bottom-up mindset shifts.
Table 11
| Sl. No. | Dimension/barriers | Item | RII | Ranking |
|---|---|---|---|---|
| 1 | Knowledge/awareness (K) | K1 | 0.805195 | 1 |
| 2 | K2 | 0.768831 | 2 | |
| 3 | K3 | 0.662338 | 3 | |
| 4 | K4 | 0.662338 | 3 | |
| 5 | Attitude (A) | A1 | 0.636364 | 3 |
| 6 | A2 | 0.654545 | 2 | |
| 7 | A3 | 0.579221 | 4 | |
| 8 | A4 | 0.568831 | 5 | |
| 9 | A5 | 0.535065 | 6 | |
| 10 | A6 | 0.724675 | 1 | |
| 11 | Management (M) | M1 | 0.755844 | 5 |
| 12 | M2 | 0.574026 | 16 | |
| 13 | M3 | 0.685714 | 12 | |
| 14 | M4 | 0.566234 | 17 | |
| 15 | M5 | 0.732468 | 8 | |
| 16 | M6 | 0.766234 | 2 | |
| 17 | M7 | 0.722078 | 10 | |
| 18 | M8 | 0.727273 | 9 | |
| 19 | M9 | 0.753247 | 6 | |
| 20 | M10 | 0.776623 | 1 | |
| 21 | M11 | 0.766234 | 2 | |
| 22 | M12 | 0.649351 | 14 | |
| 23 | M13 | 0.758442 | 4 | |
| 24 | M14 | 0.618182 | 15 | |
| 25 | M15 | 0.753247 | 6 | |
| 26 | M16 | 0.698701 | 11 | |
| 27 | M17 | 0.667532 | 13 | |
| 28 | Government (G) | G1 | 0.768831 | 1 |
| 29 | G2 | 0.698701 | 3 | |
| 30 | G3 | 0.745455 | 2 | |
| 31 | Financial (F) | F1 | 0.781818 | 1 |
| 32 | F2 | 0.693506 | 3 | |
| 33 | F3 | 0.766234 | 2 | |
| 34 | F4 | 0.680519 | 4 | |
| 35 | Material requirement and equipments (R) | R1 | 0.787013 | 1 |
| 36 | R2 | 0.542857 | 3 | |
| 37 | R3 | 0.688312 | 2 | |
| 38 | Technical (T) | T1 | 0.781818 | 1 |
| 39 | T2 | 0.722078 | 2 | |
| 40 | T3 | 0.633766 | 4 | |
| 41 | T4 | 0.584416 | 5 | |
| 42 | T5 | 0.638961 | 3 | |
| 43 | Others (O) | O1 | 0.703896 | 4 |
| 44 | O2 | 0.722078 | 3 | |
| 45 | O3 | 0.771429 | 2 | |
| 46 | O4 | 0.78961 | 1 |
RII values and ranking of indicators/barriers within a construct.
From the management category, M10: Unclear project definitions and outcomes emerges as the top barrier, demonstrating how ambiguous goals hinder LC execution. It is followed by M6: Slow decision-making and M11: Centralized authority, showing that hierarchical bottlenecks significantly impede agility. In the Government construct, G1: Lack of supportive laws and regulations is the foremost barrier, highlighting the policy vacuum around LC adoption. Financially, F1: Lack of funding is the most critical, underscoring the investment risk firms perceive. The Material and Equipment category is led by R1: Scarcity of materials suitable for LC, and the Technical barriers by T1: Poor performance measurement strategies. Lastly, in the Other barriers group, O4: Lack of integrity in the production chain takes the top spot, pointing to trust and coordination deficits across stakeholders. This structured view shows that critical barriers vary across domains but consistently reflect systemic, managerial, and cultural weaknesses that must be targeted simultaneously.
Meanwhile, Table 12, which presents a consolidated ranking of the 46 identified barriers based on their RII value, provide a sharper lens on the specific factors most obstructing LC implementation in the UAE.
Table 12
| Item | Barrier | RII | Ranking |
|---|---|---|---|
| K1 | Lack of knowledge about lean concepts including LC within the public procurement procedure | 0.805195 | 1 |
| O4 | Lack of integrity in the production chain including clients, materials, suppliers, and subcontractors | 0.78961 | 2 |
| R1 | Scarcity of materials suitable for LC implementation | 0.787013 | 3 |
| F1 | Lack of funding to start the implementation of lean construction in the company | 0.781818 | 4 |
| T1 | Poor performance measurements strategies | 0.781818 | 4 |
| M10 | Unclear project definition and outcomes | 0.776623 | 6 |
| O3 | Long implementation period | 0.771429 | 7 |
| K2 | Lack of awareness programs | 0.768831 | 8 |
| G1 | Lack of supportive government laws and regulations that helps to implement lean construction | 0.768831 | 8 |
| M6 | Slow decision-making as a result of complex organization hierarchy | 0.766234 | 10 |
| M11 | Centralization of decision under single authority | 0.766234 | 10 |
| F3 | Unsteady price of commodities | 0.766234 | 10 |
| M13 | Poor leadership | 0.758442 | 13 |
| M1 | Inadequate pre-planning | 0.755844 | 14 |
| M9 | Lack of support from top management | 0.753247 | 15 |
| M15 | Poor communication among participants of the production process (managers, administrators, foremen, etc.) | 0.753247 | 15 |
| G3 | Government bureaucracy and instability | 0.745455 | 17 |
| M5 | Lack of supply chain integration | 0.732468 | 18 |
| M8 | Lengthy approval procedure from top management | 0.727273 | 19 |
| A6 | Inability to change the organizational culture | 0.724675 | 20 |
| M7 | Contractors and specialists rarely involved in the planning and design phase | 0.722078 | 21 |
| T2 | Lack of software advancement that helps in implementing LC | 0.722078 | 21 |
| O2 | Dependence on many subcontractors | 0.722078 | 21 |
| O1 | Difficulty nature of construction industry | 0.703896 | 24 |
| M16 | Lack of long-term commitments to innovation and change within the company | 0.698701 | 25 |
| G2 | Inconsistent governmental policies (not constant and steady) over time | 0.698701 | 25 |
| F2 | Poor salaries of professionals | 0.693506 | 27 |
| R3 | Limited use of off-site construction techniques and prefabrication | 0.688312 | 28 |
| M3 | Lack of information sharing | 0.685714 | 29 |
| F4 | Low tender prices | 0.680519 | 30 |
| M17 | Lack of teamwork | 0.667532 | 31 |
| K3 | Unskilled labor and low level of education of the site foreman | 0.662338 | 32 |
| K4 | Lack of experiences | 0.662338 | 32 |
| A2 | Stick to the old ways and refuse to use new ideas | 0.654545 | 34 |
| M12 | Lack of motivation for the employees to learn about lean construction | 0.649351 | 35 |
| T5 | Complexity of LC implementation | 0.638961 | 36 |
| A1 | Selfishness among professionals | 0.636364 | 37 |
| T3 | Lack of agreed implementation methodology | 0.633766 | 38 |
| M14 | Lack of transparency | 0.618182 | 39 |
| T4 | Logistics problems | 0.584416 | 40 |
| A3 | Labor considers LC too complex | 0.579221 | 41 |
| M2 | Lack of employee training and continuous improvement in lean construction | 0.574026 | 42 |
| A4 | Fear of unfamiliar activities | 0.568831 | 43 |
| M4 | Poor communication between project parties | 0.566234 | 44 |
| R2 | Inadequate equipment to implement LC methods | 0.542857 | 45 |
| A5 | Lack of self-criticism | 0.535065 | 46 |
RII-based ranked barriers.
The top-ranked barrier is K1: Lack of knowledge about lean concepts including LC within the public procurement procedure (RII = 0.8052). This highlights a systemic issue—lean principles are not yet embedded in the country’s tendering, contract design, or procurement regulations. Public sector projects in the UAE tend to emphasize lowest-cost bids over long-term efficiency or value-driven delivery, limiting opportunities for LC-aligned practices.
Closely following is O4: Lack of integrity in the production chain (RII = 0.7896), which reflects the UAE’s heavily subcontracted and fragmented construction ecosystem. With a multilayered supply chain often involving consultants, subcontractors, and imported materials, misalignment across stakeholders obstructs the continuous flow and transparency required by lean frameworks.
Next, R1: Scarcity of materials suitable for LC (RII = 0.7870), further complicates implementation. The UAE’s reliance on imported construction materials, combined with limited local standardization and availability of modular or prefabricated components, restricts the feasibility of lean-based inventory and scheduling approaches.
Interestingly, two barriers—F1: Lack of funding and T1: Poor performance measurement strategies, tie in the fourth position, point to practical organizational challenges. Many contractors in the UAE operate on tight margins and prioritize short-term project delivery, lacking both the financial buffers and performance KPIs (Key Performance Indicators) needed for sustained lean transformation.
Several Management-related issues such as M10: Unclear project definition and outcomes, M6: Complex decision-making, and M13: Poor leadership, M9: Lack of support from top management and M15: Poor communication among participants, also appear within the top 15, confirming the pivotal role that managerial processes play in the region. The sixth-ranked barrier, M10 (RII = 0.7766), is especially relevant in the UAE, where fast-track project approvals and shifting client requirements often result in scope ambiguity. This undermines the upfront planning essential for lean success. Meanwhile, M6 (RII = 0.7662) rounds out the top 10 barriers to LC implementation in the UAE’s building construction sector. Hierarchical, top-down structures common in both public and private construction firms hinder agile decision-making, a core requirement of lean environments.
Further, O3: Long implementation period (RII = 0.7714) signals organizational hesitance to commit to lean due to perceived delays in seeing returns. In a highly competitive and fast-paced construction market like the UAE, this perception becomes a significant deterrent.
Tied for eighth are K2: Lack of awareness programs and G1: Lack of supportive government laws and regulations (RII = 0.7688). These point to macro-level gaps—although national strategies like Vision 2030 and Net Zero 2050 highlight sustainability, they do not mandate or incentivize lean practices specifically, and formal training remains rare across firms.
Finally, at the bottom of the ranking are barriers like A5: Lack of self-criticism and R2: Inadequate equipment, which are perceived to have lesser impact, possibly due to their more indirect influence or sector-specific nature.
Overall, the rankings reveal that the most critical barriers span across Knowledge, Organizational, Financial, Technical, and Management domains, implying that successful LC implementation requires a multi-dimensional approach. Targeted interventions such as training programs, production chain optimization, better material planning, and strategic leadership initiatives will be essential to address the highest-impact barriers against LC implementation in the UAE construction sector.
4.2.3 Relative importance index and ranking of waste types generated in the UAE building construction sector
The final section of the survey focused on identifying the types of construction waste commonly encountered at the respondents’ workplaces. Similar to the previous sections, responses were collected using a five-point Likert scale ranging from “Extremely High” (assigned a value of 5) to “Extremely Low” (assigned a value of 1). These numerical responses were subsequently utilized for Relative Importance Index (RII) analysis and corresponding RII-based rankings. This section helped explore multiple aspects related to construction waste, including the frequency of various waste types generated and the construction phases during which waste generation is most prevalent. Additionally, respondents’ perceptions regarding the frequency of waste types, as categorized under LC principles, were also analyzed.
The first question required participants to rank common types of construction waste based on their frequency of occurrence in their respective projects. A summary of the responses is shown in Figure 6. An RII-based ranking of the same was also conducted as shown in Table 13.
Table 13
| Type of construction waste | RII | Ranking |
|---|---|---|
| Packaging waste | 0.787013 | 1 |
| Demolition waste | 0.784416 | 2 |
| Off-cuts and trim waste | 0.680519 | 3 |
| Land clearing waste | 0.657143 | 4 |
| Structural waste | 0.594805 | 5 |
| Non-hazardous waste | 0.587013 | 6 |
| Hazardous waste | 0.579221 | 7 |
| Excavation waste | 0.566234 | 8 |
| Electrical and electronic waste (E-waste) | 0.535065 | 9 |
| Mechanical and plumbing waste | 0.524675 | 10 |
RII-based ranking of the construction waste types.
Figure 6
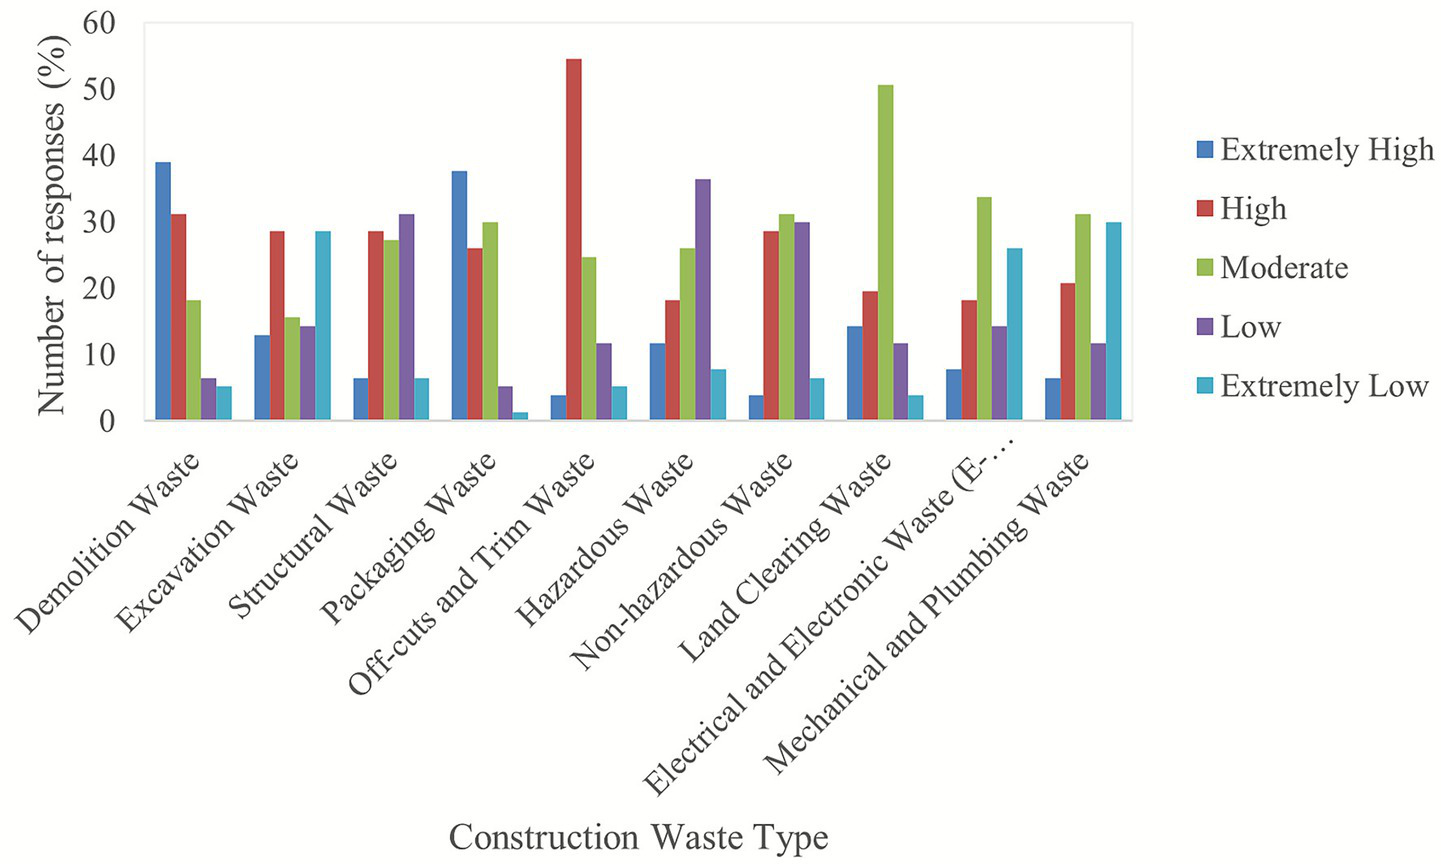
Perceived levels of generation for different types of construction waste in building projects in the UAE.
The RII-based analysis of construction waste types, as shown in Figure 6 and Table 13, highlights “packaging waste” as the most frequently encountered form of waste on construction sites, with the highest RII value of 0.787, supported by nearly 38% of respondents rating its occurrence as “Extremely High.” “Demolition waste” follows closely, also receiving a high proportion of “Extremely High” responses (39%), underscoring its significance in the construction waste stream. Off-cuts and trim waste ranked third and received the highest proportion of “High” responses (54.5%), indicating consistent but slightly less intense generation. Land clearing and structural waste occupied the mid-range of the rankings, suggesting moderate occurrence. In contrast, non-hazardous, hazardous, and excavation wastes had lower RII values, reflecting less frequent generation according to respondents. The least frequently occurring waste types were electrical/electronic waste (E-waste) and mechanical/plumbing waste, corresponding with a high proportion of “Extremely Low” and “Low” responses.
These findings emphasize that packaging and demolition activities are the predominant sources of construction waste in the UAE context, necessitating targeted interventions. In particular, proper disposal of packaging materials, along with efficient pre-planning to ensure only necessary and high-quality materials are brought on-site, can significantly reduce packaging waste generation. While some amount of demolition waste is unavoidable, its environmental impacts may be mitigated through reuse or recycling of components, the selection of sustainable and eco-friendly materials, and the adoption of prefabricated or modular construction systems, which facilitate component reuse across multiple projects.
The subsequent question focused on assessing the frequency of waste generation in relation to LC-recognized waste categories within building construction projects in the UAE. A summary of the respondents’ feedback is presented in Figure 7, while an RII-based ranking of these waste types is provided in Table 14.
Table 14
| Type of LC recognized type of waste | RII | Ranking |
|---|---|---|
| Waiting | 0.784416 | 1 |
| Transportation | 0.719481 | 2 |
| Inventory | 0.711688 | 3 |
| Motion | 0.701299 | 4 |
| Defects | 0.664935 | 5 |
| Overprocessing | 0.638961 | 6 |
| Overproduction | 0.571429 | 7 |
| Underutilized Talent | 0.54026 | 8 |
RII-based ranking of the LC recognized waste type generation.
Figure 7
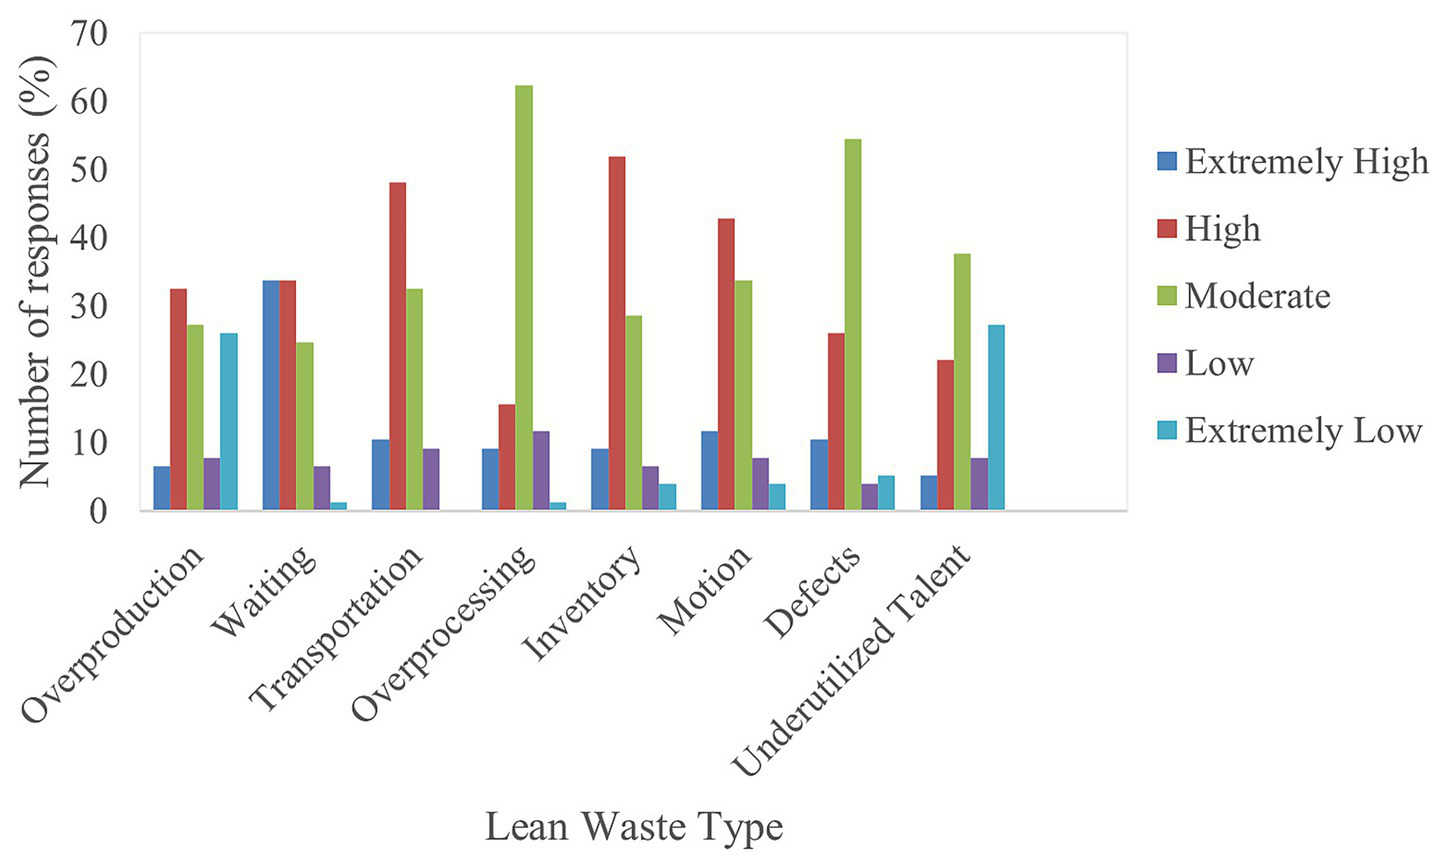
Stakeholder perceptions of LC waste types in UAE building projects.
This analysis reveals that “waiting” waste emerged as the most frequently occurring, with an RII of 0.784 and the greatest proportion of respondents rating it as “Extremely High” or “High” (67.6%). This type of waste typically results from delays in material deliveries, equipment unavailability, or inefficient scheduling, and must be addressed through more robust planning and supply chain coordination to prevent project slowdowns. Transportation waste (ranked second) was also commonly encountered, with 58.5% of respondents identifying it as “High” or “Extremely High,” suggesting logistical inefficiencies and poor site layout as contributing factors. Inventory waste followed closely, indicating overstocking or poor inventory control mechanisms. Similarly, motion waste was frequently reported, further underscoring the need for ergonomic and process-optimized site layouts. Defects, overprocessing, and overproduction received moderate RII scores, indicating recurring issues related to rework, redundant processes, and producing more than what is required—symptoms of inadequate quality control and communication. Interestingly, the least ranked was underutilized talent, with 54.6% of respondents rating its frequency as “Low” or “Extremely Low,” which points to a potential gap in recognizing or fully deploying workforce capabilities. Overall, the findings highlight critical inefficiencies that can be strategically addressed through targeted lean interventions, particularly in planning, logistics, and workforce utilization.
The final question in this section sought to identify the specific phase of a construction project during which waste generation is most significant. Respondents’ perceptions on this aspect are presented in Figure 8, with an RII-based ranking provided in Table 15.
Table 15
| Construction phase | RII | Ranking |
|---|---|---|
| Finishing phase | 0.766234 | 1 |
| Maintenance and repair phase | 0.690909 | 2 |
| Design phase | 0.677922 | 3 |
| Construction phase | 0.576623 | 4 |
| Procurement phase | 0.54026 | 5 |
RII-based ranking of construction phase-based construction waste.
Figure 8
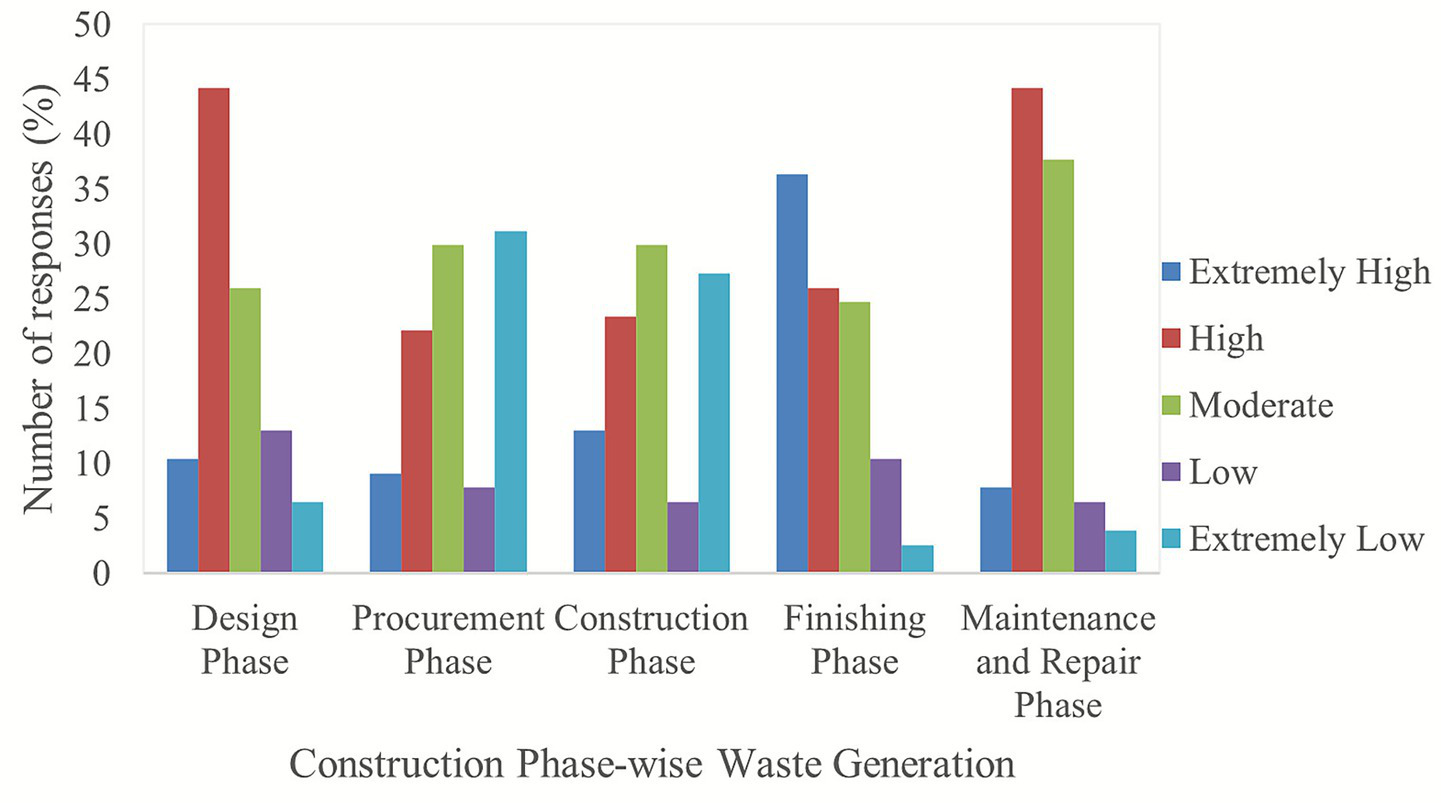
Stakeholder perceptions of waste generation across different construction project phases in the UAE.
The data indicate that the “finishing phase” of construction projects is perceived as the stage during which the greatest volume of waste is generated, with 36.4% of respondents rating it as “Extremely High,” corresponding to the highest RII. This finding reflects the complex material usage and labor-intensive nature of this terminal phase, where suboptimal coordination and execution inefficiencies often result in material surplus and waste. The maintenance and repair phase was also identified as a significant contributor to waste generation, receiving a “High” rating by 44.2% of respondents, underscoring the implications of material durability and upkeep practices on cumulative waste output. The design phase registered a moderate waste frequency, signifying the critical importance of integrating waste mitigation strategies early in project planning to reduce downstream material loss. Conversely, the construction and procurement phases were associated with comparatively lower waste generation, as evidenced by lower RII values and higher percentages of respondents indicating “Extremely Low” waste levels (27.3 and 31.2%, respectively). These outcomes highlight the imperative to intensify waste reduction efforts during the finishing and maintenance phases through meticulous project scheduling, enhanced quality control, and material efficiency. Furthermore, the adoption of durable and environmentally sustainable materials, coupled with proactive and preventive maintenance regimes—such as performing upkeep prior to the actual end-of-life of components—can extend asset longevity and substantially diminish waste production throughout the building lifecycle.
4.3 Integrated interpretation of data analysis using PLS-SEM and RII
This subsection integrates the statistical insights derived from the PLS-SEM analysis with the practical prioritization outcomes obtained through RII analysis, providing a cohesive interpretation of how stakeholder perceptions, barrier significance, and waste generation patterns interrelate within the context of LC implementation in the UAE building sector. While the PLS-SEM analysis identified the strength and direction of relationships between the main barrier constructs and stakeholder perceptions, the RII results revealed the relative prominence of specific individual barriers and waste types as perceived by practitioners. Together, these analyses present a comprehensive empirical picture, linking what influences stakeholder perceptions (from PLS-SEM) with what practitioners’ experience as the most frequent or critical barriers and waste sources (from RII).
The PLS-SEM results established that attitudinal and managerial dimensions have the strongest and most significant influence on stakeholder perceptions of LC adoption, as evidenced by their high path coefficients (β values) and large effect sizes (f2 values). This highlights that LC implementation is driven less by financial or technical capacity and more by human and organizational factors, specifically leadership engagement, team motivation, and openness to process change. Constructs such as knowledge/awareness and government support demonstrated medium effects, suggesting that institutional alignment and education are supportive enablers but not the primary determinants of LC success. These findings collectively indicate that the key to LC implementation lies in transforming organizational culture and management practice rather than merely improving technical procedures.
Meanwhile, the RII-based analysis highlighted which barriers are most frequently encountered in practice and which types of waste occur most often on UAE building construction sites. Managerial and operational barriers, such as poor communication, lack of training, inadequate pre-planning, and insufficient supply chain integration, were ranked highest, demonstrating the industry’s functional inefficiencies. Similarly, the RII analysis of waste types revealed that waiting, transportation, and inventory wastes, as well as packaging and demolition wastes, were the most prevalent, especially during the finishing and maintenance phases of projects. These waste categories reflect time losses, excessive movement, and overstocking, all of which can be traced to weaknesses in managerial planning, logistical coordination, and on-site supervision.
The results of both analytical methods thus complement one another: PLS-SEM explains why LC implementation faces obstacles (by identifying the influential conceptual dimensions), while RII shows where and how these barriers manifest operationally (in material handling, workflow, and project phases). Attitudinal and managerial deficiencies, shown as dominant constructs in the structural model, translate in practice into recurrent wastes linked with scheduling delays, miscommunication, and inefficient logistics. Likewise, technical and knowledge-based barriers identified in the RII analysis correspond to defect, underutilized talent and overprocessing waste types, where rework, redundant effort, or poor-quality outputs occur due to inadequate technical competence or unclear work procedures.
This integrated interpretation strengthens the explanatory validity of the study by connecting behavioral, managerial, and operational dimensions to observable patterns of construction waste. It underscores that LC implementation and waste management are inherently interdependent, systemic organizational weaknesses manifest as physical and process-level wastes. Addressing such barriers through enhanced training, collaborative decision-making, digital resource monitoring, and Lean-aligned planning practices can therefore yield measurable reductions in material waste and improve overall project efficiency.
Thus, the integration of PLS-SEM and RII results provides a holistic understanding of the current state of LC adoption in the UAE. It confirms that the successful reduction of construction waste cannot be achieved solely through technological or procedural improvements but requires a parallel transformation in organizational culture, leadership behavior, and stakeholder engagement.
The findings of this study align with and extend the insights of previous research on LC adoption, particularly within developing and Middle Eastern contexts. The strong influence of managerial and attitudinal barriers (high effect sizes) observed in the UAE reflects observations by Sarhan and Fox (2012), who emphasized that cultural resistance, poor collaboration, and lack of leadership are key impediments to LC implementation. These results affirm that the success of LC is contingent on the organizational mindset and leadership engagement.
Moreover, the moderate role of governmental and educational barriers in this study is consistent with findings by Musa et al. (2023), who emphasized that awareness and training are necessary precursors for successful Lean implementation. However, the present study builds on this by suggesting that such enablers, while important, may not be sufficient in the UAE context without concurrent managerial commitment and attitudinal change. This points to a broader systems-level challenge, where improving knowledge must be accompanied by leadership-driven organizational transformation to create an enabling environment for LC.
In terms of waste types, the high frequency of packaging and demolition waste, as well as waiting and transportation waste, reflects broader logistical and planning inefficiencies often noted in UAE construction projects (Al-Hajj and Hamani, 2011). The observed concentration of waste in the finishing and maintenance phases also further suggests that LC interventions in the UAE should be extended beyond early project stages to ensure full life-cycle efficiency.
In contrast, Bajjou and Chafi (2019), examining the Moroccan construction industry, highlighted lack of knowledge about Lean practices, insufficient financial resources, and unskilled labor as the most critical barriers to LC implementation. While these factors were also found to be significant in the present study, they did not exert the strongest influence on stakeholder perceptions in the UAE. Instead, the UAE context suggests that even when a technically skilled workforce and financial resources are moderately available, attitudinal inertia and managerial inefficiencies may still obstruct LC adoption. This divergence underscores the context-specific nature of LC challenges and the necessity for locally grounded strategies.
Overall, the current study extends prior research by offering an integrated, empirically validated model that combines structural equation modeling with practical ranking analyses. This dual-method approach enhances understanding of how theoretical constructs and operational waste patterns co-exist and interact within the UAE construction sector. These synthesized insights form the empirical foundation for the strategic recommendations outlined in the following section.
4.4 Enhancing lean construction implementation for waste management in the UAE building sector: practical insights
As shown in Table 4, each barrier was mapped to its corresponding Lean and construction waste types to illustrate the mechanisms through which challenges in LC implementation translate into waste management inefficiencies. Building on this mapping and the comprehensive analysis of stakeholder perceptions, several targeted recommendations are proposed to facilitate the effective adoption of LC principles in the UAE’s building construction sector. The analysis revealed that barriers span multiple dimensions, including knowledge gaps, attitudinal resistance, managerial inefficiencies, technical limitations, financial constraints, and systemic issues across different project phases. To overcome these multifaceted obstacles, a strategic and coordinated approach is essential, one that integrates improvements in project management, organizational culture, workforce capacity, and regulatory support. These insights collectively provide the empirical foundation for the recommendations presented in this section. By addressing the specific barriers that lead to distinct waste types, particularly those barriers that have been ranked higher in stakeholder concern within this study, the following recommendations operationalize LC principles as a practical framework for reducing material, time, and process waste in UAE construction projects.
Firstly, enhancing communication among all stakeholders is critical. Clear, timely, and transparent communication reduces uncertainties, improves coordination, and fosters a culture of trust and collaboration across disciplines. This is especially important given the prevalence of waiting and transportation wastes, which are symptomatic of poor scheduling, unclear task dependencies and logistical inefficiencies. These challenges are closely tied to O4 (lack of integrity in the production chain), one of the highest-ranked barriers in the study, which reflects systemic fragmentation and poor integration across clients, subcontractors, and suppliers. As such, contractors and consultants must take the lead in implementing digital collaboration and visualization platforms such as Building Information Modeling (BIM) dashboards and Last Planner® System (LPS) interfaces to improve transparency in task sequencing and resource allocation. In addition, regular short “lean huddle” meetings and shared digital progress trackers can synchronize on-site activities, reduce idle time, and enhance workflow reliability, while also empowering team members in decision-making, and further enhancing engagement and shared accountability.
Secondly, the construction industry in the UAE should pursue a culture of continuous improvement to drive sustained enhancements in productivity, cost-efficiency, and quality. This is especially necessary given the high-priority barriers related to K1 (lack of lean knowledge in procurement) and K2 (lack of awareness programs). To achieve this culture, construction managers must be proactive change agents, showing commitment to LC implementation by allocating resources for training and facilitating cultural transformation. Structured LC training programs should incorporate hands-on modules on waste identification and measurement, enabling workers to recognize defects, overproduction, and motion waste on-site. Incorporating digital learning tools and simulation-based training (like 4D BIM or process-mapping apps) can further reinforce understanding of waste sources and counter-measures. Establishing waste performance indicators, such as rework percentage or material yield ratios, within employee evaluation systems can sustain accountability and reinforce continuous improvement.
Thirdly, organizational strategies must align with client expectations to ensure that project outcomes are demand-driven rather than supply-driven, minimizing overprocessing and overproduction. This recommendation will also help address M10 (unclear project definition and outcomes), a top-ranked managerial barrier that is particularly critical in the UAE, where fast-tracked projects and limited early-stage stakeholder engagement often result in scope creep and material waste. Consultants and project planners should prioritize early engagement with clients and end-users during the design and planning stages enables value stream mapping, ensuring that all processes add measurable value to the final output. Adopting BIM-integrated cost and material forecasting tools can prevent over-ordering and unnecessary specification changes, which often generate surplus materials and packaging waste. Aligning procurement schedules with real-time demand through just-in-time material delivery systems ensures that resources are supplied only when required, reducing inventory waste and improving cash flow efficiency.
In terms of technical and logistical barriers, firms should develop standardized construction components and invest in technologies, such as digital material tracking and logistics management systems, thereby reducing inventory and motion waste. These recommendations directly respond to R1 (scarcity of materials suitable for LC implementation) and T1 (poor performance measurement strategies), both identified among the top five barriers to LC implementation in the UAE context. Addressing barrier R1 requires contractors and suppliers to prioritize locally adaptable lean-compliant materials and collaborate with manufacturers to develop regionally available alternatives to imported or unsustainable options. Additionally, consultants and digital teams can support this effort by introducing technologies such as BIM and radio-frequency identification (RFID), to facilitate real-time monitoring of material flow, ensuring that supplies are procured, delivered, and utilized efficiently. Emerging technologies such as IoT-enabled smart bins and AI-driven waste analytics platforms can automatically monitor the type and quantity of waste generated in real time, enabling data-based decision-making and facilitating continuous improvement in waste management practices. Additionally, implementation of just-in-time (JIT) delivery protocols and prefabrication or modular construction methods can further minimize on-site material storage, motion, and rework. Integrating Design for Disassembly (DfD) principles during early project stages allows components to be easily dismantled and reused, reducing demolition waste and extending material lifecycles, while also addressing another top barrier to LC implementation in the UAE—O3 (long implementation period).
Moreover, firms should establish on-site waste segregation systems with clearly designated zones for recyclable, reusable, and hazardous materials. This recommendation also aligns with O4 (lack of integrity in the production chain) by promoting structured workflows and improving inter-organizational collaboration on material handling. The introduction of circular economy-oriented practices, such as the reuse of demolition materials, recycling of concrete aggregates, and recovery of packaging materials, should be institutionalized within project execution plans, especially by contractors and construction managers. To support his transition and to promote material reuse and transparency, government agencies can mandate the adoption of Digital Waste Passports, which record material composition, reuse potential, and recycling history, enhancing traceability across the entire construction lifecycle and further aligning with global circular economy initiatives. Additionally, construction stakeholders must ensure proper planning during finishing and maintenance phases, which were identified as critical periods of high waste generation in this study. This includes deploying sustainable and durable materials, modular components, and conducting preventive maintenance to extend the life cycle of construction components and minimize repair-related waste, particularly in rapidly urbanizing regions such as the UAE.
At the policy and governance level, government agencies must support LC adoption through enabling regulations and incentives for waste-efficient practices. This will also ensure addressal of yet another barrier to LC implementation the UAE—G1 (lack of supportive regulations). These might include the development of national standards for lean-compliant practices, such as waste segregation and tracking, subsidies for adopting digital waste monitoring technologies, requirements for training certification in public procurement contracts, and the integration of LC and waste management criteria into public procurement requirements. Public–private partnerships could also support the creation of centralized recycling facilities and digital waste databases for benchmarking performance across projects. Further, integrating Lean–Green performance metrics, such as waste diversion rates, carbon footprint reduction, and energy intensity, into project key performance indicators (KPIs) can align LC adoption with sustainability and environmental management objectives.
At a regional level, developing digital waste exchange platforms can facilitate industrial symbiosis by allowing surplus materials from one project to be repurposed in another, thereby reducing landfill dependency and supporting the UAE’s zero-waste goals.
In parallel, management must address systemic organizational barriers, such as rigid hierarchical cultures or risk-averse cultures, that hinder information sharing, innovation and lean thinking (also tackling barrier M6—low decision-making due to hierarchy). By fostering open communication and empowering cross-functional teams, firms can strengthen collaboration, enhance knowledge flow, and ensure that lean-based waste reduction practices are sustained across projects. Finally, firms must also monitor economic variables, such as inflation and market volatility, to maintain cost stability, a critical enabler for long-term LC adoption. By integrating lean operational practices with waste-specific management tools, stakeholders in the UAE’s building construction industry can systematically dismantle barriers to LC implementation, and significantly reduce both process and material waste. This dual approach not only enhances project efficiency and profitability but also advances the national sustainability agenda toward a circular and resource-efficient construction sector. These recommendations not only advance the operational adoption of LC but also support the achievement of broader sustainability objectives. In particular, by reducing resource waste, improving energy efficiency, and optimizing material use, LC directly contributes to SDG 12 (Responsible Consumption and Production). Moreover, through enhanced planning, communication, and stakeholder collaboration, LC fosters safer, more inclusive, and sustainable urban development, resonating with SDG 11 (Sustainable Cities and Communities). Embedding LC principles within the UAE’s construction practices thus provides a practical pathway for aligning national development strategies with global sustainability commitments.
5 Conclusion
Construction industry, despite being crucial for the socio-economic development of a nation, is also one of the largest contributors to waste generated in a country, especially in the UAE. Thus, innovative solutions to efficient management of this waste is critical. Hence, this study undertook an in-depth understanding of the perceptions of stakeholders in the UAE’s building construction industry, that act as barriers toward implementation of LC for the effective management of construction waste.
Initially, this study provided a comprehensive assessment of the current state of LC (LC) implementation within the UAE’s building construction sector, with a particular focus on identifying the prevailing barriers, stakeholders’ perceptions, and waste generation trends. Through an integrated approach that combines descriptive analysis, Relative Importance Index (RII) ranking, and robust PLS-SEM modeling, the study uncovers both the perceived significance and the structural interrelations of the factors that influence stakeholder acceptance of LC. The findings reveal that although there is a growing awareness of LC principles, their practical application remains limited due to a combination of organizational, managerial, technical, financial, and policy-related challenges.
In this regard, the PLS-SEM analysis provided a rigorous validation of the proposed structural model, confirming that all eight hypothesized factors—knowledge/awareness, attitude, management, government, financial, material/resource, technical, and other contextual influences—significantly shape stakeholder perceptions toward LC implementation in the UAE building construction sector. The high factor loadings, strong reliability and validity indicators, and robust model fit metrics (SRMR = 0.0601) affirm the integrity of the measurement model. Moreover, the high path coefficients (β > 0.87) and statistically significant T-values (p < 0.001) highlight the strength of the interrelationships between latent constructs and stakeholder perceptions. Particularly, the constructs of attitude and management demonstrated the largest effect sizes, underscoring their critical roles in influencing LC adoption. The substantial R2 values further demonstrate that the model accounts for a considerable proportion of the variance in stakeholder perceptions, suggesting that targeted strategies addressing these key constructs could effectively enhance LC adoption for improved construction waste management in the UAE. This empirical evidence reinforces the need for holistic, multi-dimensional interventions that integrate policy support, managerial commitment, and cultural transformation to drive sustainable change in the industry.
Furthermore, the analysis of construction waste types and phases highlighted that packaging and demolition wastes are the most frequently generated, indicating opportunities for intervention through material optimization, reuse, and modular construction techniques. Furthermore, waste types commonly recognized in LC, particularly waiting, transportation, inventory, and motion, emerged as key inefficiencies that require targeted process improvements. The finishing and maintenance phases were identified as critical stages with high waste generation, suggesting the need for better planning, resource allocation, and long-term sustainability strategies.
The study concludes that achieving effective LC implementation in the UAE requires an integrated approach involving organizational reform, capacity building, stakeholder alignment, and supportive regulatory frameworks. The recommendations outlined in this study serve as a roadmap for construction professionals, firms, and policymakers to address systemic inefficiencies and promote a culture of continuous improvement. By embracing lean thinking, the UAE construction industry can move toward enhanced productivity, reduced waste, and more sustainable project outcomes aligned with national development goals. Furthermore, the study’s findings demonstrate a clear linkage between LC practices and the advancement of the United Nations Sustainable Development Goals, particularly SDG 11 and SDG 12. By embedding LC within construction processes, the UAE can promote responsible resource use and foster sustainable urban growth consistent with global sustainability frameworks.
5.1 Limitations and future research
While this study offers important insights into LC adoption and waste management practices in the UAE, several limitations should be acknowledged. First, the research relies on self-reported data from stakeholders, which may introduce subjective bias or variations in interpretation across respondents. Although the use of PLS-SEM and RII helped triangulate perceptions with robust statistical modeling, future studies could incorporate observational or project-level performance data to validate stakeholder assessments.
Second, the sample was limited to the UAE’s building construction sector, which, while significant, may not fully represent practices in other segments such as infrastructure, industrial, or residential retrofitting projects. Expanding the scope to include these sectors could offer a more holistic view of LC adoption across the construction ecosystem.
Third, the cross-sectional nature of the study captures perceptions at a single point in time. Longitudinal research would help evaluate how LC adoption evolves in response to changing policies, market dynamics, or organizational learning.
Finally, despite several recent studies that have explored waste management through frameworks such as the Circular Economy (CE), Material Flow Analysis (MFA), and digital waste-tracking systems, the present research remains grounded in the LC paradigm. LC provides an established theoretical basis for examining process and material inefficiencies in construction, emphasizing continuous improvement and waste minimization. Future research could extend this exploratory work by integrating LC with CE or BIM-based material tracking approaches to establish a more comprehensive and data-driven framework for waste management in the UAE construction context.
Statements
Data availability statement
The raw data supporting the conclusions of this article will be made available by the authors, without undue reservation.
Ethics statement
The studies involving humans were approved by Institutional Review Board, American University of Sharjah. The studies were conducted in accordance with the local legislation and institutional requirements. The participants provided their written informed consent to participate in this study.
Author contributions
TJ: Methodology, Conceptualization, Validation, Investigation, Data curation, Writing – review & editing, Writing – original draft, Formal analysis, Visualization. HS: Writing – original draft, Visualization, Formal analysis, Conceptualization, Methodology, Data curation, Validation, Investigation. SB: Project administration, Writing – review & editing, Supervision, Validation. MM: Project administration, Supervision, Writing – review & editing, Funding acquisition.
Funding
The author(s) declared that financial support was received for this work and/or its publication. This authors would like to acknowledge the help and support from the American University of Sharjah (FRG24-C-E59). This manuscript was supported, in part, by the Open Access Program from the American University of Sharjah. This manuscript represents the opinions of the authors and does not mean to represent the position or opinions of the American University of Sharjah.
Conflict of interest
The author(s) declared that this work was conducted in the absence of any commercial or financial relationships that could be construed as a potential conflict of interest.
The author MM declared that they were an editorial board member of Frontiers, at the time of submission. This had no impact on the peer review process and the final decision.
Generative AI statement
The author(s) declared that Generative AI was not used in the creation of this manuscript.
Any alternative text (alt text) provided alongside figures in this article has been generated by Frontiers with the support of artificial intelligence and reasonable efforts have been made to ensure accuracy, including review by the authors wherever possible. If you identify any issues, please contact us.
Publisher’s note
All claims expressed in this article are solely those of the authors and do not necessarily represent those of their affiliated organizations, or those of the publisher, the editors and the reviewers. Any product that may be evaluated in this article, or claim that may be made by its manufacturer, is not guaranteed or endorsed by the publisher.
References
1
Abo-Zeid M. Othman A. 2018. Lean construction for reducing construction waste in the Egyptian construction industry. Paper Presented at the 2nd International Conference on Sustainable Construction and Project Management-Sustainable Infrastructure and Transportation for Future Cities. Florida: CRC Press, Boca Raton. 1–13 (Accessed 24, 2025).
2
Agyekum K. Ayarkwa J. Adjei-Kumi T. (2013). Minimizing materials wastage in construction-a lean construction approach. J. Eng. Appl. Sci.5, 125–146.
3
Ahmed S. Hossain M. M. Haq I. (2021). Implementation of lean construction in the construction industry in Bangladesh: awareness, benefits and challenges. Int. J. Build. Pathol. Adapt.39, 368–406. doi: 10.1108/IJBPA-04-2019-0037
4
Ahmed M. Wong L. S. (2020). The barriers of the implementation of lean construction in Klang Valley, Malaysia. Paper Presented at the IOP Conference Series: Materials Science and Engineering, Bristol, England: IOP Publishing Ltd. 932012043.
5
Al Balkhy W. Sweis R. Lafhaj Z. (2021). Barriers to adopting lean construction in the construction industry—the case of Jordan. Buildings11:222. doi: 10.3390/buildings11060222
6
Al-Aomar R. (2012). Analysis of lean construction practices at Abu Dhabi construction industry. Lean Constr. J., 105–121.
7
Alarcón L. F. Diethelm S. Rojo O. (2002). Collaborative implementation of lean planning systems in Chilean construction companies. Paper Presented at the Tenth Annual Conference of the International Group for Lean Construction (IGLC-10), Brazil: International Group for Lean Construction (IGLC). 1–11.
8
Aldeeri B. Touqan B. (2025). Waste Management in the Construction Industry in Dubai—UAE. Paper Presented at the BUiD Doctoral Research Conference 2024, 513–529. Available online at: https://link.springer.com/chapter/10.1007/978-3-031-84371-6_42
9
Al-Hajj A. Hamani K. (2011). Material waste in the UAE construction industry: main causes and minimization practices. Archit. Eng. Des. Manag.7, 221–235. doi: 10.1080/17452007.2011.594576
10
Aravindh M. D. Nakkeeran G. Krishnaraj L. Arivusudar N. (2022). Evaluation and optimization of lean waste in construction industry. Asian J. Civ. Eng.23, 741–752. doi: 10.1007/s42107-022-00453-9
11
Aslam M. Baffoe-Twum E. Ahmed M. Ulhaq A. (2024). Unveiling effectiveness of lean construction practices: a comprehensive study through surveys and case studies. Civ. Eng. J.10, 1145–1158. doi: 10.28991/CEJ-2024-010-04-09
12
Aslam M. Gao Z. Smith G. (2020). Exploring factors for implementing lean construction for rapid initial successes in construction. J. Clean. Prod.277:123295. doi: 10.1016/j.jclepro.2020.123295
13
Attri R. Singh B. Mehra S. (2017). Analysis of interaction among the barriers to 5S implementation using interpretive structural modeling approach. Benchmarking Int. J.24, 1834–1853. doi: 10.1108/BIJ-07-2016-0110
14
Bagozzi R. P. Yi Y. (1988). On the evaluation of structural equation models. J. Acad. Mark. Sci.16, 74–94.
15
Bajjou M. S. Chafi A. (2018). Lean construction implementation in the Moroccan construction industry: awareness, benefits and barriers. J. Eng. Des. Technol.16, 533–556. doi: 10.1108/JEDT-02-2018-0031
16
Bajjou M. S. Chafi A. (2019). Identifying and managing critical waste factors for lean construction projects. England: IOP Publishing Ltd, Bristol. Eng. Manag. J.32:2. doi: 10.1080/10429247.2019.1656479
17
Bakry I. (2022). Examining the suitability of lean tools to the construction industry in UAE. Paper Presented at the Creative Construction E-Conference 2022, Budapest, Hungary: Diamond Congress Ltd., 156–163.
18
Bashir A. M. (2013) A framework for utilising lean construction strategies to promote safety on construction sites. 10–18.
19
Bashir A. M. Suresh S. Oloke D. A. Proverbs D. G. Gameson R. (2015). Overcoming the challenges facing lean construction practice in the UK contracting organizations. Int. J. Archit. Eng. Constr.4. doi: 10.7492/IJAEC.2015.002
20
Bayhan H. G. Demirkesen S. Jayamanne E. (2019). Enablers and barriers of lean implementation in construction projects. Paper Presented at the IOP Conference Series: Materials Science and Engineering, 471022002.
21
Berroir F. Guernaccini P. Sottet J. S. (2023). On-site waste management- a use case of lean construction and artificial intelligence synergy. Paper Presented at the 31st Annual Conference of the International Group for Lean Construction (IGLC31), 462–473. Available online at: https://iglcstorage.blob.core.windows.net/papers/attachment-3c65eede-eab8-4cea-9ada-5a86a1c9dabe.pdf (Accessed February 15, 2024).
22
Cohen J. (1977). Statistical power analysis for the behavioral sciences. 2nd Edn: Elsevier Science & Technology. New York: Lawrence Erlbaum Associates.
23
Collins L. M. (2007). Research design and methods-Cronbach's alpha. Encyclopedia of gerontology. 2nd Edn. San Diego, CA: Academic Press/Elsevier. 433–442.
24
DeVellis R. F. (2005). Inter-rater reliability. Encyclopedia of social measurement. San Diego, CA: Academic Press/Elsevier. 317–322.
25
Diekmann J. E. Krewedl M. Balonick J. Stewart T. Won S. (2004). Application of lean manufacturing principles to construction. Construction Industry Institute: Boulder, 191.
26
Dispo C. S. (2024). Construction and demolition waste in Abu Dhabi: A case study of Al Dhafra recycling industries (master of environment and natural resources management). Available online at: https://hdl.handle.net/20.500.13073/1001 (Accessed June 18, 2025).
27
Enshassi A. Saleh N. Mohamed S. (2021). Barriers to the application of lean construction techniques concerning safety improvement in construction projects. Int. J. Constr. Manag.21, 1044–1060. doi: 10.1080/15623599.2019.1602583
28
Environmental Agency—Abu Dhabi. (2022). Annual Report 2022. Abu Dhabi: EAD. Available online at: https://www.ead.gov.ae/-/media/Project/EAD/EAD/Documents/Resources/14-EAD-Annual-Report-2022---Digital-EN.pdf (Accessed February 15, 2024).
29
Eskander R. Hafez S. (2013). Applying lean thinking in construction and performance improvement. Alex. Eng. J.52, 679–695. doi: 10.1016/j.aej.2013.04.008
30
Fernández-Solís J. L. (2008). Critique of construction’s paradigm from existing state of the art research. Paper Presented at the International Symposium Towards the Formation of Theory for the Built Environment. Available online at: https://www.semanticscholar.org/paper/Critique-of-Construction-%E2%80%99-s-Paradigm-from-Existing-Fern%C3%A1ndez-Sol%C3%ADs/e294e932b924f69c034768e7b371d36c5ef28595
31
Fornell C. Larcker D. F. (1981). Evaluating structural equation models with unobservable variables and measurement error. J. Mark. Res.18, 39–50. doi: 10.1177/002224378101800104
32
Graham J. (2024). Lean construction for sustainable builds: 5 efficiency strategies to minimize waste generation. Available online at: https://www.planradar.com/sg/lean-construction-for-sustainable-builds/ (Accessed June 18, 2025).
33
Hair J. F. Black W. C. Babin B. J. Anderson R. E. Tatham R. L. (1998). Multivariate data analysis. London, UK: Prentice-Hall.
34
Hair J. F. Jr. Hult G. T. M. Ringle C. M. Sarstedt M. Danks N. P. Ray S. (2021a). “Evaluation of reflective measurement models” in Partial least squares structural equation modeling (PLS-SEM) using R. eds. HairJ. F.Jr.HultG. T. M.RingleC. M.SarstedtM.DanksN. P.RayS. (Springer, New York: Springer), 75–90.
35
Hair J. F. Jr. Hult G. T. M. Ringle C. M. Sarstedt M. Danks N. P. Ray S. (2021b). “Evaluation of the structural model” in Partial least squares structural equation modeling (PLS-SEM) using R. eds. HairJ. F.Jr.HultG. T. M.RingleC. M.SarstedtM.DanksN. P.RayS. (Springer, New York: Springer), 115–138.
36
Henseler J. Ringle C. M. Sarstedt M. (2015). A new criterion for assessing discriminant validity in variance-based structural equation modeling. J. Acad. Mark. Sci.43, 115–135. doi: 10.1007/s11747-014-0403-8
37
Henseler J. Sarstedt M. (2013). Goodness-of-fit indices for partial least squares path modeling. Comput. Stat.28, 565–580. doi: 10.1007/s00180-012-0317-1
38
Hittini B. Y. Shibeika A. I. (2019). Construction waste management in Uae: An exploratory study, vol. 238. Southampton, UK: WIT Transactions on Ecology and the Environment, 679–686.
39
Howell G. Ballard G. (1998). Implementing lean construction: understanding and action.
40
Hu L. Bentler P. (1998). Fit indices in covariance structure modeling: sensitivity to underparameterized model misspecification. Psychol. Methods3, 424–453. doi: 10.1037/1082-989X.3.4.424
41
Huang C. (2021). Using PLS-SEM model to explore the influencing factors of learning satisfaction in blended learning. Educ. Sci.11. doi: 10.3390/educsci11050249
42
Hughes W. Champion R. Murdoch J. (2015). Construction contracts: law and management. Oxfordshire, England: Routledge.
43
Husin A. (2019) Waste reduction at mechanical electrical plumbing (MEP) works based on lean construction in high rise building.
44
Kanafani J. A. (2015) Barriers to the implementation of lean thinking in the construction industry - the case of UAE (master of business administration).
45
Karaz M. Teixeira J. (2020) Waste management using lean construction and building information modelling: systematic literature review.
46
Kim D. Park H. (2006). Innovative construction management method: assessment of lean construction implementation. KSCE J. Civ. Eng.10, 381–388. doi: 10.1007/BF02823976
47
Klein L. Tonetto M. Ávila L. Moreira R. (2020). Management of lean waste in a public higher education institution. J. Clean. Prod.286. doi: 10.1016/j.jclepro.2020.125386
48
Klimenko M. Y. Kasharina T. P. Zamorov A. A. (2019). Recycling of construction wastes during major repairs. IOP conference series: earth and environmental science, 272, 022129.
49
Kumar V. Verma D. K. (2024). E-waste in construction: a comprehensive bibliometric analysis and review of the literature. World J. Eng.22, 978–994. doi: 10.1108/WJE-12-2023-0504
50
Lewis M. A. (2000). Lean production and sustainable competitive advantage. Int. J. Oper. Prod. Manag.20, 959–978. doi: 10.1108/01443570010332971
51
Maraqa M. Fishman T. Sacks R. Spatari S. (2021). Reducing construction and demolition waste through lean production. Israel: Observations from Tel-Aviv.
52
Maraqa M. Sacks R. Spatari S. (2023). Strategies for reducing construction waste using lean principles. Resour. Conserv. Recycl. Adv.19, 1–2. doi: 10.1016/j.rcradv.2023.200180
53
Martinez E. Reid C. K. Tommelein I. D. (2019). Lean construction for affordable housing: a case study in Latin America. Constr. Innov.19, 570–593. doi: 10.1108/ci-02-2019-0015
54
Mehra S. Attri R. Singh B. (2015). Identification of barriers affecting implementation of 5S. Int. J. Adv. Res. Sci. Eng.4, 619–624.
55
Meshref A. N. Elkasaby E. A. F. A. Abdel Kader Mohamed Farid A. (2023). Reducing construction waste in the construction life cycle of industrial projects during design phase by using system dynamics. J. Build. Eng.69:106302. doi: 10.1016/j.jobe.2023.106302
56
Metlej K. (2021). Exploratory analysis on lean construction practice in the Lebanese construction industry.
57
Miller N. (2021). The industry creating a third of the world's waste. BBC - future planet - sustainability Available online at: https://www.bbc.com/future/article/20211215-the-buildings-made-from-rubbish (Accessed February 15, 2024).
58
Mossman A. (2009). Why isn't the UK construction industry going lean with gusto?Lean Constr. J.2009. doi: 10.60164/i2h6a6c6f
59
Moyo T. Chigara B. (2021). Barriers to lean construction implementation in Zimbabwe. J. Eng. Des. Technol.21, 733–757. doi: 10.1108/jedt-01-2021-0044
60
Musa M. M. Saleh I. M. Ibrahim Y. Dandajeh M. A. (2023). Assessment of awareness and barriers to the application of lean construction techniques in Kano state, Nigeria. J. Constr. Bus. Manag.6, 33–42. doi: 10.15641/jcbm.6.1.1262
61
Nie P. Dahanayake K. C. Sumanarathna N. (2024). Exploring UAE'S transition towards circular economy through construction and demolition waste management in the pre-construction stage–a case study approach. Smart Sustain. Built Environ.13, 246–266. doi: 10.1108/SASBE-06-2022-0115
62
Nikakhtar A. Abbasian-Hosseini A. Wong K. Y. Zavichi A. (2015). Application of lean construction principles to reduce construction process waste using computer simulation: a case study. Int. J. Serv. Oper. Manag.20:461. doi: 10.1504/IJSOM.2015.068528
63
Nowotarski P. Paslawski J. Skwarek J. (2019). Waste reduction by lean construction - office building case study. Paper Presented at the IOP Conference Series: Materials Science and Engineering, 6031–10.
64
Pedrosa M. Arantes A. Cruz C. O. (2023). Barriers to adopting lean methodology in the Portuguese construction industry. Buildings13:2047. doi: 10.3390/buildings13082047
65
Prabaharan R. Shanmugapriya S. (2023). Identification of critical barriers in implementing lean construction practices in Indian construction industry. Iran. J. Sci. Technol. Trans. Civ. Eng.47, 1233–1249. doi: 10.1007/s40996-022-00959-x
66
Purushothaman M. B. Seadon J. (2024). System-wide construction waste and their connectivity to construction phases, impacting 5M factors and effects: a systematic review. Smart Sustain. Built Environ.13, 354–369. doi: 10.1108/SASBE-12-2022-0269
67
Sadi M. A. K. Abdullah A. Sajoudi M. N. Kamal M. F. M. Torshizi F. Taherkhani R. (2012). Reduce, reuse, recycle and recovery in sustainable construction waste management. Adv. Mater. Res.446-449, 937–944. doi: 10.4028/www.scientific.net/AMR.446-449.937
68
Saleh S. (2023). UAE: quantity of waste in Dubai by type. Available online at: https://www.statista.com/statistics/1415839/uae-quantity-of-waste-in-dubai-by-type/; www.statista.com (Accessed February 15, 2024).
69
Salem O. Solomon J. Genaidy A. Luegring M. (2005). Site implementation and assessment of lean construction techniques. Lean Constr. J.2, 1–21. doi: 10.60164/e2i9e2h1d
70
Sandeep R. Panwar N. (2016). Identification of barriers in implementation of world class manufacturing (WCM) practices: a literature analysis. Int. Res. J. Eng. Technol.3, 2363–2366.
71
Saradara S. M. Lara J. C. F. Swarnakar V. Vikas R. Qureshi R. El Fadel M. et al . (2024). Construction and demolition waste management in the United Arab Emirates through the 3R principle. Eng. Constr. Archit. Manag.31, 430–454. doi: 10.1108/ECAM-06-2024-0810
72
Sarhan S. Fox A. (2012) Trends and challenges to the development of a lean culture among UK construction organisations. Paper Presented at the 20th Annual Conference of the International Group for Lean Construction. International Group for Lean Construction (IGLC).
73
Sayed A. Y. A. Seth D. Hamouda A. M. S. (2019). Prioritisation of lean construction barriers in Qatari context: a fuzzy AHP approach. Int. J. Bus. Excel.19, 503–531. doi: 10.1504/ijbex.2019.103456
74
Sholanke A. B. Chen S. J. Newo A. A. Nwabufo C. B. (2019). Prospects and challenges of lean construction practice in the building industry in Nigeria: architects’ perspective. Int. J. Innov. Technol. Explor. Eng.8, 667–673.
75
Shurrab J. Hussain M. (2018). An empirical study of the impact of lean on the performance of the construction industry in UAE. J. Eng. Des. Technol.16, 694–710. doi: 10.1108/JEDT-09-2017-0095
76
Small E. P. Hamouri K. A. Hamouri H. A. (2017). Examination of opportunities for integration of lean principles in construction in Dubai. Proc. Eng.196, 616–621. doi: 10.1016/j.proeng.2017.08.049
77
Statista. (2021). Construction waste as share of all waste EU. Available online at: https://www.statista.com/statistics/1399099/construction-waste-as-a-share-of-all-waste-generated-in-the-eu/; www.statista
78
Thomassen M. Andreas A. (2004). The economic organisation of building processes. On specialisation and coordination in interfirm relations. Denmark: Technical University of Denmark.
79
United Nations, Transforming our world: The 2030 agenda for sustainable development, 1, seventieth sessionCong. (2015). Available online at: https://docs.un.org/en/A/RES/70/1 (Accessed October 11, 2024).
80
US EPA-OLEM. (2016). Sustainable management of construction and demolition materials. Available online at: https://www.epa.gov/smm/sustainable-management-construction-and-demolition-materials; www.epa.gov (Accessed February 15, 2024).
81
Waite M. (2020) Sustainability in construction: using lean management principles to reduce waste (master of science in engineering). Available online at: https://dc.uwm.edu/cgi/viewcontent.cgi?article=3621&context=etd (Accessed February 15, 2024).
82
Wajahat A. (2022) Barriers in the way of implementing lean construction in the UAE: potential solutions from the Swedish context (masters in design and construction Project Management). Available online at: https://hdl.handle.net/20.500.12380/305267 (Accessed February 15, 2024).
83
Warid O. Hamani K. (2023). Lean construction in the UAE: implementation of last planner system®. Lean Constr. J., 1–20. doi: 10.60164/96f4a5e0g
84
Watfa M. Sawalha M. (2021). Critical success factors for lean construction: an empirical study in the UAE. Lean Constr. J.1–17. doi: 10.60164/50c6g5h0c
85
Xue X. Zhang R. Zhang X. Yang J. Li H. (2014). Environmental and social challenges for urban subway construction: an empirical study in China. Int. J. Proj. Manag.33, 576–588. doi: 10.1016/j.ijproman.2014.09.003
86
Zhou B. (2016). Lean principles, practices, and impacts: a study on small and medium-sized enterprises (SMEs). Ann. Oper. Res.241, 457–474. doi: 10.1007/s10479-012-1177-3
Summary
Keywords
building construction sector, construction waste management, lean construction, partial least squares- structural equation modeling (PLS-SEM), relative importance index (RII)
Citation
Joseph TM, Shajidha H, Beheiry S and Mortula MM (2026) Perceptions of lean construction for waste management in the UAE building sector: a partial least squares structural equation modeling approach. Front. Sustain. Cities 8:1698448. doi: 10.3389/frsc.2026.1698448
Received
03 September 2025
Revised
30 December 2025
Accepted
02 January 2026
Published
06 February 2026
Volume
8 - 2026
Edited by
Nishant Raj Kapoor, Academy of Scientific and Innovative Research (AcSIR), India
Reviewed by
Palash Godani, Vellore Institute of Technology (VIT), India
Amor Judith A. Cabanesas, Nueva Ecija University of Science and Technology, Philippines
Updates
Copyright
© 2026 Joseph, Shajidha, Beheiry and Mortula.
This is an open-access article distributed under the terms of the Creative Commons Attribution License (CC BY). The use, distribution or reproduction in other forums is permitted, provided the original author(s) and the copyright owner(s) are credited and that the original publication in this journal is cited, in accordance with accepted academic practice. No use, distribution or reproduction is permitted which does not comply with these terms.
*Correspondence: Tania M. Joseph, g00098568@aus.edu
Disclaimer
All claims expressed in this article are solely those of the authors and do not necessarily represent those of their affiliated organizations, or those of the publisher, the editors and the reviewers. Any product that may be evaluated in this article or claim that may be made by its manufacturer is not guaranteed or endorsed by the publisher.