Abstract
Among the neglected tropical diseases (NTDs), arboviral diseases present a significant number of cases worldwide. Their correct classification is a complex process due to the similarity of symptoms and the lack of tests in Brazil countryside is a big challenge to be overcome. Given this context, this paper proposes a comparative study of machine learning techniques for multi-class classification of arboviral diseases, which considers three classes: DENGUE, CHIKUNGUNYA and OTHERS, and uses clinical and socio-demographic data from patients. Feature selection techniques were also used for selecting the best subset of attributes for each model. Gradient boosting machines presented the best result in the metrics and a good subset of attributes for daily usage by the physicians that resulted in a 76.58% recall on the CHIKUNGUNYA class.
1 Introduction
In 2015, the 2030 Agenda1 was conceived by representatives of the member states of the United Nations (UN), and its main purpose is focused on eradicating poverty in all forms and dimensions via the implementation of sustainable development around the world. To achieve this major objective, 17 sustainable development goals (SDGs) were developed. Among them, Goal 3 (health and well-being) seeks to promote well-being for all, at all ages. Target 3.3 aims to end epidemics of AIDS, tuberculosis, malaria, and neglected tropical diseases (NTD), as well as combating hepatitis, waterborne diseases and other communicable diseases by the year 2030.
Arboviral diseases are NTDs caused by viruses and are transmitted by mosquitoes as their vector. Currently, there are about 545 known species of arboviruses, of which about 150 of them cause diseases in humans (1). In addition to Dengue virus (DENV), in the last 10 years, the emergence of other arboviruses, such as Chikungunya virus (CHIKV), Zika virus (ZIKV) and West Nile virus (WNV), has been observed. According to Lima-Camara (2016), disorganised urban growth and the modification of the environment by human actions are some of the reasons that influenced the increase in this type of disease (2).
According to reports released by the Pan American Health Organization (PAHO)2,3 in 2020, together Dengue and Chikungunya accounted for a total of 2,402,128 cases in the Americas. However, most of these cases were classified as suspected cases due to the difficulty involved in their confirmation. For example, only 43.81% of reported Dengue cases (1,007,939 cases) were actually confirmed, and for Chikungunya, as few as 39% (39,619 cases) were confirmed. The low proportion of confirmed cases is due to the high complexity in the classification of these diseases in terms of their signs and symptoms. According to the Health Library of Primary Health Care (from Portuguese Biblioteca Virtual em Saúde da Atenção Primária à Saúde) (BVS APS)4, most of cases are limited to the patients’ signs and symptoms and the local epidemiological status. In addition, rapid tests available at primary healthcare centers have low accuracy. Despite (3) state that “cross-reactions with DENV or ZIKV infections are unlikely, because CHIKV is an alphavirus, while DENV and ZIKV are antigenically unrelated flaviviruses”, it can be a concern. Actually, the cross-reactivity is one of the issues that pose barriers to the correct diagnosis for all arboviruses diseases at low-level health units. However, the lack of tests is also a major issue in the Amazon countryside. Therefore, accurate testing require specific equipment and time, though this also presents operational costs.
As a tropical country, Brazil has a huge diversity of both flora and fauna, and this includes mosquitos, which play an important role as vectors of illnesses such as arboviral diseases (4). According to PAHO, Brazil had the highest number of Dengue cases in the Americas in 2020, with 1,040,481 cases (65% of the total). Clinical classification of an arboviral disease is particularly a complex task in Brazil because of concomitant circulation of other arboviruses, such as Mayaro virus (MAYV), Venezuelan equine encephalitis virus (VEEV), Eastern equine encephalitis virus (EEEV), and Rocio virus (ROCV), which present a similar clinical profile (2). Besides the difficulty in clinical classification, cross-reaction is an issue for the current rapid tests that are available and this reduces their accuracy (2). Although high lethality has not been evidenced so far, the occurrence of coinfection with several arboviruses or concomitant circulation is cause for concern.
The Brazilian Unified Health System (from Portuguese, Sistema Único de Saúde) SUS has suffered over the years from a reduction in funding and this imposes an additional barrier to expanding quality diagnostic testing and presents a major public health challenge, highlighting the need for a low-cost diagnostic approach. The use of Machine Learning (ML) techniques becomes an interesting alternative, as they are able to recognise and develop a classification without the need for immediate laboratory tests. This would avoid the costs of collecting them and running these tests. As stated by Bulbul and Unsal, “compared to classical methods, the process of obtaining information is much more accurate and faster with data mining and ML” (5). ML models estimate results by learning from previously entered information. In addition, these models do not require computational power and can be executed in tablets or cell phones.
Most studies that deal with this problem have proposed models for diagnosing Dengue (6, 7); Chikungunya (8); or Zika (9) individually; and, to the best of our knowledge, only one study has provided a model for distinguishing of two arboviral diseases (Dengue and Chikungunya) (10), however the study also used laboratory data to perform the classification. Despite improving the results, we do not employ these types of data, as they, in addition to needing adequate equipment, would prevent the ML model from being used for a quick diagnosis at the time of the patient’s arrival at the health unit. Furthermore, most of the existing works did not present a clear methodology that describes the pre-processing of data, hyperparameter optimization techniques, or feature selection. In our work, the entire data pre-processing and balancing are systematically presented, as well as a comparison of feature selection techniques with grid search. We present not only the best attributes for each model, but also the best configuration for each scenario. We also provide a discussion regarding the model that was trained with the best features selected by the sequential feature algorithm (SFA) techniques and a model designed with features selected by health specialists.
The present work proposes different ML models and compares them for multi-class classification of Dengue, Chikungunya and other diseases, using the clinical and socio-demographic data of the patients. The objective is to assist the physician in a rapid diagnosis at the time of arrival of the patient at the health unit by providing an auxiliary tool for decision making.
2 Materials and Methods
2.1 Feature Selection
Feature selection is a technique that is used to reduce the dimensionality of the data set, which leads to better learning performance and/or lower computational cost. This technique selects the most relevant attributes in the data set by removing noisy, irrelevant and redundant features (11). Different feature selection techniques can be found in the literature, and can be categorised according to the search strategy. There are three main approaches: filter, wrapper, and embedded (11).
In this work, the wrapper approach is used, since it makes use of a learning algorithm to determine the best subset of attributes, called features, where an evaluation is usually made in terms of predictive accuracy. Due to the use and dependence of a learning model, this type of approach can become computationally expensive, though the possibility of selecting irrelevant features is less likely (12). Among the wrapper techniques, we used the SFA. This technique has four different types, and each type differs in the way it selects or removes features from the data set: sequential forward selection (SFS), sequential backward selection (SBS), sequential forward floating selection (SFFS) and sequential backward floating selection (SBFS).
2.2 Grid Search
Grid search is an exhaustive search technique for setting hyperparameters of a given model. With it, it is possible to analyse the results of a ML model, and then decide which configuration best fits the target problem. According to Bergstra and Bengio (13), despite having limitations, this technique is widely used along with the manual search technique.
2.3 Machine Learning Techniques
ML is a branch of artificial intelligence that is composed of several techniques that have been widely used for pattern learning (8, 14–18). The ML models used in this work are Random Forest (RF), Adaptative Boosting (Adaboost), Gradient Boosting Machines (GBM), eXtreme Gradient Boosting (Xgboost), k-Nearest Neighbours (KNN), Naive Bayes (NB) and Multilayer Perceptron (MLP).
2.4 Evaluation Metrics
The following metrics are used: accuracy, precision, sensitivity and F1-Score. With the exception of accuracy, in the other metrics, the value of the metric in each class and the macro average of each one of them is also analysed.
2.5 Data Set
In this work, data regarding Dengue and Chikungunya notifications from the state of Amazonas and the city of Recife, Pernambuco from 2015 to 2020 are used. Regarding the state of Amazonas, data were retrieved from the Health Problem and Notification Information System, from Portuguese Sistema de Informação de Agravo de Notificação (SINAN)5. SINAN is the official system for disease reporting in Brazil. Diseases from the national list of compulsory notification must be reported, and this list includes Dengue and Chikungunya. This data set contains 57,445 entries and 146 variables and hereafter is referred to as “SINAN-db”.
The data set for Recife was retrieved from an open data set named Portal de Dados Abertos do Recife (19), maintained by the Recife Health Department, whose primary source is also the SINAN, and therefore it follows the same dictionary pattern, and allows integration without further issues. This data set contains 83,073 registers and 124 variables and is referred to as “Recife-db” in this work.
Figure 1 illustrates the steps taken during the pre-processing of the data set. First, both data sets were integrated. Variables available in only one of the data sets were disregarded. The resulting data set from the integration of SINAN-db and Recife-db has 140,518 registers and 120 variables.
Figure 1
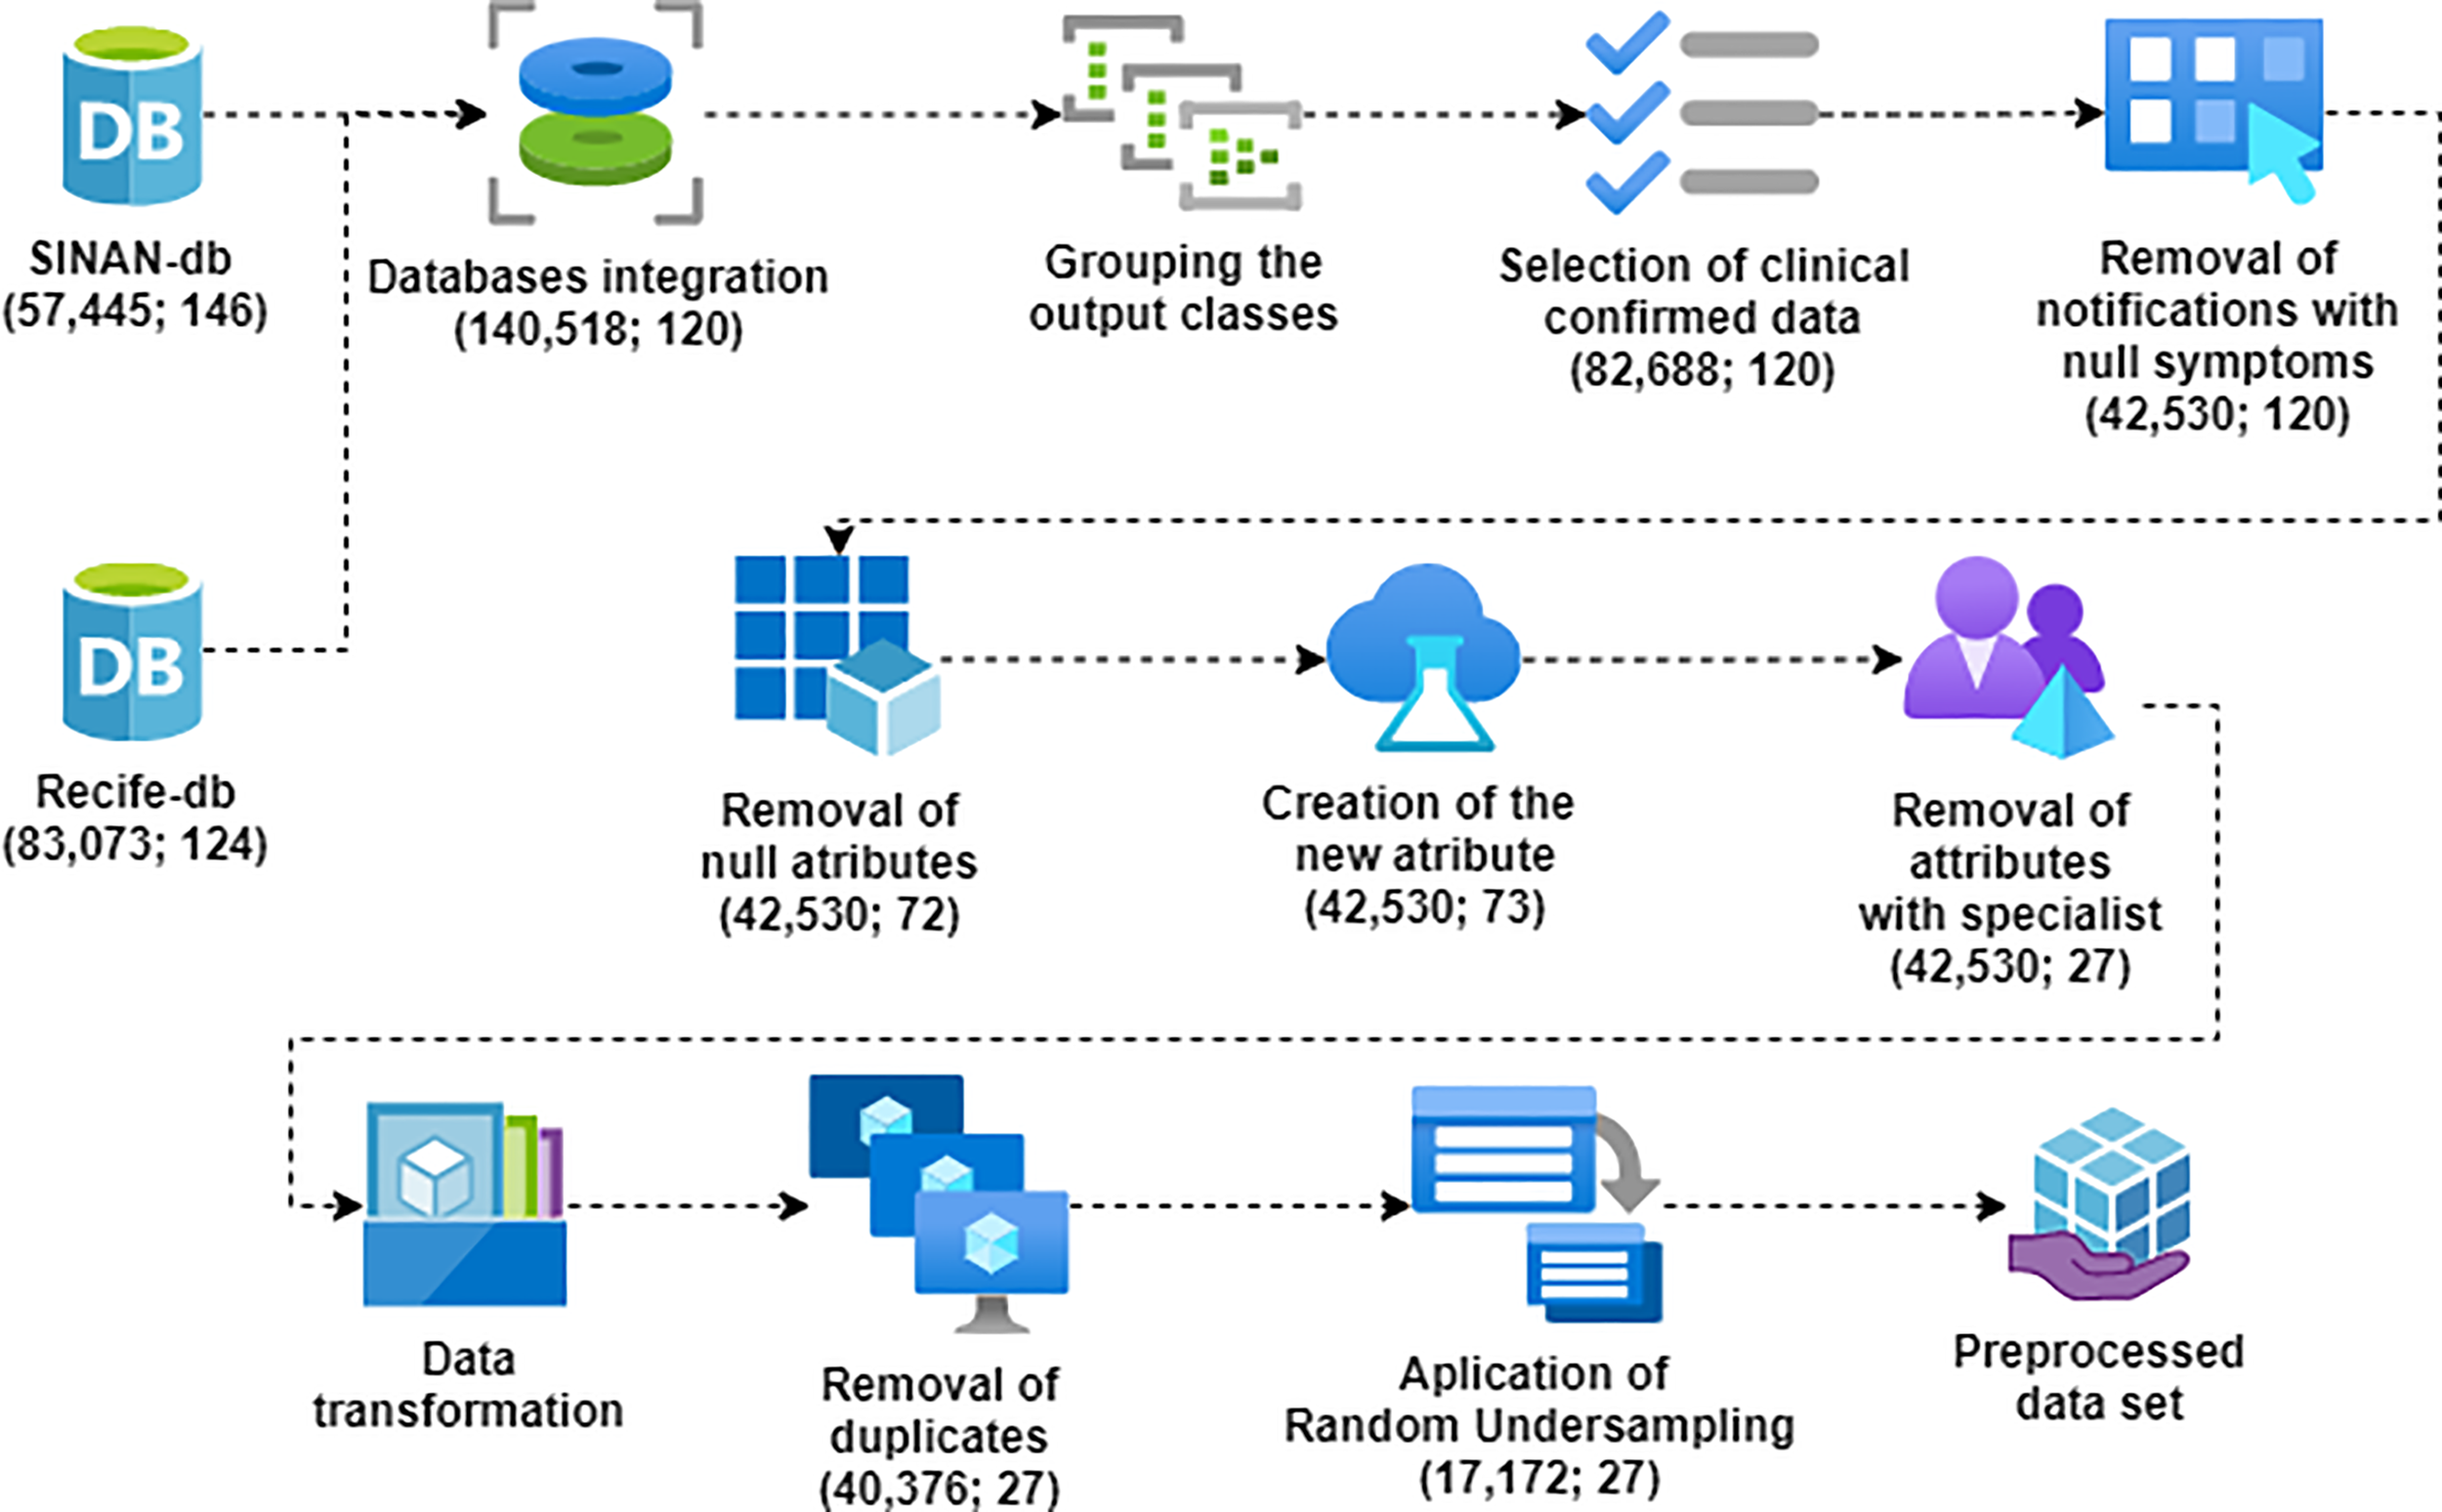
Data set pre-processing steps.
The output classes were grouped into three distinct classes:
-
DENGUE: Patients with confirmed Dengue;
-
CHIKUNGUNYA: Patients with confirmed Chikungunya; and
-
OTHERS: Patients classified as “inconclusive” or “negative” for both Dengue and Chikungunya.
Only records confirmed or denied by clinical diagnoses were selected. Registers that did not relate signs or symptoms were discarded since they are the most important information for classification models. Moreover, variables with more than 50% of data missing were also removed. Besides the original variables, a new one (DIAS) was created so that the time (in days) from onset of these symptoms to the date of notification could be added to the models. For the selection of attributes, specialists were consulted. After coding variables as numbers, duplicates were removed, and missing values were replaced by “not informed” for each variable. Registers with missing values for all variables were also removed. Finally, the clean data set consisted of 17,948 registers in the DENGUE class, 5,724 in the CHIKUNGUNYA class and 16,704 in the OTHERS class, totalling 40,376 registers with 27 variables. In data science, a higher number of registers of a specific class compared to another in the same data set is known as imbalance and it can bias the ML model, which favours the classification of the class that has the largest number of registers (20).
In order to balance the data set, the random undersampling technique was performed. In this technique, the class with the least number of registers defines the amount of the other classes, so that all classes have the same number of registers. After balancing, the data set still had 27 attributes and 17,172 records, with 5,724 for each of the three classes. The 27 variables resulting from the pre-processing are described in Table 1. The data set can be accessed in Mendeley Data (21).
Table 1
| Attribute | Description |
|---|---|
| NU_IDADE_N | Patient age |
| CS_SEXO | Patient sex |
| CS_GESTANT | Gestational Age of the Patient (Quarter), in case CS_SEXO=F |
| CS_RACA | Patient Race |
| CS_ZONA | Residence area |
| FEBRE | Symptom - Fever |
| MIALGIA | Symptom - Myalgia |
| CEFALEIA | Symptom - Headache |
| EXANTEMA | Symptom - Rash |
| VOMITO | Symptom - Vomiting |
| NAUSEA | Symptom - Nausea |
| DOR_COSTAS | Symptom - Back Pain |
| CONJUNTVIT | Symptom - Conjunctivitis |
| ARTRITE | Symptom - Arthritis |
| ARTRALGIA | Symptom - Arthralgia |
| PETEQUIA_N | Symptom - Petechiae |
| LACO | Symptom - Tourniquet test |
| DOR_RETRO | Symptom - Eye pain |
| DIABETES | Pre-existing disease - Diabetes |
| HEMATOLOG | Pre-existing disease - Haematological diseases |
| HEPATOPAT | Pre-existing disease - Liver diseases |
| RENAL | Pre-existing disease - Kidney disease |
| HIPERTENSA | Pre-existing disease - Hypertension |
| ACIDO_PEPT | Pre-existing disease - Peptic acid disease |
| AUTO_IMUNE | Pre-existing disease - autoimmune disease |
| DIAS | Days that the patient is feeling the symptoms |
| CLASSI_FIN | Final patient classification |
Database attributes after pre-processing.
2.6 Experiments
The experiment is divided into three main steps: (a) optimisation of hyperparameters and attribute selection, using Grid Search and SFA; (b) evaluation of models performance; and (c) specialist evaluation.
2.6.1 Optimisation of Hyperparameters and Attribute Selection
The grid search technique was performed for each model individually and, on each model, not only were the combinations of the hyperparameters tested, but we also defined which SFA technique offers the best subset of attributes.
Figure 2 illustrates how the grid search process was executed considering the model’s hyperparameters together with the SFA techniques. We used the Python library sklearn GridSearchCV6, using the training set (70% of the data set). The cross-validation technique (22) with k=10 was used. At the end of the grid search of each model, the result was the best combination of model hyperparameters and the best subset of data set attributes for the same configuration.
Figure 2
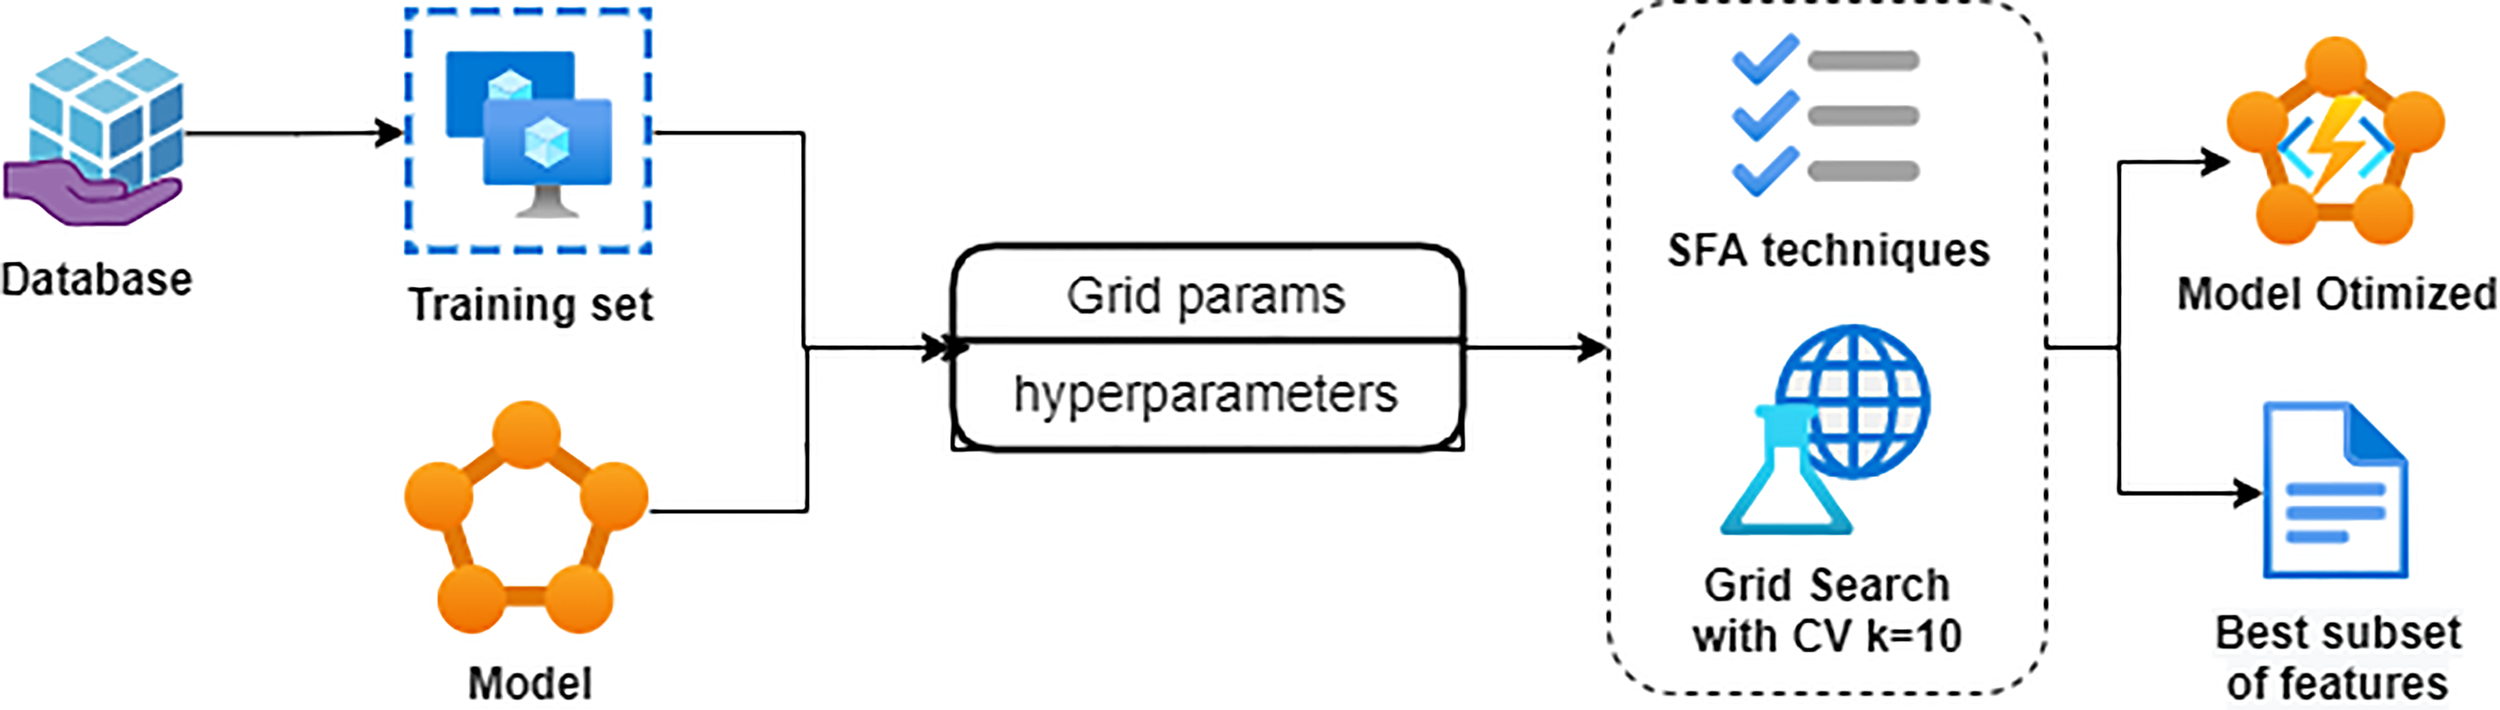
Grid Search flowchart with SFA.
Table 2 shows the hyperparameters of each model that were tested in the grid search and their respective value ranges. All models, except Xgboost, were executed using the Python library sklearn.
Table 2
| Model | Parameters | Values |
| Adaboost | learning_rate | [0.36, 1, 1.5] |
| n_estimators | [25, 50, 100] | |
| RF | criterion | [gini, entropy] |
| n_estimators | [50, 100, 200] | |
| GBM | max_depth | [1, 3, 5] |
| n_estimators | [50, 100, 200] | |
| Xgboost | eta | [0.3, 0.5] |
| max_depth | [2, 6] | |
| KNN | metric | [euclidean, manhattan] |
| n_neighbors | [2, 5, 10] | |
| weights | [uniform, distance] | |
| MLP | hidden_layer_sizes | [(100), (100,100), (100,100,100)] |
| learning_rate_init | [0.001, 0.01, 0.1] |
Parameters used in Grid Search.
The Adaboost was executed with the AdaBoostClassifier7 and two hyperparameters were tested: learning_rate and n_estimators. n_estimators is the maximum number of stumps that the model will produce in the training, and learning_rate is a weight applied to each stump at each iteration. A higher learning_rate increases the contribution of each classifier. The higher the learning_rate, the greater the contribution of stumps during training. Low values decrease correct classification, while high values are associated with model instability (23).
The RF was executed with the RandomForestClassifier8 and two hyperparameters were tested: criterion and n_estimators. n_estimators, as in Adaboost, is the maximum number of Decision Tree (DT) that the model produces and criterion is the function that determines which are the best splits in each node.
The GBM was executed with the GradientBoostingClassifier9, and two hyperparameters were tested, max_depth and n_estimators. max_depth is the level of depth that each DT within the model has. The higher the level, consequently, the more nodes the DT has. n_estimators, as in Adaboost and RF, is the maximum number of DT that the model produces.
The Xgboost was executed with the Python library XGBoost10 and two hyperparameters were tested, max_depth and eta. max_depth, as in GBM, is the level of depth that each DT within the model has; and eta, also known as learning rate, is the shrinkage in update to prevent overfitting.
The KNN was executed with the KNeighborsClassifier11 and three hyperparameters were tested, namely, metric, n_neighbors and weights. n_neighbors is the number of neighbours that is used in the training. weights contains the function that determines the weights each neighbour has in the training, and metric is the function used to calculate the distance to each neighbour.
The MLP was executed with the MLPClassifier12 and two hyperparameters were tested, in this case, hidden_layer_sizes and learning_rate_init. hidden_layer_sizes defines the number of hidden layers and the number of neurons that each layer has. learning_rate_init is the value that determines how often the weights of each layer will be updated during training.
Lastly, the NB13 was executed with the GaussianNB. As NB does not have hyperparameters, the Grid Search of this model was executed only with SFA techniques.
2.6.2 Evaluation of Models
After the execution of the grid search, the models were evaluated using the remaining 30% of the data set that was not part of the training, which was called the test set. The models were evaluated using the metrics described in subsection 2.4. The tests were executed 30 times and the metrics were averaged in order to be compared. The model chosen was the one that best fitted the needs of the experiment. After that, the model was submitted to specialists so that the application in the health care routine could be assessed.
3 Results
The scenario of low-income countries and limited-resource settings requires physicians to make a diagnosis often using only clinical parameters and without laboratory data support. ML techniques can aid in the classification of arboviral diseases using only these clinical parameters. Therefore this work evaluated seven ML techniques using only clinical and socio-demographic features.
Overall and per-disease baseline characteristics are presented in Table 3. Baseline characteristics show an overall mean (SD) age over 30 years and a predominance of men and in urban areas for each arboviral disease. Fever (85.3%), headache (60.6%), myalgia (58.4%), and arthralgia (51.1%) were the most frequent symptoms.
Table 3
| Variables | Total | Dengue | Chikungunya | Others |
|---|---|---|---|---|
| N=17172 | N=5724 | N=5724 | N=5724 | |
| Gender Women, % | 7267/17172 (42.3) | 2540/5724 (44.4) | 2200/5724 (38.4) | 2527/5724 (44.1) |
| Age, Mean (SD) | 32.6 (20.1) | 31.0 (19.8) | 36.6 (20.0) | 30.1 (19.9) |
| Race, % | ||||
| White | 690/17172 (4.0) | 223/5724 (3.9) | 203/5724 (3.5) | 264/5724 (4.6) |
| Black | 156/17172 (0.9) | 53/5724 (0.9) | 56/5724 (1.0) | 47/5724 (0.8) |
| Yellow | 34/17172 (0.2) | 10/5724 (0.2) | 11/5724 (0.2) | 13/5724 (0.2) |
| Admixed | 5292/17172 (30.8) | 1806/5724 (31.6) | 954/5724 (16.7) | 2532/5724 (44.2) |
| Indigenous | 176/17172 (1.0) | 104/5724 (1.8) | 22/5724 (0.4) | 50/5724 (0.9) |
| Missing | 10824/17172 (63.0) | 3528/5724 (61.6) | 4478/5724 (78.2) | 2818/5724 (49.2) |
| Pregnant, % | ||||
| 1st Quarter | 53/17172 (0.3) | 9/5724 (0.2) | 13/5724 (0.2) | 31/5724 (0.5) |
| 2nd Quarter | 77/17172 (0.4) | 25/5724 (0.4) | 22/5724 (0.4) | 30/5724 (0.5) |
| 3rd Quarter | 75/17172 (0.4) | 17/5724 (0.3) | 27/5724 (0.5) | 31/5724 (0.5) |
| Ignored gestational age | 19/17172 (0.1) | 4/5724 (0.1) | 7/5724 (0.1) | 8/5724 (0.1) |
| Missing | 16948/17172 (98.7) | 5669/5724 (99.0) | 5655/5724 (98.8) | 5624/5724 (98.3) |
| Residence area, % | ||||
| Urban | 14658/17172 (85.4) | 4775/5724 (83.4) | 5187/5724 (90.6) | 4696/5724 (82.0) |
| Rural | 175/17172 (1.0) | 27/5724 (0.5) | 9/5724 (0.2) | 139/5724 (2.4) |
| Periurban | 5/17172 (0.0) | 2/5724 (0.0) | 2/5724 (0.0) | 1/5724 (0.0) |
| Missing | 2334/17172 (13.6) | 920/5724 (16.1) | 526/5724 (9.2) | 888/5724 (15.5) |
| Fever, % | 14647/17172 (85.3) | 5190/5724 (90.7) | 5300/5724 (92.6) | 4157/5724 (72.6) |
| Myalgia, % | 10029/17172 (58.4) | 3948/5724 (69.0) | 3364/5724 (58.8) | 2717/5724 (47.5) |
| Headache, % | 10406/17172 (60.6) | 4020/5724 (70.2) | 3316/5724 (57.9) | 3070/5724 (53.6) |
| Rash, % | 4395/17172 (25.6) | 1765/5724 (30.8) | 1637/5724 (28.6) | 993/5724 (17.3) |
| Vomit, % | 3312/17172 (19.3) | 1440/5724 (25.2) | 992/5724 (17.3) | 880/5724 (15.4) |
| Nausea, % | 3517/17172 (20.5) | 1610/5724 (28.1) | 1076/5724 (18.8) | 831/5724 (14.5) |
| Back pain, % | 2612/17172 (15.2) | 1088/5724 (19.0) | 877/5724 (15.3) | 647/5724 (11.3) |
| Conjunctivitis, % | 678/17172 (3.9) | 297/5724 (5.2) | 222/5724 (3.9) | 159/5724 (2.8) |
| Arthritis, % | 1641/17172 (9.6) | 638/5724 (11.1) | 715/5724 (12.5) | 288/5724 (5.0) |
| Arthralgia, % | 8770/17172 (51.1) | 2394/5724 (41.8) | 4890/5724 (85.4) | 1486/5724 (26.0) |
| Petechiae, % | 802/17172 (4.7) | 421/5724 (7.4) | 211/5724 (3.7) | 170/5724 (3.0) |
| Tourniquet test, % | 290/17172 (1.7) | 207/5724 (3.6) | 38/5724 (0.7) | 45/5724 (0.8) |
| Retroorbital pain, % | 2555/17172 (14.9) | 1407/5724 (24.6) | 622/5724 (10.9) | 526/5724 (9.2) |
| Diabetes, % | 216/17172 (1.3) | 57/5724 (1.0) | 103/5724 (1.8) | 56/5724 (1.0) |
| Haematological diseases, % | 58/17172 (0.3) | 22/5724 (0.4) | 16/5724 (0.3) | 20/5724 (0.3) |
| Liver diseases, % | 72/17172 (0.4) | 21/5724 (0.4) | 25/5724 (0.4) | 26/5724 (0.5) |
| Kidney disease, % | 50/17172 (0.3) | 10/5724 (0.2) | 20/5724 (0.3) | 20/5724 (0.3) |
| Hypertension, % | 454/17172 (2.6) | 128/5724 (2.2) | 191/5724 (3.3) | 135/5724 (2.4) |
| Peptic acid disease, % | 97/17172 (0.6) | 27/5724 (0.5) | 28/5724 (0.5) | 42/5724 (0.7) |
| Autoimmune disease, % | 42/17172 (0.2) | 10/5724 (0.2) | 16/5724 (0.3) | 16/5724 (0.3) |
| Symptom time in days, Mean (SD) | 21.0 (217.3) | 17.0 (32.8) | 22.6 (58.2) | 23.3 (370.5) |
Clinical and socio-demographic findings of patients at baseline.
Our results are presented in three parts: (a) the results obtained from each model using grid search; (b) evaluation of the models using the configurations found by the grid search; and (c) comparison of the best model with a model designed with features selected by health specialists.
3.1 Grid Search
Table 4 presents the results from the Grid Search technique of the seven models: Adaboost, RF, GBM, Xgboost, KNN, MLP and NB.
Table 4
| Model | Hyper parameters | QTD. Att | SFA | Accuracy |
|---|---|---|---|---|
| Adaboost | Learning_rate: 0.36 | 10 | SBS | 0.5972 |
| n_estimators: 25 | ||||
| RF | criterion: gini | 16 | SFFS | 0.6061 |
| n_estimators: 200 | ||||
| GBM | max_depth: 3 | 18 | SFFS | 0.6218 |
| n_estimators: 200 | ||||
| Xgboost | eta: 0.3 | 20 | SFFS | 0.6230 |
| max_depth:2 | ||||
| KNN | metric: euclidean | 19 | SBS | 0.5739 |
| n_neighbors: 2 | ||||
| weights: uniform | ||||
| MLP | hidden_layer_sizes: (100), | 15 | SFFS | 0.6153 |
| learning_rate_init: 0.1 | ||||
| NB | – | 10 | SBFS | 0.585 |
Results from Grid Search.
Regarding SFA, the techniques that presented the best performance were SFFS and SBS. The size of the subset of attributes ranged between 10 and 20 attributes, and the most common attributes were CS_RACA, CS_ZONA, FEBRE, EXANTEMA, NAUSEA, ARTRALGIA, DOR_RETRO, which appeared in all subsets. Table 5 shows the attributes selected by the SFA techniques for each model.
Table 5
| Model | Attributes |
|---|---|
| Adaboost | NU_IDADE_N, CS_RACA, CS_ZONA, FEBRE, CEFALEIA |
| EXANTEMA, NAUSEA, ARTRALGIA, LACO, DOR_RETRO | |
| RF | CS_RACA, CS_ZONA, FEBRE, MIALGIA, CEFALEIA, EXANTEMA, |
| NAUSEA, ARTRITE, ARTRALGIA, PETEQUIA_N, DOR_RETRO, | |
| DIABETES, HEMATOLOG, HEPATOPAT, RENAL, AUTO_IMUNE | |
| GBM | CS_RACA, CS_ZONA, FEBRE, MIALGIA, CEFALEIA, EXANTEMA, |
| NAUSEA, DOR_COSTAS, CONJUNTVIT, ARTRITE, ARTRALGIA, | |
| PETEQUIA_N, DOR_RETRO, DIABETES, HIPERTENSA, | |
| ACIDO_PEPT, AUTO_IMUNE, DIAS | |
| Xgboost | NU_IDADE_N, CS_RACA, CS_ZONA, FEBRE, MIALGIA, CEFALEIA, |
| EXANTEMA, VOMITO, NAUSEA, DOR_COSTAS, CONJUNTVIT, ARTRITE, ARTRALGIA, PETEQUIA_N, DOR_RETRO, DIABETES, HEMATOLOG, HIPERTENSA, ACIDO_PEPT, DIAS | |
| KNN | CS_GESTANT, CS_RACA, CS_ZONA, FEBRE, MIALGIA, CEFALEIA, |
| VOMITO, NAUSEA, DOR_COSTAS, CONJUNTVIT, ARTRITE, ARTRALGIA, PETEQUIA_N, LACO, DOR_RETRO, DIABETES, HEMATOLOG, HIPERTENSA, ACIDO_PEPT | |
| MLP | CS_SEXO, CS_RACA, FEBRE, MIALGIA, CEFALEIA, EXANTEMA, VOMITO NAUSEA, ARTRALGIA, PETEQUIA_N, LACO, DOR_RETRO, DIABETES, HEMATOLOG, HEPATOPAT |
| NB | CS_RACA, CS_ZONA, FEBRE, MIALGIA, EXANTEMA, NAUSEA, ARTRALGIA, LACO, DOR_RETRO, ACIDO_PEPT |
Attributes select by the SFA techniques for each model.
The model that best performed was the Xgboost model, using the SFFS technique with 20 attributes (the largest subset size in this experiment), eta = 0.3 and max_depth = 2, which obtained 62.3% accuracy. On the other hand, the KNN model with 19 attributes, selected by the SBS technique, metric = euclidian, n_neighbors = 2 and weights = uniform, was the worst model in the grid search, with 57.39% accuracy.
3.2 Evaluation of Models
Table 6 presents the results of accuracy and macro medians from recall, precision and F1-score. The GBM model outperformed all the models. It is interesting to note that the MLP model showed poor performance in comparison with the result it presented in the grid search. This difference may indicate that the MLP model failed to generalize the data during training and underfitting probably occurred and, as consequence, the MLP model did not performed well when using the test set.
Table 6
| Model | Accuracy | Recall | Precision | F1-score |
|---|---|---|---|---|
| Adaboost | 0.5879 | 0.5903 | 0.5837 | 0.5782 |
| RF | 0.6011 | 0.6033 | 0.5965 | 0.5949 |
| GBM | 0.6240 | 0.6257 | 0.6205 | 0.6196 |
| Xgboost | 0.6153 | 0.6173 | 0.6116 | 0.6093 |
| KNN | 0.5411 | 0.5410 | 0.5519 | 0.5222 |
| MLP | 0.5380 | 0.5424 | 0.5569 | 0.4967 |
| NB | 0.5798 | 0.5833 | 0.5782 | 0.5704 |
The result from accuracy and macro median of recall, precision, and F1-score.
In bold: These were the results that stood out, i.e., the highest value of each metric.
The results of the CHIKUNGUNYA class are presented in Table 7. This class obtained the highest results, achieving more than 80% recall in KNN and MLP, although, those same models demonstrated the lowest values of precision. The other models had a better balance between these two metrics. For the F1-score metric, the situation is very similar, with the only difference being that the MLP outperformed the NB. In general, the GBM model obtained the best results.
Table 7
| Model | Recall | Precision | F1-score |
|---|---|---|---|
| Adaboost | 0.7992 | 0.6045 | 0.6884 |
| RF | 0.7667 | 0.6360 | 0.6943 |
| GBM | 0.7787 | 0.6561 | 0.7122 |
| Xgboost | 0.7881 | 0.6382 | 0.7053 |
| KNN | 0.8396 | 0.5365 | 0.6546 |
| MLP | 0.8100 | 0.5902 | 0.6745 |
| NB | 0.7190 | 0.6272 | 0.6699 |
The result from recall, precision, and F1-score for CHIKUNGUNYA class.
In bold: These were the results that stood out, i.e., the highest value of each metric.
The results for DENGUE class are presented in Table 8. Recall values were below 50% for all models, which were the lowest values. The results of the precision and F1-score were not much better either, i.e., below 60%. Overall, the GBM model obtained the best results again.
Table 8
| Model | Recall | Precision | F1-score |
|---|---|---|---|
| Adaboost | 0.4020 | 0.5582 | 0.4674 |
| RF | 0.4355 | 0.5638 | 0.4919 |
| GBM | 0.4870 | 0.5949 | 0.5356 |
| Xgboost | 0.4589 | 0.5842 | 0.5140 |
| KNN | 0.4352 | 0.5033 | 0.4668 |
| MLP | 0.2202 | 0.4843 | 0.2902 |
| NB | 0.3637 | 0.5642 | 0.4423 |
The result from recall, precision, and F1-score for DENGUE class.
In bold: These were the results that stood out, i.e., the highest value of each metric.
Table 9 presents the results of recall, precision and F1-score for the OTHERS class. Results were similar and were around 60%, with the exception of the KNN model, which had a considerable drop in recall (34.83%), and the MLP and NB models, which also showed poor performance regarding the precision metric (51.49% and 54.32%, respectively). In this class, none of the models stood out, and GBM, Xgboost and NB models obtained the best values for recall, precision, and F1-score, respectively. GBM and Xgboost model were considered the best for classifying this class.
Table 9
| Model | Recall | Precision | F1-score |
|---|---|---|---|
| Adaboost | 0.5695 | 0.5882 | 0.5787 |
| RF | 0.6085 | 0.5881 | 0.5982 |
| GBM | 0.6115 | 0.6104 | 0.6110 |
| Xgboost | 0.6049 | 0.6123 | 0.6086 |
| KNN | 0.3483 | 0.6161 | 0.4450 |
| MLP | 0.6463 | 0.5149 | 0.5714 |
| NB | 0.6673 | 0.5432 | 0.5989 |
The result from recall, precision, and F1-score for OTHERS class.
In bold: These were the results that stood out, i.e., the highest value of each metric.
3.2.1 Specialist Evaluation
The specialists analysed the attributes used in the GBM model, called GBM-SFA, and requested the removal of four attributes: CS_RACA, CS_ZONA, ACIDO_PEPT and AUTO_IMUNE. As a result, the remaining attributes (Table 10) were used as input for training a new GBM model, called GBM-Specialist. In order to achieve maximum performance, another grid search was executed, with the same GBM hyperparameters that are presented in Table 2. The best configuration for hyperparameters was max_pedth = 5, higher than the GBM-SFA, and n_estimators = 100 half the GBM-SFA, with a validation accuracy of 60.15%.
Table 10
| Attribute | Description |
|---|---|
| FEBRE | Symptom - Fever |
| MIALGIA | Symptom - Myalgia |
| CEFALEIA | Symptom - Headache |
| EXANTEMA | Symptom - Rash |
| NAUSEA | Symptom - Nausea |
| DOR_COSTAS | Symptom - Back Pain |
| CONJUNTVIT | Symptom - Conjunctivitis |
| ARTRITE | Symptom - Arthritis |
| ARTRALGIA | Symptom - Arthralgia |
| PETEQUIA_N | Symptom - Petechiae |
| DOR_RETRO | Symptom - Eye pain |
| DIABETES | Pre-existing disease - Diabetes |
| HIPERTENSA | Pre-existing disease - Hypertension |
| DIAS | Days that the patient is feeling the symptoms |
Attributes selected by the specialist.
In bold: These were the results that stood out, i.e., the highest value of each metric.
Table 11 shows the results of all metrics for the GBM-SFA and GBM-Specialist models. The GBM-SFA presented the best performance for all metrics, except in the precision of the DENGUE class, though with only a very small difference.
Table 11
| Classes | Metrics | GBM-SFA | GBM-Specialist |
|---|---|---|---|
| Macro | Accuracy | 0.6240 | 0.6075 |
| Recall | 0.6257 | 0.6094 | |
| Precision | 0.6205 | 0.6053 | |
| F1-score | 0.6196 | 0.6021 | |
| DENGUE | Recall | 0.4870 | 0.4600 |
| Precision | 0.5949 | 0.5993 | |
| F1-score | 0.5356 | 0.5204 | |
| CHIKUNGUNYA | Recall | 0.7787 | 0.7658 |
| Precision | 0.6561 | 0.6313 | |
| F1-score | 0.7122 | 0.6921 | |
| OTHERS | Recall | 0.6115 | 0.6025 |
| Precision | 0.6104 | 0.5860 | |
| F1-score | 0.6110 | 0.5941 |
Comparison between the GBM model with SFA attributes and GBM model with specialist attributes.
In bold: These were the results that stood out, i.e., the highest value of each metric.
3.3 Discussions
The grid search results did not present a large variation, ranging from 57% to 62% accuracy. In addition, none of the models presented accuracy above 70%, which shows the difficulty involved in classifying arboviral diseases using only clinical and socio-demographic data.
It was possible to observe that the DENGUE class was the class with the lowest performance, thus highlighting the difficulty in classifying this disease with the data used. However, there are some reasons that may explain this: (a) the classification is a multi-class task, which makes it difficult to generalize the three classes;(b) the applying of the undersampling technique to balance the data may also have affected the DENGUE class, as at the end of the pre-processing there were almost 18,000 Dengue registers that could have been used, but this number had to be reduced to almost 6,000 due to the low amount of Chikungunya registers; (c) lack of laboratory attributes often associated to Dengue such as leucocyte count, haematocrit or thrombocytes.
Any model intended to predict Dengue would need to be applied earlier in the illness to identify who must be closely monitored for plasma leakage (24). Although, in early phases, Dengue is often indistinguishable from other arboviral diseases (25). Using only clinical and socio-demographic data, as proposed in our work, may be a limitation in Dengue diagnosis. However, in remote areas that lack human and laboratory resources, the models can play an essential role in surveillance by identifying possible epidemics.
The OTHERS class performed a little better than the DENGUE class, but still showed weak performance. In this case, the great diversification may be the main cause, as this class includes all patients who were admitted with a suspected case of arbovirus, but were classified as inconclusive and discarded, so here the patients may include a wide variety of diseases.
The CHIKUNGUNYA class presented the best results in this work, principally in regards to the recall metric, with over 80%. These results show that, besides the difficulty, it is possible to make a good classification using only clinical and socio-demographic data. As such, our models can be used as a low-cost and rapid alternative, which would be useful in a resource-limited scenario (10). Note that arthralgia is considered a very common presentation in Chikungunya fever. Together with high fever, it has a specificity of 99.6% and a positive predictive value of 84.6% for infection classification. Since other arboviruses infections such as ZIKV, DENV and other alphaviruses also present with arthralgia, the epidemiological scenario must be considered before classifying every case as CHIKV infection based only on this symptom (26).
The tree-based models (Adaboost, RF, GBM and Xgboost) presented the best overall results. Tree-based models are generally the best models for problems that use tabular data. The MLP model presented the worst results, and a drop in performance was observed compared to training with grid search, thus indicating a possible underfitting.
The GBM model obtained the best results, and its attributes were analysed by the specialists and a new GBM model was designed. Despite obtaining slightly inferior results, it did have better interpretability for physicians and these results show that the GBM-SFA model is the most accurate model. On the order hand, the GBM-Specialist model is more interpretable and consequently would be more accepted for use by physicians. According to Ozaydin et al. (2021), “interpretability and accuracy may often have to be sacrificed for each other” (27). It is useless for a model to be precise if physicians cannot use it daily because they do not trust the model or do not understand the attributes used, for example. In this sense, the GBM-Specialist has a big advantage over the GBM-SFA model and, despite achieving lower performance, the difference in results is around 2% for each metric.
Although multi-class classification better represents real-world problems, most classification techniques are focused on binary classification (28). This happens, among other factors, due to the high complexity of training a model to be able to generalize more than two classes. This greater complexity contributes to multi-class models having lower performance when compared to binary models.
As future work, we plan to make an ensemble of two binary models, one trained to classify Dengue and another trained to classify Chikungunya. In this way, we can use more data from Dengue notifications, and we believe that with more data for training it is possible to improve the results of the DENGUE class.
4 Conclusions
Arboviruses are diseases that have similar symptoms, which makes it difficult to make decisions regarding their treatment. For this reason, the correct classification of arboviral diseases when the patient arrives for treatment becomes a very useful tool in the daily life of hospitals. To help solve this problem, ML models were proposed for multi-class classification of Dengue, Chikungunya, and other common illnesses in Brazil, using only clinical and socio-demographic data.
In this work, seven ML models were evaluated: Adaboost, RF, GBM, Xgboost, KNN, MLP and NB. A grid search was executed for each model along with a SFA technique for optimization of the hyperparameters and attribute selection. The tree-based models (Adaboost, RF, GBM and Xgboost) presented the best overall results. The MLP model presented the worst results, and a drop in performance was observed compared to training with grid search, indicating a possible underfitting. The GBM model, named GBM-SFA, obtained the best results and its attributes were analysed by the specialists and a new GBM model was designed and named the GBM-specialist model.
When comparing the metrics of the GBM-SFA and GBM-specialist models for classification of both classes, the GBM-SFA outperformed the GBM-specialist model, showing that despite professionals being specialists in the field of infectious diseases, the difficulty and limitations of human clinical diagnosis of these arboviruses is real, as the signs and symptoms are very similar and arboviruses circulate concomitantly in Brazil (29–31).
The models evaluated in this work showed high sensitivity rates in relation to the CHIKUNGUNYA class. However, more sensitive ML models could aid in the identification and classification of arbovirus cases, and provide clinicians with a diagnostic tool based on real data that would complement clinical judgment, as well as being an effective surveillance tool in a pre-epidemic period. More specific models should be explored to identify laboratory-confirmed arbovirus cases during peak and post-peak periods, as the number of cases increases dramatically during these periods (17).
Our results showed that, in addition to the difficulty, it is possible to make a good classification using only clinical and socio-demographic data. Our models can be used as a low-cost and quick alternative, and would be useful in a scenario of limited resources in which only information from the patient that is obtained at the health unit is available.
Funding
VS has a grant (062.00249/2020 [EDITAL N. 006/2019 - UNIVERSAL AMAZONAS]) from Fundação de Amparo à Pesquisa do Estado do Amazonas (FAPEAM) (http://www.fapeam.am.gov.br/). The sponsor had no role in the study design, data collection and analysis, decision to publish, or preparation of the manuscript.
Publisher’s Note
All claims expressed in this article are solely those of the authors and do not necessarily represent those of their affiliated organizations, or those of the publisher, the editors and the reviewers. Any product that may be evaluated in this article, or claim that may be made by its manufacturer, is not guaranteed or endorsed by the publisher.
Statements
Data availability statement
Publicly available datasets were analyzed in this study. This data can be found here: https://data.mendeley.com/datasets/bv26kznkjs/1.
Ethics statement
All methods were performed in accordance with the Brazilian regulations that do not require consent for studies using unidentified data from the Brazilian data health systems.
Author contributions
TT, SN, IT, and PE conceived the methodology and the design of the experiments of the work. TT, SN, and IT performed to the pre-processing of the data set and the experiments with the ML models. SO, MA, and VS performed the statistical analysis. PE analysed the experiments and the statistical analysis. SO, MA, and VS acted as health specialists. All authors contributed to the writing and review of the manuscript, read and approved the submitted version.
Acknowledgments
The authors would like to thank Conselho Nacional de Desenvolvimento Científico e Tecnológico (CNPq); Fundação de Amparo à Pesquisa do Estado do Amazonas (FAPEAM); Fundação de Vigilância em Saúde Dra. Rosemary Costa Pinto; Fundação de Amparo a Ciência e Tecnologia do Estado de Pernambuco (FACEPE); and Universidade de Pernambuco (UPE), an entity of the Government of the State of Pernambuco focused on the promotion of Teaching, Research and Extension.
Conflict of interest
The authors declare that the research was conducted in the absence of any commercial or financial relationships that could be construed as a potential conflict of interest.
Supplementary material
The Supplementary Material for this article can be found online at: https://www.frontiersin.org/articles/10.3389/fitd.2021.769968/full#supplementary-material
Footnotes
1.^ http://www.agenda2030.com.br
2.^ https://www3.paho.org/data/index.php/es/temas/indicadores-dengue.html, accessed Nov 11, 2020
3.^ https://www3.paho.org/data/index.php/es/temas/chikv-es.html, accessed Nov 11, 2020
4.^ https://aps.bvs.br/aps/qual-a-especificidade-e-sensibilidade-do-teste-rapido-da-dengue-e-que-tipos-existem/
5.^ http://portalsinan.saude.gov.br/
6.^ https://scikit-learn.org/stable/modules/generated/sklearn.model_selection.GridSearchCV.html
7.^ https://scikit-learn.org/stable/modules/generated/sklearn.ensemble.AdaBoostClassifier.html
8.^ https://scikit-learn.org/stable/modules/generated/sklearn.ensemble.RandomForestClassifier.html
9.^ https://scikit-learn.org/stable/modules/generated/sklearn.ensemble.GradientBoostingClassifier.html
10.^ https://scikit-learn.org/stable/modules/generated/sklearn.ensemble.GradientBoostingClassifier.html
11.^ https://scikit-learn.org/stable/modules/generated/sklearn.neighbors.KNeighborsClassifier.html
12.^ https://scikit-learn.org/stable/modules/generated/sklearn.neural_network.MLPClassifier.html
13.^ https://scikit-learn.org/stable/modules/generated/sklearn.naive_bayes.GaussianNB.html
References
1
Lopes N Nozawa C Linhares REC . Características Gerais E Epidemiologia Dos Arbovírus Emergentes No Brasil. Rev Pan-Amazônica Saúde (2014) 5:10–0. doi: 10.5123/S2176-62232014000300007
2
Lima-Camara TN . Emerging Arboviruses and Public Health Challenges in Brazil. Rev Saude Publica (2016) 50:36. doi: 10.1590/S1518-8787.2016050006791
3
Kikuti M Tauro LB Moreira PS Nascimento LCJ Portilho MM Soares GC et al . Evaluation of Two Commercially Available Chikungunya Virus Igm Enzyme-Linked Immunoassays (Elisa) in a Setting of Concomitant Transmission of Chikungunya, Dengue and Zika Viruses. Int J Infect Dis (2020) 91:38–43. doi: 10.1016/j.ijid.2019.11.001
4
Figueiredo LTM . Emergent Arboviruses in Brazil. Rev da Sociedade Bras Med Trop (2007) 40:224–9. doi: 10.1590/S0037-86822007000200016
5
Bulbul HI Unsal Ö . Comparison of Classification Techniques Used in Machine Learning as Applied on Vocational Guidance Data. In: 2011 10th International Conference on Machine Learning and Applications and Workshops, vol. 2. Ankara, Turkey: IEEE (2011). p. 298–301.
6
Fahmi A Purwitasari D Sumpeno S Purnomo MH . Performance Evaluation of Classifiers for Predicting Infection Cases of Dengue Virus Based on Clinical Diagnosis Criteria. In: 2020 International Electronics Symposium (IES). Surabaya, Indonesia: IEEE (2020). p. 456–62.
7
Thitiprayoonwongse D Suriyaphol P Soonthornphisaj N . Data Mining of Dengue Infection Using Decision Tree. Entropy (2012) 2:2.
8
Hossain MS Sultana Z Nahar L Andersson K . An Intelligent System to Diagnose Chikungunya Under Uncertainty. J Wireless Mobile Netw Ubiquitous Comput Dependable Appl (2019) 10:37–54. doi: 10.22667/JOWUA.2019.06.30.037
9
Veiga RV Schuler-Faccini L França GV Andrade RF Teixeira MG Costa LC et al . Classification Algorithm for Congenital Zika Syndrome: Characterizations, Diagnosis and Validation. Sci Rep (2021) 11:1–7. doi: 10.1038/s41598-021-86361-5
10
Lee VJ Chow A Zheng X Carrasco LR Cook AR Lye DC et al . Simple Clinical and Laboratory Predictors of Chikungunya Versus Dengue Infections in Adults. PloS Negl Trop Dis (2012) 6:e1786. doi: 10.1371/journal.pntd.0001786
11
Miao J Niu L . A Survey on Feature Selection. Proc Comput Sci (2016) 91:919–26. doi: 10.1016/j.procs.2016.07.111
12
Suto J Oniga S Sitar PP . Comparison of Wrapper and Filter Feature Selection Algorithms on Human Activity Recognition. In: 2016 6th International Conference on Computers Communications and Control (ICCCC). Oradea, Romania: IEEE (2016). p. 124–9.
13
Bergstra J Bengio Y . Random Search for Hyper-Parameter Optimization. J Mach Learn Res (2012) 13:281–305.
14
Xie J Yu FR Huang T Xie R Liu J Wang C et al . A Survey of Machine Learning Techniques Applied to Software Defined Networking (Sdn): Research Issues and Challenges. IEEE Commun Surveys Tutorials (2018) 21:393–430. doi: 10.1109/COMST.2018.2866942
15
Potts JA Gibbons RV Rothman AL Srikiatkhachorn A Thomas SJ Supradish P et al . Prediction of Dengue Disease Severity Among Pediatric Thai Patients Using Early Clinical Laboratory Indicators. PloS Negl Trop Dis (2010) 4:e769. doi: 10.1371/journal.pntd.0000769
16
Gambhir S Malik SK Kumar Y . The Diagnosis of Dengue Disease: An Evaluation of Three Machine Learning Approaches. Int J Healthcare Inf Syst Inf (IJHISI) (2018) 13:1–19. doi: 10.4018/IJHISI.2018070101
17
Ho TS Weng TC Wang JD Han HC Cheng HC Yang CC et al . Comparing Machine Learning With Case-Control Models to Identify Confirmed Dengue Cases. PloS Neglected Trop Dis (2020) 14:e0008843. doi: 10.1371/journal.pntd.0008843
18
Faisal T Ibrahim F Taib MN . A Noninvasive Intelligent Approach for Predicting the Risk in Dengue Patients. Expert Syst Appl (2010) 37:2175–81. doi: 10.1016/j.eswa.2009.07.060
19
Department RH . Cases of Dengue, Zika and Chikungunya. (2011). Available at: http://dados.recife.pe.gov.br/dataset/casos-de-dengue-zika-e-chikungunya.
20
Prusa J Khoshgoftaar TM Dittman DJ Napolitano A . Using Random Undersampling to Alleviate Class Imbalance on Tweet Sentiment Data. In: 2015 IEEE International Conference on Information Reuse and Integration. San Francisco, USA: IEEE (2015). p. 197–202.
21
Tabosa T Neto SS Teixeira I Oliveira S Rodrigues MG Sampaio V et al . Clinical Cases of Dengue and Chikungunya. (2021). doi: 10.17632/bv26kznkjs.1
22
Berrar D . Cross-Validation. In: RanganathanSGribskovMNakaiKSchönbachC, editors. Encyclopedia of Bioinformatics and Computational Biology. Oxford: Academic Press (2019). p. 542–5. doi: 10.1016/B978-0-12-809633-8.20349-X
23
Kavitha V Chetan H . Performance Dependency of Facial Emotion Recognition System on Dropout and Learning Rate. In: 2020 3rd International Conference on Intelligent Sustainable Systems (ICISS). Thoothukudi, India: IEEE (2020). p. 71–81.
24
Potts JA Rothman AL . Clinical and Laboratory Features That Distinguish Dengue From Other Febrile Illnesses in Endemic Populations. Trop Med Int Health (2008) 13:1328–40. doi: 10.1111/j.1365-3156.2008.02151.x
25
Organization WH, for Research SP, in Tropical Diseases T, of Control of Neglected Tropical Diseases WHOD, Epidemic WHO, Alert P . Dengue: Guidelines for Diagnosis, Treatment, Prevention and Control. Geneva, Switzerland: World Health Organization (2009).
26
Goupil BA Mores CN . A Review of Chikungunya Virus-Induced Arthralgia: Clinical Manifestations, Therapeutics, and Pathogenesis. Open Rheumatol J (2016) 10:129. doi: 10.2174/1874312901610010129
27
Ozaydin B Berner ES Cimino JJ . Appropriate Use of Machine Learning in Healthcare. Intelligence-Based Med (2021) 5:100041. doi: 10.1016/j.ibmed.2021.100041
28
Cruz EAS Franco CHE . Challenges of Multivariable and Multiclass Classification Problems. (2013). Available at: https://www.udi.edu.co/congreso/historial/congreso_2016/ponencias/Ingenieria_Electronica/Challenges_of_multivariable_and_multiclass.pdf.
29
Paixão ES Teixeira MG Rodrigues LC . Zika, Chikungunya and Dengue: The Causes and Threats of New and Re-Emerging Arboviral Diseases. BMJ Global Health (2018) 3:e000530. doi: 10.1136/bmjgh-2017-00053
30
Donalisio MR Freitas ARR Zuben APBV . Arboviroses Emergentes No Brasil: Desafios Para a Clínica E Implicações Para a Saúde Pública. Rev Saúde Pública (2017) 51. doi: 10.1590/S1518-8787.2017051006889
31
Vasconcelos PF Calisher CH . Emergence of Human Arboviral Diseases in the Americas, 2000–2016. Vector-Borne Zoonotic Dis (2016) 16:295–301. doi: 10.1089/vbz.2016.1952
Summary
Keywords
arboviral diseases, neglected tropical disease (NTD), machine learning, multi-class classification, dengue (DENV), Chikungunya (CHIKV)
Citation
Tabosa de Oliveira T, da Silva Neto SR, Teixeira IV, Aguiar de Oliveira SB, de Almeida Rodrigues MG, Sampaio VS and Endo PT (2022) A Comparative Study of Machine Learning Techniques for Multi-Class Classification of Arboviral Diseases. Front. Trop. Dis 2:769968. doi: 10.3389/fitd.2021.769968
Received
02 September 2021
Accepted
29 December 2021
Published
18 February 2022
Volume
2 - 2021
Edited by
Manoel Barral-Netto, Gonçalo Moniz Institute (IGM), Brazil
Reviewed by
Rajnikant Dixit, National Institute of Malaria Research (ICMR), India; Ricardo Khouri, Oswaldo Cruz Foundation (Fiocruz), Brazil
Updates
Copyright
© 2022 Tabosa de Oliveira, da Silva Neto, Teixeira, Aguiar de Oliveira, de Almeida Rodrigues, Sampaio and Endo.
This is an open-access article distributed under the terms of the Creative Commons Attribution License (CC BY). The use, distribution or reproduction in other forums is permitted, provided the original author(s) and the copyright owner(s) are credited and that the original publication in this journal is cited, in accordance with accepted academic practice. No use, distribution or reproduction is permitted which does not comply with these terms.
*Correspondence: Patricia Takako Endo, patricia.endo@upe.br
This article was submitted to Major Tropical Diseases, a section of the journal Frontiers in Tropical Diseases
Disclaimer
All claims expressed in this article are solely those of the authors and do not necessarily represent those of their affiliated organizations, or those of the publisher, the editors and the reviewers. Any product that may be evaluated in this article or claim that may be made by its manufacturer is not guaranteed or endorsed by the publisher.